ELECTRON BEAM MEASUREMENTS OF DENSITY Thesis by...
69
ELECTRON BEAM MEASUREMENTS OF DENSITY IN SHOCK WAVES REFLECTING FROM A COLD WALL Thesis by Hugo de Oliveira Piva In Partial FulfiElpent of the Requirements For the Degree of Doctor of Philosophy California Institute of Technology Pasadena, California 1968 (Submitted May 17, 1968)
Transcript of ELECTRON BEAM MEASUREMENTS OF DENSITY Thesis by...

ELECTRON BEAM MEASUREMENTS OF DENSITY
IN SHOCK WAVES REFLECTING FROM A COLD WALL
Thesis by
Hugo de Oliveira Piva
In Partial FulfiElpent of the Requirements
For the Degree of
Doctor of Philosophy
California Institute of Technology
Pasadena, California
1968
(Submitted May 17, 1968)

ACKNOWLEDGMENTS
The author wishes t o express h i s s i n c e r e apprec ia t ion
t o Professor Bradford S tu r t evan t f o r h i s guidance and very
h e l p f u l sugges t ions throughout t h e experiments and dur ing
t h e a n a l y s i s of t h e r e s u l t s . The author is a l s o very
thankfu l t o Professor Hans W. Liepmann f o r h i s encourage-
ment i n t h e e a r l y p a r t of t h e experimental work, when
g r e a t d i f f i c u l t i e s were encountered. Professor Anatol
Roshko deserves very s p e c i a l g r a t i t u d e f o r h i s a s s i s t a n c e
wi th bo th academic and non-academic m a t t e r s which made it
p o s s i b l e f o r t h e author and h i s family t o enjoy a much
happier l i f e i n t h i s country dur ing t h e y e a r s of graduate
work.
I t i s a p leasure t o thank Mrs. Geraldine Kren t l e r f o r
typing t h e manuser i p t
The author is indebted t o t h e B r a z i l i a n A i r Force and
Conselho Nacional de Pesquisas ( B r a z i l ) f o r t h e i r f i n a n c i a l
support . The GAECPT 17-in shock tube and t h e electron-beam
densi tometer w e r e b u i l t under previous NASA c o n t r a c t s .

iii
ABSTRACT
The normal shock wave is a r a re f i ed -gas flow i n which
l a r g e d e p a r t u r e s from thermodynamic equ i l ib r ium and s t r o n g
n o n - l i n e a r i t i e s occur and it is t h e s imples t such flow due
t o i t s one-dimensionality and t h e absence of s o l i d bound-
a r i e s . Because of t h i s , bo th t h e o r e t i c a l and experimental
s t u d i e s of t h e s t r u c t u r e of normal shock waves have been
used s u c c e s s f u l l y i n r e c e n t y e a r s t o g e t a b e t t e r under-
s t and ing of such phenomena. The p resen t work i s an exten-
s i o n of t h e e a r l i e r s t u d i e s t o t h e more complicated problem
of shock-wave r e f l e c t i o n . The d e n s i t y d i s t r i b u t i o n of a
normal shock wave i n argon i s measured dur ing i t s r e f l e c t i o n
from a heat-conducting wa l l us ing an e l e c t r o n beam densitom-
e t e r i n t h e GALCIT 17-in diameter shock tube a t inc iden t
Mach nunibers 6.00, 4.00 and 2.96.
During each run a d e n s i t y h i s t o r y i s obtained a t a
c e r t a i n d i s t a n c e from t h e wa l l by measuring electron-beam
c u r r e n t a s a func t ion of time. By d e f i n i n g a c o n s i s t e n t
ze ro of t ime f o r a l l runs a t t h e same cond i t ions , t h e s e
h i s t o r i e s a r e converted by a c ross-p lo t t o f a m i l i e s of
d e n s i t y p r o f i l e s a t d i f f e r e n t t imes. x- t diagrams a r e
obtained from t h e d e n s i t y h i s t o r y p l o t s , and a wal l-densi ty
h i s t o r y is obtained from t h e d e n s i t y p r o f i l e s . Measured
i n terms of t h e i d e a l cond i t ions behind t h e i n c i d e n t shock
wave, t h e d i s t a n c e s extend from 0.25 t o 56 mean f r e e pa ths

from t h e w a l l and t h e t imes t o 160 mean c o l l i s i o n t imes
a f t e r t h e beginning of t h e r e f l e c t i o n .
The r e s u l t s presented he re g ive bo th q u a n t i t a t i v e
and q u a l i t a t i v e information about t h e i n t e r a c t i o n of t h e
inc iden t shock wave with t h e w a l l , t h e e f f e c t s of t h e wa l l
h e a t t r a n s f e r and accommodation on t h e d e n s i t y near t h e ,
w a l l , t h e formation of t h e r e f l e c t e d shock wave, i t s
s t r e n g t h and t r a j e c t o r y on t h e x- t diagram, and t h e n a t u r e
of t h e flow f i e l d l y i n g between t h e thermal l a y e r and t h e
r e f l e c t e d shock wave a t l a r g e t imes.
PART
v
TABLE OF CONTENTS
TITLE
Acknowledgments
Abs t rac t
Table of Contents
L i s t of F igures
I. In t roduc t ion
11. Experimental Technique
2.1 Descr ip t ion of t h e Equipment
2.2 Density Measurement
2.3 Experimental Procedure
2.3.1 Descr ip t ion of t h e Procedure
2.3.2 C a l i b r a t i o n cons tan t k
2.3.3 Data Reduction
2.4 Error Estimate
111. Resu l t s
PAGE
ii
iii
v
v i i
3.1 Density H i s t o r i e s 18
3.2 Density P r o f i l e s 20
3.3 x- t Diagram 22
3.4 Wall Density His tory 23
3.5 Densi ty P r o f i l e s s f t h e Inc iden t Shock Wave 24
IV, Discussion
4.1 Densi ty P r o f i l e s
4.2 x- t Diagram
TABLE OF CONTENTS ( c o n t . )
PART TITLE
4 . 3 Wall D e n s i t y H i s t o r y
V. C o n c l u s i o n s
R e f e r e n c e s
T a b l e of A v e r a g e V a l u e s
F i g u r e s
PAGE
29

LIST OF FIGURES
1. Schematic of the apparatus
2. Current traces - Run No. 2916 - 12 mm 3. Current traces - Run No. 2813 - 4 mm
4. Density trace - Run No. 2915 - 9 mm
5. Density trace - Run No. 2913 - 4 mm
Density history: M = 6: pl = 15 pHg
Density history: M = 6: pl = 35 pHg
Density history: M = 4: pl = 50 pHg
Density history: M = 4; pl = 15 pHg
- 50 pHg Density history: M = 3; pl - Density profiles (X): M = 6, pl = 15 pHg
Density profiles (X): M = 6: pl = 35 pHg
Density profiles (X): M = 4; pl = 50 pHg
Density profiles (X): M = 4; pl = 15 pHg
Density profiles (X): M = 3; pl = 50 pHg
Density profiles (stretched abscissa $ ) : M = 6; p1 = 15 pHg
Density profiles (stretched abscissa $ ) : M = 6; p1 = 35 pHg
Density profiles (stretched abscissa $ ) : M = 4: pl = 50 pHg
Density profiles (stretched abscissa $ ) : M = 4; p1 = 15 pHg
Density profiles (stretched abscissa $ ) : M = 3; p1 = 50 p.Hg
x-t diagram - M = 6
PAGE
35
36
37
38
39
40
41
42
43
44
45
46
47
48
49

v i i i
LIST OF FIGURES (cont . )
22. x- t diagram - M = 4
23. x- t diagram - M = 3
24. Wall d e n s i t y h i s t o r y
25. I n c i d e n t shock wave - M = 6
26. Inc iden t shock wave - M = 4
27. Inc iden t shock wave - M = 3
PAGE
56
57
58
59
60
61

I. INTRODUCTION
The normal shock wave is a rarefied-gas flow in which
large departures from thermodynamic equilibrium and strong
non-linearities occur, and it is the simplest such flow due
to its one-dimensionality and the absence of solid bound-
aries. In view of the present state of understanding of
gas-solid interactions, choice of a flow with no solid
boundaries has, until now, been necessary in order that
the effects of large departures from equilibrium and non-
linearities could be studied. In this case the analysis of
the experimental results is much easier, and by avoiding
hypothetic boundary conditions, the theoretical treatment
becomes more realistic. Furthermore, one-dimensional
normal shock waves can be accurately produced in the labora-
tory.
Motivated by the above reasons, much experimental and
theoretical work has been done on the structure of normal
shock waves in the past few years (e .g., Refs. 1 through 6) . As a result of such work important information concerning
the behavior of gases when departures from thermodynamic
equilibrium are large were obtained, and various theoretical
predictions were tested with the experimental data.
The study of the reflection of a normal shock wave
from a solid, heat-conducting wall perpendicular to the flow
direction is a natural extension of the earlier work to the

more complex problem i n which t h e e f f e c t s of gas-so l id
i n t e r a c t i o n s , o r accommodation e f f e c t s , a r e a l s o important.
The p resen t work is an i n v e s t i g a t i o n of t h e d e n s i t y d i s t r i -
b u t i o n of a normal shock wave i n argon dur ing i t s r e f l e c t i o n
from a wa l l us ing an electron-beam densi tometer . The wa l l
i s perpendicular t o t h e flow d i r e c t i o n t o keep t h e problem
one-dimensional and t o s impl i fy t h e v e l o c i t y boundary con-
d i t i o n s ( z e r o v e l o c i t y a t t h e wa l l ) f o r comparison wi th
t h e o r e t i c a l s t u d i e s . I t has t o be heat-conducting f o r
p r a c t i c a l reasons and t h i s t u r n s ou t t o be a d e s i r a b l e
f e a t u r e which emphasizes accommodation e f f e c t s . The con-
venience of us ing d e n s i t y a s t h e p r i n c i p a l v a r i a b l e w i l l
become apparent l a t e r .
During t h e r e f l e c t i o n of a shock wave from a heat-
conducting w a l l , t h r e e e f f e c t s a r e of g r e a t importance:
1) t h e temperature d i s t r i b u t i o n near t h e wa l l ; 2 ) formation
of t h e r e f l e c t e d shock and i t s propagation away from t h e
w a l l ; 3 ) t h e n a t u r e of t h e flow between t h e shock wave and
t h e thermal l a y e r formed near t h e wa l l due t o h e a t t r a n s f e r .
1) A shock wave r e f l e c t i n g from an i n s u l a t i n g wa l l
h e a t s t h e gas between t h e shock and t h e wa l l t o very high
temperatures . I f t h e wa l l is heat-conducting it a c t s l i k e
a h e a t s i n k , cool ing down t h e gas i n i t s v i c i n i t y , bu t t h e
poor hea t -conduct iv i ty of t h e gas r e s t r i c t s t h i s d i r e c t
in f luence of t h e wa l l t o a very t h i n region , i . e . , t h e
lower temperatures a r e confined t o a t h i n l a y e r near t h e

wall which grows by diffusion into the rest of the fluid
(its thickness increases with the square root of time).
The density is higher in this growing thermal layer, and
both temperature and density gradients are very steep there.
The increasing density requires that mass be supplied, which
induces a displacement velocity toward the wall. Thus, the
requirement of conservation of mass results in convection of
hot gas into the thermal layer, reducing this thickness and,
therefore, increasing even more the temperature and density
gradients, In addition, the temperature of the gas at the
wall (x = O+) is not the same as the temperature of the
wall (x = 8-1 , i.e,, a temperature jump (thermal slip)
occurs at the wall-gas interface, reducing the gradients
in the gas. As the thermal slip cannot be directly
measured, it has to be studied through its effects in the
flow near the wall,
2) The displacement velocity is related to the
growth of the dense thermal Sayer, and the net effect is
equivalent to that caused by a receding wall whose speed,
according to boundary-layer theory, is inversely pro-
portional to the square root of time, The results of the
present experiment indicate that when the incident shock
wave hits the wall, the equivalent "receding wall" is set
into motion with a very high speed, producing an expansion
wave that initially cancels the incoming shock. As the
speed of the receding wall decreases, it sends out com-

compression waves i n t o t h e heated gas. Af ter a s h o r t t ime
t h e s e compression waves coa lesce , forming t h e r e f l e c t e d
shock wave which, i n t u r n becomes s t r o n g e r and f a s t e r a s
more compression waves over take i t , approaching asymptot-
i c a l l y t h e ideal-shock s t r e n g t h .
3 ) The na tu re of t h e flow f i e l d between t h e r e f l e c t e d
shock and t h e thermal l a y e r f o r " l a r g e t imes" ( l a r g e f o r
t h i s experiment) i s dominated mainly by bo th t h e p r e s s u r e
waves emi t ted by t h e thermal l a y e r (" receding w a l l " ) and
t h e entropy jump ac ross t h e shock, The p r e s s u r e is lower
near t h e shock and inc reases toward t h e w a l l , because near
t h e wa l l t h e p ressu re r e s u l t s from p i s t o n motion a t l a t e r
t imes and i s , t h e r e f o r e , more nea r ly t h e i d e a l value. The
entropy i s h igher near t h e r e f l e c t e d shock and decreases
toward t h e thermal l a y e r , because i n t h e beginning of t h e
r e f l e c t i o n process t h e f l u i d i s processed by a nea r ly
i s e n t r o p i c r e f l e c t e d wave whereas, l a t e r on, t h e shock
wave is s t r o n g e r and t h e entropy inc rease ac ross it is
l a r g e r . The behavior of bo th p ressu re and entropy has t h e
same e f f e c t on t h e d e n s i t y d i s t r i b u t i o n , i . e . , t h e d e n s i t y
is lower near t h e shock and inc reases toward t h e wa l l .
The p resen t work r e p o r t s measurements of d e n s i t y
p r o f i l e s wi th in t h e r e f l e c t i n g shock l a y e r wi th s u f f i c i e n t
accuracy and r e s o l u t i o n t h a t bo th q u a n t i t a t i v e and qua l i -
t a t i v e information can b e obta ined about t h e i n t e r a c t i o n of
t h e inc iden t shock wave wi th t h e w a l l , about t h e e f f e c t s of

w a l l h e a t t r a n s f e r and accommodation on t h e d e n s i t y near
t h e w a l l , about t h e formation of t h e r e f l e c t e d shock wave
and i t s s t r e n g t h and t r a j e c t o r y on t h e x- t diagram, and
about t h e n a t u r e of t h e flow f i e l d l y i n g between t h e
thermal l a y e r and t h e r e f l e c t e d shock wave a t l a r g e t imes.
A l l of t h e experiments a r e performed i n argon, and
t h e i n c i d e n t shock Mach numbers M and i n i t i a l p ressu res pl
a r e a s follows:
The d i s t a n c e s from t h e wa l l extend from 0.4 mm t o 2 6 mm
( o r , measured i n terms s f cond i t ions behind t h e inc iden t
shock wave, from 8 . 2 5 to 56 mean f r e e pa ths) and t h e t imes
of 130 p s e e (160 co lP i s ion t imes) a f t e r t h e beginning of
t h e r e f l e c t i o n . I t should b e noted t h a t i o n i z a t i o n
r e l a x a t i o n is much slower than t h e s e t ime s c a l e s and,
t h e r e f o r e , i o n i z a t i o n a% t h e h igher Mach numbers does no t
a f f e c t t h e p resen t measurements.

11. EXPERIMENTAL TECHNIQUE
2.1 Descr ip t ion of t h e Equipment
The experiments were performed i n t h e GALCIT 17-in
diameter shock tube descr ibed i n r e fe rence 7. The inc ident -
shock speed is obtained by measuring t h e t ime i n t e r v a l f o r
t h e shock t o pass between two platinum th in - f i lm heat-
t r a n s f e r gauges ( b u i l t by D r . C. Wang and descr ibed i n
Ref. 8) which a r e 500 mm a p a r t and a r e centered about a
p o i n t loca ted 46.6 diameters from t h e diaphragm. The h e a t
gauges t r i g g e r an e l e c t r o n i c counter (Hewlett Packard 5233L),
which g ives t h e time i n t e r v a l i n microseconds. The inc iden t
shock Mach nkmber M i s def ined a s t h e measured speed of t h e
i n c i d e n t shock d iv ided by t h e speed of sound i n t h e i n i t i a l
gas*o
The e l e c t r o n beam densi tometer is t h e same a s t h a t
descr ibed i n r e fe rence 3 , and f i g u r e 1 is a schematic of
t h e equipment. The e l e c t r o n beam i s d i r e c t e d ac ross t h e
* The usua l shock tube n o t a t i o n w i l l be used throughout t h i s r e p o r t and i s t h e following:
Region 1 = undisturbed gas ahead of t h e inc iden t shock wave.
Region 2 = uniform flow behind t h e inc iden t shock wave.
Region 5 = uniform flow behind t h e r e f l e c t e d shock wave.
I n i t i a l p ressu re ( o r temperature, e t c . ) = p r e s s u r e ( o r temperature, e t c . ) i n region 1.
The cond i t ions i n regions 2 and 5 a r e c a l c u l a t e d by t h e Rankine-Hugoniot r e l a t i o n s f o r normal shocks i n an i d e a l gas (Ref, 8) us ing t h e measured va lue of M.

t ube , p a r a l l e l t o t h e end wa l l a t a f ixed l o c a t i o n 48.5
diameters from t h e diaphragm. I t i s produced by a com-
merc ia l t e l e v i s i o n gun (Superior E l e c t r o n i c s S-llOE),
e n t e r s t h e shock tube through an i n j e c t o r needle and i s
c o l l e c t e d by a small Faraday cage. The needle h o l e
diameter is 0.5 mm and t h e maximum beam diameter i s approxi-
mately 0.6 mm. The gap between needle and c o l l e c t o r is
12 em, t h e a c c e l e r a t i n g vo l t age v a r i e s from 15 KV t o 1 8 KV,
and t h e beam c u r r e n t v a r i e s from 100 t o 140 p,A depending
on t h e i n i t i a l p ressu re , However, i n every case bo th
vo l t age and c u r r e n t a r e kep t cons tan t f o r a l l runs a t t h e
same Mach number and i n i t i a l pressure .
A movable p l a t e is used f o r t h e end w a l l , and i t s
p o s i t i o n wi th r e s p e c t t o t h e c e n t e r of t h e beam is exter -
n a l l y ad jus ted , I t i s a 1- in- thick aluminum p l a t e and i ts
r e f l e c t i n g s u r f a c e had been faced and pol i shed i n t h e l a t h e ,
Care has been t'aken t o a s su re t h a t t h e p l a t e is p a r a l l e l t o
t h e e l e c t r o n beam and an i n d i c a t i o n t h a t they a r e i n f a c t
p a r a l l e l is t h a t a mark l e f t by t h e beam on t h e s u r f a c e of
t h e p l a t e i s uniform.

2.2 Density Measurement
When the shock wave passes the measuring station the
increasing gas density causes an increasing fraction of the
electrons to be scattered out of the beam. Therefore, the
current collected by the Faraday cage is a measure of the
average density of the gas between injector and collector
tips, To convert the measured collector current to density
the simple attenuation law,
is assumed (Refs. 2 and 3), where I. is the current
through the injector needle, I is the current measured at
the collector; p is the gas density, and k is the attenua-
tion coefficient. k is a function of the accelerating
voltage, grid and focus voltages in the gun, beam colli-
mation, length of the gas sample and the gas properties
(e,g., collision cross-section) . Thus, it is apparent
that the instrument must be calibrated to obtain the values
of k for the conditions of the experiment.
The calibration constant k can be determined in three
different ways:
a) by a static calibration;
b) since the density in region 1 and the correspond-
ing current (constant current before the arrival of the
incident shock) are always known, then, if the current I.

is measured, k can be computed from equation (1) and each
run becomes self-calibrating;
c) the density in region 2 is also known and, if
the corresponding region can be identified in the current
history, then the calibration constant can be obtained by
equation (3) below, derived from equation (1). Also the
density and current are related to each other and to the
conditions in regions 1 and 2 by the formula:
Or, referring to the conditions at OOC and 1
atmosphere:
p = pressure
T = absolute temperature
The computation of k and the use of the above
formulas will be explained in $2.3.2 and $J 2.3,3.

2.3 ~ x p e r i m e n t a l Procedure
2.3.1 Descr ip t ion of t h e procedure
For i n i t i a l p ressu res of 15 pHg t h e shock tube is
evacuated t o 1 yHg, f lushed with argon and pumped again
t o 0.10 pHg be fo re each run. For h igher i n i t i a l p ressu res
it is pumped t o 0.10 pHg without f lush ing . The i n i t i a l
p ressu re i s s e t wi th t h e use of a c a l i b r a t e d con ta ine r
(one thousandth of t h e volume of t h e d r iven s e c t i o n ) and
a bellows type 0-50 mm Hg Wallace and Tiernan gauge,
The e l e c t r o n beam is then a l igned by seeking a
p o s i t i o n f o r which t h e c o l l e c t o r c u r r e n t is maximized.
The d i s t a n c e between t h e wa l l and t h e c e n t e r of t h e beam
i s measured a s follows: t h e c e n t e r of t h e beam is found
by moving t h e end wa l l toward t h e beam u n t i l t h e c o l l e c t o r
c u r r e n t j u s t beg ins t o drop. This po in t is recorded and
t h e p l a t e i s pushed again u n t i l t h e c u r r e n t i s zero. The
c e n t e r of t h e beam i s taken t o be a t t h e midpoint between
those two extremes. To l o c a t e t h e end wa l l wi th r e s p e c t
t o t h e c e n t e r of t h e beam, t h e p l a t e is pu l l ed back t o
approximately 1 mm beyond t h e d e s i r e d l o c a t i o n and then is
pushed again toward t h e beam t o t h e c o r r e c t p o s i t i o n . A
f i n e r alignment of t h e e l e c t r o n beam is then made by
minimizing t h e r i p p l e observed i n t h e c o l l e c t o r c u r r e n t
when t h e recording osc i l loscope i s s e t t o very high ga in .
This procedure is repeated be fo re each run. Before t h e
first sho t of t h e day all t h e e l e c t r i c a l adjustments of t h e

beam a r e s e t t o t h e d e s i r e d p o s i t i o n s and a r e no t changed
for a l l subsequent runs.
When t h e inc iden t shock approaches t h e measuring
s t a t i o n a platinum th in - f i lm h e a t t r a n s f e r gauge t r i g g e r s
osc i l loscope #1 (dual beam Tektronix type 555). The upper
beam d i s p l a y s t h e c o l l e c t o r c u r r e n t and t h e lower beam
measures t h e i n j e c t o r needle c u r r e n t . The s i g n a l s i n a l l
o s c i l l o s c o p e s a r e recorded photographica l ly by Polaro id
cameras. Osci l loscopes #2 and #3 a r e s i n g l e beam Tektronix
type 535 and 532, r e s p e c t i v e l y , and a r e used t o record t h e
c o l l e c t o r c u r r e n t with a much h igher ampl i f i ca t ion and
f i n e r t ime r e s o l u t i o n . The l a t t e r is achieved by us ing
scope #1 t o t r i g g e r t h e o t h e r two a f t e r a c e r t a i n t ime
de lay . I n scope #2 t h e d e n s i t y h i s t o r y dur ing t h e
r e f l e c t i o n process is expanded t o occupy t h e e n t i r e p i c t u r e ,
pe rmi t t ing a more accura te reading. This is p o s s i b l e only
because of t h e e x c e l l e n t r e p e a t a b i l i t y of t h e shock tube
cond i t ions , which enables t h e opera tor t o p r e d i c t very
accura te ly t h e speed of t h e inc iden t shock. Scope #3 uses
a l e s s expanded s c a l e , t o show t h e zero i n t h e c u r r e n t
t r a c e ( s e e Figs . 2 and 3) . A time-mark genera tor i s used t o produce time d o t s
(Ref. 10) a t known i n t e r v a l s on t h e c u r r e n t t r a c e of
osc i l loscope #2 (Figs . 2 and 3 ) . The sweep-speed of
osc i l loscope #3 is checked from time t o t i m e by means of
time d o t s (Fig. 2),

A s h o r t t ime a f t e r t h e r e f l e c t i o n is completed, a
p u l s e of 35 t o 50 v o l t s is appl ied t o t h e d e f l e c t i o n p l a t e s
of t h e e l e c t r o n gun (Ref. 3) t o d e f l e c t t h e beam and de te r -
mine t h e z e r o on t h e c o l l e c t o r c u r r e n t t r a c e s . The beam
is then turned o f f au tomat ica l ly and t h e va lve between t h e
shock tube and t h e electron-gun chamber i s c losed ( a l s o
automat ica l ly - s e e Ref. 3) . After t h e sho t a square-wave s i g n a l ( d i s t o r t e d ) i s
s e n t simultaneously t o a l l t h e oscilloscopes and photo-
graphed t o determine t h e r e l a t i v e g a i n of each t r a c e , a s
shown i n f i g u r e s 2 and 3 . The shock tube is then vented
wi th f i l t e r e d d ry a i r and %he diaphragm i s changed. During
t h e diaphragm change a i r is forced by a blower through
t h e d rye r i n t o t h e shock tube u n t i l %he shock tube is again
closed.
2.3.2 C a l i b r a t i o n cons tan t k
Refer r ing t o t h e processes descr ibed i n s e c t i o n 2.2
f o r f ind ing k , method a) is no t used because k i s a
funct ion of t h e e l e c t r i c a l adjustments of t h e beam and,
s i n c e t h e cond i t ions of t h e s t a t i c c a l i b r a t i o n cannot be
reproduced e x a c t l y f o r each run , a s c a t t e r of more than
+ 10% i n t h e c a l i b r a t e d d e n s i t y r e s u l t s . With method b) - t h e r e is s t i l l a s c a t t e r of 6% due t o t h e inaccuracy i n
measuring I* from t h e osc i l loscope t r a c e s . By us ing
method c) whenever t h e measuring s t a t i o n i s f a r enough

from t h e wa l l ( " l a r g e x " ) t o show a p la teau i n t h e c u r r e n t
t r a c e i d e n t i f y i n g t h e uniform region 2 (Fig. 2 ) , t h e
s c a t t e r is reduced t o l e s s than 3% f o r s h o t s f i r e d under
s i m i l a r condi t ions . Also, i f t h e e l e c t r i c a l adjustments
a r e t h e same f o r s i m i l a r runs ( $ 2.3.1) , t h e va lues of k
computed by equat ion (4) f a l l w i th in 3% of t h e mean value.
Therefore, by maintaining t h e same e l e c t r i c a l adjustments ,
method c) can b e extended t o t h e cases where t h e measure-
ments a r e t o o c l o s e t o t h e wa l l ( "smal l x") f o r t h e r e t o
be a p la t eau (Fig. 3 ) : t h e runs a t small x a r e mixed
among t h e ones a t l a r g e x. The va lues of k a t l a r g e x
a r e computed by equat ion (4) and an average va lue is
obtained f o r each day. This average is used i n t h e same
equat ion (4) t o compute t h e denominator of t h e right-hand-
s i d e of equat ion ( 2 ) , giving:
2.3.3 Data reduct ion
The c o l l e c t o r c u r r e n t i s converted t o d e n s i t y by
means of equat ion ( 2 ) f o r l a r g e x and equat ion ( 5 ) f o r
small x. The p o i n t 2 is def ined a s t h e p o i n t immediately
behind t h e inc iden t shock wave where, i n t h e p l o t of
c u r r e n t versus t ime, t h e curvature d isappears and t h e
t r a c e becomes a s t r a i g h t l i n e . This a r t i f i c i a l d e f i n i t i o n

i s necessary because, a s can b e seen i n f i g u r e 2 , t h e so-
c a l l e d "p la teau" is not h o r i z o n t a l probably due t o t h e
inc rease i n d e n s i t y behind t h e inc iden t shock wave caused
by t h e e f f e c t s of s idewal l boundary l a y e r s (Ref. 1 4 ) . The
d e n s i t y p g corresponding t o p o i n t 2 is taken t o b e t h e
ideal-gas d e n s i t y behind t h e incoming shock, computed from
t h e Rankine-Hugoniot cond i t ions f o r normal shocks us ing t h e
measured va lues of M. Two t y p i c a l p l o t s of d e n s i t y versus
time a r e shown i n f i g u r e s 4 and 5. The o r d i n a t e is t h e
normalized dens i ty : p l is t h e i n i t i a l gas d e n s i t y and p 5
is t h e ideal-gas d e n s i t y behind t h e r e f l e c t e d shock wave
c a l c u l a t e d from t h e Rankine-Hugoniot cond i t ions us ing M.

2.4 Error Estimate
~t was shown i n r e fe rence 3 t h a t t h e abso lu te va lue of
t h e p ressu re is known t o wi th in 4%, t h e measurement of t h e
shock Mach number is accura te t o 1%, and t h e shock-speed
v a r i a t i o n between t h e l a s t th in - f i lm gauge and t h e measuring
s t a t i o n i s l e s s than 1% (Ref. 3 ) . The time marker has an
accuracy of 1%. The skewness and curvature of t h e inc iden t
shock have no apprec iable in f luence i n t h i s p a r t i c u l a r s e t
of measurements, a s was pointed out i n r e fe rence 2 based on
t h e r e s u l t s presented i n r e fe rence 11. The measured Mach
numbers have an a c t u a l r m s v a r i a t i o n of 1% f o r M = 6 and
even l e s s f o r M = 4 and 3 . The measured va lues of M a r e
used i n t h e norma1ization of d e n s i t y , s o t h e small va r i a -
t i o n s of M a r e accounted f o r .
The p o s i t i o n of t h e c e n t e r of t h e beam, determined
a s descr ibed i n 42.3.1, may vary a s much a s 8.20 mm f o r
l a r g e x (20 mm and up from t h e wa l l ) from one run t o t h e
nex t , i n d i c a t i n g t h a t t h e r e i s a backlash i n t h e leadscrew
system used t o move t h e end wal l . This g i v e s an u n c e r t a i n t y
of 1% i n t h e measured d i s t a n c e s . The normalized t imes and
d i s t a n c e s (See. 3.1) include t h e p ressu re a s a f a c t o r ;
t h e r e f o r e , t h e i r expected inaccurac ies a r e t h e sum of t h e
r e l a t i v e e r r o r of each f a c t o r , i . e . , 5% f o r both t ime and
d i s t a n c e (normalized) . The va lues o f t h e c a l i b r a t i o n cons tant k ( $ 2.3.2)
vary by 3% (maximum s c a t t e r ) f o r runs made on t h e same day,
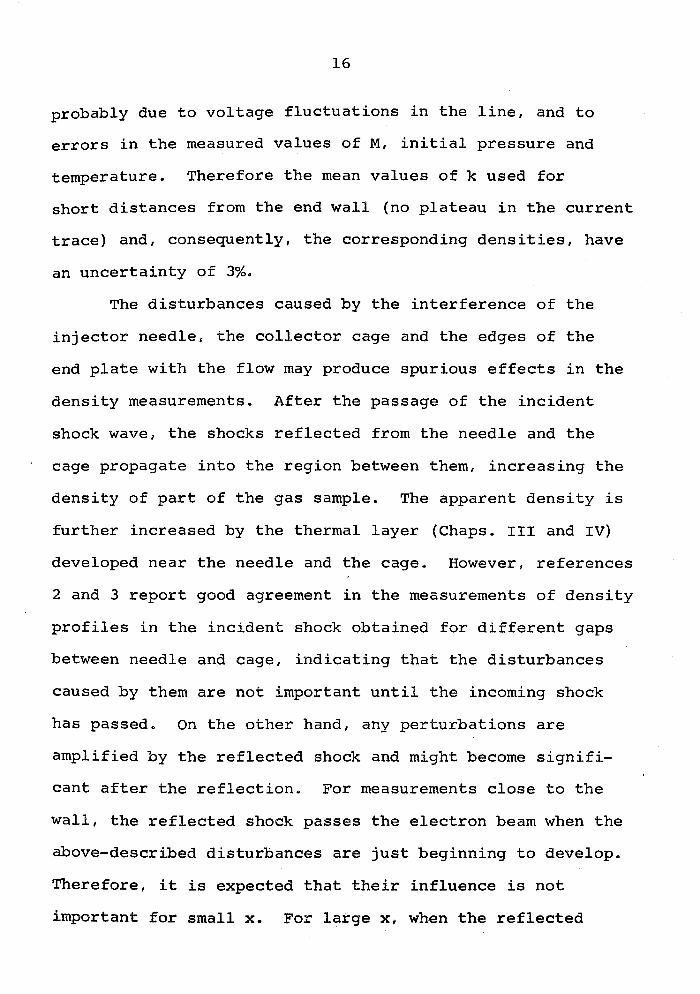
probably due t o vo l t age f l u c t u a t i o n s i n t h e l i n e , and t o
e r r o r s i n t h e measured va lues of M , i n i t i a l p r e s s u r e and
temperature. Therefore t h e mean va lues of k used f o r
s h o r t d i s t a n c e s from t h e end w a l l (no p la teau i n t h e c u r r e n t
t r a c e ) and, consequently, t h e corresponding d e n s i t i e s , have
an u n c e r t a i n t y of 3%.
The d i s tu rbances caused by t h e i n t e r f e r e n c e of t h e
i n j e c t o r needle , t h e c o l l e c t o r cage and t h e edges of t h e
end p l a t e wi th t h e flow may produce spur ious e f f e c t s i n t h e
d e n s i t y measurements. Af te r t h e passage of t h e i n c i d e n t
shock wave, t h e shocks r e f l e c t e d from t h e needle and t h e
cage propagate i n t o t h e region between them, inc reas ing t h e
d e n s i t y of p a r t of t h e gas sample. The apparent d e n s i t y is
f u r t h e r increased by t h e thermal l a y e r (Chaps. 111 and IV)
developed near t h e needle and t h e cage. However, r e fe rences
2 and 3 r e p o r t good agreement i n t h e measurements of d e n s i t y
p r o f i l e s i n t h e inc iden t shock obtained f o r d i f f e r e n t gaps
between needle and cage, i n d i c a t i n g t h a t t h e d i s tu rbances
caused by them a r e not important u n t i l t h e incoming shock
has passed. On t h e o t h e r hand, any p e r t u r b a t i o n s a r e
amplif ied by t h e r e f l e c t e d shock and might become s i g n i f i -
can t a f t e r t h e r e f l e c t i o n . For measurements c l o s e t o t h e
w a l l , t h e r e f l e c t e d shock passes t h e e l e c t r o n beam when t h e
above-descr ibed d i s tu rbances a r e j u s t beginning t o develop.
Therefore, it is expected t h a t t h e i r inf luence is no t
important f o r small x. For l a r g e x, when t h e r e f l e c t e d

wave reaches t h e measuring s t a t i o n t h e d i s tu rbances a r e
f u l l y developed and a r e a l ready propagat ing through t h e
gas sample. Therefore, t h e i r inf luence a f t e r be ing
amplif ied by the r e f l e c t e d shock might become important.
The edges of t h e end p l a t e probably produce expansion
waves a f t e r t h e r e f l e c t i o n , because they a r e no t s e a l e d ,
i . e . , t h e r e is a small gap between t h e p l a t e and t h e cookie-
c u t t e r (Fig. 1) and a l s o between p l a t e and needle , and p l a t e
and cage. The expansion waves coming from t h e s i d e s never
reach t h e beam dur ing t h e measurements, b u t t h e ones
generated by t h e p la te-needle and t h e plate-cage gaps do
reach t h e beam very qu ick ly , tending t o reduce t h e average
d e n s i t y of t h e gas sample. On t h e o t h e r hand, a s descr ibed
above, t h e shocks on t h e needle and cage tend t o i n c r e a s e
t h e apparent dens i ty . The n e t e f f e c t of such i n t e r a c t i o n s
is no t known, b u t i n view of t h e cons is tency of t h e r e s u l t s
obta ined , it is be l i eved t h a t they nea r ly cancel each o t h e r .
I n f a c t , f o r s h o r t d i s t a n c e s , when t h e e f f e c t s of t h e shocks
on t h e needle and cage a r e smal l , t h e p la te-needle and
plate-cage gaps a r e very narrow and t h e expansion waves
o r i g i n a t e d t h e r e (if any) a r e a l s o very weak. For l a r g e x,
bo th e f f e c t s a r e s t ronger .

RESULTS
3.1 Densi ty ~ i s t o r i e s
A d e n s i t y h i s t o r y i s obtained a t each d i s t a n c e from
t h e w a l l , a s descr ibed i n $2.3.3. Due t o t h e e x c e l l e n t
r e p r o d u c i b i l i t y of t h e shock tube cond i t ions it is p o s s i b l e
t o o b t a i n a s e r i e s of such d e n s i t y h i s t o r i e s a t s e v e r a l
d i s t a n c e s from t h e w a l l , a l l of them a t t h e same Mach number
and i n i t i a l p ressu re . Therefore, a s e t of a l l t hose curves
can be p l o t t e d on t h e same graph by spec i fy ing a c o n s i s t e n t
o r i g i n o f t ime f o r a l l of them. I n our case t = 0 i s chosen
t o be t h e i n s t a n t when t h e l ead ing edge of t h e inc iden t
shock reaches t h e w a l l ; t h e l ead ing edge is def ined a s t h e
p o i n t where t h e tangent t o t h e p o i n t of maximum s l o p e of t h e
inc iden t wave c r o s s e s t h e l i n e of ze ro normalized d e n s i t y .
It is a l s o assumed t h a t t h e measured shock speed remains '
cons tant from t h e moment t h e shock i s observed a t t h e
measuring s t a t i o n u n t i l t h e l ead ing edge reaches t h e wal l .
F igures 6 through 10 show such p l o t s f o r each Mach
number and i n i t i a l pressure . Each curve corresponds t o a
d i f f e r e n t d i s t a n c e from t h e wal l . The t imes a r e normalized
by T~~ t h e mean c o l l i s i o n t ime i n t h e uniform flow behind
t h e inc iden t shock wave. The d i s t a n c e s a r e normalized by
l 2 , t h e Maxwellian mean f r e e pa th behind t h e incoming shock.

a = speed of sound
p = viscosity, obtained from
, reference l2
c = specific heat at constant P
pressure
cv = specific heat at constant
volume

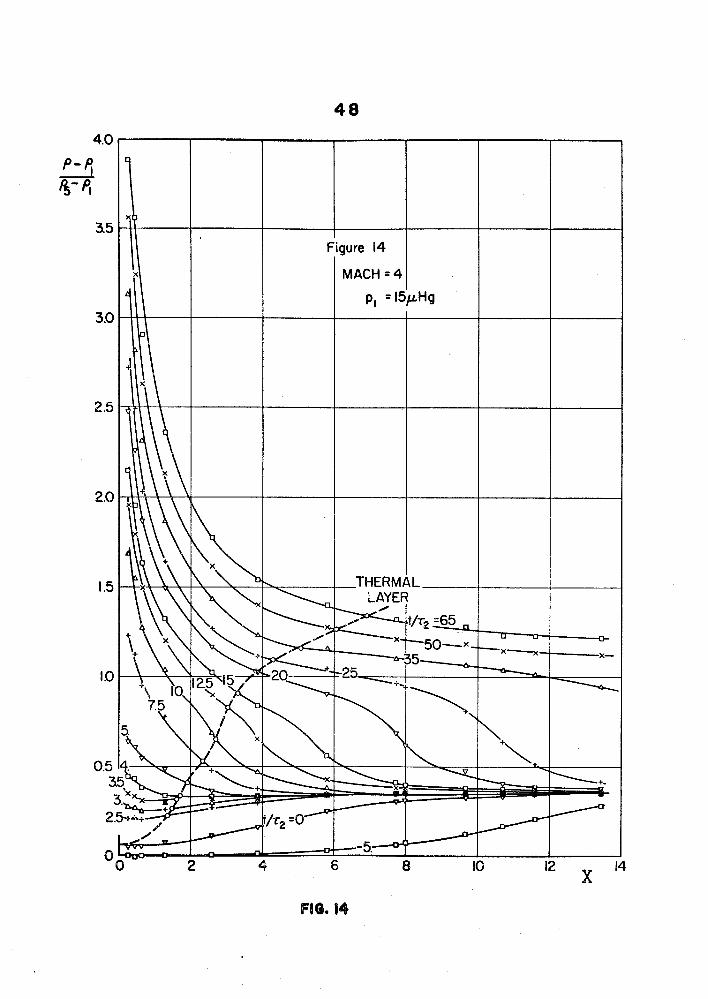
3.2 Density P r o f i l e s
F igures 11 through 15 show t h e p l o t s of d e n s i t y
versus d i s t a n c e from t h e wa l l a t d i f f e r e n t t imes f o r each
M and i n i t i a l p ressu re - The absc i s sa is t h e d i s t a n c e from
t h e wa l l normalized by k 2 given by equat ion ( 7 ) . These
graphs a r e obtained by a c ross -p lo t from f i g u r e s 6 through
10.
The dashed l i n e i n d i c a t e s t h e l i m i t of t h e thermal
l a y e r , computed according t o t h e boundary-layer theory ,
t = t i m e a f t e r t h e shock wave reaches
t h e w a l l
k = thermal conduct iv i ty
The va lues of t h e thermal d i f f u s i v i t y Kg a r e
c a l c u l a t e d assuming a cons tant PrandtP number Pr = 2/3
and us ing t h e ideal-gas cond i t ions behind t h e r e f l e c t e d
shock,

Figures 16 through 20 a r e obta ined from f i g u r e s 11
through 1 5 by d e f i n i n g t h e Lagrangian coordina te $ which
s t r e t c h e s t h e absc i s sa p ropor t iona l ly t o t h e l o c a l
dens i ty :
x = d i s t a n c e from t h e wa l l
The s i g n i f i c a n c e of t h i s choice of coord ina tes i s discussed
i n s e c t i o n 4-1. The i n t e g r a t i o n is performed numerically
along t h e l i n e s of cons tan t t / ~ * . The f i r s t two p o i n t s a r e
obtained by t h e t r a p e z o i d a l r u l e , e x t r a p o l a t i n g l i n e a r l y t o
the,wal l . For t h e i n t e g r a t i o n from t h e t h i r d p o i n t on, a
Newton's second-degree polynomial is f i t t e d t o t h e experi-
mental va lues s f d e n s i t y ,

3 . 3 x-t Diagram
Figures 21, 22 and 2 3 p resen t t h e experimental x- t
diagrams f o r M = 6 , 4 and 3 r e s p e c t i v e l y , obtained from
f i g u r e s 6 through 10. The t h e o r e t i c a l thermal l a y e r
th ickness , def ined by equat ion ( 9 ) , i s a l s o shown, a s we l l
a s some l i n e s of cons tan t dens i ty . The co-slope W of t h e
t r a j e c t o r y of t h e r e f l e c t e d shock d e f i n e s t h e speed uR of
t h e r e f l e c t e d shock ( i n l abora to ry coord ina tes ) normalized
by t h e mean molecular speed c (Eq. 8) i n t h e uniform flow 2
behind t h e inc iden t shock. The l ead ing edge of t h e wave
i s used f o r t h i s purpose because i t s l o c a t i o n is determined
more accura te ly and more c o n s i s t e n t l y than t h a t o f t h e
t r a i l i n g edge.
u2 = flow v e l o c i t y i n r eg ion 2.
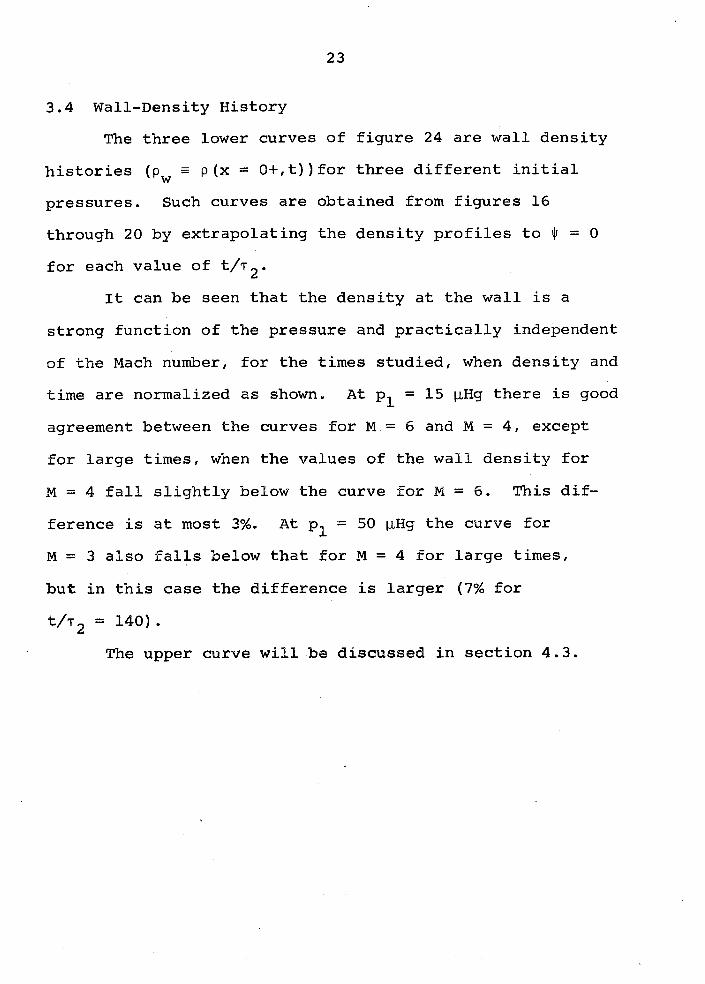
3.4 Wall-Density His tory
The t h r e e lower curves of f i g u r e 24 a r e wa l l d e n s i t y
h i s t o r i e s ( p w 5 p (x = O+, t ) ) f o r t h r e e d i f f e r e n t i n i t i a l
p ressu res . Such curves a r e obtained from f i g u r e s 16
through 20 by e x t r a p o l a t i n g t h e d e n s i t y p r o f i l e s t o $ = 0
f o r each va lue of t / ~ * .
It can be seen t h a t t h e d e n s i t y a t t h e wa l l i s a
s t r o n g func t ion of t h e p ressu re and p r a c t i c a l l y independent
of t h e Mach number, f o r t h e t imes s t u d i e d , when d e n s i t y and
t ime a r e normalized a s shown. A t pl = 15 pHg t h e r e is good
agreement between t h e curves f o r M = 6 and M = 4 , except
f o r l a r g e t imes , when t h e va lues of t h e w a l l d e n s i t y f o r
M = 4 f a l l s l i g h t l y below t h e curve for PI1 = 6. This d i f -
fe rence is a t most 3%. A t pl = 50 pHg t h e curve f o r
M = 3 a l s o f a l l s below t h a t f o r M = 4 f o r l a r g e t imes,
b u t i n t h i s case t h e d i f f e r e n c e is l a r g e r (7% f o r
t / ~ ~ = 140) . The upper curve w i l l be d iscussed i n s e c t i o n 4 . 3 .

3.5 Density P r o f i l e s of t h e Inc iden t Shock Wave
Figures 25 through 27 show t h e d e n s i t y p r o f i l e s of
t h e inc iden t shock f o r Mach = 6 , 4 and 3 r e s p e c t i v e l y .
Each graph shows t h e p r o f i l e s obta ined i n two d i f f e r e n t
ways: from a s i n g l e run; and by c ross -p lo t t ing . The
s i n g l e run method uses t h e d e n s i t y h i s t o r y from one run
and conver ts t h e time a x i s l i n e a r l y i n t o d i s t a n c e s by means
o f t h e measured v e l o c i t y of t h e shock ( s e e d e t a i l s i n Ref.
3) The cross-p lo t va lues a r e taken from t h e curves f o r
negat ive t / r 2 on f i g u r e s 11 through 15 and p l o t t e d i n an
expanded s c a l e . normalizing t h e absc i s sa by X1. t h e
Maxwellian mean f r e e p a t h i n t h e i n i t i a l gas ahead of t h e
shock. For Mach = 6 and 4 some of Schmidt 's r e s u l t s (Ref.
3) a r e a l s o shown. 4
It is q u i t e c l e a r t h a t both methods a r e c o n s i s t e n t ,
al though t h e cross-p lo t d a t a show a l i t t l e more s c a t t e r ,
a s should be expected, because t h i s method r e q u i r e s more
manipulation of t h e r e s u l t s , i n t r o d u c i n g more n o i s e i n t h e
process . I t is a l s o i n t e r e s t i n g t o n o t i c e t h a t t h e
u n c e r t a i n t y introduhed by t h e f i n i t e width of t h e o s c i l -
loscope t r a c e i n c r e a s e s wi th dens i ty .
IV . DISCUSSION
4.1 Density P r o f i l e s
F igures 11 through 20 show t h a t , a l though t h e
inc iden t shock can be c l e a r l y d i s t i n g u i s h e d a t negat ive
t imes , t h e approaching wave d isappears i n t o t h e wa l l a t
small p o s i t i v e times! This very i n t e r e s t i n g f a c t is
ev iden t ly due t o t h e development of t h e thermal l a y e r
which a c t s a s a receding wa l l and whose e f f e c t s on both
inc iden t and r e f l e c t e d . shock waves a r e o u t l i n e d i n
chapter I.
The disappearance of t h e inc iden t wave and t h e
formation of t h e r e f l e c t e d shock a r e c l e a r l y shown i n
f i g u r e s 11 through 20. Of s p e c i a l note is t h e f a c t t h a t
a t some value of t / ~ ~ between 3 and 5 t h e d e n s i t y is
almost cons tant everywhere, i . e . , i t s s p a c i a l d e r i v a t i v e
is almost zero everywhere, although t h e d e r i v a t i v e s wi th
r e s p e c t t o time a r e of course very l a r g e near t h e wal l .
Subsequently, t h e d e n s i t y near t h e wa l l cont inues t o
inc rease very r a p i d l y and f o r a whi le t h e e n t i r e d i s t u r -
bance i n t h e flow is confined t o a small reg ion j u s t a
few mean f r e e pa ths t h i c k . The s lope of t h e d e n s i t y
p r o f i l e is monotonic dur ing t h e i n i t i a l s t a g e s of t h e
r e f l e c t i o n process and no s t r u c t u r e sugges t ive of a shock
wave is evident . F i n a l l y , a t about t / ~ ~ = 10 t h e shock
begins t o reform and t h i s ev iden t ly occurs only a s it

emerges from t h e thermal l a y e r ( s e e Figs . 11 through 1 5 ) .
A t l a t e r t imes t h e r e f l e c t e d shock f r o n t is we l l
def ined and t h e corresponding d e n s i t y jump i n c r e a s e s ,
i n d i c a t i n g a s t r eng then ing which i s presumably due t o
t h e p ressu re waves emi t ted from t h e thermal l a y e r
(" receding w a l l " ) . This s t r eng then ing i s c o n s i s t e n t with
t h e a c c e l e r a t i o n of t h e shock f r o n t shown i n t h e x- t
diagrams (Figs . 21,22 and 2 3 ) . Between t h e r e f l e c t e d
shbck and t h e thermal l a y e r t h e s lopes of t h e d e n s i t y
p r o f i l e s a r e small . The d e n s i t y immediately behind t h e
shock is smal ler than t h a t given by ideal-shock condi t ions
because t h e shock is weaker than i n t h e i d e a l case . But
c l o s e r t o thermal l a y e r t h e d e n s i t y is l a r g e r , becoming
l a r g e r even than t h e i d e a l value. This d e n s i t y inc rease
toward t h e w a l l is %bought t o be caused both by t h e com-
p ress ion waves emi t ted by t h e thermal l a y e r and by t h e
entropy v a r i a t i o n i n t h a t region. A s po in ted ou t i n
chapter I , bo th causes tend t o inc rease t h e d e n s i t y .
I n s i d e t h e dense thermal l a y e r t h e temperature
(entropy) i s reduced by h e a t t r a n s f e r t o t h e w a l l , c r e a t i n g
very s t e e p d e n s i t y g r a d i e n t s , To permit a b e t t e r a n a l y s i s
of t h i s reg ion t h e a b s c i s s a s i n f i g u r e s 16 through 20 a r e
s t r e t c h e d p ropor t iona l t o t h e l o c a l d e n s i t y . From t h e
d e f i n i t i o n of $ (Eq. 14) it can be seen t h a t i t s va lue is
p ropor t iona l t o t h e mass of gas between t h e corresponding
s t a t i o n and t h e wal l . $ is a l s o p ropor t iona l and nea r ly
equal t o t h e number of l o c a l mean f r e e p a t h s between t h a t
l o c a t i o n and t h e wa l l . Therefore, $ is a more meaningful
parameter f o r e x h i b i t i n g phenomena dominated by c o l l i s i o n a l
processes .
I n t h i s coordina te system t h e severe s lopes i n t h e
d e n s i t y p r o f i l e s near t h e wa l l a r e g r e a t l y reduced because
h igher d e n s i t i e s imply smal ler mean f r e e pa ths and, a s $
measures t h e number of mean f r e e p a t h s , it i s s t r e t c h e d
p ropor t iona te ly . The curva tu re of t h e d e n s i t y p r o f i l e s
near t h e wa l l is a l s o reduced, pe rmi t t ing a more r e l i a b l e
e x t r a p o l a t i o n t o e s t ima te t h e va lues of t h e d e n s i t y a t t h e
w a l l (Sees. 3 . 4 and 4.3) . I n non-equilibrium flows of r a r e f i e d gases an impor-
t a n t parameter t h a t measures t he magnitude of %he depar tu res
from equi l ibr ium i s t h e r e l a t i v e change of a v a r i a b l e per
l o c a l mean f r e e pa th , Prom f i g u r e s 16 through 20 it i s
seen t h a t t h e maximum r e l a t i v e v a r i a t i o n of d e n s i t y per
l o c a l mean f r e e p a t h inc reases wi th t ime u n t i l about
t / ~ ~ = 7.5 and then decreases again. The p o i n t of maximum
g r a d i e n t is loca ted about t w o mean f r e e p a t h s from t h e wa l l
a t t / ~ ~ = 7.5 , and about s i x mean f r e e pa ths a t t/ 'r2 = 80
o r 90. The maximum r e l a t i v e d e n s i t y change v a r i e s from
16% t o 24% per l o c a l mean f r e e pa th f o r t/?* = 7.5 and is
about 7% for t / ~ ~ = 80 o r 90. For normal shocks. a t t h e
p o i n t of maximum s lope t h i s va lue is approximately 13% f o r
M = 6.

4.2 x- t Diagram
Figures 21 through 23 show t h e non-dimensional x- t
diagrams f o r M = 6 , 4 and 3, r e s p e c t i v e l y . The speed W
of t h e r e f l e c t e d shock inc reases toward t h e ideal-shock
va lue a s t h e wave f r o n t moves away from t h e wal l . A s t h e
normalizing cons tan t s f o r bo th space and t ime depend
l i n e a r l y on t h e p ressu re , t h e s lopes ( v e l o c i t i e s ) do no t
con ta in any pressure-dependent s c a l i n g f a c t o r , Therefore,
a s bo th t r a i l i n g and l ead ing edges of t h e inc iden t (Fig. 22)
and r e f l e c t e d waves a r e t h e same f o r b o t h p ressu res p l o t t e d
i n each f i g u r e (Figs . 21 and 2 2 ) , t h e v e l o c i t y W must be
independent of t h e p ressu re , a s expected. Also, t h e shock
th ickness s c a l e s l i n e a r l y wi th p ressu re , a s expected.
The l i n e s of cons tan t d e n s i t y i n d i c a t e a p ressu re
dependence i n t h e i n v i s c i d region between t h e r e f l e c t e d
shock and t h e thermal l a y e r , A s explained i n chapter I
and i n s e c t i o n 4.1, t h e d e n s i t y near t h e thermal l a y e r is
thought t o be determined mainly by t h e entropy g r a d i e n t s ,
whose e f f e c t s depend s t rong ly on t h e development of t h e
thermal l a y e r , For h igher i n i t i a l p ressu res t h e d is -
placement v e l o c i t y i s l e s s , s o depar tu res from i d e a l a r e
smal ler and t h e entropy behind t h e r e f l e c t e d shock is
h igher . Higher entropy corresponds t o lower dens i ty .
Therefore, t h e lower normalized d e n s i t i e s observed i n t h e
runs wi th h igher i n i t i a l p ressu res a r e c o n s i s t e n t wi th t h e
above explanat ion.

4.3 Wall Density History
Boundary-layer theory (no slip) predicts that the
asymptotic values of the normalized wall densities are
30.9, 14.2 and 8.15 for M = 6.00, 4.00 and 2.96, respec-
tively. These theoretical asymptotic values are of course
independent of the initial pressure. The present results,
shown on figure 24, fall much below the predicted values,
indicating that accommodation (slip) effects are largeland
are indeed a function of the initial pressure. For example,
the smallest value of Tw ~(O+,t),the temperature of the
gas at the wall, implied by figure 24 corresponds to
( p - pl)/(p5 - pl) = 5 at M = 4 and p1 = 15 pHg, that is,
Tw = 835O~, in contrast with the value 3 0 0 ~ ~ which would be
found if there were no thermal slip. For M = 6 and
p, = 35 pHg, (pw - p1)/(p5 - pl) = 3.17 (Fig. 24) gives
Tw = 2850O~l
In the above figure 24 the normalizing constant T~
is inversely proportional to the initial pressure. If,
however, the normalized time is divided by the square root
of the initial pressure, the values of the abscissa become
proportional to the square root of pressure. For con-
venience of plotting this is done by multiplying the values
of the density by the square root of initial pressure,
which has an equivalent effect. In doing this, it is found
that the results for all Mach numbers and initial pressures
collapse onto a single curve shown at the top of figure 24,
indicating that the proper scaling factor for the wall
density is the square root of the pressure. Therefore, it
appears that near the wall the time should be normalized
by an "accommodation time" which is inversely proportional
to the square root of the pressure. In a completely dif-
ferent experiment, Busing and Clarke (Ref. 13) also con-
cluded that accommodation effects at the wall scale with
the square root of the pressure.
It should be pointed out, however, that the
uncertainties of this plot are higher than the values
given in section 2.4 for the other results, because figure
24 is obtained by extrapolation. An error of 3% in the
values of the density and 5% in the distance in figures 16
through 20 may cause a deviation of as much as 25% in the
values of the wall density. However, the scatter in
figure 24 suggests that 25% would be too pessimistic and
that the accuracy of such plot seems to be better than
that,

V. CONCLUSIONS
1) The choice of d e n s i t y a s t h e p r i n c i p a l v a r i a b l e
t u r n s out t o be very f r u i t f u l because it c a r r i e s information
about t h e v a r i a t i o n of o t h e r parameters such a s temperature,
p ressu re and entropy, a s they a r e inf luenced, f o r example,
by h e a t t r a n s f e r o r shock s t r e n g t h .
2 ) The p l o t s of d e n s i t y p r o f i l e s have s u f f i c i e n t
r e s o l u t i o n and accuracy t h a t both q u a n t i t a t i v e and qua l i -
t a t i v e information can be obtained about a ) t h e i n t e r a c t i o n
of t h e inc iden t shock wave with t h e w a l l , b ) t h e e f f e c t s of
t h e wa l l hea t t r a n s f e r and accommodation on t h e d e n s i t y
near t h e w a l l , c ) t h e formation of t h e r e f l e c t e d shock
wave, i ts s t r e n g t h and t r a j e c t o r y on t h e x- t diagram, and
d ) t h e na tu re of t h e flow f i e l d l y i n g between t h e thermal
l a y e r and t h e r e f l e c t e d shock wave a t " l a r g e t imes" ( l a r g e
f o r t h i s experiment) . 3) By s t r e t c h i n g t h e normalized d i s t a n c e s propor-
t i o n a l l y t o t h e l o c a l mean f r e e pa th , t h e very s t e e p s lopes
i n t h e d e n s i t y p r o f i l e s near t h e w a l l a r e g r e a t l y reduced,
pe rmi t t ing a more r e l i a b l e e x t r a p o l a t i o n of t h e d e n s i t y
p r o f i l e s t o t h e wal l . The wall-densi ty h i s t o r i e s s o
obtained i n d i c a t e very l a r g e accommodation e f f e c t ,

REFERENCES
1. M. Camac, "Rarefied ~asdynamics", Vol. 1, p. 240 (Academic Press, Inc., New York, 1965) .
2. David A. Russell, "Rarefied Gasdynamics", Vol. 1, p. 265 (Academic Press, Inc., New York, 1965).
3. Bernd J. F. Schmidt, to be published.
4. H. M. Mott-Smith, Phys. Rev., Vol. 82, p. 885 (1951).
5. H. W. Liepmann, R. Narasimha and M. T. Chahine, Phys. Fluids, Vol. 5, p. 1313 (1962) .
6. G. A. Bird, J I FluidMech., Vol. 30, p. 479 (1967).
7. H. W. Lfepmann, A. Roshko, D. CoPes, B. Sturtevant, Rev. Sci- Instr,, Vol. 33, p. 625 (1962).
8. Charles Chang-Ping Wang, Ph.D. Thesis, California Institute of Technology (1967).
9, H. W, Liepmann, A. Roshko, Elements - of Gasdynamics, Wiley, New York (1957).
10. Jerome A. Smith, Ph.D. Thesis, California Institute of Technology (1967).
11. Robert M. Bowman, Ph.D. Thesis, California Institute of Technology (1966) .
12. I. Amdur, E. A. Mason, Phys- Fluids, Vol. 1, p. 370 (1958).

REFERENCES (cont . )
13. J. R. Busing and J. F. Clarke, Recent Advances &I Aerothermochemistry, (Ed. I. Glassman) Vol. 1, p. 165, AGARD Conference Proceedings No. 12 (1967).
14. H. Mirels and W. H. Braun, Non-Uniformities i n Shock Tube Flow Due t o Unsteady Boundary Layer Action, NACA TN 4021 (1957).

MACH PI P5 *I T5 - 5 I 2 72
wHg 0
I J - H ~ K K P~ mrn psec 0
6.00 15 3683 298 8197 8.926 1.734 1.257
6-08 35 8593 296 8141 8.926 0.737 0.534
4.00 50 4885 296 3697 7.822 0.463 0.483
Table % - Average Values

END WALL SIMULATOR FRONT VIEW SWOWlNG
NEEDLE AND COLLECTOR
v Figure 1

PUCH = L.OI n = 1 ~ p ~ g DIST = 12 m m
Scope # 2
Ti-e --arks = 5 p s e c apart Calibration mark = .R5 V
Scope # 3
Calibration mark = .8S V
Time marks = lO aec apart Y
Figure 2

Y&H = 3.97 m = DIST = 4 m m
Scope # 2
Tkme w ~ k s = 5 see apart lr- Calibration mrk = .85 V
Scope f 3
Calibration mrk = .85 V
Figure 3


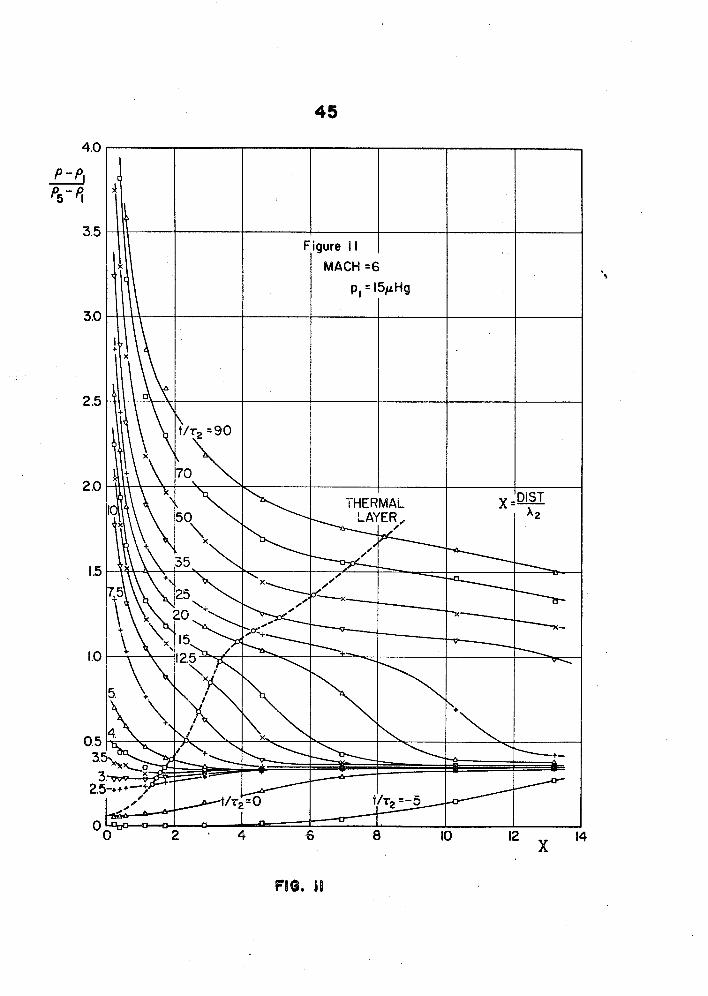


Figure 13


3. cn 3 " (L: LLs > > k cn Z
-1 X 2 8 3 VP
$ 5 I- a-
2; > 0
5 en" z = tp cf3
a % -I
P 0 W I- 4 -I 0 a 4 E k- X W