
Electrokinetic Biosensing at Liquid-Liquid Interfaces
47
Electrokinetic Biosensing at Liquid-Liquid Interfaces by Nicholas Mavrogiannis A thesis submitted to Johns Hopkins University in conformity with the requirements for the degree of Master of Science in Engineering Baltimore, Maryland August, 2014 © 2014 Nicholas Mavrogiannis All Rights Reserved
Transcript of Electrokinetic Biosensing at Liquid-Liquid Interfaces

1
Electrokinetic Biosensing at Liquid-Liquid Interfaces
by
Nicholas Mavrogiannis
A thesis submitted to Johns Hopkins University in conformity with the requirements for the
degree of Master of Science in Engineering
Baltimore, Maryland
August, 2014
© 2014 Nicholas Mavrogiannis
All Rights Reserved
ii
Abstract
Development of low-cost, rapid, sensitive and portable biosensing systems are important
for the detection and prevention of disease in developing countries, biowarfare/anti-terrorism
applications, environmental monitoring, point-of-care diagnostic testing and for basic biological
research. Currently, the most established commercially available and widespread assays for
portable point of care detection and disease testing are paper-based dipstick and lateral flow test
strips. These paper-based devices are often small, cheap and simple to operate. The last three
decades in particular have seen an emergence of these assays in diagnostic settings for the
detection of pregnancy, HIV/AIDS, blood glucose, Influenza, urinary protein, cardiovascular
disease, respiratory infections and blood chemistries. Such assays are widely available largely
because they are inexpensive, lightweight, portable, are simple to operate, and a few platforms
are capable of multiplexed detection for a small number of sample targets.
In this paper, we present, in three parts, the first non-optical technique for detecting and
quantifying chemical and biomolecular reactions in solution phase. First, an interfacial tilt is
explored utilizing Maxwell-Wagner (MW) stress. Two fluids of varying electrochemical
properties, conductivity and permittivity, are forced to flow side by side. When an electric field
is applied across the interface a liquid displacement occurs across the interface. This
displacement is found to be frequency dependent. At low frequency, roughly 1 MHz, the fluid
with a higher conductivity displaces into that of a lower conducitivity. On the contrary, at high
frequencies, roughly 20 MHz, the fluid with the high permitivitty displaces into the fluid with a
lower permitivitty. The frequency in which no displacement occurs is known as the crossover
frequency (COF). Next, for ion and biodetection, the interface created between these two streams

iii
is comprised of one liquid containing the analyte of interest and a second liquid containing a
receptor. Analyte-receptor binding at the interface changes the interfacial electrical
polarizability, and this change in polarizability can be detected by measuring the physical
interfacial “tilt” during exposure to the AC electric field. The frequency-dependence of this
displacement is highly sensitive to receptor:ligand binding at the interface, and by measuring this
displacement as a function of frequency, the presence of an analyte can be determined. When a
reaction occurs downstream the channel, the COF of the system increases, yet when no reaction
occurs, the COF decreases down the channel, due to diffusion.
Advisor: Dr. Zachary Gagnon
Reader: Dr. Joelle Frechette

iv
Acknowledgments
Thank you to my family, friends, and Professor Gagnon

v
Table of Contents Abstract ii
Acknowledgments iv
Table of Contents v
List of Figures vi
Chapter 1 1 Introduction 1
Chapter 2 5 Materials and Methods 5
2.1 Microfluidic Device Fabrication 5 2.2 Chemical Solutions 10 2.3 Pressure System 11 2.4 Construction of a Microfluidic Liquid/Liquid Interface 13
Chapter 3 15 Background 15
3.1 Maxwell-Wagner Polarization at Liquid-Liquid Interfaces 15 3.2 Calcium Green-1 17
3.3 Biotin and Avidin 18
Chapter 4 20 Results and Discussion 20
4.1 Fluidic Dielectrophoresis 20 4.2 Calcium Detection 23 4.3 Avidin-Biotin Reaction 28
Chapter 5 32 Conclusion and Future Work 32

vi
List of Figures
Figure 1 Master Mold and PDMS Fabrication 6
Figure 2 Metal Deposition and Electrode Fabrication 7
Figure 3 Photomask Illustrating the Electrode Design 8
Figure 4 Brightfield image of the inlet of the microfluidic T-channel with
embedded electrodes
9
Figure 5 Microfluidic T channel with embedded electrodes. Two fluid streams
with different electrical properties— each imaged with a fluorescent
dye—flow side by side to create an electrical interface.
10
Figure 6 Custom pressure system utilized for delivering samples to the
microfluidic device
12
Figure 7 Rigol DG 4102 Function Generator used to deliver an electric field with
varying frequencies and voltages across the liquid-liquid interface
13
Figure 8 Illustration of frequency-dependent MW polarization. 16
Figure 9 Calcium Green-1 Structure 18
Figure 10 Biotin Structure 18
Figure 11 Confocal cross section of the interface 21
Figure 12 Figure 10. Comparison between experimental (symbols) and analytical
(line) interfacial COF as a function of the difference in electrical
conductivity between each fluid stream, [σ1 – σ2]. Error bars are of the
order of the size of symbols.
23
vii
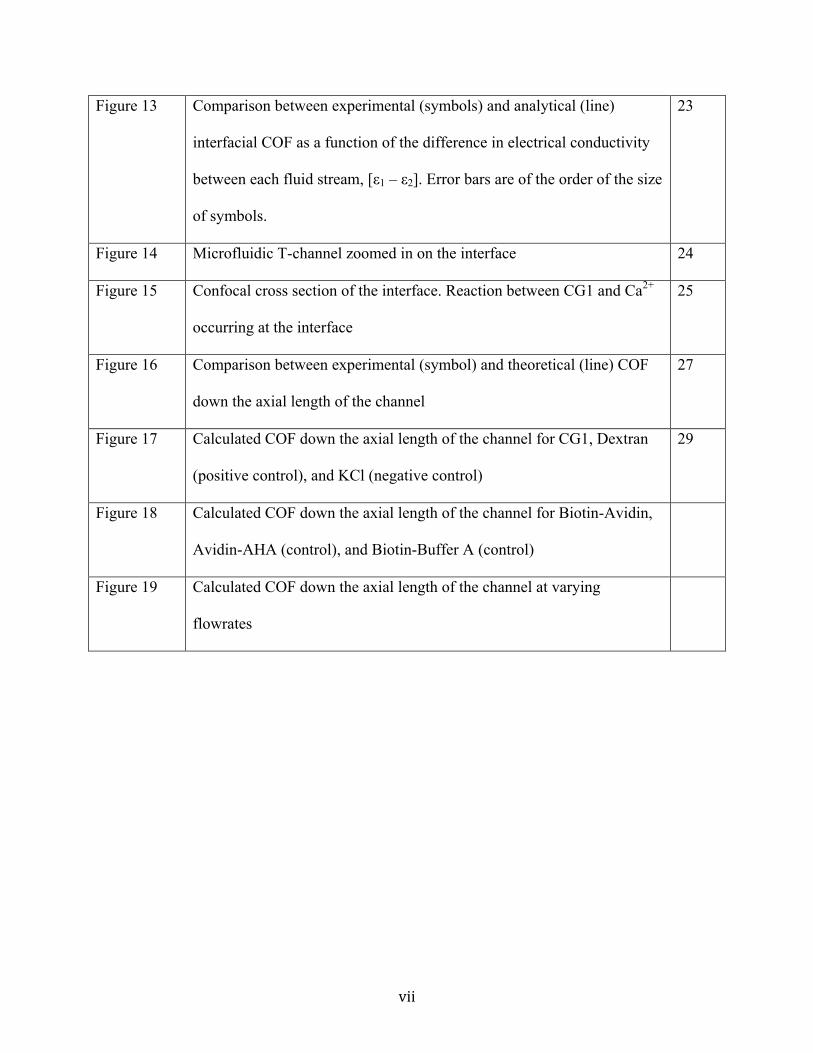
Figure 13 Comparison between experimental (symbols) and analytical (line)
interfacial COF as a function of the difference in electrical conductivity
between each fluid stream, [ε1 – ε2]. Error bars are of the order of the size
of symbols.
23
Figure 14 Microfluidic T-channel zoomed in on the interface 24
Figure 15 Confocal cross section of the interface. Reaction between CG1 and Ca2+
occurring at the interface
25
Figure 16 Comparison between experimental (symbol) and theoretical (line) COF
down the axial length of the channel
27
Figure 17 Calculated COF down the axial length of the channel for CG1, Dextran
(positive control), and KCl (negative control)
29
Figure 18 Calculated COF down the axial length of the channel for Biotin-Avidin,
Avidin-AHA (control), and Biotin-Buffer A (control)
Figure 19 Calculated COF down the axial length of the channel at varying
flowrates
1
Chapter 1
IntroductionDevelopment of low-cost, rapid, sensitive and portable biosensing systems are important
for the detection and prevention of disease in developing countries, biowarfare/anti-terrorism
applications, environmental monitoring, point-of-care diagnostic testing and for basic biological
research. Currently, the most established commercially available and widespread assays for
portable point of care detection and disease testing are paper-based dipstick and lateral flow test
strips. These paper-based devices are often small, cheap and simple to operate. The last three
decades in particular have seen an emergence of these assays in diagnostic settings for the
detection of pregnancy, HIV/AIDS, blood glucose, Influenza, urinary protein, cardiovascular
disease, respiratory infections and blood chemistries. Such assays are widely available largely
because they are inexpensive, lightweight, portable, are simple to operate, and a few platforms
are capable of multiplexed detection for a small number of sample targets.
However, there is a critical need for sensitive, quantitative and multiplexed detection
capabilities for point-of-care diagnostics and for the detection and prevention of disease in the
developing world that cannot be satisfied by current state-of-the-art paper-based assays. For
example, applications including the detection of cardiac and cancer biomarkers and biothreat
applications require sensitive multiplexed detection of analytes in the nM and pM range, and
cannot currently be satisfied with current inexpensive portable platforms due to their lack of
sensitivity, quantitative capabilities and often unreliable performance.
Traditionally, biomolecular applications are focused on the detection of specific
nucleotide sequences within a pathogen genome or the detection of biomarker-specific proteins
as markers for disease or human health. Biosensors typically integrate two basic components for
2
successful operation: a biological sensing element which is a specific biomolecular interaction,
such as an antibody that binds to a target protein, and a signal transducer, which converts this
targeted binding event into a measurable signal. In biosensors, the bioreceptor is designed to
interact with an analyte of interest, thereby producing a response, which the transducer measures.
Common recognition elements include, antibody/antigen1, enzymes
2, nucleic acids/DNA
3, and
cellular structures/cells4. The other component by which biosensors are characterized is the
transducer, which can be electrochemical5, optical
6, calorimetric
7, or acoustic
8.
One of the most popular biosensing approaches includes optical-based techniques. These
methods commonly require fluorescence and the fluorescent tagging of biomolecular target
probes. Although optical-sensitive molecular detection techniques provide sensitive and specific
detection of a target analyte in a sample and often possess multiplexing capabilities, the majority
of these techniques pose great challenges in terms of development into simple to operate,
portable, sensitive and inexpensive biosensing platforms. First, these methods commonly rely on
the costly and time consuming chemical conjugation of biorecognition molecules to either
enzymes or fluorescent probes for optical detection. Second, periodic rinsing steps are often
required in order to avoid non-specific binding, biofouling, and to remove non-binding probes
from functionalized array substrates. Finally, optical methods are often limited to laboratory
settings, since fluorescent detection instrumentation is often required to detect surface binding
events and is still too bulky and costly for widespread daily, clinical and portable point-of-care
use. Several label-free optical techniques include SPR9 and Raman spectroscopy
10 have been
applied to optically detect and measure reaction kinetics of biomolecules, however, these
approaches are costly and lack portability.

3
The ideal biosensing platform with the ultimate attractiveness for both portable point of
care use and commercialization potential is an inexpensive system, which can go from sample
loading to facile biomolecular detection in a single step without the need for external supporting
equipment. These types of systems are especially needed in the developing world where
inhabitants lack access to basic technical services and human resources. The biosensing platform
proposed here will satisfy this ultimate goal, as well as overcome the challenges facing the
application of diagnostics in resource-poor settings: (i) affordable, (ii) sensitive, (iii) specific, (iv)
user-friendly, (v) rapid and robust, (vi) equipment-free and (vii) delivered to those who need it, or
“ASSURED” for short, as required by the World Health Organization (WHO).11
A major obstacle to the development of a robust, inexpensive, sensitive and portable
biosensing platform with multiplexing capability is the lack of an available biosensor that is
rapid, and specific to small concentrations of target biomolecules yet still capable of (1) being
integrated inexpensively into miniaturized diagnostics systems, (2) does not require the labeling
of probes or optical microscopy and (3) can operate without the need for complex and bulky
supporting instrumentation.
This paper presents, in three parts, the first non-optical technique for detecting and
quantifying chemical and biomolecular reactions in solution phase. First, an interfacial tilt is
explored utilizing Maxwell-Wagner (MW) stress.12
Two fluids of varying electrochemical
properties, conductivity and permittivity, are forced to flow side by side. When an electric field
is applied across the interface a liquid displacement occurs across the interface. This
displacement is found to be frequency dependent. The frequency in which no displacement
occurs is known as the crossover frequency (COF). Depicted in Figure 5, the interface created
between these two streams is comprised of one liquid containing the analyte of interest and a

4
second liquid containing a receptor. Analyte-receptor binding at the interface changes the
interfacial electrical polarizability, and this change in polarizability can be detected by measuring
the physical interfacial “tilt” during exposure to the AC electric field. The frequency-dependence
of this displacement is highly sensitive to receptor:ligand binding at the interface, and by
measuring this displacement as a function of frequency, the presence and amount of an analyte
can be determined.
Electrokinetic detection was accomplished for two different systems: chemical detection
of calcium ions, and the biodetection of avidin:biotin binding.
5
Chapter 2
Materials and Methods
2.1 Microfluidic Device Fabrication The microfluidic “T-channel” device was fabricated using standard soft photolithography
and microfabrication techniques.
2.1.1 Master Mold Fabrication
A master mold was fabricated on a silica wafer using a negative photoresist. First the
photoresist (SU-8 3050) was spin coated to 60 μm thickness. The wafer was then softbaked at 65
oC and pre-exposure baked at 95
oC before exposure. A transparency mask was then aligned and
the wafer was UV exposed. The wafer was then post-exposure baked at 95 oC before developing
in SU-8 developer. After the wafer was developed it was hardbaked at 200 oC in order to smooth
out the features. A 10:1 mixture of PDMS elastomer and curing agent was poured atop the wafer
and baked at 85oC for 30 minutes. The PDMS was gently peeled off the wafer and the design is
cut out of the mold. Fluid ports were punched with a .75 mm diameter biopsy punch (Ted Pella,
Inc.).

6
2.1.2 Electrode Fabrication
Microchannel electrodes were fabricated using wet chemical etching techniques. Glass cover
slips (50x30 mm, no.1, Fisher Scientific) were coated with 2nm of chromium and 50 nm of gold
using electron beam evaporation. Electron beam deposition is a form of vapor deposition in
which a target anode is bombarded with electrons. The target metal, or the source, sublimes and
transforms into the gaseous phase. The atoms then precipitate into solid form, coating everything
in the chamber, specifically the target substrate, glass coverslips in this case. When depositing
gold onto glass substrates a second metal is needed, this metal is known as the adhesive layer.
Figure 1. Master mold and PDMS fabrication

7
Gold alone cannot adhere to glass, yet it can adhere to another metal such as chromium. Since
chromium can adhere to glass alone, it is used as an adhesion layer for gold attachment. Once
gold-coated coverslips have been fabricated, they can be patterned to create electrodes. The
entire process from deposition to patterning is illustrated in Figure 2. below,
The cover slips were patterned with photoresist (Shipley 1813) and exposed metal was etched
using gold and chromium etchant. First the photoresist was spin coated onto the gold coverslips
Figure 2. Metal deposition and electrode fabrication

8
with a 1.5 μm thickness. The slides were then baked at 95 oC for 2 minutes. Once the slides
cooled, a mask aligner was used to align a photomask, shown in Figure 3., with the slide.
Since the photoresist is a positive photoresist, any portion of the photoresist that is exposed to
UV light will cure and remain on the slide during development. Once the slide was UV exposed
it was developed in MF-26 developer for 2 minutes and washed with DI water. Once the pattern
was suitable for etching the slide was submerged in gold echant for 10 seconds, then chromium
etchant for 1 minute. The slide was then washed with acetone to remove left-behind photoresist,
and isopropanol to remove acetone.
Figure 3. Photomask illustrating the electrode design

9
2.1.3 Bonding
The resulting electrode pattern was aligned and bonded to a soft lithographically fabricated
polymer “T-channel” design. The electrode-patterned coverslip was then exposed to oxygen
plasma (Jelight, Model 42A) and the PDMS microchannel was exposed using a handheld tesla
coil (Vendor ID). The two substrates were then immediately aligned and sealed under an
inverted microscope. As shown in Figure 4., the device consists of a main flow channel 100 m
wide and 65 m high. The embedded electrodes are axially separated by 20 m and
symmetrically bridge the channel width. Here, electrodes with sharp points are utilized in order
to maximize the electric field strength across the liquid interface, as the sharp point serves to
focus the electric field to the tip of the electrode.
Figure 4. Brightfield image of the inlet of the microfluidic T-channel with embedded electrodes12

10
2.2 Chemical Solutions
2.21 Phosphate Buffer Solution and 6-Aminohexanoic Acid
Two fluid streams are introduced into the device via pressure driven flow from an externally
pressurized cryogenic vial. Shown in Figure 5., the left-most (green) high conductivity stream
consists of diluted 10X phosphate buffered saline (PBS) labeled with 10 ng/mL of Alexa Fluor
488 (Invitrogen). The right-most (red) high dielectric stream consists of 2M 6-aminohexanoic
acid (Sigma-Aldrich) (AHA) labeled with 10 ng/mL of Alexa Fluor 594 (Invitrogen). AHA is a
water-soluble zwitterion used for increasing the dielectric constant of aqueous solution. Prior to
fluorescent labeling, the AHA solution is vigorously shaken for 5 minutes in 5 g/mL Dowex
MR-3 (Sigma) ion exchange resin to remove trace salts and reduce solution conductivity.
2.2.2 Calcium Green-1
Calcium Chloride (CaCl2), Calcium Green-1 (CG1), Potassium Chloride (KCl) and 6-
Figure 5. Microfluidic T channel with embedded electrodes. Two fluid streams with different electrical
properties— each imaged with a fluorescent dye—flow side by side to create an electrical interface.12

11
aminohexanoic acid (AHA) were purchased from Sigma Aldrich. The CG1 was initially diluted
to a 2 mM stock solution with DI water, then diluted down to a .2 mM stock solution with 2M 6-
aminohexanoic acid and labeled with 10 ng/ml Alexa Fluor 405 (Invitrogen). The CaCl2 was
diluted to 1 mM with DI water and labeled with 10 ng/ml Alexa Fluor 594 (Invitrogen). The
resulting conductivities were 20 μS/cm and .25 mS/cm respectively.13
2.2.3 Biotin and Avidin
Biotin and avidin were purchased from Sigma Aldrich. The primary buffer, Buffer A, was made
of 100mM NaCl, 50 mM NaH2PO4 and 1 mM ethylenediaminetetraacetic acid (EDTA), pH
adjusted to 7.5 with NaOH, all purchased from Sigma Aldrich. A biotin stock solution (4mM,
244.3 g/mol) was made with Buffer A. A standard solution (16 μM) was made by diluting the 4
mM stock with AHA and labeled with 10 ng/ml Alexa Fluor 594. Avidin solution (2.5 μM,
66,000 g/mol) was made by adding 1.2 mg of pure avidin to 4 mL of Buffer A and labeled with
10 ng/ml Alexa Fluor 488. The concentration was calculated with a UV spectrometer. The UV
was measured at A282 (per cm) and divided by the molar absorptivity of avidin (ε282 = 96,000
M/cm).14
2.3 Pressure System Samples were delivered to the microfluidic device via a customized pressure system depicted
below in Figure 6.

12
Samples are loaded into 4-milliliter cryotubes, and delivered to the device by tubing. House gas
is sent to a pressure regulator followed by a pressure gauge. From there, the gas is delivered to
yet another pressure regulator and gauge (A), from which it is delivered to a series of outlet
switches that deliver the gas to respective tubes (B). These outlet tubing, colored blue and red,
are fed to another regulator and gauge, which is attached directly to cryotubes, (C), (D), and (E)
respectively. The regulated house gas is fed through the side of the cryotube filling the tube with
air. Since the cryotube is filled with sample, as the cryotube is pressurized, the sample needs to
exit or the pressure will continue to build up. The sample exits out of the tubing which is
Figure 6. Custom pressure system utilized for delivering samples to the microfluidic device

13
attached to the microfluidic device, delivering sample, (F). The pressure gauges (D) regulate the
flowrates the samples are fed to the device.
2.4 Construction of a Microfluidic Liquid/Liquid Interface Detection at the interface is based on an electrical-field induced fluid displacement of a
liquid interface. This interface is created using two liquids of varying electrical properties -
conductivity and permittivity – made to flow side-by-side during exposure to an ac electric field
applied perpendicularly across the interface.
To create the electrical interface, two fluid streams, each with a different set of electrical
properties, are pressure injected into the microfluidic device at a steady flow rate of 10 L/min.
An AC potential of 10 volts peak-to-peak (Vpp) at = 1 MHz is dropped across the electrodes
and the frequency is slowly increased to 25 MHz while continuously monitoring the fluid
interface. This was performed utilizing a Rigol DG4102 shown in Figure 7.15
A cable is connected to the outlet port of the function generator at one end. The other end has
two alligator clips; one active, the other is ground. Copper tape is attached to the pads, shown in
Figure 7: Rigol DG 4102 Function Generator used to deliver an electric field with varying frequencies
and voltages across the liquid-liquid interface

14
Figure 3, on the coverslip. Once the copper tape is applied to the chip, the alligator clips are
attached to the copper tape. At this point, the voltage and frequency is selected on the function
generator. Hitting the output button on the function generator delivers the electric field to the
device, which is then applied across the liquid-liquid interface.

15
Chapter 3
Background
3.1 Maxwell-Wagner Polarization at Liquid-Liquid Interfaces Since the embedded electrodes are on the bottom channel surface, fluid displacement is largely
driven by polarization near the electrodes where the electric field (E) is largest. A charge
neutrality condition at the liquid interface at the bottom channel surface will produce an observed
crossover frequency, COF. across the entire electrical interface. The liquid interfacial COF is
formulated for values of the electric field very near the substrate surface where it is assumed
symmetric in the y direction (normal to the channel surface). Assuming each fluid is
electroneutral, the electric potential in each phase very near the channel surface is well described
by the one-dimensional Laplace equation in x,
d 2fidx2
= 0 Equation 1
where Φι is the applied potential in the ith liquid stream, 1 (green) and 2 (red), and x points in the
direction normal to the electric interface. We apply the usual MW boundary conditions at the
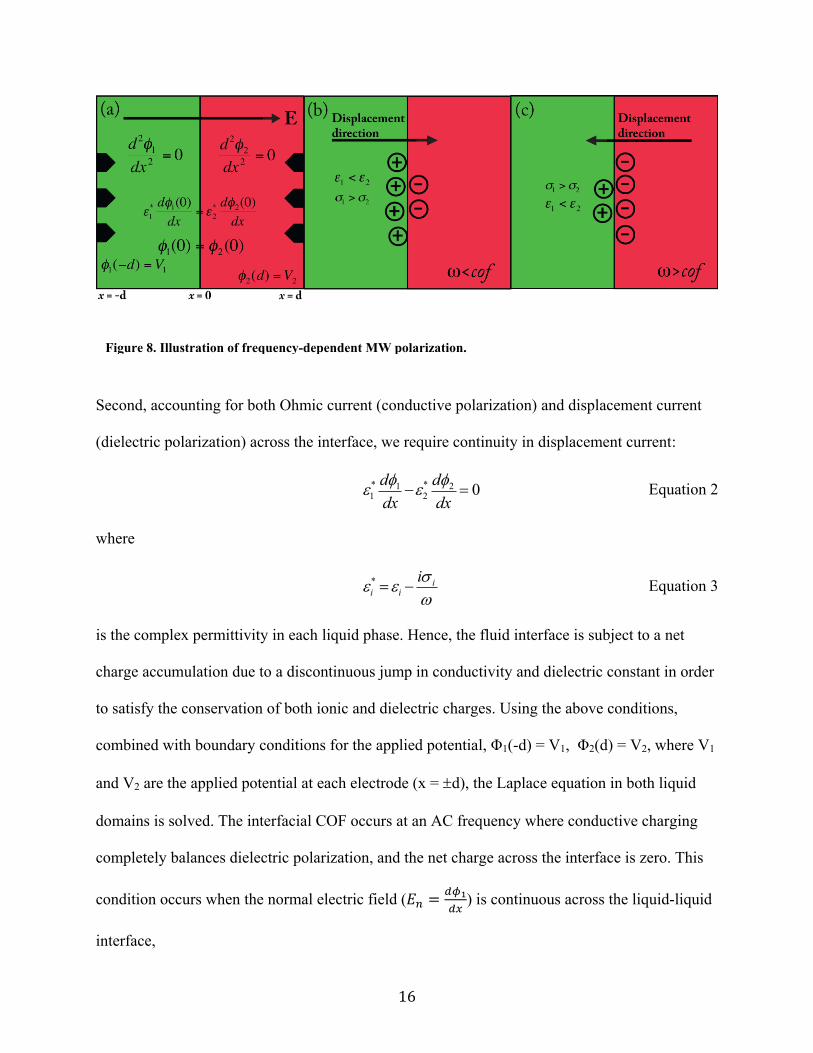
electrical interface between the two liquid streams. First, as illustrated in Figure 8.12
, we require
the electric potential across the electrical interface (x = 0) be continuous, Φι (0) = Φ2 (0).
16
Second, accounting for both Ohmic current (conductive polarization) and displacement current
(dielectric polarization) across the interface, we require continuity in displacement current:
e1* df1dx
-e2* df2dx
= 0 Equation 2
where
ei* =ei -
is iw
Equation 3
is the complex permittivity in each liquid phase. Hence, the fluid interface is subject to a net
charge accumulation due to a discontinuous jump in conductivity and dielectric constant in order
to satisfy the conservation of both ionic and dielectric charges. Using the above conditions,
combined with boundary conditions for the applied potential, Φ1(-d) = V1, Φ2(d) = V2, where V1
and V2 are the applied potential at each electrode (x = d), the Laplace equation in both liquid
domains is solved. The interfacial COF occurs at an AC frequency where conductive charging
completely balances dielectric polarization, and the net charge across the interface is zero. This
condition occurs when the normal electric field (
) is continuous across the liquid-liquid
interface,
Figure 8. Illustration of frequency-dependent MW polarization.

17
df1dx
-df2dx
= f = 0 Equation 4
Based on the two-domain solution to the 1D Laplace equation, this liquid interfacial COF occurs
when ( )
It is important to note that f(ω) is a complex function, and has both real
(in-phase with the applied field) and imaginary (out of phase) parts. The electric field is applied
as a single sinusoid, so there is no phase gradient, and charging is driven by the in-phase
component (real part) of the electric field. Thus, the predicted crossover frequency (ωco) where
induced interfacial charge vanishes is determined by Re[f(ω)] = 0, or in functional form,
wco =1
2p
s1 -s 2( ) s1 +s 2( )e2 -e1( ) e2 +e1( )
é
ëêê
ù
ûúú
1/2
Equation 5
3.2 Calcium Green-1
Calcium Green-1 (CG1) is a chemical indicator that chealates calcium ions. Calcium
Green-1 is based on an EGTA homologue called BAPTA. BAPTA is a calcium-specific
aminopolcarboxylic acid. Due to the presence of four carboxylic acid functional groups, BAPTA
can bind to two calcium ions. Calcium Green-1 is generally used to measure intracellular Ca2+,
following Ca2+ influx and release, and excitation imaging of Ca2+ in living tissues.16
CG1
shows a 14-fold increase in fluorescent intensity when chelating Ca2+. CG1 is shown in Figure 9
below.17
18
3.3 Biotin and Avidin
Biotin, also known as vitamin H, is a small molecule present in all living cells. Generally present
in small amounts, it is critical for many biological processes. The valeric acid side chain, seen on
the biotin molecule in Figure 1018
, can be derivatized to attach other reactive groups used to bind
biotin to other molecules. Generally, biotin is conjugated to antibodies or enzyme reporters used
to detect target antigens.
Figure 10. Biotin Structure
Figure 9. Calcium Green-1 Structure

19
Due to the large binding affinity of avidin to biotin, any biotin-containing molecules in a
complex mixture can specifically bind to avidin. Avidin is a glycoprotein found in egg whites
and tissues of birds, reptiles, and amphiba. Avidin contains four identical subunits and has a
mass of roughly 66 to 68 kDa. Each subunit can bind to one biotin molecule; thus, a total of four
biotin molecules can bind to a single avidin molecule. The avidin-biotin binding complex is the
strongest known non-covalent interaction between a protein and a ligand. This bond formation is
extremely rapid, and once formed, is unaffected by pH, temperature, organic solvents, and other
deterring agents. These factors alone make the Avidin-Biotin binding complex optimal for
biomedical applications.19

20
Chapter 4
Results and Discussion
4.1 Fluidic Dielectrophoresis Two streams of varying electrochemical properties flow side-by-side to create a liquid-
liquid interface within the T-channel device. The varying electrochemical properties are
conductivity and permittivity. One stream, PBS, has a high conductivity (.29 mS/cm) but a low
permittivity (ε = 80). The other fluid, AHA, has a low conductivity (19 μS/cm) but a high
permittivity (ε = 110). Due to the difference in conductivity and permittivity, the two streams
undergo interfacial polarization as well as liquid displacement. When an electric field is applied
perpendicularly to the interface at low frequencies (1 MHz) the liquid with the higher
conductivity displaces into the liquid with the lower conductivity. When an electric field with a
high frequency (20 MHz) is applied the liquid with the high permittivity displaces into the liquid
with the lower permittivity. The frequency at which no displacement occurs is known as the
COF. This phenomena is illustrated below in Figure 11.12
Given the original conditions, the COF was found to be 7.6 MHz. From here, the electrochemical
influence was studied. The conductivity differences were studied and the influences were
Figure 11. Confocal cross section of the interface

21
compared with theoretical values. At low frequency, below the inverse charge relaxation time,
the high-conductivity stream conducts ionic charge to the interface at a rate faster than can be
removed by the adjacent low-conductivity liquid. As such, the high-conductivity fluid dominates
the polarization of the interface. At high frequency, when ionic charging does not have enough
time to occur, the high-dielectric liquid governs the interfacial charging. Therefore, the net sign
of the induced interfacial charge between the two liquids reverses depending upon the ac
frequency applied, since neither liquid has both greater conductivity and dielectric constant. As
charge reversal can occur, there exists an intermediate frequency where conductive charging is
equally balanced by dielectric charging, and the interface has a zero net charge. The observed
increase in COF with increasing differences in electrical conductivity is consistent with this
argument shown below in Figure 12.12

22
The theoretical line was graphed using Matlab, the code can be found in Appendix A. After
quantifying the influence of conductivity differences between streams, permittivity differences
were evaluated. While increasing conductivity differences leads to an increase in the COF, there
is an opposite affect with permittivity. When the difference in permittivity decreases, the COF of
the system increases. If we reference Equation 5, we can see that this holds true since
permittivity values are in the denominator of the equation, leading to a reciprocal effect. This is
illustrated in Figure 13. The theoretical line was created using the Matlab code in Appendix A,
but instead of inputting a delta sigma, a delta epsilon was plotted.
Figure 12. Comparison between experimental (symbols) and analytical (line) interfacial COF as a
function of the difference in electrical conductivity between each fluid stream, [σ1 – σ2]. Error bars
are of the order of the size of symbols.

23
4.2 Calcium Detection The next experiment proved liquid-liquid interfacial detection was possible by using a
well-known chelator, calcium green, CG1. CG1 was chosen for two main reasons: 1) CG1 has a
high binding affinity for Ca2+
and 2) when binding occurs, the complex fluoresces with a 14-fold
intensity. This increase in fluorescence indicates the reaction is occurring downstream on the
chip. A Dextran bound CG1 molecule was selected for several significant reasons but mainly to
make the system diffusing limited. The concentration of calcium green at the interface was kept
fairly constant during a constant flux of calcium ions. Secondly, having the CG1 bound to a
Figure 13. Comparison between experimental (symbols) and analytical (line) interfacial COF as a function
of the difference in electrical conductivity between each fluid stream, [σ1 – σ2]. Error bars are of the order
of the size of symbols.
24
dextran molecule made for a perfect control experiment. Running the experiment with a dextran
molecule of the same molecular weight revealed whether the reaction was detected by the system
eliminating any concern of diffusional effects. Finally, the CG1 bound to dextran gives way to
more analysis on diffusional effects later on when altering the molecular weight of the dextran
molecule bound to the calcium green.
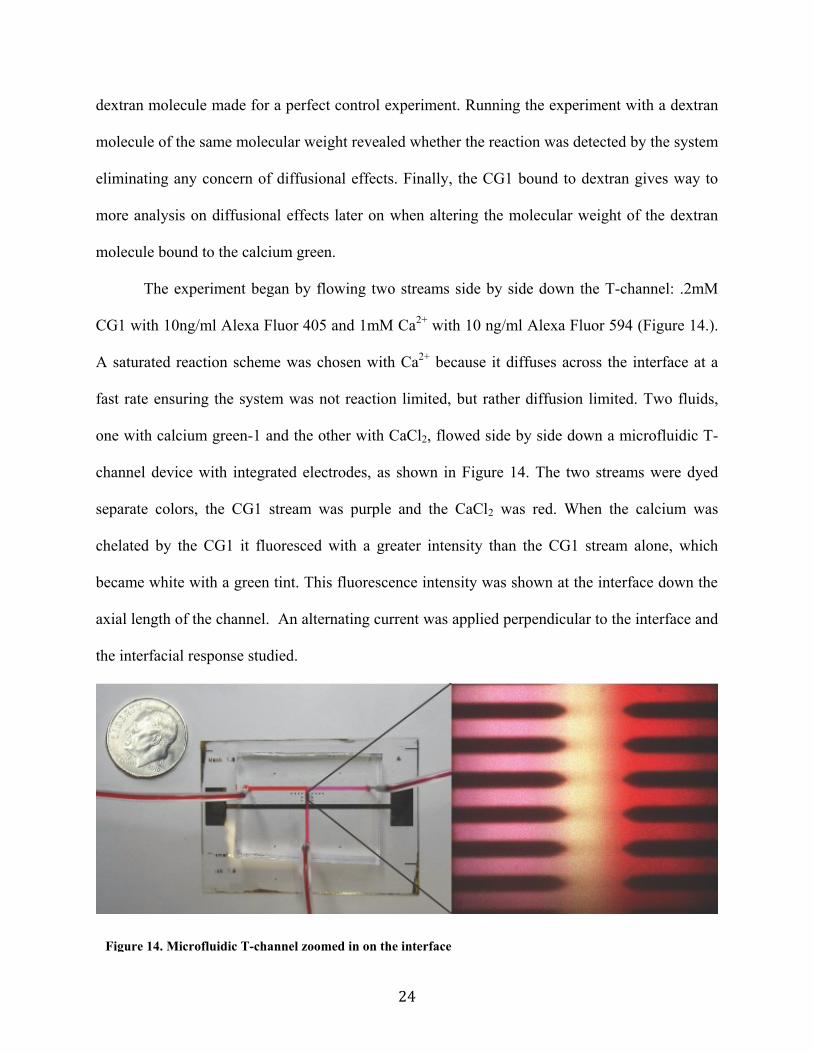
The experiment began by flowing two streams side by side down the T-channel: .2mM
CG1 with 10ng/ml Alexa Fluor 405 and 1mM Ca2+
with 10 ng/ml Alexa Fluor 594 (Figure 14.).
A saturated reaction scheme was chosen with Ca2+
because it diffuses across the interface at a
fast rate ensuring the system was not reaction limited, but rather diffusion limited. Two fluids,
one with calcium green-1 and the other with CaCl2, flowed side by side down a microfluidic T-
channel device with integrated electrodes, as shown in Figure 14. The two streams were dyed
separate colors, the CG1 stream was purple and the CaCl2 was red. When the calcium was
chelated by the CG1 it fluoresced with a greater intensity than the CG1 stream alone, which
became white with a green tint. This fluorescence intensity was shown at the interface down the
axial length of the channel. An alternating current was applied perpendicular to the interface and
the interfacial response studied.
Figure 14. Microfluidic T-channel zoomed in on the interface

25
At low frequencies the high conductive stream deflected into the low conductive stream,
while at high frequencies the deflection reversed. There was a frequency at which no deflection
occurred, known as the crossover frequency (COF). This phenomenon is shown in Figure 15.
with the product shown at the interface.
By measuring the COF changed down the axial length of the stream, it was determined the COF
of the system increased as shown in Figure 16. This COF change was plotted against the
theoretical COF based on the concentration of product and reactants down the axial length of the
channel shown below.
Figure 15. Confocal cross section of the interface. Reaction between CG1 and Ca2+
occurring at the
interface

26
The code for this plot can be found in Appendix B. The change in COF indicates an
electrochemical change occurs at the interface. This change can be accredited to the conductivity
at the interface decreasing down the axial length of the channel. While the conductivity of the
Ca2+
stream remains the same, in order for the COF to increase, the conductivity of the adjacent
stream must decrease. The measured COF of a system is linearly related to the change in
conductivity between the two liquid streams. Since the COF increased down the channel, the
conductivity decreased as more product formed .
Figure 16. Comparison between experimental (symbol) and theoretical (line) COF down the axial length of the
channel

27
This alone was not enough to prove that product detection was occurring; there could
have been other reactions giving rise to a COF change (i.e. nonspecific reactions). Running a
series of control experiments eliminated doubt, shown in Figure 17.
The first control was a fluorescently tagged dextran molecule with the same molecular
weight as CG1 bound to dextran; this was to –eliminate? altered results due to changes in
diffusional properties. When the two streams, Ca2+
and Dextran, flowed side-by-side, a decrease
in the COF down the axial length of the channel was observed, as illustrated in Figure 17. This
Figure 17. Calculated COF down the axial length of the channel for CG1, Dextran (positive control), and
KCl (negative control)
28
shows that while moving axially down the channel, an electrochemical change of the interface
was occurring due to dilution, not a reaction. A control with CG1 was now needed to prove this
method fully. For this purpose, potassium chloride (KCL) was run side-by-side with CG1; a
larger molecule that will not fit in the CG1 binding site. Once again decrease in COF was
observed (Figure 17) illustrating no reaction was present and further indicating product
formation was detected by means of the COF. It is interesting to see that the rate of COF
decrease is different between the two controls. This is due to diffusional differences between the
two molecules. The molecular weight of the dextran used was 3000 g/mol while the molecular
weight of KCl is 74.55 g/mol. Since the KCl can diffuse faster than the dextran, in its respective
system, the COF change is more drastic. Thus, this method of detection at a liquid-liquid
interface can also be used for ion detection. Now, the next step is to determine if this method
could be used as a biosensor to detect specific protein interactions at an interface.
4.3 Avidin-Biotin Reaction Avidin was chosen as the protein of choice for studying the COF of the interaction
because of its high specificity and affinity for the biotin-avidin reaction. Two streams flowed
side-by-side, much like the CG1 experiment, one containing Avidin the other Biotin. The same
experiment was performed as previously with the CG1, studying the COF changes down the
axial length of the channel. A series of three experiments were run to prove this method of
detection was valid: Avidin/Biotin, Biotin/Buffer A, and Avidin/AHA. The last two experiments
were used as controls to determine if any electrochemical changes at the interface in the first
experiment were due to product formation.
29
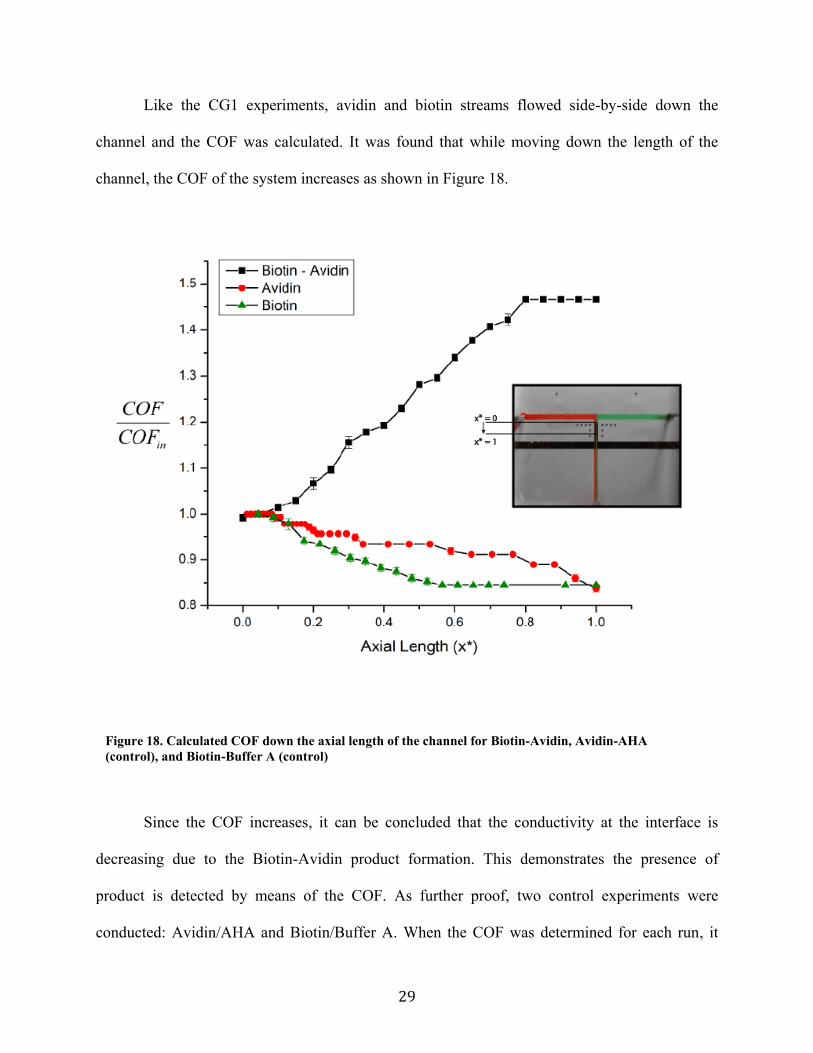
Like the CG1 experiments, avidin and biotin streams flowed side-by-side down the
channel and the COF was calculated. It was found that while moving down the length of the
channel, the COF of the system increases as shown in Figure 18.
Since the COF increases, it can be concluded that the conductivity at the interface is
decreasing due to the Biotin-Avidin product formation. This demonstrates the presence of
product is detected by means of the COF. As further proof, two control experiments were
conducted: Avidin/AHA and Biotin/Buffer A. When the COF was determined for each run, it
Figure 18. Calculated COF down the axial length of the channel for Biotin-Avidin, Avidin-AHA
(control), and Biotin-Buffer A (control)
30
was found that when moving down the axial length of the channel, the COF decreases. This
decrease is the result of dilution at the interface due to diffusion. Additionally, the rate of COF
decrease was found to be different between the two control systems. This further solidifies that
diffusion was the contributing factor in the COF change. Biotin has a molecular weight of 244
Daltons while avidin has a molecular weight of 66,000 Daltons. As a result of the difference in
molecular weight, the diffusion rates of the two molecules are significantly different. This
explains why the COF in the biotin control experiment decreased more rapidly than the COF in
the avidin control, further proving detection and presence of product formation in the previous
experiment where COF increased vs. the latter experiment where COF decreased when one of
the reactants was not present in both systems.
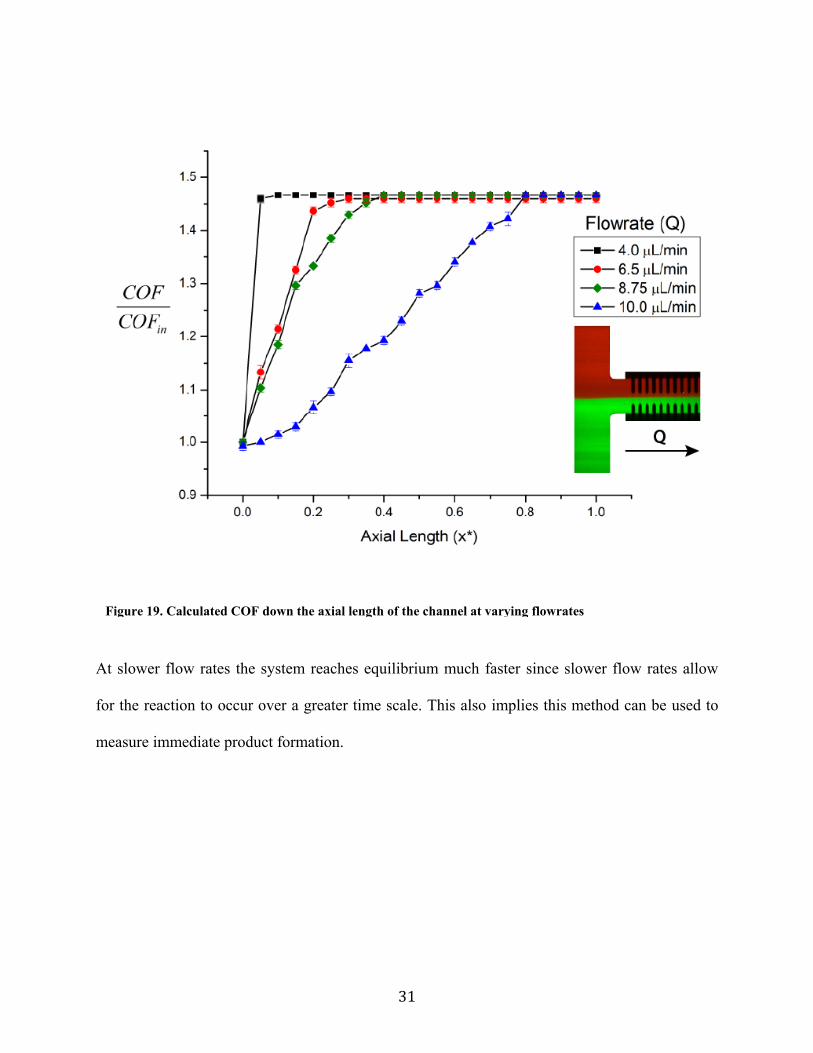
These experiments were run at varying flow rates to determine how the COF values
change with time. This system was run at 4, 6.5, 8.75, and 10 μL/min; the varying COF was
calculated down the channel, shown in Figure 19.
31
At slower flow rates the system reaches equilibrium much faster since slower flow rates allow
for the reaction to occur over a greater time scale. This also implies this method can be used to
measure immediate product formation.
Figure 19. Calculated COF down the axial length of the channel at varying flowrates

32
Chapter 5
Conclusion and Future Work In conclusion, a highly sensitive biosensor was developed utilizing a liquid-liquid
interface. Initially, the effects of disparaging electrochemical properties, conductivity and
permittivity, were quantified. Next, ions were detected within the microfluidic system by
chelating Ca2+
with CG1. The system was then utilized to detect avidin with a biotin reaction. It
was observed that as the Δσ increases, the measured COF increases. A reciprocal effect was
found with permittivity, as the Δε decreases, the measured COF increases. Next, it was observed
as product forms at the interface, the electrochemical properties of the interface change. The
conductivity at the interface decreases leading to an increase in the change in conductivity. This
increase leads to a rise in the COF down the axial length of the channel.
In the future, experiments will be conducted to determine how diffusional effects can
vary the change in the COF. There will be experiments to correlate the magnitude of the COF
directly with the concentration of product formed. Lastly, we must detect more physiological
relevant substrates and use this for more diagnostic applications such as to determine if certain
proteins are present in cancer or HIV patients, foe example. Finally, scientists can use this
method as a multiplexing system. Each reaction will yield a different COF once it has reached
equilibrium, how ever small these variations may be. This property can be utilized and apply
varying COF downstream to determine if certain proteins of interest are present amongst a
variety of proteins in your system.
Utilizing interfacial polarization and frequency-dependent displacement at a liquid-liquid
interface in a lab-on-a-chip device has many benefits over current methods. This paper describes
the creation of a liquid-liquid substrate by which the reaction can occur and be studied.

33
Furthermore, because the transducer is the liquid-liquid interface and the interface is where the
reaction occurs, this method eliminates nonspecific binding. Another interesting characteristic is
that at any given position along the liquid-liquid interface, the resulting reaction occurring is
continuous. As reactions occur, reactants move along the channel, react, and are replaced with
new reactants, allowing for the same reaction to occur over and over. This enables the study and
alteration of a specific point on the reaction kinetic scheme. Finally, this method facilitates
portability. The device is compact, roughly the size of a quarter and as a result, requires a
minimal volume of materials, on the order of microliters.

34
References
1. Dancil, K. P. S., Greiner, D. P., & Sailor, M. J. (1999). A porous silicon optical
biosensor: detection of reversible binding of IgG to a protein A-modified
surface. Journal of the American Chemical Society, 121(34), 7925-7930.
2. Yemini, M., Reches, M., Gazit, E., & Rishpon, J. (2005). Peptide nanotube-modified
electrodes for enzyme-biosensor applications. Analytical Chemistry,77(16), 5155-5159.
3. Millan, K. M., Saraullo, A., & Mikkelsen, S. R. (1994). Voltammetric DNA biosensor
for cystic fibrosis based on a modified carbon paste electrode.Analytical
chemistry, 66(18), 2943-2948.
4. Nguyen, T. A., Yin, T. I., Reyes, D., & Urban, G. A. (2013). Microfluidic chip with
integrated electrical cell-impedance sensing for monitoring single cancer cell migration
in three-dimensional matrixes. Analytical chemistry, 85(22), 11068-11076.
5. Hansen, J. A., Wang, J., Kawde, A. N., Xiang, Y., Gothelf, K. V., & Collins, G. (2006).
Quantum-dot/aptamer-based ultrasensitive multi-analyte electrochemical
biosensor. Journal of the American Chemical Society, 128(7), 2228-2229.
6. Haes, A. J., & Van Duyne, R. P. (2004). A unified view of propagating and localized
surface plasmon resonance biosensors. Analytical and Bioanalytical Chemistry, 379(7-
8), 920-930.
7. Zhang, Y., & Tadigadapa, S. (2004). Calorimetric biosensors with integrated
microfluidic channels. Biosensors and Bioelectronics, 19(12), 1733-1743.
8. Andle, J. C., & Vetelino, J. F. (1994). Acoustic wave biosensors. Sensors and Actuators
A: Physical, 44(3), 167-176.
9. Pattnaik, P. (2005). Surface plasmon resonance. Applied biochemistry and
biotechnology, 126(2), 79-92.
10. Long, D. A., & Long, D. A. (1977). Raman spectroscopy (Vol. 206). New York:
McGraw-Hill.
11. Wu, G., & Zaman, M. H. (2012). Low-cost tools for diagnosing and monitoring HIV
infection in low-resource settings. Bulletin of the World Health Organization, 90(12),
914-920.
12. Desmond, M., Mavrogiannis, N., & Gagnon, Z. (2012). Maxwell-Wagner Polarization
and Frequency-Dependent Injection at Aqueous Electrical Interfaces. Physical review
letters, 109(18), 187602.
13. Baroud, C. N., Okkels, F., Ménétrier, L., & Tabeling, P. (2003). Reaction-diffusion
dynamics: confrontation between theory and experiment in a microfluidic
reactor. Physical Review E, 67(6), 060104.
14. Ebner, A., Marek, M., Kaiser, K., Kada, G., Hahn, C. D., Lackner, B., & Gruber, H. J.
(2008). Application of biotin-4-fluorescein in homogeneous fluorescence assays for
avidin, streptavidin, and biotin or biotin derivatives. InAvidin-Biotin Interactions (pp.
73-88). Humana Press.

35
15. Rigol. DG4102 | 100 MHz Arbitrary Waveform Generator. Retrieved from
http://www.rigolna.com/products/waveform-generators/dg4102/
16. Molecular Probes. Calcium GreenTM-1 dextran, Potassium Salt, 3000 MW, Anioinc.
Retrieved from
https://www.lifetechnologies.com/order/catalog/product/C6765?ICID=search-product
17. Fluorophores. Calcium Green-1. Retrieved from
http://www.fluorophores.tugraz.at/substance/646
18. Biochemistry and Computer Science. Drawing Coenzymes Structures. Retrieved from
http://www.biochemcs.com/coenzymes_structures.htm
19. Sinder, J. Avidin-Biotin Complex Method for IHC Detection. Retrieved from
http://www.piercenet.com/method/avidin-biotin-complex-ihc-detection

36
Appendix
Appendix A: Theoretical Crossover Frequency Matlab Code
clc;
clear all;
splist = logspace(-6,-1,40)
for i = 1:40
sp=splist(i);
e0 = 8.85e-12;
sm = 0.001; %AHA conductivity
em = 110*e0; %AHA perm
%sp = 0.02; %high conductive PBS
ep = 78.2*e0; %perm of PBS
f = logspace(4,10,1000);
w = 2*pi*f;
j = sqrt(-1);
epc = (ep-j*sp./w);
emc = (em-j*sm./w);
cm = (epc-emc)./(epc+emc);
output = real (cm);
%semilogx(f,output);
%xlabel('Frequence (Hz)');
%ylabel('Re[k(w)]');
%root solver
marker = 0;
for k = 1:1000
if output(k)>0
marker = k;
end
end
if marker<1000
if marker>0
xlower = f(marker);
vlower = output(marker);
xupper = f(marker+1);
vupper = output(marker+1);
ratio = vupper/(vlower-vupper);
crossover = xlower+ratio*(xupper-xlower);
else crossover = 0.01;
end
else crossover = NaN;
end
crossoverlist(i) = crossover;
end;
plot((splist-sm),crossoverlist);
xlabel ('Conductivity (Sm^-^1)');
ylabel('Crossover Frequency (Hz)');
%axis([1e-3 1e-1 1e5 1e7]);
hold on

37
data_cond = [0.0194 0.016 0.01 0.005 0.0029 0.051 0.046 0.041 0.036 0.031
0.026 0.061]
data_crossover = [5e6 3.5e6 2.5e6 1e6 0.7e6 10.9e6 9.7e6 8.7e6 7.9e6 7.3e6
5.6e6 14.5e6]
plot((data_cond - sm),data_crossover,'*');

38
Appendix B: Theoretical Crossover Frequency for
Concentration of Product Matlab Code
clc; clear; delta = 0.5; tol = 0.00001; del = 0.5; l=1; %aspect ratio count = 0; a = 0.01; m=0.01; n=100; while count < n count=count+1; b=a+delta; fa=cos(a); fb=cos(b); while fa*fb>0 a=b; b=b+del; fa=cos(a); fb=cos(b); end fm=1; while abs(fm)>tol; m = (a+b)/2; fm = cos(m); if fa*fm<0; b=m; fb=fm; else a=m; fa=cos(m); end end xm(count)=m; a=m+del; end for y=.106

39
counter=0; for x=0:.001:.1 counter=counter+1; xx(counter)=x; sum=0; for i=1:n A(i)=(2/(xm(i))); sum=sum+A(i)*exp(-(xm(i)^2)*x)*sin(xm(i)*y); u(counter)=sum; end
end plot(xx,u,'LineWidth',1.2,'Color','g'); hold on %plot(xx,ushear); xlabel('X*'); ylabel('Dimensionless Concentration'); end

40
Curriculum Vitae
EDUCATION
Johns Hopkins University, Baltimore, Maryland September 2013 – May 2014
Major: Chemical and Biomolecular Engineering Masters of Science Concentration: Biochemical Engineering Expected Graduation: May 2014
Johns Hopkins University, Baltimore, Maryland
May 2013 Major: Chemical and Biomolecular Engineering Bachelors of Science Concentration: Bioengineering
WORK EXPERIENCE
Zachary Gagnon Lab, Baltimore, MD January 2012 - Present Research Assistant
Fabrication in class 1000 clean room with positive and negative photolithography
Design and printing of microfluidic devices with AutoCAD, with translation to postscript
Operation of Nikon confocal and TIRF microscope with NIS Elements software
Study interfacial properties of immiscible and miscible fluids when an electric field is induced. GE Healthcare, Piscataway, New Jersey Summer 2011 Bioprocess Chromatography Engineer
Developed Pressure-Flow curves and resin integrity tests for Capto SR ImpRes resin packed in Axichrom 100 chromatography columns. This data is used to determine optimal packing parameters for the chromatography media/column combination. The data is logged in a company wide library database for GEHC Customer Support personnel.
GE Healthcare, Piscataway, New Jersey Summer 2010 Bioprocess Chromatography Engineer
Developed Van Deemter and Pressure-Flow curves for GEHC Sepharose IEX resin packed in BPG 100 and 200 chromatography columns. This data is used to determine optimal packing parameters for the chromatography media/column combination. The data is logged in a company wide library database for GEHC Customer Support personnel.
PUBLICATIONS
“Maxwell-Wagner Polarization and Frequency Dependent Injection at Aqueous Electrical Interfaces” by Mitchell Desmond, Nicholas Mavrogiannis, and Zachary Gagnon Physical Review Letters. In press October 2012.
AWARDS
Chemical and Biomolecular Engineering Undergraduate Research Award
Chemical and Biomolecular Engineering Excellence Member

![High Performance Liquid Chromatography Incorporating to ...liquid chromatography [1-5, 7, 9, 15-20], gas chromatography [12, 21], micellar electrokinetic capillary chromatography [22],](https://static.fdocuments.in/doc/165x107/609dca3350c83715332046f7/high-performance-liquid-chromatography-incorporating-to-liquid-chromatography.jpg)


