ELECTROENCEPHALOGRAPHIC PATTERNS OF THE GOLDFISH...
18
VOLUME 36, No. 3 SEPTEMBER 1959 ELECTROENCEPHALOGRAPHIC PATTERNS OF THE GOLDFISH (CARASSIUS AURATUS L.)» BY J. P. SCHADfif AND IVAN JEANNE WEILER The Division of Biology, California Institute of Technology, Pasadena, California, U.S.A. (Received 5 August 1958) INTRODUCTION Thefirstrecordings of electrical potentials from the teleost brain were made by Adrian and Buytendijk (1931), who used isolated brain stem preparations from Carassius auratus L. Slow potential changes (1-3 eye./sec.) were recorded from the medulla oblongata, corresponding to the rhythm of the goldfish respiratory activity. Patterns of higher frequency and low amplitude were also recorded from the optic lobes. Enger (1957) has used the codfish (Gadus callarias) for implanted-electrode recordings, which were somewhat obscured by artifacts due to breathing move- ments and to the pressure of the electrodes on the brain surface. He obtained, however, records of the spontaneous electrical activity in the brain of an un- anaesthetized fish, as well as mesencephalic responses to stimulation by light flashes. Waves of a frequency of 8-13 cyc./sec. dominated the electrical pattern of the midbrain; these were compared by Enger to the mammalian alpha rhythm. He found evidence for an arousal reaction in the mesencephalon^ following sudden photic stimulation, but none following auditory stimulation. In a series of studies of the catfish (Ameiurus nebulosus) mesencephalon, Buser (1949a,*, 1950, 1951, 1955), Buser & Dussardier (1953) and Buser & Scherrer (1950) analysed tectal responses to electrical stimuli applied to the cut end of the optic nerve; some initial trials were also made using photic stimulation of the intact eye. A complex response to electrical stimulation was recorded from the surface of the optic tectum with monopolar electrodes; it consisted of two groups of components: (1) an initial rapid complex, consisting of one or several rapid diphasic oscillations (duration 2 msec); followed by (2) a slower component, consisting of one or two larger, slower waves, 20-25 msec, in duration. Upon photic stimulation the first component lasted about 50 msec, the second 100-150 msec. The two com- ponents were dissociable; for example, nembutal applied to the surface of the optic tectum abolished the slow response without affecting the rapid component; the slow response was found only on the optic tectum, never along the optic nerve. Buser therefore concluded that this larger, slower component is postsynaptic in origin. • This investigation was supported in part by Research grants from the National Science Founda- tion, no. C 4029 (J. P. S.) and no. 37085 (I. J. W.), and The Netherlands Organization for Pure Research (Z. W. O.), no. 96-44-66 (J. P. S.)- t Address after August 1959: Central Institute for Brain Research, University of Amsterdam, Mauritskade, Amsterdam. a8 Exp. Biol. 36, 3
-
Upload
truongnhan -
Category
Documents
-
view
218 -
download
0
Transcript of ELECTROENCEPHALOGRAPHIC PATTERNS OF THE GOLDFISH...

VOLUME 36, No. 3 SEPTEMBER 1959
ELECTROENCEPHALOGRAPHIC PATTERNS OF THEGOLDFISH (CARASSIUS AURATUS L.)»
BY J. P. SCHADfif AND IVAN JEANNE WEILER
The Division of Biology, California Institute of Technology, Pasadena,California, U.S.A.
(Received 5 August 1958)
INTRODUCTION
The first recordings of electrical potentials from the teleost brain were made by Adrianand Buytendijk (1931), who used isolated brain stem preparations from Carassiusauratus L. Slow potential changes (1-3 eye./sec.) were recorded from the medullaoblongata, corresponding to the rhythm of the goldfish respiratory activity. Patternsof higher frequency and low amplitude were also recorded from the optic lobes.
Enger (1957) has used the codfish (Gadus callarias) for implanted-electroderecordings, which were somewhat obscured by artifacts due to breathing move-ments and to the pressure of the electrodes on the brain surface. He obtained,however, records of the spontaneous electrical activity in the brain of an un-anaesthetized fish, as well as mesencephalic responses to stimulation by lightflashes. Waves of a frequency of 8-13 cyc./sec. dominated the electrical pattern ofthe midbrain; these were compared by Enger to the mammalian alpha rhythm. Hefound evidence for an arousal reaction in the mesencephalon^ following suddenphotic stimulation, but none following auditory stimulation.
In a series of studies of the catfish (Ameiurus nebulosus) mesencephalon, Buser(1949a,*, 1950, 1951, 1955), Buser & Dussardier (1953) and Buser & Scherrer(1950) analysed tectal responses to electrical stimuli applied to the cut end of theoptic nerve; some initial trials were also made using photic stimulation of the intacteye. A complex response to electrical stimulation was recorded from the surfaceof the optic tectum with monopolar electrodes; it consisted of two groups ofcomponents: (1) an initial rapid complex, consisting of one or several rapid diphasicoscillations (duration 2 msec); followed by (2) a slower component, consisting ofone or two larger, slower waves, 20-25 msec, in duration. Upon photic stimulationthe first component lasted about 50 msec, the second 100-150 msec. The two com-ponents were dissociable; for example, nembutal applied to the surface of the optictectum abolished the slow response without affecting the rapid component; theslow response was found only on the optic tectum, never along the optic nerve.Buser therefore concluded that this larger, slower component is postsynaptic in origin.
• This investigation was supported in part by Research grants from the National Science Founda-tion, no. C 4029 (J. P. S.) and no. 37085 (I. J. W.), and The Netherlands Organization for PureResearch (Z. W. O.), no. 96-44-66 (J. P. S.)-
t Address after August 1959: Central Institute for Brain Research, University of Amsterdam,Mauritskade, Amsterdam.
a8 Exp. Biol. 36, 3

436 J. P. SCHAD^ AND IVAN JEANNE WEILER
In the present study, the electrical activity of the major brain divisions of thegoldfish (Carassius auratus L.) was investigated. Effects of anaesthetic, responsesto optic stimulation, and pathways of optic impulses within the brain were studied,in the following groups of experiments:
(1) Patterns of spontaneous electrical activity were recorded from various partsof the brain, in curarized and unanaesthetized preparations. Surface recordingswere made from telencephalon, mesencephalon, cerebellum and medulla oblongata(Fig. 1). The effect of the level of anaesthesia upon these patterns was studied,ucing different concentrations of urethane (ethyl carbamate).
Telencephalon
Mesencephalon
Cerebellum
Medulla oblongata
I 1
Fig. 1. Dorsal view of exposed goldfish brain (camera lucida drawing). Horizontal line indicates0-5 cm. Bipolar leads were made between: i, left and right telencephalon; 2, two points of leftor right telencephalon; 3, left and right mesencephalon; 4, various points of left and right mesen-cephalon ; s, two points of cerebellum; 6, left and right medulla oblongata; 7, two points of leftor right medulla.
(2) Repetitive light flashes were used to elicit an arousal reaction.(3) The eye was stimulated by single light flashes and responses were recorded
in the four parts of the brain listed above. The optic nerve was then cut on one side,and spontaneous electrical activity and responses to single photic stimuli weresubsequently recorded from the same brain divisions.
(4) Spontaneous electrical activity and responses to single light flashes wererecorded locally from small areas on the surface of the optic tectum. Followingthis, one-quarter to three-quarters of the retina was destroyed by electrocautery,and responses were again recorded from the same tectal areas, in an attempt todescribe the organization of retinal projection on the midbrain.
(5) Microelectrodes were used to record the response to photic stimulation fromdeeper layers of the optic rectum.
MATERIALS AND METHODS
Operations
Seventy goldfish, averaging 13 cm. in length, were used in these experiments. Eachfish was wrapped in wet gauze and held firmly in a screw clamp just behind thegills, with the lower jaw resting in a curved plastic trough. The animal was usually
ElectroencephalograpJric patterns of the goldfish 437
anaesthetized with urethane (0-5-8% in different experiments); the anaestheticsolution was continuously dripped from an elevated vessel, through a tube, intothe mouth and over the gills. When potentials were to be recorded from anunanaesthetized subject, the fish were immobilized by intramuscular injection ofD-tubocurarine (Squibb's 'Intocostrin'), using 0-4 mg./ioo g. body weight.
To expose the brain for recording, the skin was peeled away and the bony braincase was gently removed in small pieces, with a pair of jewellers' forceps. Opera-tions were performed under a binocular dissecting microscope with adjustablemagnification.
Recordings
Recordings were made with an Ofrher electroencephalograph; for surfacerecordings, silver-silver chloride wires were used initially; later, fine-pointed cottonwicks moistened with physiological saline were employed for more precise localiza-tion. Microelectrodes for deep recordings were made from tungsten wire 125/x indiameter, electrolytically sharpened. A modification of the method of Hubel (1957)was used. The wire was suspended between two hooks; it passed through a hole5 mm. in diameter in a nickel plate, in which was suspended a drop of 2M-KOH;the nickel plate and one hook were connected with a 6 V. ax. source. Electrolyticerosion of the wire in the KOH solution resulted in a pair of electrodes whichseparated in the drop. Tips electrolytically sharpened in this manner are 1-5 \L indiameter.
The tungsten wires were then soldered to a thin copper wire for connexion withthe apparatus. The assembly was coated by immersion in Glyptal 1201 Enamel(General Electric), and baked at 125° C. for 1-2 hr. A second coat was applied ifnecessary. Insulation was tested by immersing the electrode in a 1 % NaCl solutionand passing direct current (9 V., electrode negative) through the solution. Hydrogenbubbling was observed only from the uninsulated tip, under the dissecting micro-scope, if insulation was adequate. The completed electrodes were mounted on aplastic rod and secured to a micromanipulator.
For photic stimulation, a Grass photostimulator (PS 2) was employed. Flashduration was 10 /xsec., intensity range between 6 and 100 x io4 f.c. Frequency ofstimulation could be varied between 1 and 100 flashes per second.
Responses were also recorded with a Dumont dual-beam oscilloscope; the flashof the lamp was synchronized with the start of the sweep of one beam, the otherbeam was used as a time signal. Recordings of the oscilloscope picture were madewith a Dumont kymograph camera on photosensitive paper.
RESULTS(1) General characteristics of spontaneous electrical activity of the goldfish brain
The spontaneous electrical activity of various parts of the goldfish brain wasinvestigated in the following stages of activity:
(a) Without anaesthetic: fish immobilized by injection of Intocostrin, or allowedto recover from light anaesthesia by leading fresh water over the gills for 15 min.
28-3

438 J. P. ScHADi AND IVAN JEANNE WEILER
In the latter case, spontaneous tail movements were a sign of recovery fromnarcosis.
(b)' Stage I ' anaesthesia: a light stage of anaesthesia, using J-2 % urethane. Thefish did not react to touch, but did react to more severe stimuli such as introductionof a hypodermic needle into the abdominal wall.
(c)' Stage I I ' anaesthesia: a deep stage of anaesthesia, using 3-5 % urethane. Thefish reacted to neither touch nor injury (such as needle prick).
(d) 'Stage I I I ' anaesthesia: very deep anaesthesia; 6-8% urethane. Recordingswere made both in a darkened, quiet room and in a lighted room with normallaboratory activity.
Although the patterns obtained varied somewhat in different fish, and in the samefish during the course of a single recording, a general pattern of activity can bedescribed for each part of the brain.
Telencephalon (Fig. 2 A, B). The dominant rhythm from the telencephalon of anunanaesthetized fish in a quiet, dark room had a frequency of 4-8 cyc./sec., withan amplitude of 40-70 .̂V. The patterns of the two halves of the telencephalonwere synchronous. A frequency of 9-14 cyc./sec. was also present, becomingrelatively more prominent in a lighted room with normal background noise level.Occasionally a very regular, faster rhythm of 35-40 cyc./sec. dominated the wholepattern of activity; it tended to appear during the later part of the recordingperiods.
Under stage I anaesthesia, the dominant frequency continued to be 4-8 cyc./sec.although faster, lower-amplitude frequencies began to be more noticeable. Understage II, the pattern slowed to 4-6 cyc./sec., while the amplitude decreased, ingeneral falling from 50 to 20/u.V. within a 10 min. period.
Mesencephalon (Fig. 2 C, D). A dominant frequency of 7-14 cyc./sec. prevailedon the surface of the optic tectum in a quiet, dark room. The amplitude was higherthan in the telencephalon (60-180 /AV.). The pattern was synchronized over thetwo halves of the mesencephalon. This dominant frequency was mixed with higherfrequency waves (18-24 cyc./sec.) of lower amplitude. Again, if the room was lightand not perfectly quiet, the higher frequency rhythm became more noticeable,although the 7-14 cyc./sec. pattern continued to dominate the picture.
In stage I anaesthesia, the faster frequency component became less noticeable;the 7-14 cyc./sec. rhythm continued to be dominant but its amplitude was lowered.Then, with increasing depth of narcosis, there was an initial decrease in frequencywith enhancement of amplitude, followed by a period of constant frequency withdecreasing amplitude.
Cerebellum (Fig. 2 E). In either light or dark room, regardless of noise level, therewas a constant 25-35 cyc./sec. frequency in the cerebellum, of a low amplitude(20-50 fxV.). This was not influenced by light anaesthesia. With the oscilloscope,it was also possible to detect an even faster rhythm of 120-180 cyc./sec., with anamplitude of 5-15 fj.V. Under deeper anaesthesia (stages II, III), the patternbecame more irregular, however, with an increasing amount of low-frequencyactivity.

Electroencephalograpkic patterns of the goldfish 439
Medulla oblongata (Fig. 2 F). Activity in the vagal lobes of the medulla oblongatawas characterized by slow (0-5-2 cyc./sec.) potentials of a low amplitude. Two groupsof higher frequency waves were superimposed on this slow rhythm: a pattern of8-11 cyc./sec., dominant in the dark; and an activity of 20-35 cyc./sec, observedduring light narcosis and in a lighted room. This regular, fast activity disappearedunder stage II anaesthesia.
HFig. 2. Recordings from various parts on the brain. A, Recording from two points of right
telencephalon; B, recording from left and right telencephalon; C, recording from two points ofright mesencephalon; D, recording between left and right mesencephalon; E, recording fromcerebellum; F, recording from medulla; G, recording from right mesencephalon; H, recordingfrom left mesencephalon; G and H, horizontal black lines indicate rapid repetitive light flash(75 cyc./sec) with zoxio ' f .c . light intensity. Calibration: vertical line indicates 150 fiV.;horizontal line indicates 1 sec.
In general, it can be seen from the above results that light anaesthesia does notalter the normal electrical pattern of activity of the teleost brain markedly. Forthe last three groups of experiments, therefore, a light level of urethane anaesthesiawas employed for technical reasons.
It appears that each division of the brain is characterized by a distinct and peculiarpattern of frequencies, probably based upon the cyto-architecture, anatomicalconnexions, and function of that section of the brain. The lowest frequency was
44° J- P- SCHAD£ AND IVAN JEANNE WEILER
found in the telencephalon, followed by that in the mesencephalon and then themedulla; the cerebellum had the highest frequency. Amplitude of potentials washighest in the mesencephalon.
(2) Arousal reaction on photic stimulation (Fig. 2 G, H)
An arousal reaction was obtained in unanaesthetized or lightly anaesthetizedfish upon stimulation with repetitive light flashes at a frequency of 50—100 flashesper second. This reaction was most consistently found in the mesencephalon, wherethe 7-14 cyc./sec. rhythm was abruptly replaced by the 18-24 cyc./sec. frequency.Both rhythms are normally present in the spontaneous pattern of the optic tectum,as previously noted; during arousal, however, the faster frequency dominated thepattern. In some cases this arousal reaction was recorded from the telencephalon;here again, a faster component, normally present, became dominant in response torapid repetitive photic stimulation. No arousal reactions were found in cerebellumor medulla oblongata under these conditions.
Although some high-amplitude activity sometimes occurred in the first 250 msec,of high-intensity stimulation, in general the amplitude of the high-frequency waveswas lower than the amplitude of the spontaneous activity before arousal. This briefhigh-amplitude component seemed to be associated with a direct response to thehigh-intensity stimulus. Upon cessation of the repetitive light stimulus, the normalpattern replaced the arousal pattern in all fish, within a period of 1-5 min.; in mostfish it occurred within 20 sec.
The level of anaesthesia of the fish had an important influence upon the arousalreaction. Under stage II anaesthesia, the frequency and amplitude of the responsewas reduced (to 10-18 cyc./sec). Under the deepest anaesthesia, it was possibleto elicit an arousal reaction in only one of eight fish.
(3) Response to single light flashes
The monopolar surface recording shown in Fig. 3 B illustrates the general charac-teristics of the optic tectum response to single light flashes. Various areas of thetectum differed slightly with respect to amplitude and duration of the response, aswill be shown later.
The latency of the response recorded from the mesencephalon of slightlyanaesthetized fish was 30-40 msec. The first part of the response consisted of twoto four rapid diphasic spikes, of 40-50 msec, total duration and about 100 .̂V. ampli-tude. This complex will be referred to.as the 'A complex'. A second portion, the'B complex', consisted of a large negative spike, with a duration of 90-110 msec,and amplitude 100-200 /u,V.; it was sometimes preceded by a small positivedeflexion, and was followed by a slower positive deflexion of 30-40 msec, durationand 30-40 [iV. amplitude. Finally, a slow negative after-potential followed, the' C complex', with a duration of 50-60 msec, and amplitude of 30-50 /u-V. The totalresponse lasted 250-325 msec, and was predominantly negative in character.
In the midbrain of a fish in stage II anaesthesia the A complex was not detectableagainst the background of spontaneous electrical activity; the B complex was

Electroencephalographic patterns of the goldfish 441
reduced in amplitude. In stage III, the amplitude of the B complex was stillfurther reduced.
With a stimulus of low intensity (6-15 x 10* f.c.) no A complex could be detected,and the B complex was of lower amplitude. The effects of low-intensity stimulationwere similar in appearance to the response under stage II anaesthesia. At a stimulusintensity of 40 x 10* f.c. or greater the complete response was recorded.
W^K^k^\^\^»>^H\^
Fig. 3. Recordings from various parts on the brain. A, Bipolar recording from right telencephalon;B, monopolar recording from right mesencephalon; C, bipolar recording from left mesencephalonafter cutting left optic nerve; D, bipolar recording from right mesencephalon after cutting leftoptic nerve; E and F, recording from left mesencephalon, anterolateral portion, before and aftercautery of three quarters of the retina, leaving only the superior nasal quadrant intact; G, bipolarrecording from medulla. Dots indicate single light flashes, duration 10 ^sec., intensity100x 10* f.c. Calibration: vertical line indicates 150 ftV., except in D where it represents250 fiV.; horizontal line indicates 1 sec
If the optic nerve of one eye was severed the spontaneous electrical activityof the contralateral lobe was depressed, and no response to light flashes couldbe elicited (Fig. 3 C, D). Spontaneous activity and responses of the ipsilaterallobe remained unchanged. These findings are in agreement with those of Buser(19496).

442 J- P- SCHAD^ AND IVAN JEANNE WEILER
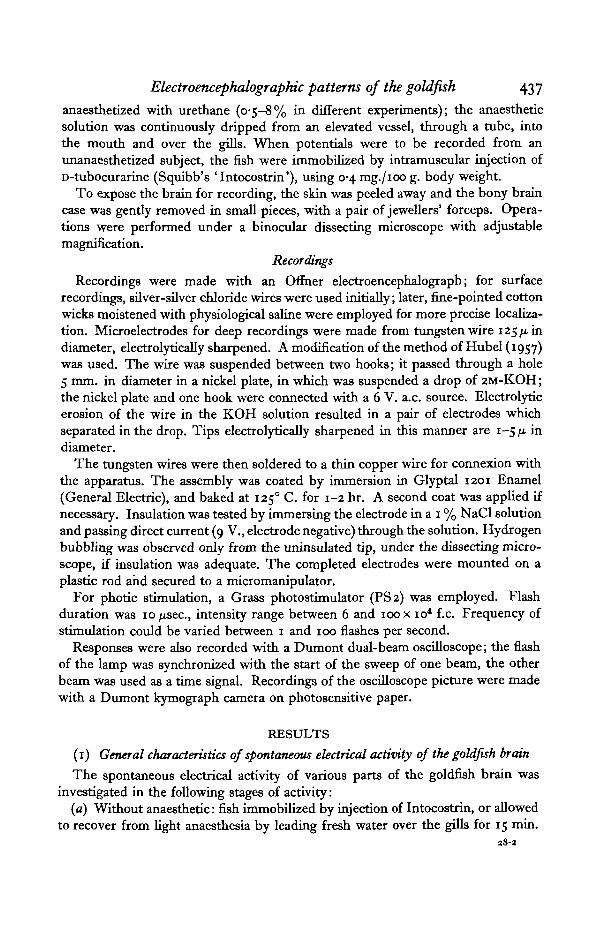
No response to a single light flash could be recorded from the telencephalon(Fig. 3 A) or medulla oblongata (Fig. 3 H). A response was recorded, however, fromthe cerebellum (Fig. 3G). This was a slow negative wave, with a latency of60-80 msec, followed by a small positive deflexion. The duration of this responsewas 60-120 msec.; amplitude was 80-125 .̂V. (Fig- 6). There was no initialcomponent corresponding to the A complex of the tectum. When one optic nervewas cut, this cerebellar response was usually undetectable; it disappeared also understage II anaesthesia.
(4) Localized responses of the optic tectum
Using fine-pointed cotton-wick electrodes, spontaneous electrical activity andresponses to single light flashes were recorded from small areas of the optic tectum.Following this, part of the retina was destroyed by electrocautery and recordingsof spontaneous activity and of responses to flashes were made again from the sameareas.
Two parts of the mesencephalon departed from the general pattern describedabove for response to photic stimulation. In the anterior part of the optic tectumthe A complex was not detectable against the background activity; the B complexwas always present here, however, and its amplitude was higher at the anteriorpole than at any other point on the tectum. The lowest amplitude of the B complex—as little as 50 % of the amplitude found in other tectal areas—was found at theposterior pole.
Destruction of a part of the retina had the following type of effect on the generalphotic response pattern (Fig. 3 E, F): no A complex could be recorded from someregion of the midbrain (in which it had previously been present), and amplitude ofthe B complex was reduced 40-50% in this region.
Fig. 4 summarizes diagrammatically the results of experiments in which therewas destruction of three-quarters of the retina. The left optic tectum is shown, asviewed from above; below it is represented the contralateral (right) eye, with thedestroyed portion blackened. On the tectum one circle represents placement ofbipolar electrodes in a series of different experiments. Open circles indicate tectalareas where response was unchanged after retinal injury; black circles indicateareas of changed response (40-50% lowering of the amplitude of the B complex,and/or absence of the A complex).
After destruction of all but the superior nasal quadrant of the right retina, theresponse to single light flashes remained unchanged in part of the posterolateralportion of the contralateral tectum, and at the anterior pole.
After destruction of all except the inferior nasal quadrant, the response wasunchanged only in a part of the posteromedial portion of the tectum, and theanterior pole.
After destruction of all except the inferior temporal quadrant, response wasunchanged only in part of the anteromedial portion of the tectum.
After destruction of all except the superior temporal quadrant, response wasunchanged only in part of the anterolateral portion of the tectum.

Electroencephalographic patterns of the goldfish 443
In a second group of experiments, only one-quarter of the retina was destroyed,and a search was made for changed response. Results are summarized diagram-matically in Fig. 5, with the left tectum and right eye represented as before.
After destruction of the superior nasal quadrant, the response was changed onlyin part of the posterolateral portion of the contralateral tectum.
Fig. 4. Schematic representation of results obtained by local bipolar recording before and aftercautery of three-quarters of the retina. In the upper row are represented views of the leftoptic tectum, with circles to indicate electrode placement. Each circle indicates one bipolarelectrode placement. Open circles indicate unchanged response; black circles indicate alterationof response. In the lower row, the contralateral (right) eye is shown as viewed from the side ofthe fish. The blackened segments are those destroyed by cautery.
Fig. 5. Schematic representation of results obtained by local bipolar recordings before and aftercautery of one-quarter of the retina. Left tectum and right eye as in Fig. 4.
After destruction of the inferior temporal quadrant, the response was changed inpart of the anteromedial portion of the tectum, and at the posterior pole.
After destruction of the superior temporal quadrant, the response was changedin part of the anterolateral portion of the tectum, and at the posterior pole.
The results obtained in the two sets of experiments, summarized in Figs. 4 and 5,show localizations of changed or unchanged response which are approximatelycomplementary.
The anterior and posterior portions, and the middle portion of each lobe, wereaffected in the same way by destruction of any portion of the quadrant, in contrastto the localized changes found at the margins of the tectum. Possible reasons forthis will be discussed later.
444 J. P. SCHADE AND IVAN JEANNE WEILER
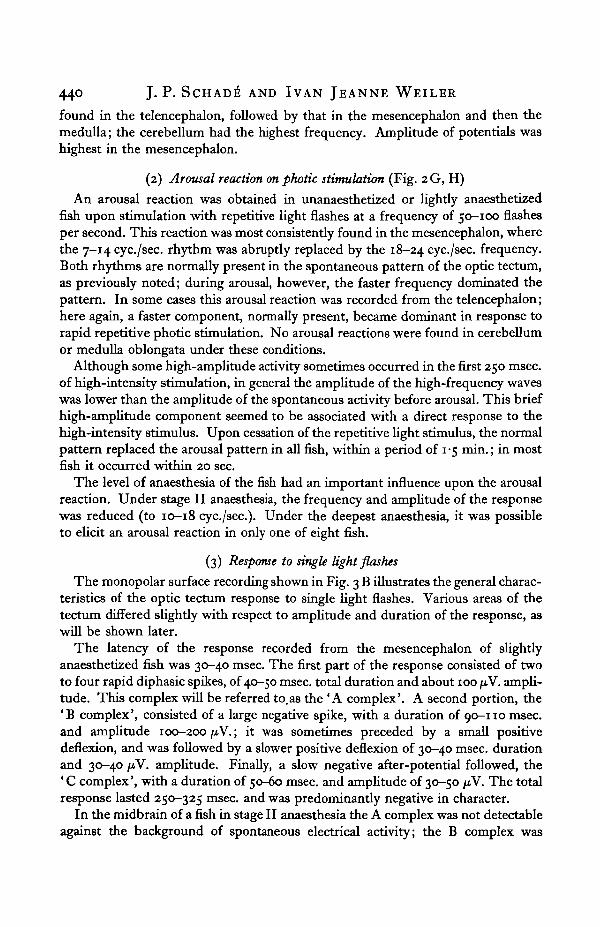
vwwvwvwvvFig. 6. Bipolar recording from the surface of the left cerebellum. Photograph with Dumont kymo-
graph. (Upwards: negative.) Tune signal: 40 cyc./sec., 40 fiV. Single hght flash at the beginningof the recording.
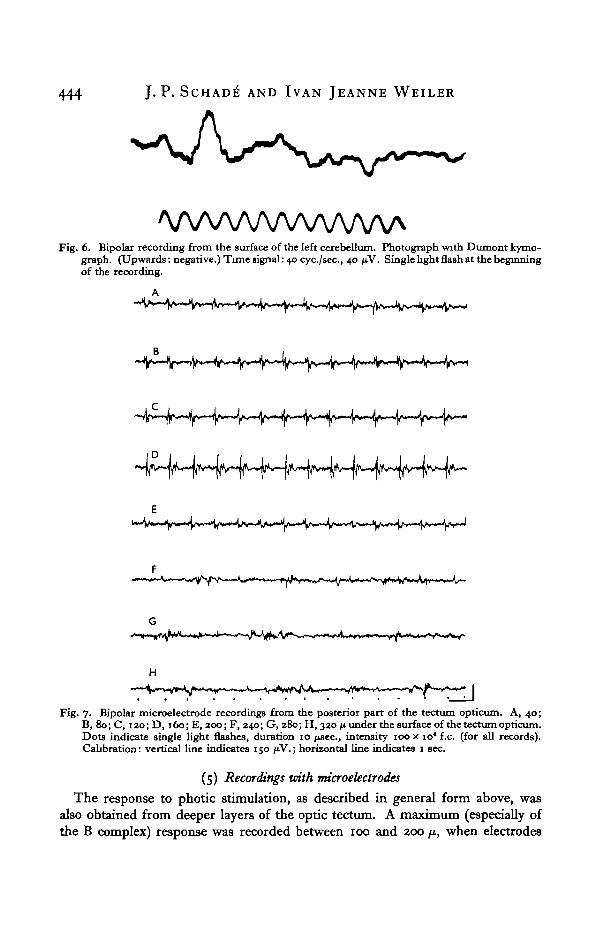
Fig. 7. Bipolar microelectrode recordings from the posterior part of the tectum opticum. A, 40;B, 80; C, 120; D, 160; E, 200; F, 240; G, 280; H, 320/1 under the surface of the tectum opticum.Dots indicate single light flashes, duration 10 /isec, intensity 100 x 10* f.c. (for all records).Calibration: vertical line indicates 150 /*V.; horizontal line indicates 1 sec.
(5) Recordings with mcroelectrodes
The response to photic stimulation, as described in general form above, wasalso obtained from deeper layers of the optic tectum. A maximum (especially ofthe B complex) response was recorded between 100 and 200 /A, when electrodes

Electroencephabgrapkic patterns of the goldfish 445
were placed in the middle and posterior part of the tectum (Fig. 7); deeper thanthis there was no recognizable response. The response was recorded as deep as2000 \L when electrodes were inserted at the anterior pole of the tectum (Fig. 8);this reflected the fact that vertically inserted microelectrodes at this point passed ona tangent to the ventricle, through the grey matter of the curved anterior marginof the optic tectum.
*>*ty™4/-~^f-<*>f'*i*^^
Fig. 8. Bipolar microelectrode recordings from the anterior parts of the tectum opticum. A, 250;B, 500; C, 750; D, 1000; E, 1250; F, 1500 fi under the surface of the tectum opticum. Dotsindicate single light flashes, duration 10 fisec., intensity 100 x io4 f.c. (for all records).
DISCUSSION
(1) It was noted in the results that each part of the brain is characterized by aparticular pattern of electrical activity. The medulla oblongata was characterizedby a slow, low-amplitude rhythm corresponding to the respiratory activity. Thehighest frequencies (25-35 cyc./sec. and 120-200 cyc./sec. were found in thecerebellum. The telencephalon and mesencephalon were characterized by con-siderably lower frequencies, of 4-8 and 7-14 cyc./sec, respectively.
The electrical activity of the medulla and cerebellum was not noticeably in-fluenced by light or noise. In the telencephalon and diencephalon, higher frequencywaves (9-14 and 18-24 cyc./sec), which are of low amplitude in a quiet, dark room,were accentuated when the recording room was light and moderately noisy.
Light anaesthesia did not influence the electrical activity of the medulla orcerebellum. Under deep anaesthesia the frequency of the cerebellar activitydecreased. In both telencephalon and diencephalon the higher frequency wavesbecame less noticeable under light urethane anaesthesia, and the amplitude of the

446 J. P. SCHADE" AND IVAN JEANNE WEILER
dominant lower frequency waves was lowered. As anaesthesia was further deepenedthere was an initial lowering of frequency with enhancement of amplitude of thedominant waves, followed by a period of constant frequency with decreasingamplitude. This pattern follows the sequence of changes in the cortex of the ratduring the progression of urethane narcosis, described by Schade (1957).
Enger (1957), who recorded a dominant frequency of 8-13 cyc./sec. from thecodfish mesencephalon, compared this pattern with the mammalian alpha rhythm.He pointed out that the 8-13 cyc./sec. rhythm recorded in the codfish alternatedwith spindles, and that it was accentuated in quiet and dark but suppressed in noiseand light. It was also more pronounced under light anaesthesia. The mammalianactivity shows similar features. He pointed out that the little differentiated paleo-thalamus of fish may be homologous with the thalamo-reticular system of mammals,and speculated that the presence of the 8-13 cyc./sec. rhythm in the codfishmesencephalon may be associated with the thalamo-reticular system of fish, as thealpha rhythm is believed to be associated with the thalamus of mammals, through areverberating cortico-thalamic circuit.
The patterns of electrical activity recorded in the two halves of the optic tectumwere synchronous. Furthermore, the two halves of the telencephalon producedsynchronous patterns. Since the commissural system between the halves of themesencephalon did not conduct evoked potentials from one half of the mesen-cephalon to the other, in the experiments on monocular blinding, it seems unlikelythat these commissures are involved in the synchronization of the two halves.Another possibility is that the electrical activity of both halves is governed by amore ventral structure in the brain stem, which is either anatomically or functionallyunpaired.
(2) Rapid repetitive flashing consistently caused the appearance of a mesen-cephalic pattern which resembled the typical mammalian arousal pattern (Monizzi& Magoun, 1949). There was a suppression of slower activity and accentuation ofhigh-frequency low-amplitude activity; this pattern disappeared within 1-5 min.after cessation of stimulation, and was replaced by the normal pattern of activity.Since the fish has in its paleothalamus a structure which is homologous with thethalamo-reticular system of mammals, a similar thalamo-reticular activating systemmay be responsible for the arousal in fish as well as mammals.
(3) A response to single-flash stimulation was described from the mesencephalonand cerebellum. The cerebellar response, with a latency of 60-80 msec, can beexpected from the anatomical connexions between tectum and cerebellum.According to Kappers (1936), Goldstein (1905), Brickner (1929), Charlton (1933),Leghissa (1955) and other authors, there is a well-developed projection system fromtectum to cerebellum consisting of both crossed and uncrossed fibres. Althoughthis cerebellar response has not been noted previously in teleosts, it was shown incats recently by Fadiga, Pupilli & von Berger (1957)-
The response from the optic tectum was described in terms of an initial Acomplex and a later B complex. The A complex, being the first event in thesequence of the evoked potential, might be thought of as an action potential of the

Electroencephalographic patterns of the goldfish 447
optic nerve. This initial part of the response pattern was not elicited at the anteriorpole of the optic tectum, although optic tract fibres are concentrated in that region.Furthermore, the A complex has a relatively long latency (30-40 msec). Therefore,the first response recorded can hardly be due to the impulses conducted by theoptic fibres, but must be considered as a synaptic potential.
Buser (1950), in his study of the complex mesencephalic potentials caused byelectrical stimulation of the cut optic nerve, proposed that synchronized activity ofthe deeper cell layers is responsible for the B complex. In the present study theB complex was found to increase in amplitude, with respect to the A complex, asmicroelectrodes were pushed to greater depths of the mesencephalon. A maximumof the B complex was recorded at a depth of about 100-200 (j., which roughlycorresponds to the deep cell layer.
According to Leghissa (1955) the thickness of the deeper cellular layer of thetectum, composed of motor and horizontal associative neurons, is greatest anteriorly.This is the region of the highest amplitude of the B complex. The B complex has areduced amplitude posteriorly, where this layer is thinnest. The greater amplitudeof the B complex in the anterior region of the tectum may be an expression of thegreater thickness of the deeper cell layers in this area.
When the optic nerve of the goldfish was cut on one side, ah1 responses to photicstimulation were abolished in the contralateral tectum, which is explained by thecomplete decussation of the optic nerves (Kappers, Huber & Crosby, 1936). Thereis a well-developed commissural system between the deeper cell layers of the twohalves of the optic tectum. However, the B complex, which as discussed aboveprobably develops in the deeper layers of the unaffected side, apparently did notspread through the intertectal commissural system to the affected half.
After the optic nerve is cut the spontaneous electrical activity of the contralateralhalf of the tectum is reduced; in particular, there is a striking reduction in the low-frequency waves. In the normal fish the amplitude of the spontaneous activity ismaintained and even increased in the dark. It can be expected that in the darkafferent excitation is reduced. Therefore, the reduction of spontaneous activityfollowing monocular blinding probably is not due simply to cessation of nerveimpulses from the optic fibres. It seems possible that the lowered amplitude ofactivity observed is due to a spontaneous discharge from the injured ends of thenerve fibres. Unsynchronized bombardment from this source might cause adecrease in amplitude of the spontaneous activity of the tectum and suppression oflow-frequency activity. Although the pattern somewhat resembles arousal, itprobably is not due to activation of the reticulo-thalamic system since the ipsilateralhalf of the tectum is not affected.
A continuous flow of impulses from severed nerve fibres in fish, like that suggestedhere, was postulated by Parker (1934, 1936) to explain the following experiment.If a small tail area of the killifish {Funduhis) is denervated by a superficial transversecut, the denervated area will at first darken, then fade after a few days. If a newtransverse cut is then made distal to the original cut, a new dark band will appearbetween this cut and the edge of the tail, within the already denervated area. The

448 J- P. SCHAD£ AND IVAN JEANNE WEILER
formation of the dark band in each case is interpreted by Parker as being due to aprolonged discharge of the nerve fibres innervating the melanophores. A coldblock stops these injury-caused impulses and causes fading of the darkened area.
The cerebellar response to optic stimulation is abolished by monocular bunding.This might be attributed in part to a 50% reduction in the number of impulsesarriving at the cerebellum via tecto-cerebellar paths. If considerable facilitationwere needed for this response, this might explain the great effect of a 50% reductionin afferent impulses. Furthermore, this response was found only in fresh prepara-tions and was easily abolished by aging or injury. This may also explain why Buser(1949 a) failed to find a cerebellar response to electrical stimulation of the cut opticnerve in catfish.
(4) It was shown that the retinal projection on to the contralateral optic tectumcould be roughly localized by the use of methods of electrical recording. Talbot& Marshall (1941) have reported a point-to-point projection of the retina on thevisual cortex of the cat and monkey, using electrical recording. An indirect methodof mapping the superior colliculus, based on reflex motor responses, was used forcats by Apter (1945, 1946), and for fish by Chauchard & Chauchard (1927 a, b) andAkert (1947, 1949).
Buser & Dussardier (1953), using electrical recording, have shown that eachretinal quadrant of certain teleost fishes sends fibres to a different part of the opticlobe. Their findings were confirmed in a recent study by Gaze (1958) who used amicroelectrode to explore the surface of the frog mesencephalon. He mappedpoints of maximal response to a small (15") flashing light source. Maximalresponses were used for mapping because responses could be evoked from a singlepoint on the optic lobe by stimulation of an area of 50 to 6o° radius in the visualfield. Despite the overlapping of receptive fields he was able to show a coarsemapping of the retinal projection, such that points on the naso-inferior quadrantof the retina projected to the posteromedial part of the lobe. Points on the temporo-inferior retina projected to the anterior part of the lobe near the midline. Points onthe naso-superior retina projected to the posterior part of the lobe near its lateraledge, while those on the temporo-superior retina projected to the anterior part ofthe lobe near its lateral edge. Recordings made along the midline of one optic lobecorresponded roughly to light stimuli in the central regions of the contralateralvisual field.
A direct method of anatomical localization is based on partial destruction of theretina, followed by Marchi staining of degenerated nerve fibres. This method wasused by Lubsen (quoted in Stroer, 1940), by Stroer (1940) for Sahno salar andClupea harengus, by Akert (1950) for Salmo irideus, and by Leghissa (1955) forCarassius auratus. By this method a coarse projection of the retinal quadrants on thetectum has been demonstrated. The optic nerve divides into two fascicles. Amedial fascicle, derived from the inferior part of the retina, spreads from the anteriorpole of the contralateral tectum on to the dorsomedial surface. A lateral fasciclecarries fibres from the rest of the retina. Fibres (contained in the lateral fascicle)from the superior part of the retina radiate from the anterior pole to the lateral

Electroencephalograpkic patterns of the goldfish 449
surface of the tectum. The nasal retinal afferents terminate on the posterior poleof the tectum, and the temporal afferents on the anterolateral portion of the tectum.
In the recordings of responses to photic stimulation after partial destruction ofthe retina a localization of responses from the various retinal quadrants, aroundthe margin of the tectum, was observed. This localization agreed with that foundby anatomical methods. It was confined to the margins of the tectum, and responsesfrom the anterior, middle, and posterior portions of the tectum were either notaltered (anterior and middle) or always altered (posterior) by partial destruction ofthe retina.
The following working hypothesis of the retinal projection is proposed, based onthe anatomical and electrophysiological findings.
Relevant considerations:
(a) The optic tract arrives at the medio-anterior pole of the contralateral lobeof the optic tectum, and its fibres can be seen to spread in a fan-like fashion over thetectal surface, on gross inspection.
(6) The A complex, as discussed above, is associated with the synaptic con-nexions made between entering optic nerve fibres and the tectal neurons.
(c) The B complex is a sign of subsequent activity in the deeper cell layers.
We assume, for this hypothesis, that soon after reaching the anterior part of thetectum some of the optic nerve fibres, or their branches, make synaptic connexionswith central neurons; they continue to form synapses all along the course of theirspread across the optic tectum. This is suggested by the finding that both A and Bcomplexes can be recorded everywhere on the tectum except from the anteriorpole. The majority of fibres gradually leave the main optic bundles and end at themargin of the tectum on either side of the bundle, establishing the projectiondescribed above. Although some degree of overlapping of this projection can beexpected, the gross localization achieved by this anatomical arrangement is detectedby electrophysiological methods. The tectal area corresponding with a quadrantmapped anatomically is larger than that mapped by electrical methods, which is ameasure of the overlap of the projections.
Since no A complex was led off from the anterior pole of the tectum, there areprobably few if any synaptic endings of the optic axons in this area. A large Bcomplex is found here, however, which may be due to a spread of activity into thedeeper grey matter from adjacent areas. This same spread of activity in the deepercell layers, via horizontal associative neurons, also explains why the B complex isreduced, but not abolished, in the tectal areas which are affected by partial retinaldestruction.
The middle areas of the tectum, according to this hypothesis, will be synapticallyconnected with afferents from the central areas of the retina, including all fourquadrants. This is supported by the results, since both A and B complexes arefound in this middle region when any portion of the retina remains intact. Theposterior pole of the tectum, which showed a changed response after any retinaldestruction, may receive fibres from all areas of the retina.
45° J- P- SCHAD^ AND IVAN JEANNE WEILER
A quantitative consideration may be used to resolve the apparent contradictionin stating that the ending of fibres from all retinal quadrants is responsible for thepresence of not noticeably changed A and B responses in the middle portion of thetectum, while the same anatomical arrangement is also the basis of a change in theevoked response of the posterior pole after destruction of any quadrant of the retina.If one assumes that the connexions between the thick bundles of optic fibres runningover the centre of the tectum and the underlying grey matter are plentiful, then theloss of even a considerable percentage of the afferent impulses may cause changes soslight that they cannot be detected by the relatively coarse electrophysiologicalmethods. On the posterior pole the fibre layer has thinned out considerably,however, and the grey matter is least well developed in this area. A reduction ofthese more sparse connexions may well result in a change in the evoked potential.If considerable spatial summation were involved in the elaboration of the evokedpotential, the effect of even a slight reduction in the number of active nerve fibrescould have a major effect at low levels of innervation. A similar reasoning was usedto explain the absence of a cerebellar response to light flashes in unilaterallyblinded fish.
The coarse, overlapping, localized projection of retinal areas provided by thisworking hypothesis seems to be in agreement with both anatomical and electricalresults.
SUMMARY
1. Bipolar surface electrodes were used to record electrical potentials from thebrain of the goldfish, Carassius auratus L. Characteristic patterns of spontaneouselectrical activity were described for telencephalon, mesencephalon, cerebellumand medulla oblongata. Changes in these patterns under deepening urethanenarcosis were noted.
2. Rapid repetitive flashing light caused a change in the normal pattern of themesencephalon which resembled the mammalian arousal. High-frequency (18—24 cyc./sec.) low-amplitude activity replaced the characteristic low-frequency waves(7-14 cyc./sec.); the lower-frequency activity returned 1-5 min. after cessation ofstimulation.
3. Responses to single light flashes were described from the mesencephalonand cerebellum. An 'A complex' from the mesencephalon consisted of two tofour rapid diphasic spikes, with a latency of 30-40 msec., duration of 40-50 msec,and amplitude of about 100 fiV. A ' B complex' consisted of a large negative wave,duration 90—110 msec, and amplitude 100-200 /xV., followed by a small positivedeflexion, and a slow negative after-potential. The cerebellar response had a latencyof 60—80 msec, duration of 100-120 msec., amplitude of 80-125 /xV. The nature ofthese two components was discussed.
Monocular bunding abolished the response to light in the contralateral half of theoptic tectum and in the cerebellum. The amplitude of the low-frequency spon-taneous activity characteristic of the mesencephalon was reduced in the contra-lateral tectum.
Electroencephalographic patterns of the goldfish 451
4. Regional differences in the tectal response to single light flashes were described.Microelectrodes were used to record the photic response from deeper tectal layers.
After destruction of parts of the retina by electrocautery, a disappearance of theA complex and 40-50% reduction of the B complex was observed in restrictedtectal areas. The distribution of the areas of changed response was shown to cor-respond to a coarse overlapping projection of retinal quadrants of the fish eye on tothe contralateral optic tectum. A possible basis for the localization of this projection,in agreement with anatomical and electrophysiological findings, was described.
REFERENCESADRIAN, E. D. & BUYTENDIJK, F. J. (193 I ) . Potential changes in the isolated brain stem of the
goldfish. J. Pkysiol. 71, 121-35.AKERT, K. (1947). Demonstration ueber die Tectal-funktion beim Raubfisch. Helv. pkytiol.
acta, 5, C-27.AKERT, K. (1949). Der visuelle Greifreflex. Helv. phynol. acta, 7, 112-34.AKHRT, K. (1950). Erperimenteller Beitrag betr. die zentrale Netzhautreprfisentation im Tectum
opticum. Scfnodz. Arch. Neurol. Ptyckiat. 64, 1-16.APTER, J. T. (1945). Projection of the retina on the superior colliculus of cats. J. Neurophytiol. 8,
123-34-APTKR, J. T. (1946). Eye movements following strychninization of the superior colliculus of cats.
J. Neurophysiol. 9, 73-85.BRICKNER, R. M. (1929). A description and interpretation of certain parts of the teleostean midbrain
and thalamus. J. Comp. Neurol. 47, 225—32.BUSER, P. (1949a). Analyse de la reponse mesencephalique a la stimulation du nerf optique chez le
poisson-chat. C.R. Soc. Biol., Paris, 143, 817-19.BUSBR, P. (19496). Contribution a l'£tude des potentiels lents centraux. Analyse de I'activit6
electrique du lobe optique de deux vert^bres inferieurs. Arch. Set. Phystol. 3, 471-88.BUSBR, P. (1950). Caract^ristiques spaualea d'une reponse lente centrale. J. Phystol. (Paris), 43,
557-9-BUSER, P. (1951). Modifications, par la strychnine, de la reponse du lobe optique de poisson. Essai
d'interpretetion. J. Phystol. (Paris), 43, 673-7.BUSER, P. (1955). Analyse des reponses electnques du lobe optique a la stimulation de la voie
visuelle chez quelques vertei>res inferieurs. Thesis, University Press. Paris: Masson.BUSER, P. & DUSSARDIEH, M. (1953). Organisation des projections de la ratine sur le lobe optique,
etudiee chez quelques Teleosteens. J. Pkysiol. (Paris), 45, 57-60.BUSER, P. & SCHKRRER, J. (1950). Potentiels d'action du nerf optique chez le poisson-chat. C.R.
Soc. Biol., Paris, 144, 892-4.CHARLTON, H. H. (1933). The optic tectum and its related fiber tracts in blind fishes. A. Troglichthys
rosae and Typhlichtkys eigenmanm. J. Comp. Neurol. 57, 285-325.CHAUCHAHD, A. & CHAUCHARD, B. (1927 a). Recherches sur les localisations ce'rdbrales chez les
poissons. C.R. Acad. Sci., Paris, 184, 696—8.CHAUCHARD, A. & CHAUCHARD, B. (19276). Les localisations ce'rdbrales motrices chez les verte'bres
inferieurs. C.R. Acad. Sci., Paris, i8g, 667-9.ENGKR, P. S. (1957). The electroencephalogram of the codfish (Gadus callarias). Acta pkysiol. scand.
39. 35-72-FADIGA, E., PUPILLI, G. C. & VON BERGER, G. P. (1957). Cerebellar reactions to the visual system's
activation. Acta pkysiol. pharm. nierl. 6, 284—94.GAZE, R. M. (1958). The representation of the retina on the optic lobe of the frog. Quart. J. Exp.
Physiol. 43, 200-14.GoLDSTETN, K. (1905). Vorderhirn und Zwischenhim einiger Knochenfische. Arch. mikr. Anat.
66, 135-219.HUBEL, D. H. (1957). Tungsten microelectrode for recording from single units. Science, 135,
549-5°-KAPPERS, C. U. ARIENS, HUBER, G. C. & CROSBY, E. C. (1936). The Comparative Anatomy of the
Nervous System of Vertebrates, Including Man. New York: Macmillan Co.LEGHISSA, S. (1955). La struttura microscopia e la citoarchitettonica del tetto ottico dei pesci
teleostei. Z. ges. Anat. 1. Anat. EnttvGesch. 118, 427-63.
29 Exp. BloL 36, 3

452 J. P. SCHADE AND IVAN JEANNE WEILER
MORUZZI, G. & MAGOUN, H. W. (1949). Brain stem reticular formation and activation of the EEG.EEG clin. NeuTopkysiol. 1, 455^73.
PARKER, G. H. (1934). The prolonged activity of momentarily stimulated nerves. Proc. Nat. Acad.Sex. Wash. 20, 306-10.
PARKER, G. H. (1936). Color Changes of Animals in Relation to Nervous Activity. University ofPennsylvania Press.
SCHADE, J. P. (1957). Iso-ohms and relationlines in the electro-corticogram under the influence ofanaesthetics. Ada Physiol. pharmacol. nierl. 5, 292-318.
STROER, W. F. H. (1940). Das optische System beim Wassermolch (Triturus taeniatus) A eta nierl.Morph. 3, 178-95.
TALBOT, S. A. & MARSHALL, W. H. (1941). Physiological studies on neural mechanisms of visuallocalization and discrimination. Amer. J. Ophthal. 24, 1255-64.