Electrochemical Performance Testing - US Department...
22
Electrochemical Performance Testing L. Walker, D. Robertson, J. Basco, P. Prezas and I. Bloom Argonne National Laboratory June 2014 Washington, DC 2014 DOE Annual Merit Review This presentation does not contain any proprietary, confidential, or otherwise restricted information Project ID: ES201
Transcript of Electrochemical Performance Testing - US Department...
Electrochemical Performance Testing
L. Walker, D. Robertson, J. Basco, P. Prezas and I. Bloom Argonne National Laboratory June 2014 Washington, DC 2014 DOE Annual Merit Review
This presentation does not contain any proprietary, confidential, or otherwise restricted information
Project ID: ES201
Overview
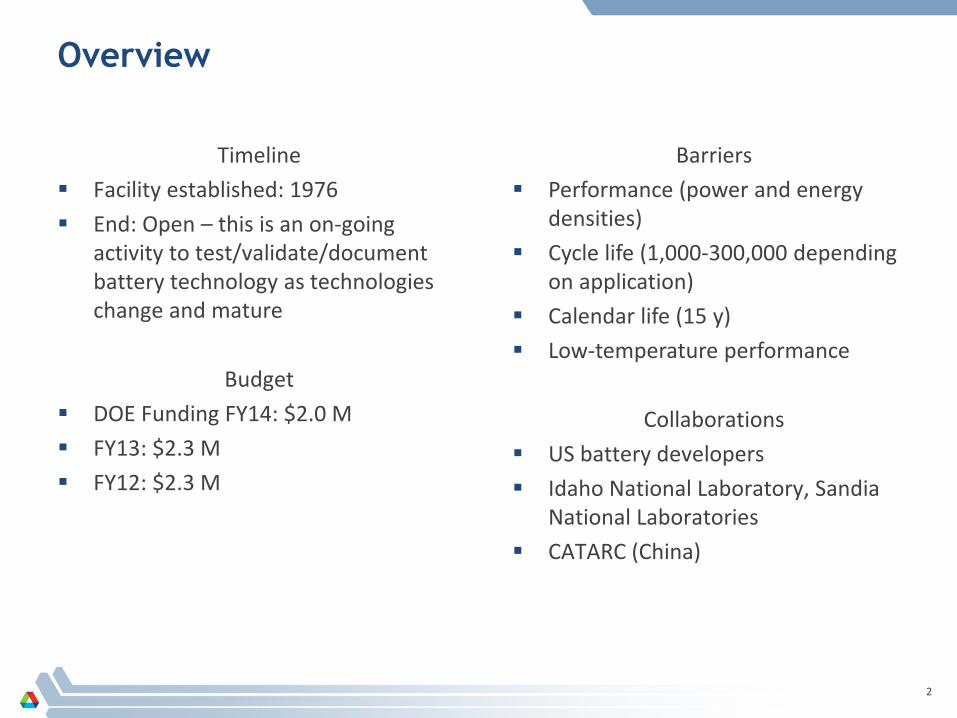
Timeline Facility established: 1976 End: Open – this is an on-going
activity to test/validate/document battery technology as technologies change and mature
Budget DOE Funding FY14: $2.0 M FY13: $2.3 M FY12: $2.3 M
2
Barriers Performance (power and energy
densities) Cycle life (1,000-300,000 depending
on application) Calendar life (15 y) Low-temperature performance
Collaborations
US battery developers Idaho National Laboratory, Sandia
National Laboratories CATARC (China)

Relevance Objective To provide DOE and the USABC an independent assessment of contract
deliverables and to benchmark battery technology not developed under DOE/USABC funding
To provide DOE and the USABC a validation of test methods/protocols To utilize test data to project battery life Approach Apply standard, USABC testing methods in a systematic way to characterize
battery-development contract and benchmarking deliverables Characterize cells, modules and packs in terms of:
– Initial performance – Low temperature performance/Cold cranking – Cycle life – Calendar life
Compare test results to DOE/USABC goals Adapt the test facility hardware and software
– to accommodate programmatic need – to accommodate the unique needs of a given technology and/or deliverable
3

Program Milestones
Milestone Due date Status
Complete testing of JCI/USABC cells
12/31/2013 Delayed. The USABC decided to keep these on test.
Complete testing of ActaCell/USABC cells
3/31/2014 Complete
Complete testing of SKI/USABC cells
6/30/2014 Delayed. The facility moved to a new location
Start testing Leyden Energy cells
9/30/2014 On track
4
All deliverables below were characterized in terms of initial performance, calendar and cycle

Technical Accomplishments: Progress and Results – Testing Contract Deliverables
5
Test deliverables are mostly cell-oriented and include developments in
Deliverables are characterized in terms of initial capacity, resistance, energy and power. They are then evaluated in terms of cycle and calendar life for the given application
Results are used to show progress toward meeting DOE/USABC initial commercialization goals
– Lithium metal anodes – Separators – Advanced cell chemistries (beyond Li-
ion)
– Lithium-ion battery chemistry (graphite anodes)
– Silicon anodes

Progress and Results – Testing Contract Deliverables
Test deliverables come from many developers
6
Developer Sponsor Level Quantity Capacity (Ah) Application StatusUSABC Cell 6 27 PHEV 20 on-goingDOE FOA Cell 18 15 PHEV 20 completeDOE ARRA Cell 6 41, 6 PHEV 20, HEV on-goingUSABC Cell 18 36 PHEV 20 on-goingDOE FOA Cell 18 3 PHEV 20 on-going
SKI USABC Cell 18 40 EV on-goingActacell USABC Cell 9 4 LEESS completeCobasys USABC Cell 15 36.5 EV on-goingDow Kokam DOE FOA Cell 15 2.1 EV on-goingOptoDot DOE FOA Cell 9 2.1 EV on-goingSakti3 USABC Cell 18 0.0024 EV complete3M DOE FOA Cell 18, 6 1.7, 2.7 EV on-goingSeeo DOE FOA Cell 6 0.00897 EV completeTiax DOE FOA (ABR-IC3P) Cell 14 2 based on EV+PHEV on-going3M DOE FOA (ABR-IC3P) Cell 14 0.5 based on EV+PHEV on-goingLeyden Energy USABC Cell 15 2.2 12 V Start/Stop (LMO/LTO) on-goingNavitas DOE FOA Cell 13 5 x 4; 8 x 2 EV on-going
JCI
Progress and Results – Collaborative US/China Protocol Comparison
7
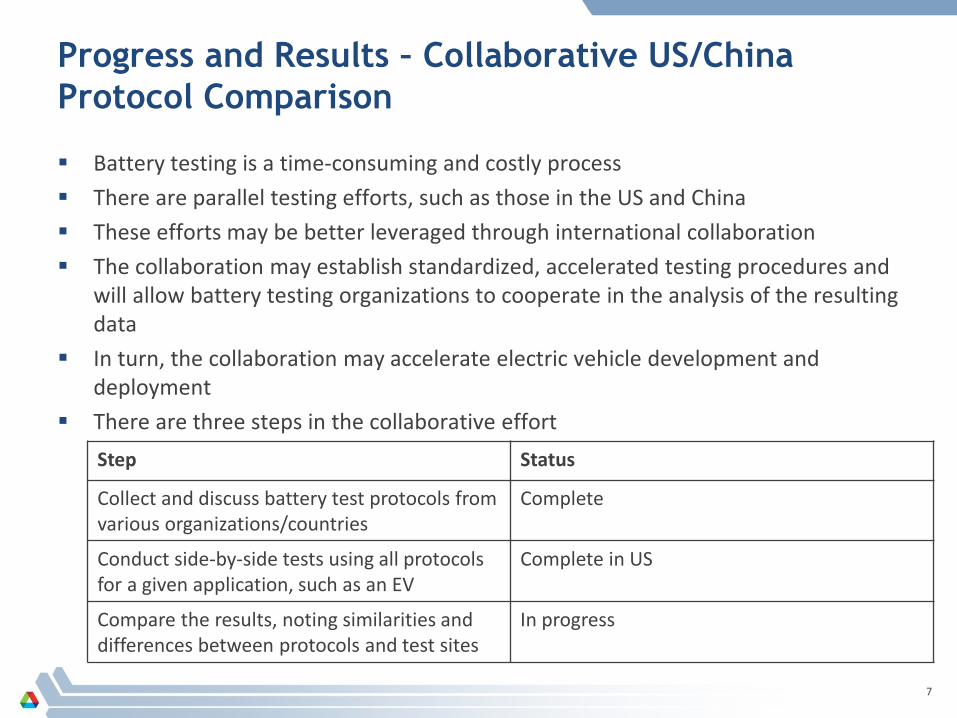
Battery testing is a time-consuming and costly process There are parallel testing efforts, such as those in the US and China These efforts may be better leveraged through international collaboration The collaboration may establish standardized, accelerated testing procedures and
will allow battery testing organizations to cooperate in the analysis of the resulting data
In turn, the collaboration may accelerate electric vehicle development and deployment
There are three steps in the collaborative effort Step Status
Collect and discuss battery test protocols from various organizations/countries
Complete
Conduct side-by-side tests using all protocols for a given application, such as an EV
Complete in US
Compare the results, noting similarities and differences between protocols and test sites
In progress

Conduct Side-by-Side Experiments
A test plan based on an EV application was written and agreed to Commercially-available batteries based on LiFePO4 and carbon were procured.
The batteries were distributed to ANL, INL* and CATARC (China) Initial similarities and differences
• The US cycle-life aging protocol consists of a dynamic, constant-power profile and constant-current charging
• The Chinese cycle-life aging protocol consists of constant-current discharges and charges
• USABC Reference Performance Test consists of 2 capacity cycles, peak power pulse test at 10% DOD increments and full DST cycle. The cells are characterized using these performance tests every 50 cycles
• China Reference Performance Test consists of 1 capacity cycle and 10 second discharge pulse at 50% DOD. The performance of the cells were characterized using these performance tests every 25 cycles
• Both cycle-life protocols terminate discharge at 80% DOD *Jon Christophersen, Taylor Bennet
8
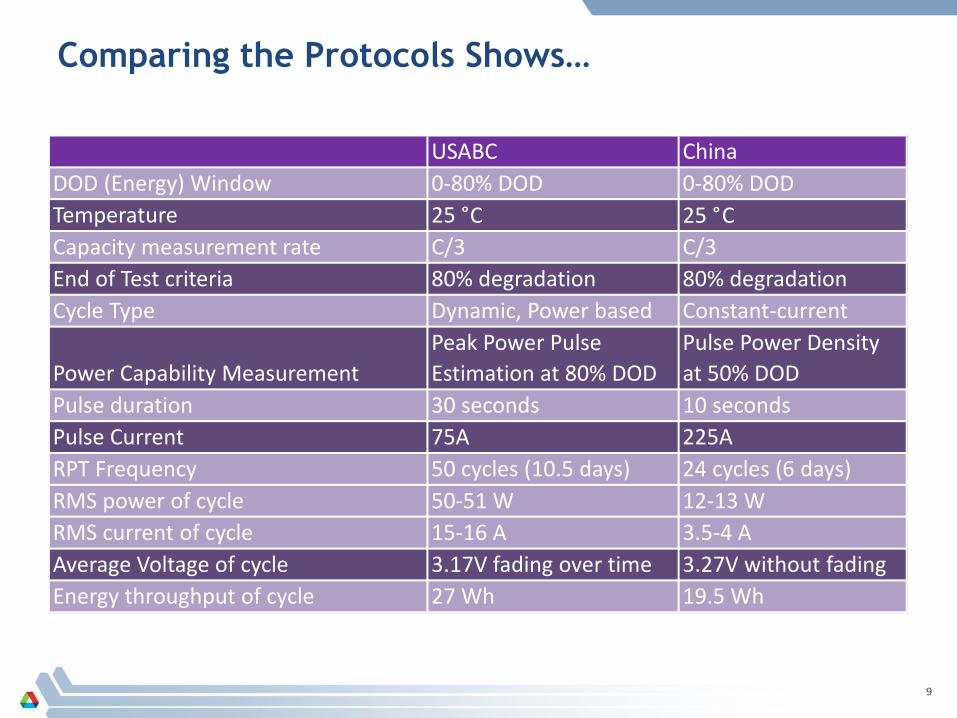
Comparing the Protocols Shows…
9
USABC China DOD (Energy) Window 0-80% DOD 0-80% DOD Temperature 25 °
C 25 °
C
Capacity measurement rate C/3 C/3 End of Test criteria 80% degradation 80% degradation Cycle Type Dynamic, Power based Constant-current
Power Capability Measurement Peak Power Pulse Estimation at 80% DOD
Pulse Power Density at 50% DOD
Pulse duration 30 seconds 10 seconds Pulse Current 75A 225A RPT Frequency 50 cycles (10.5 days) 24 cycles (6 days) RMS power of cycle 50-51 W 12-13 W RMS current of cycle 15-16 A 3.5-4 A Average Voltage of cycle 3.17V fading over time 3.27V without fading Energy throughput of cycle 27 Wh 19.5 Wh

10
Chinese Protocol Results – Effects of Cycling on Resistance and Power
• Power density at 50% DOD decreased ~3.3% over the course of 725 cycles • Resistance at 50% DOD increased ~9.3% • Data from INL and ANL are consistent

11
USABC protocol results – Effects of Cycling on Resistance and Power at 50% DOD
-The effect of USABC DST cycles shows a clear degradation and aging trend in resistance and power capability. -Comparing the 50% DOD pulse show similar beginning of life capabilities for both test methods.
12
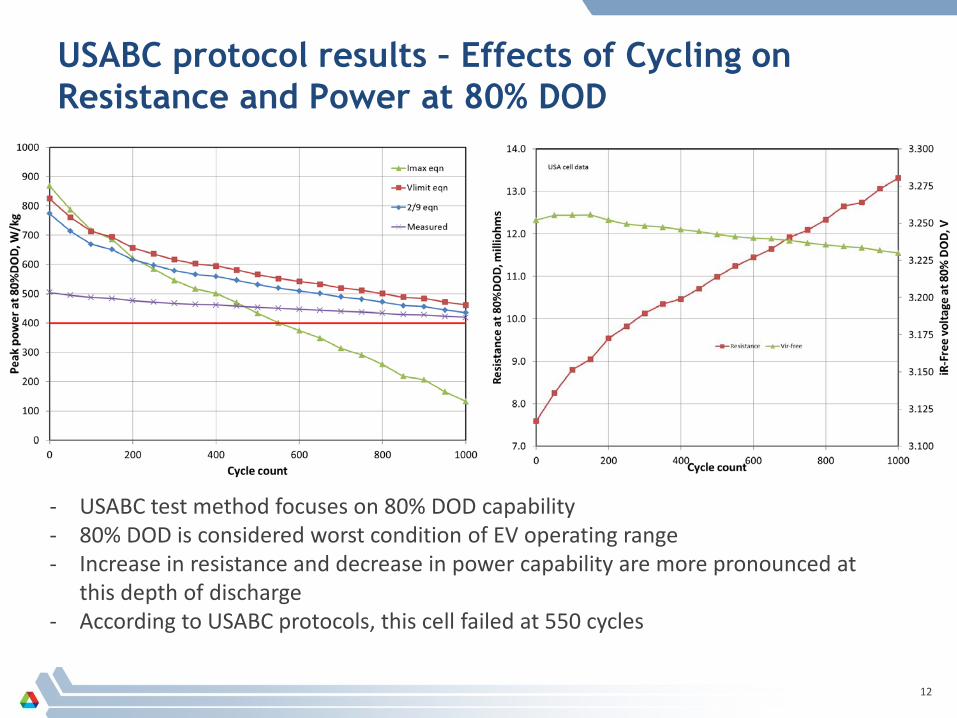
USABC protocol results – Effects of Cycling on Resistance and Power at 80% DOD
- USABC test method focuses on 80% DOD capability - 80% DOD is considered worst condition of EV operating range - Increase in resistance and decrease in power capability are more pronounced at
this depth of discharge - According to USABC protocols, this cell failed at 550 cycles
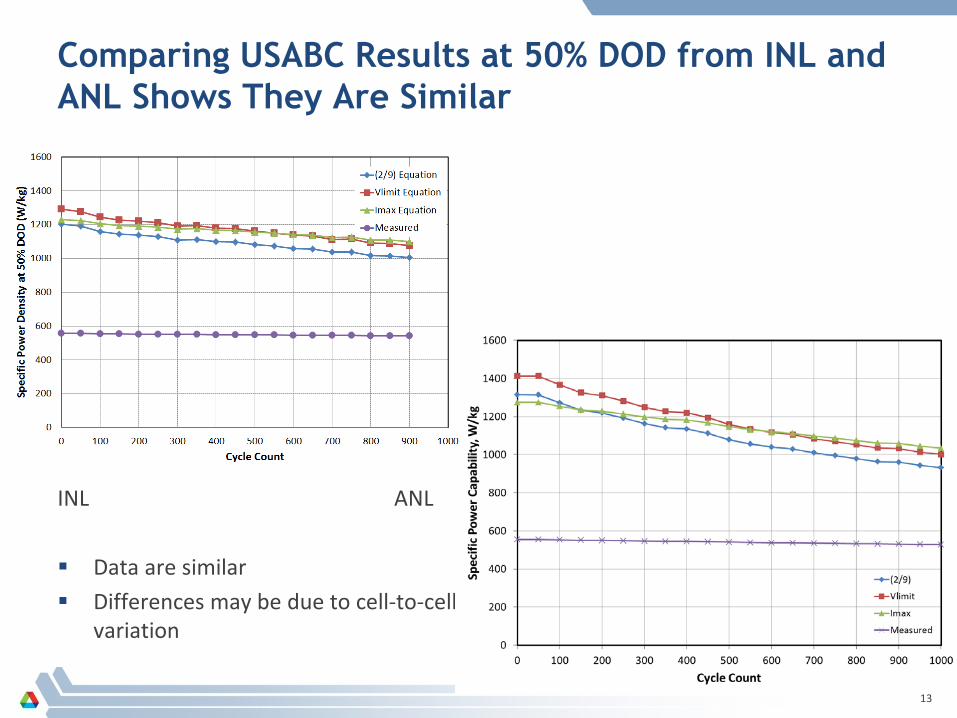
Comparing USABC Results at 50% DOD from INL and ANL Shows They Are Similar
INL ANL Data are similar Differences may be due to cell-to-cell
variation
13
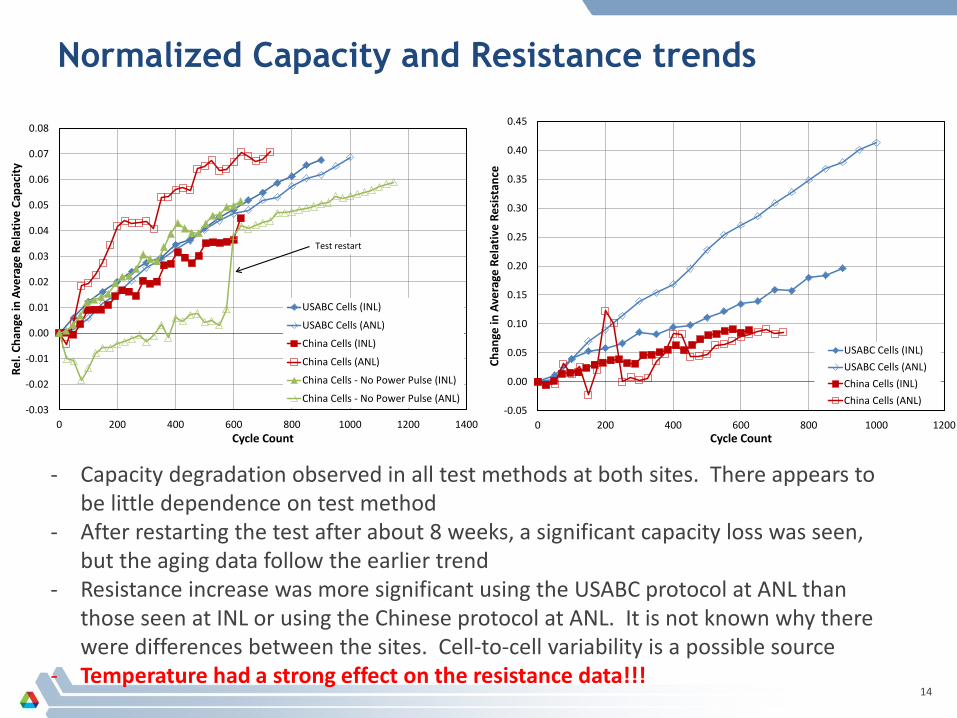
Normalized Capacity and Resistance trends
14
- Capacity degradation observed in all test methods at both sites. There appears to be little dependence on test method
- After restarting the test after about 8 weeks, a significant capacity loss was seen, but the aging data follow the earlier trend
- Resistance increase was more significant using the USABC protocol at ANL than those seen at INL or using the Chinese protocol at ANL. It is not known why there were differences between the sites. Cell-to-cell variability is a possible source
- Temperature had a strong effect on the resistance data!!!
-0.03
-0.02
-0.01
0.00
0.01
0.02
0.03
0.04
0.05
0.06
0.07
0.08
0 200 400 600 800 1000 1200 1400
Rel.
Chan
ge in
Ave
rage
Rel
ativ
e Ca
paci
ty
Cycle Count
USABC Cells (INL)
USABC Cells (ANL)
China Cells (INL)
China Cells (ANL)
China Cells - No Power Pulse (INL)
China Cells - No Power Pulse (ANL)
Test restart
-0.05
0.00
0.05
0.10
0.15
0.20
0.25
0.30
0.35
0.40
0.45
0 200 400 600 800 1000 1200
Chan
ge in
Ave
rage
Rel
ativ
e Re
sist
ance
Cycle Count
USABC Cells (INL)USABC Cells (ANL)China Cells (INL)China Cells (ANL)

Comparing the Results Shows…
• There are similarities and differences in the test protocols • Results indicate that:
• For capacity, the Chinese test protocol produced slightly more fading that the USABC at both ANL and INL
• For resistance, the USABC test protocol caused a greater increase in cell resistance at both test sites
• We still need to compare these results with those from CATARC
15
Progress -- Protocol Validation/Effect of Fast Charge
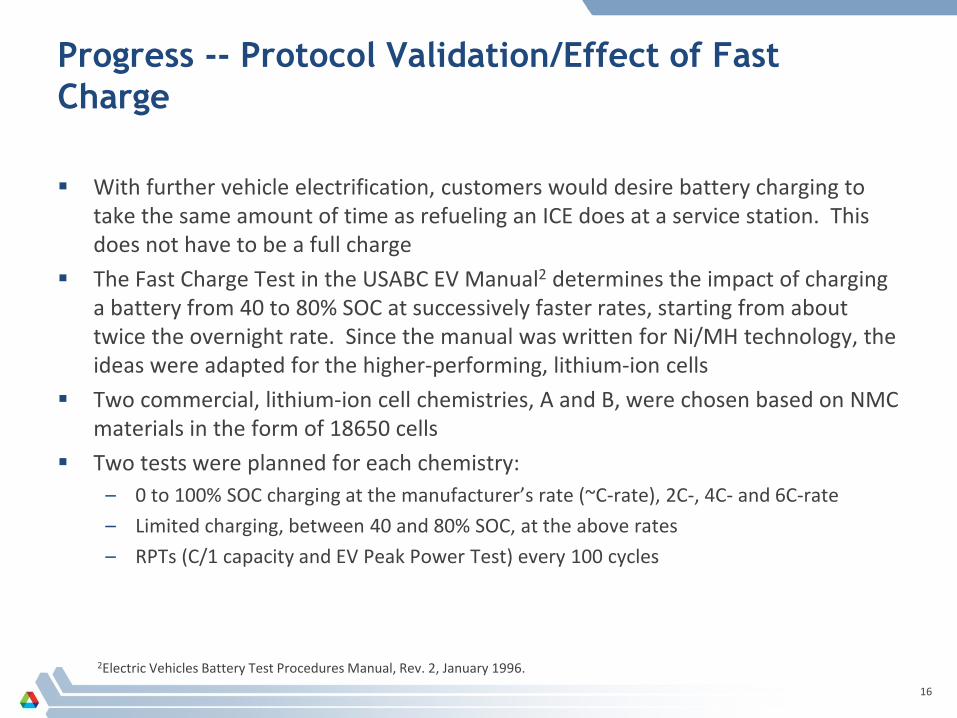
With further vehicle electrification, customers would desire battery charging to take the same amount of time as refueling an ICE does at a service station. This does not have to be a full charge
The Fast Charge Test in the USABC EV Manual2 determines the impact of charging a battery from 40 to 80% SOC at successively faster rates, starting from about twice the overnight rate. Since the manual was written for Ni/MH technology, the ideas were adapted for the higher-performing, lithium-ion cells
Two commercial, lithium-ion cell chemistries, A and B, were chosen based on NMC materials in the form of 18650 cells
Two tests were planned for each chemistry: – 0 to 100% SOC charging at the manufacturer’s rate (~C-rate), 2C-, 4C- and 6C-rate – Limited charging, between 40 and 80% SOC, at the above rates – RPTs (C/1 capacity and EV Peak Power Test) every 100 cycles
16
2Electric Vehicles Battery Test Procedures Manual, Rev. 2, January 1996.
Effect of Fast Charge on Cell Performance – Capacity
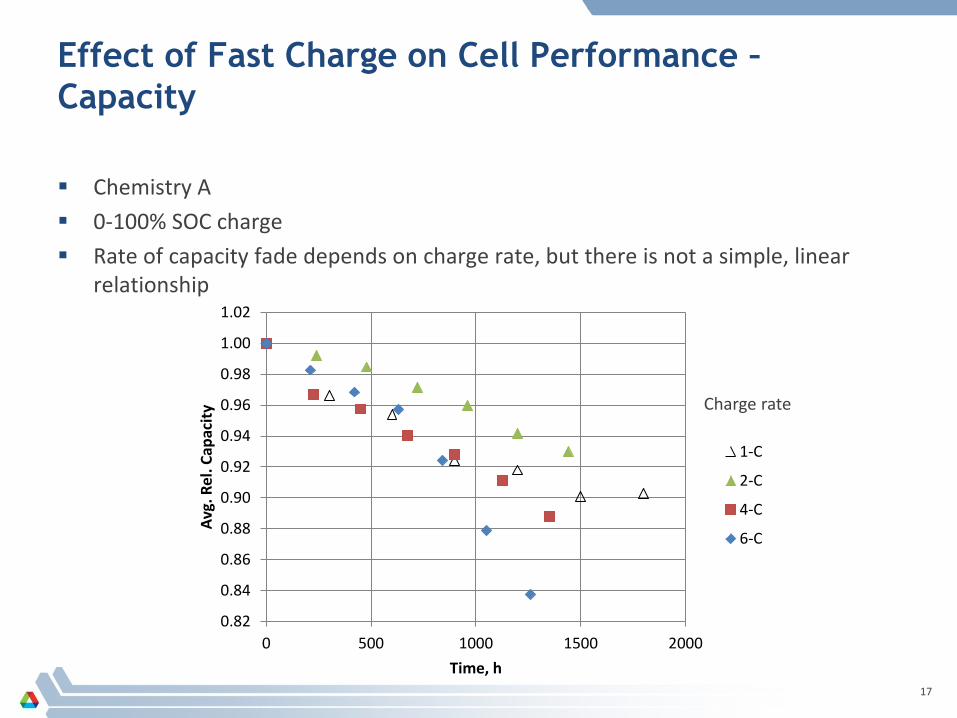
Chemistry A 0-100% SOC charge Rate of capacity fade depends on charge rate, but there is not a simple, linear
relationship
17
0.82
0.84
0.86
0.88
0.90
0.92
0.94
0.96
0.98
1.00
1.02
0 500 1000 1500 2000
Avg.
Rel
. Cap
acity
Time, h
1-C
2-C
4-C
6-C
Charge rate

Effect of Fast Charge on Cell Performance – Cell Resistance
Rate of resistance increase depends on charge rate Rate of resistance increase accelerates with time
18
0
0.5
1
1.5
2
2.5
3
3.5
0 500 1000 1500 2000
Aver
age,
nor
mal
ized
resi
stan
ce
Time, h
1-C
2-C
4-C
6-C
Charge rate
Change in Cell Resistance Depends on Charging Current
19
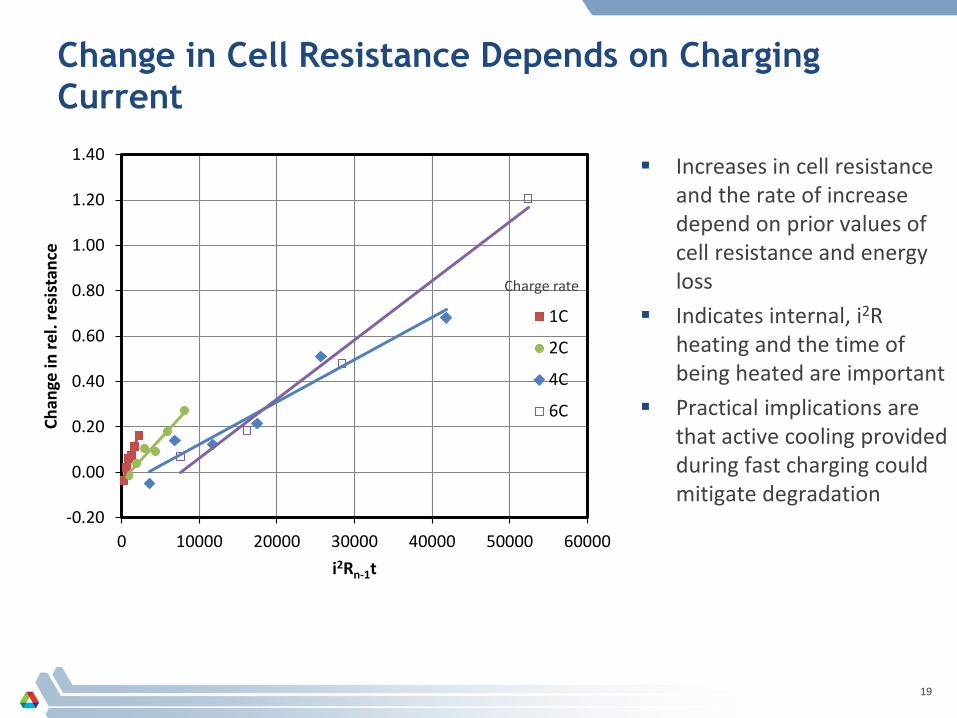
Increases in cell resistance and the rate of increase depend on prior values of cell resistance and energy loss
Indicates internal, i2R heating and the time of being heated are important
Practical implications are that active cooling provided during fast charging could mitigate degradation
-0.20
0.00
0.20
0.40
0.60
0.80
1.00
1.20
1.40
0 10000 20000 30000 40000 50000 60000
Chan
ge in
rel.
resi
stan
ce
i2Rn-1t
1C
2C
4C
6C
Charge rate
Effect of Cell Chemistry on Resistance Increase (1)
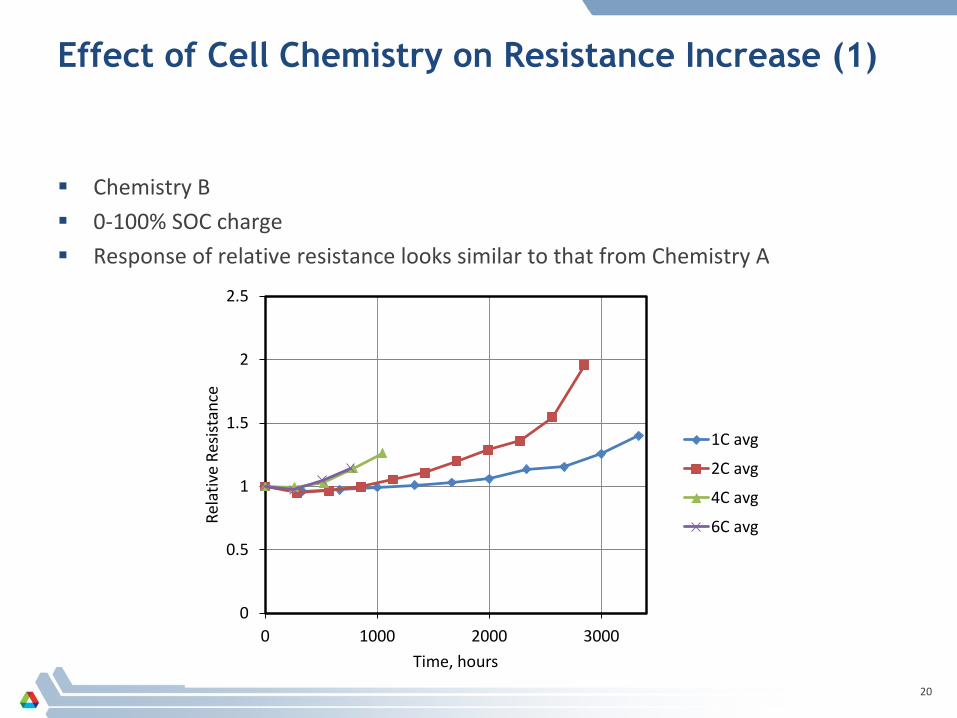
Chemistry B 0-100% SOC charge Response of relative resistance looks similar to that from Chemistry A
20
0
0.5
1
1.5
2
2.5
0 1000 2000 3000
Rela
tive
Resis
tanc
e
Time, hours
1C avg
2C avg
4C avg
6C avg
Effect of Cell Chemistry on Resistance Increase (2)
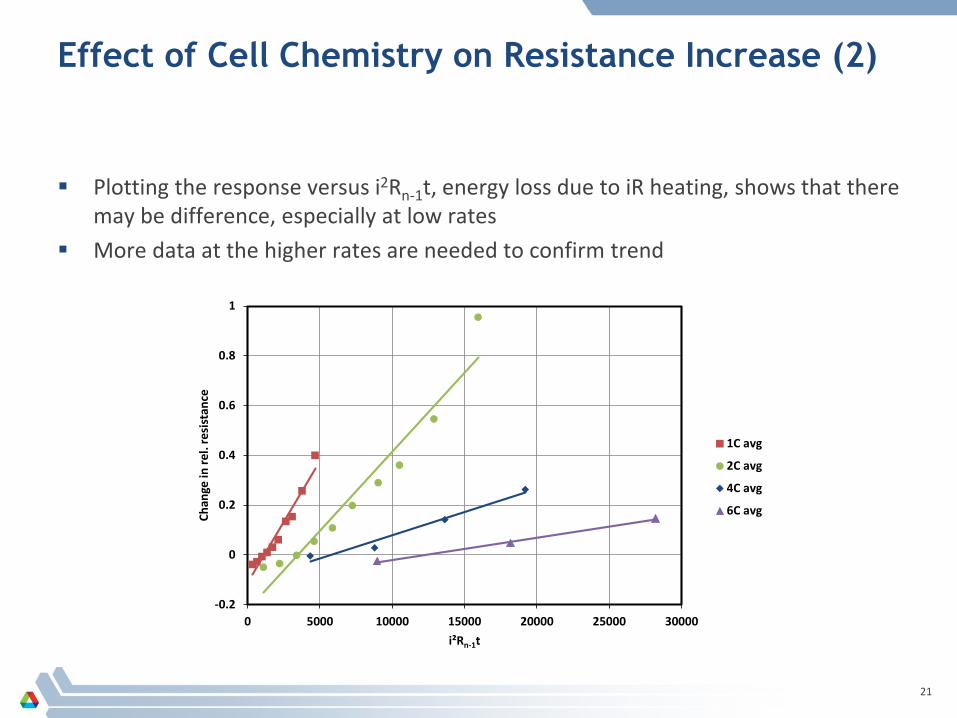
Plotting the response versus i2Rn-1t, energy loss due to iR heating, shows that there may be difference, especially at low rates
More data at the higher rates are needed to confirm trend
21
-0.2
0
0.2
0.4
0.6
0.8
1
0 5000 10000 15000 20000 25000 30000
Chan
ge in
rel.
resi
stan
ce
i²Rn-1t
1C avg
2C avg
4C avg
6C avg
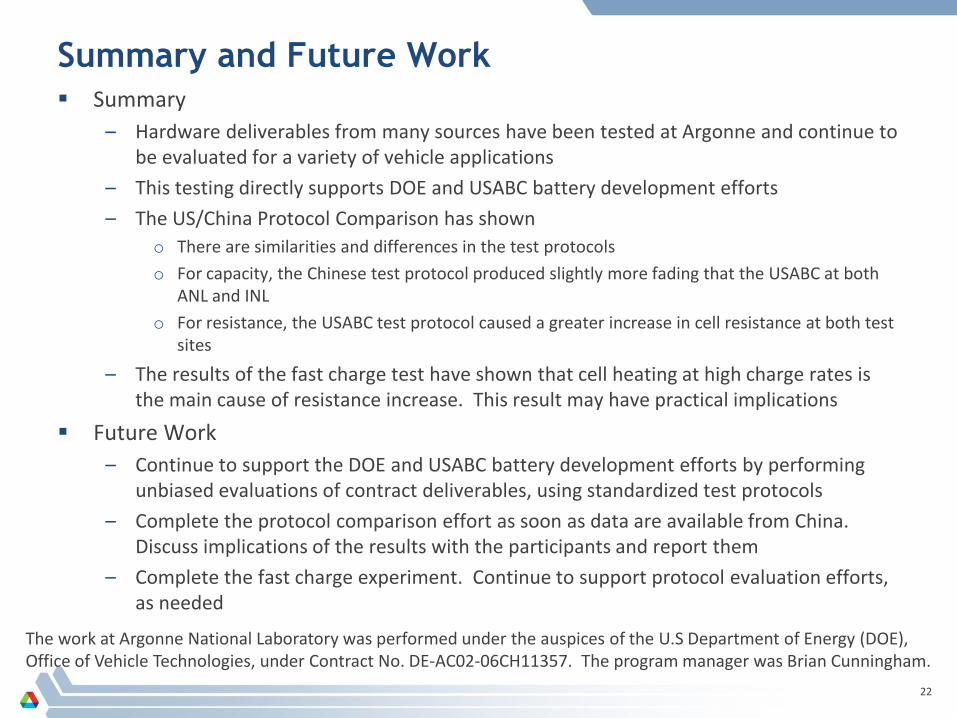
Summary and Future Work Summary
– Hardware deliverables from many sources have been tested at Argonne and continue to be evaluated for a variety of vehicle applications
– This testing directly supports DOE and USABC battery development efforts – The US/China Protocol Comparison has shown
o There are similarities and differences in the test protocols o For capacity, the Chinese test protocol produced slightly more fading that the USABC at both
ANL and INL o For resistance, the USABC test protocol caused a greater increase in cell resistance at both test
sites
– The results of the fast charge test have shown that cell heating at high charge rates is the main cause of resistance increase. This result may have practical implications
Future Work – Continue to support the DOE and USABC battery development efforts by performing
unbiased evaluations of contract deliverables, using standardized test protocols – Complete the protocol comparison effort as soon as data are available from China.
Discuss implications of the results with the participants and report them – Complete the fast charge experiment. Continue to support protocol evaluation efforts,
as needed
22
The work at Argonne National Laboratory was performed under the auspices of the U.S Department of Energy (DOE), Office of Vehicle Technologies, under Contract No. DE-AC02-06CH11357. The program manager was Brian Cunningham.


![e-beam [F17] LVL is a direct substitute for F17 hardwood at … Documents... · 2016-06-27 · e-beam+ [F17] LVL is a direct substitute for F17 hardwood at competitive prices and](https://static.fdocuments.in/doc/165x107/5f7b53a68440c74fd0043c36/e-beam-f17-lvl-is-a-direct-substitute-for-f17-hardwood-at-documents-2016-06-27.jpg)


