Electrochemical and Spectroscopic Studies on the Interaction of Malachite Green with DNA and Its...
8
Full Paper Electrochemical and Spectroscopic Studies on the Interaction of Malachite Green with DNA and Its Application Xuan Hu, Kui Jiao,* Wei Sun, Jia-Yu You College of Chemistry and Molecular Engineering, Qingdao University of Science and Technology, Qingdao 266042, P.R. China *e-mail: [email protected] Received: September 30, 2005 Accepted: December 20, 2005 Abstract The interaction of malachite green (MG) with double-stranded DNA (dsDNA) in pH 7.0 Britton – Robinson (B – R) buffer solution was investigated by electrochemical and spectrophotometric methods. Within the potential scan range of 1.0 to þ 1.5 V (vs. SCE), MG has two oxidative peaks at 0.547 V and 0.833 V and one reductive peak at 0.362 V on cyclic voltammogram at the scan rate of 0.20 V/s. After the addition of dsDNA into the MG solution, the oxidative peak current at 0.547 V decreases obviously. The electrochemical parameters, such as the charge transfer coefficient (a), the surface reaction rate constant (k s ) and the diffusion coefficient (D), were calculated and compared between in the absence and presence of dsDNA. The results show that these parameters of MG after adding dsDNA have greatly changed, which indicates that an electrochemical active complex was formed. The interaction mechanisms of MG with dsDNA are discussed in some details from the electrochemistry and UV-vis spectrophotometry. The reduction of the peak current of MG after adding dsDNA was further used for the quantification of dsDNA by differential pulse voltammetry (DPV). The linear range for dsDNA is in the range of 10.0 – 100.0 mg/mL with the linear regression equation as Di p (mA) ¼ 0.065 þ 0.0096 C (mg/mL) and the detection limit of 6.0 mg/mL (3s). The influences of coexisting substances were investigated and artificial samples were determined with satisfactory results. Keywords: Malachite green, DNA, Electrochemistry, Glassy carbon electrode, Interaction DOI: 10.1002/elan.200503438 1. Introduction DNA (deoxyribonucleic acid) is one of the most important biomacromolecules in life processes as the carrier of genetic information. It is well known that DNA can be damaged by various physical treatments and chemical reagents (such as UV light, ionizing radiation and photoexcited dyes), which can lead to harmful mutations, cell death and cancer [1]. The nature and dynamics of low molecular weight compounds binding to DNA have become an active area of scientific researches. Various methods, such as gel electrophoresis, footprinting technique, X-ray crystallography, fluorescent spectroscopy, have been used for these researches [2]. Electrochemical methods have also been used to investigate the binding of redox substances such as metal complexes [3 – 5], anticancer or antivirus drugs [6 – 9] and organic dyes [10 – 12] to DNA. The main advantages of the electro- chemical methods are direct, simple and sensitive, so they have received more and more attention recently. Malachite green (MG) is a cationic dye, which belongs to triphenylmethane dye family and its structure is shown in Figure 1. It has been used as an effective compound in the treatment of external fungal and protozoan infections of fish. MG has the potential of carcinogenicity, mutagenity and teratogenicity [13 – 16]. It was never registered as a veterinary drug for use in food fish. The study of MG binding to DNA assists the understanding of the mechanism of carcinogenicity and mutagenity from the molecular level. Huang et al. [17], Fang et al. [18] and Feng et al. [19] had used resonance light scattering technique to study the interaction between MG and DNA and found that the surfactants such as cetyltrimethylammoniumbromide can enhance the signal of resonance light scattering. However, to our knowledge no attention has been paid to the electrochemical study on the interaction between MG with DNA. In this paper, the electrochemical and UV-vis spectro- photometric studies on the interaction between MG with fish sperm dsDNA in pH 7.0 Britton – Robinson (B – R) buffer were described. The experimental results show that MG could bind DNA to form a complex mainly by intercalation. From the electrochemical measurements, the diffusion coefficient and the surface reaction rate constant of this complex are smaller than those of MG, respectively, resulting in the decrease of the current of the voltammetric peak of MG after adding dsDNA. The decrease of the peak current is directly proportional to the concentration of dsDNA, which can be used to establish a new electroanalytical method for quantitating dsDNA. 613 Electroanalysis 18, 2006, No. 6, 613 – 620 # 2006 WILEY-VCH Verlag GmbH&Co. KGaA, Weinheim
Transcript of Electrochemical and Spectroscopic Studies on the Interaction of Malachite Green with DNA and Its...
Full Paper
Electrochemical and Spectroscopic Studies on the Interaction ofMalachite Green with DNA and Its Application
Xuan Hu, Kui Jiao,* Wei Sun, Jia-Yu You
College of Chemistry and Molecular Engineering, Qingdao University of Science and Technology, Qingdao 266042, P. R. China*e-mail: [email protected]
Received: September 30, 2005Accepted: December 20, 2005
AbstractThe interaction of malachite green (MG) with double-stranded DNA (dsDNA) in pH 7.0 Britton – Robinson (B – R)buffer solution was investigated by electrochemical and spectrophotometric methods. Within the potential scan rangeof �1.0 to þ1.5 V (vs. SCE), MG has two oxidative peaks at 0.547 V and 0.833 V and one reductive peak at 0.362 V oncyclic voltammogram at the scan rate of 0.20 V/s. After the addition of dsDNA into the MG solution, the oxidativepeak current at 0.547 V decreases obviously. The electrochemical parameters, such as the charge transfer coefficient(a), the surface reaction rate constant (ks) and the diffusion coefficient (D), were calculated and compared between inthe absence and presence of dsDNA. The results show that these parameters of MG after adding dsDNA have greatlychanged, which indicates that an electrochemical active complex was formed. The interaction mechanisms of MG withdsDNA are discussed in some details from the electrochemistry and UV-vis spectrophotometry. The reduction of thepeak current of MG after adding dsDNA was further used for the quantification of dsDNA by differential pulsevoltammetry (DPV). The linear range for dsDNA is in the range of 10.0 – 100.0 mg/mL with the linear regressionequation as Dip (mA)¼ 0.065þ 0.0096 C (mg/mL) and the detection limit of 6.0 mg/mL (3s). The influences ofcoexisting substances were investigated and artificial samples were determined with satisfactory results.
Keywords: Malachite green, DNA, Electrochemistry, Glassy carbon electrode, Interaction
DOI: 10.1002/elan.200503438
1. Introduction
DNA (deoxyribonucleic acid) is one of the most importantbiomacromolecules in life processes as the carrier of geneticinformation. It is well known that DNA can be damaged byvarious physical treatments and chemical reagents (such asUV light, ionizing radiation and photoexcited dyes), whichcan lead to harmful mutations, cell death and cancer [1]. Thenature and dynamics of low molecular weight compoundsbinding to DNA have become an active area of scientificresearches. Various methods, such as gel electrophoresis,footprinting technique, X-ray crystallography, fluorescentspectroscopy, have been used for these researches [2].Electrochemical methods have also been used to investigatethe binding of redox substances such as metal complexes[3 – 5], anticancer or antivirus drugs [6 – 9] and organic dyes[10 – 12] to DNA. The main advantages of the electro-chemical methods are direct, simple and sensitive, so theyhave received more and more attention recently.
Malachite green (MG) is a cationic dye, which belongs totriphenylmethane dye family and its structure is shown inFigure 1. It has been used as an effective compound in thetreatment of external fungal and protozoan infections offish. MG has the potential of carcinogenicity, mutagenityand teratogenicity [13 – 16]. It was never registered as a
veterinary drug for use in food fish. The study of MG bindingto DNA assists the understanding of the mechanism ofcarcinogenicity and mutagenity from the molecular level.Huang et al. [17], Fang et al. [18] and Feng et al. [19] hadused resonance light scattering technique to study theinteraction between MG and DNA and found that thesurfactants such as cetyltrimethylammoniumbromide canenhance the signal of resonance light scattering. However,to our knowledge no attention has been paid to theelectrochemical study on the interaction between MGwith DNA.
In this paper, the electrochemical and UV-vis spectro-photometric studies on the interaction between MG withfish sperm dsDNA in pH 7.0 Britton – Robinson (B – R)buffer were described. The experimental results show thatMG could bind DNA to form a complex mainly byintercalation. From the electrochemical measurements,the diffusion coefficient and the surface reaction rateconstant of this complex are smaller than those of MG,respectively, resulting in the decrease of the current of thevoltammetric peak of MG after adding dsDNA. Thedecrease of the peak current is directly proportional to theconcentration of dsDNA, which can be used to establish anew electroanalytical method for quantitating dsDNA.
613
Electroanalysis 18, 2006, No. 6, 613 – 620 H 2006 WILEY-VCH Verlag GmbH & Co. KGaA, Weinheim
2. Experimental
2.1. Apparatus and Reagents
All the electrochemical experiments were performed with aCHI 832 electrochemical analyzer (Shanghai CH Instru-ment Company, China) using a three-electrode systemcomposed of a glassy carbon electrode (GCE,˘ ¼ 3 mm) asworking electrode, a platinum wire as auxiliary electrodeand a saturated calomel electrode (SCE) as referenceelectrode. The spectroscopic experiments were performedwith a Cary 50 probe UV-visible spectrophotometer (Var-ian, Australia). A pHS-25 acidimeter (Shanghai Leiciinstrument, China) was used for pH measurement.
Native double-stranded fish sperm DNA was purchasedfrom Beijing Jingke Reagent Company and was used asreceived. 1.0 g/L stock solution of dsDNA was prepared bydissolving DNA in doubly distilled water, which gave theratios of UVabsorbance at 260 and 280 nm, (A260/A280), of ca.1.8 – 1.9, indicating that the DNA was sufficiently free fromprotein. MG was obtained from Guangzhou ChemicalReagents Company and a 1.0� 10�3 mol/L solution wasprepared before use. 0.20 mol/L Britton – Robinson (B – R)buffer solution was used to control the pH of the reactionsolution. All the chemical reagents used were of analyticalgrade and doubly distilled water was used throughout.
2.2. Procedure
In a 10 mL colorimetric tube were successively addedappropriate amount of DNA, MG and 2.0 mL of 0.20 mol/LpH 7.0 B – R buffer solution. The mixture was diluted to thescale and mixed homogenously. After reaction at ambienttemperature for 20 min, the solution was transferred into a10 mL electrochemical cell and the electrochemical behav-iors were recorded by different electrochemical techniques.
The instrumental conditions were as follows. The poten-tial-scanning range of cyclic voltammetry was from �1.0 Vto 1.5 V with the scan rate 0.1 V/s. The initial potential inchronocoulometry was at 0 Vand the final potential at 0.7 V,the potential pulse width 0.5 s; the potential-scanning rangeof differential pulse voltammetry was from 0.2 V to 0.7 Vwith the pulse amplitude 0.05 V, the potential pulse width
0.05 s and the pulse period 0.2 s; the quiet time of allelectrochemical measurements was 5 s.
The glassy carbon electrode (GCE) was polished succes-sively with fine emery paper and 0.05 mm a-Al2O3 paste onchamois leather pad prior to each series of experiments.Residual polishing materials were removed by ultrasoniccleaning in 95% ethanol and water for ca. 2 min successively.All the measurements, unless specified otherwise, were theaverage values of at least five-replicated measurements.
The DNA modified electrode was prepared in thefollowing procedure. A freshly polished glassy carbonelectrode was firstly pretreated by applying a potential ofþ1.7 V for 3 min in 0.04 mol/L pH 7.0 B – R buffer solution.Then the electrode was scanned between �0.3 V andþ1.2 V until a steady-state current – voltage curve wasobtained. The freshly pretreated electrode was modified bytransferring a droplet of 10 mL of 1 mg/mL dsDNA solutiononto its surface, followed by air-drying overnight. It was thensoaked in sterile water for more than 3 h and again rinsedwith water to remove unadsorbed DNA. Thus, a dsDNA -modified GCE denoted as dsDNA/GCE was obtained.dsDNA/GCE was immersed into the MG solution for20 min to ensure equilibration, and then the voltammogramwas recorded.
3. Results and Discussion
3.1. Spectroscopic Characterization of MG Interactingwith dsDNA
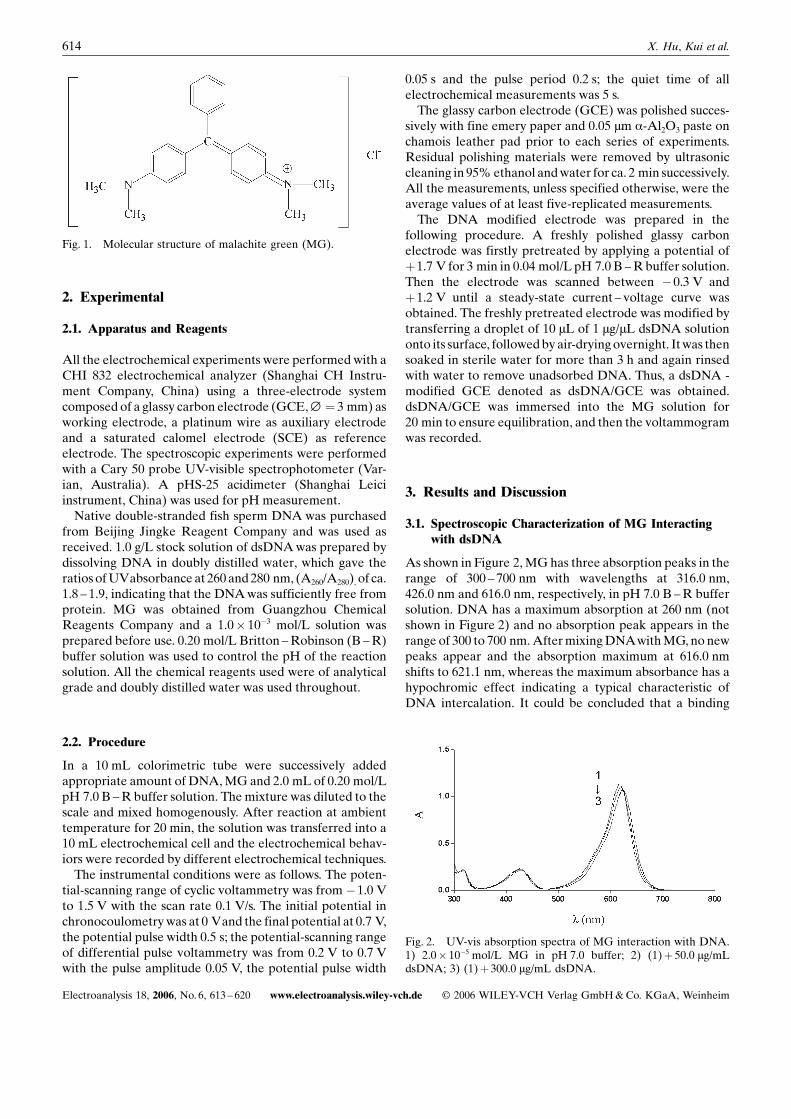
As shown in Figure 2, MG has three absorption peaks in therange of 300 – 700 nm with wavelengths at 316.0 nm,426.0 nm and 616.0 nm, respectively, in pH 7.0 B – R buffersolution. DNA has a maximum absorption at 260 nm (notshown in Figure 2) and no absorption peak appears in therange of 300 to 700 nm. After mixing DNAwith MG, no newpeaks appear and the absorption maximum at 616.0 nmshifts to 621.1 nm, whereas the maximum absorbance has ahypochromic effect indicating a typical characteristic ofDNA intercalation. It could be concluded that a binding
Fig. 1. Molecular structure of malachite green (MG).
Fig. 2. UV-vis absorption spectra of MG interaction with DNA.1) 2.0� 10�5 mol/L MG in pH 7.0 buffer; 2) (1)þ 50.0 mg/mLdsDNA; 3) (1)þ 300.0 mg/mL dsDNA.
614 X. Hu, Kui et al.
Electroanalysis 18, 2006, No. 6, 613 – 620 www.electroanalysis.wiley-vch.de H 2006 WILEY-VCH Verlag GmbH & Co. KGaA, Weinheim
between MG and DNA occurs. The more DNA added, thegreater the absorption value decreased, as shown in curve 2and 3. According to BartonNs [20] results, the intercalationbinding of a low molecular weight compound molecule withdsDNA commonly results in hypochromism and a shift ofthe maximum absorbance to longer wavelength, so themode of MG binding to DNA is partly caused by interca-lation. Since MG is a cationic dye, the electrostaticattraction could also exist, especially at higher pH buffermediate [18, 19] and lower ionic strength [5].
3.2. Electrochemical Characterizations of MG Interactingwith dsDNA
3.2.1. Cyclic Voltammetry
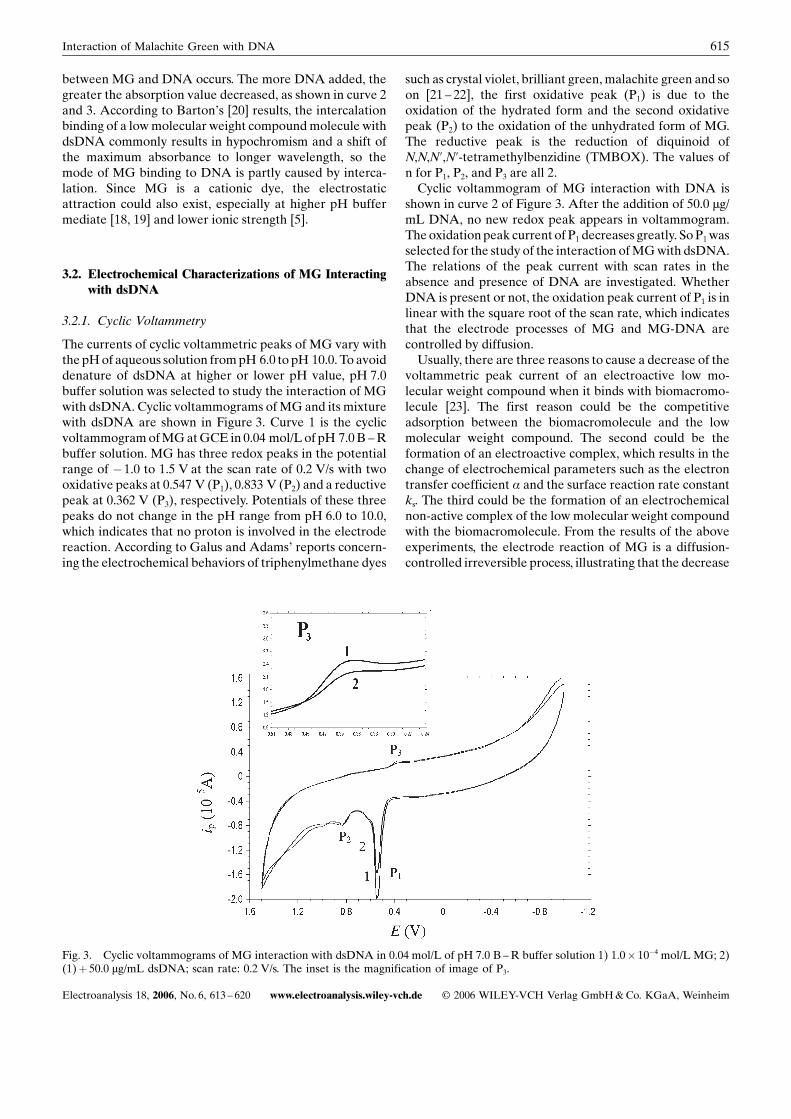
The currents of cyclic voltammetric peaks of MG vary withthe pH of aqueous solution from pH 6.0 to pH 10.0. To avoiddenature of dsDNA at higher or lower pH value, pH 7.0buffer solution was selected to study the interaction of MGwith dsDNA. Cyclic voltammograms of MG and its mixturewith dsDNA are shown in Figure 3. Curve 1 is the cyclicvoltammogram of MG at GCE in 0.04 mol/L of pH 7.0 B – Rbuffer solution. MG has three redox peaks in the potentialrange of �1.0 to 1.5 V at the scan rate of 0.2 V/s with twooxidative peaks at 0.547 V (P1), 0.833 V (P2) and a reductivepeak at 0.362 V (P3), respectively. Potentials of these threepeaks do not change in the pH range from pH 6.0 to 10.0,which indicates that no proton is involved in the electrodereaction. According to Galus and AdamsN reports concern-ing the electrochemical behaviors of triphenylmethane dyes
such as crystal violet, brilliant green, malachite green and soon [21 – 22], the first oxidative peak (P1) is due to theoxidation of the hydrated form and the second oxidativepeak (P2) to the oxidation of the unhydrated form of MG.The reductive peak is the reduction of diquinoid ofN,N,N’,N’-tetramethylbenzidine (TMBOX). The values ofn for P1, P2, and P3 are all 2.
Cyclic voltammogram of MG interaction with DNA isshown in curve 2 of Figure 3. After the addition of 50.0 mg/mL DNA, no new redox peak appears in voltammogram.The oxidation peak current of P1 decreases greatly. So P1 wasselected for the study of the interaction of MG with dsDNA.The relations of the peak current with scan rates in theabsence and presence of DNA are investigated. WhetherDNA is present or not, the oxidation peak current of P1 is inlinear with the square root of the scan rate, which indicatesthat the electrode processes of MG and MG-DNA arecontrolled by diffusion.
Usually, there are three reasons to cause a decrease of thevoltammetric peak current of an electroactive low mo-lecular weight compound when it binds with biomacromo-lecule [23]. The first reason could be the competitiveadsorption between the biomacromolecule and the lowmolecular weight compound. The second could be theformation of an electroactive complex, which results in thechange of electrochemical parameters such as the electrontransfer coefficient a and the surface reaction rate constantks. The third could be the formation of an electrochemicalnon-active complex of the low molecular weight compoundwith the biomacromolecule. From the results of the aboveexperiments, the electrode reaction of MG is a diffusion-controlled irreversible process, illustrating that the decrease
Fig. 3. Cyclic voltammograms of MG interaction with dsDNA in 0.04 mol/L of pH 7.0 B – R buffer solution 1) 1.0� 10�4 mol/L MG; 2)(1)þ 50.0 mg/mL dsDNA; scan rate: 0.2 V/s. The inset is the magnification of image of P3.
615Interaction of Malachite Green with DNA
Electroanalysis 18, 2006, No. 6, 613 – 620 www.electroanalysis.wiley-vch.de H 2006 WILEY-VCH Verlag GmbH & Co. KGaA, Weinheim
of the peak current of MG after adding dsDNA is not causedby the competitive adsorption between MG and DNA. Thereason of the peak current reduction will be demonstratedfrom the following experiments.
3.2.2. Chronocoulometry
Chronocoulometric experiments were carried out to calcu-late the diffusion coefficients (D) of MG and MG-DNA.According to the equation given by Anson [24],
Q¼ 2 nFAD1/2C t1/2/p1/2 þQdl þQads (1)
the parameter D can be calculated from the slope of Q vs.t1/2 plot if the values ofA, n andC are known. Where n is thenumber of electron, F (C/mol) the Faraday constant, A(cm2) the area of the electrode, D (cm2/s) the diffusioncoefficient of species, C (mol/cm 3) the bulk concentrationof species, t (s) the potential pulse width, Qdl (C) thedouble-layer charge (integration of charging current),Qads
(C) the faradic component due to the oxidation ofadsorbed species.
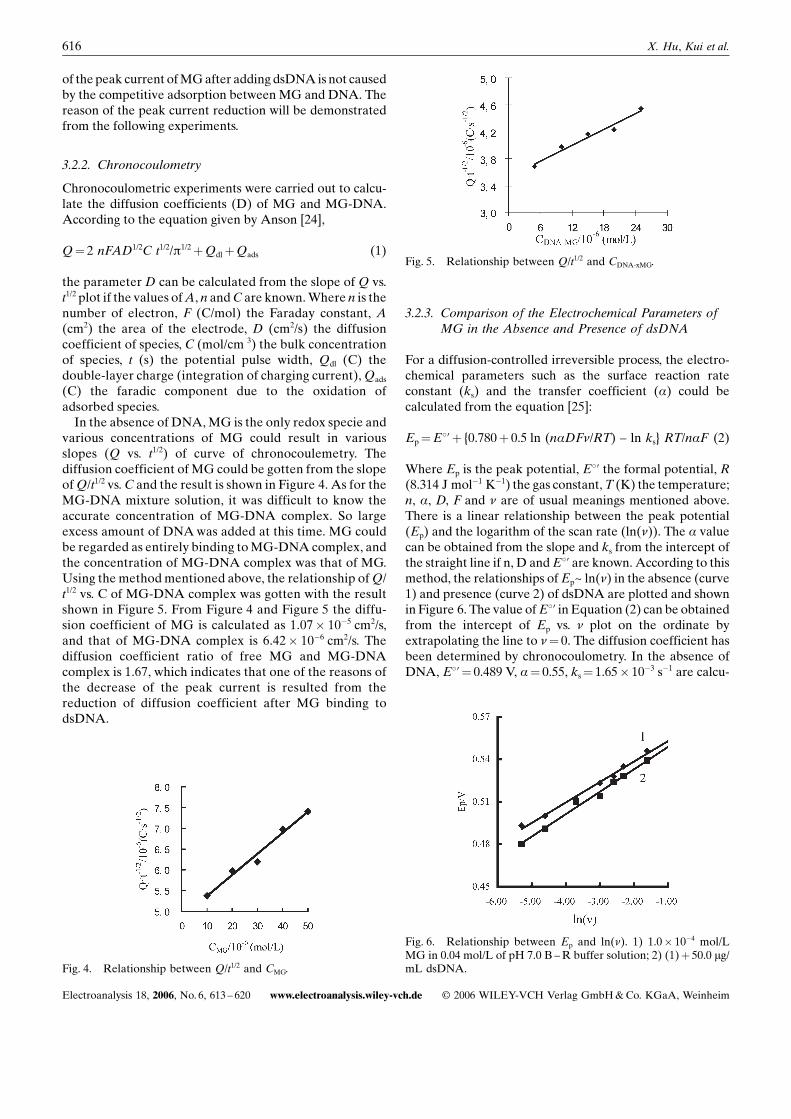
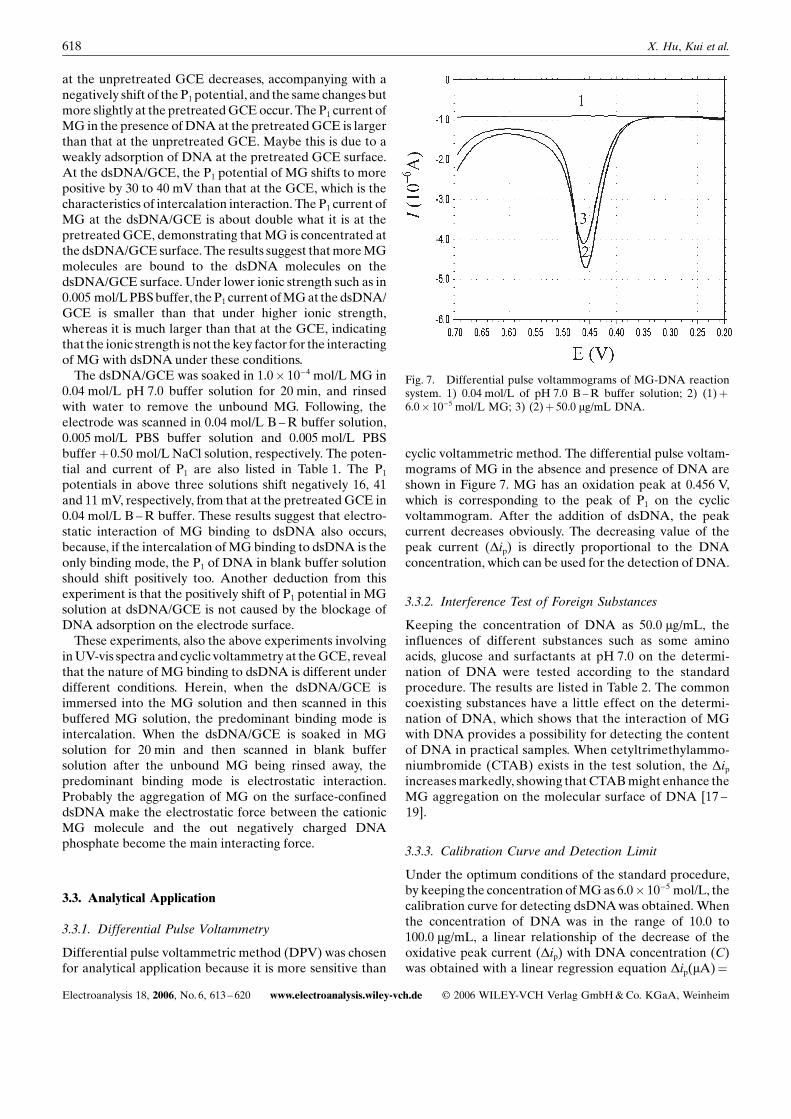
In the absence of DNA, MG is the only redox specie andvarious concentrations of MG could result in variousslopes (Q vs. t1/2) of curve of chronocoulemetry. Thediffusion coefficient of MG could be gotten from the slopeofQ/t1/2 vs.C and the result is shown in Figure 4. As for theMG-DNA mixture solution, it was difficult to know theaccurate concentration of MG-DNA complex. So largeexcess amount of DNA was added at this time. MG couldbe regarded as entirely binding to MG-DNA complex, andthe concentration of MG-DNA complex was that of MG.Using the method mentioned above, the relationship ofQ/t1/2 vs. C of MG-DNA complex was gotten with the resultshown in Figure 5. From Figure 4 and Figure 5 the diffu-sion coefficient of MG is calculated as 1.07� 10�5 cm2/s,and that of MG-DNA complex is 6.42� 10�6 cm2/s. Thediffusion coefficient ratio of free MG and MG-DNAcomplex is 1.67, which indicates that one of the reasons ofthe decrease of the peak current is resulted from thereduction of diffusion coefficient after MG binding todsDNA.
3.2.3. Comparison of the Electrochemical Parameters ofMG in the Absence and Presence of dsDNA
For a diffusion-controlled irreversible process, the electro-chemical parameters such as the surface reaction rateconstant (ks) and the transfer coefficient (a) could becalculated from the equation [25]:
Ep ¼E8’þ {0.780þ 0.5 ln (naDFn/RT) – ln ks} RT/naF (2)
Where Ep is the peak potential, E8’ the formal potential, R(8.314 J mol�1 K�1) the gas constant,T (K) the temperature;n, a, D, F and n are of usual meanings mentioned above.There is a linear relationship between the peak potential(Ep) and the logarithm of the scan rate (ln(n)). The a valuecan be obtained from the slope and ks from the intercept ofthe straight line if n, D andE8’ are known. According to thismethod, the relationships ofEp~ ln(n) in the absence (curve1) and presence (curve 2) of dsDNA are plotted and shownin Figure 6. The value ofE8’ in Equation (2) can be obtainedfrom the intercept of Ep vs. n plot on the ordinate byextrapolating the line to n¼ 0. The diffusion coefficient hasbeen determined by chronocoulometry. In the absence ofDNA, E8’¼ 0.489 V, a¼ 0.55, ks ¼ 1.65� 10�3 s�1 are calcu-
Fig. 4. Relationship between Q/t1/2 and CMG.
Fig. 5. Relationship between Q/t1/2 and CDNA-xMG.
Fig. 6. Relationship between Ep and ln(n). 1) 1.0� 10�4 mol/LMG in 0.04 mol/L of pH 7.0 B – R buffer solution; 2) (1)þ 50.0 mg/mL dsDNA.
616 X. Hu, Kui et al.
Electroanalysis 18, 2006, No. 6, 613 – 620 www.electroanalysis.wiley-vch.de H 2006 WILEY-VCH Verlag GmbH & Co. KGaA, Weinheim
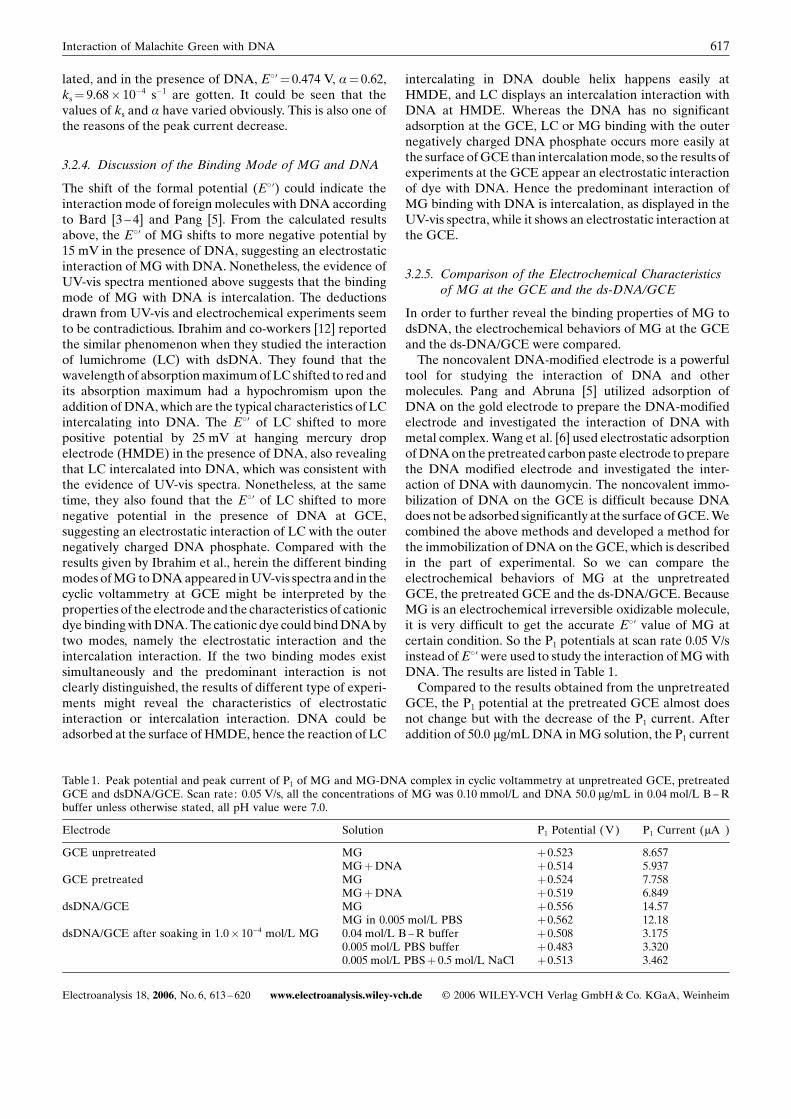
lated, and in the presence of DNA, E8’¼ 0.474 V, a¼ 0.62,ks ¼ 9.68� 10�4 s�1 are gotten. It could be seen that thevalues of ks and a have varied obviously. This is also one ofthe reasons of the peak current decrease.
3.2.4. Discussion of the Binding Mode of MG and DNA
The shift of the formal potential (E8’) could indicate theinteraction mode of foreign molecules with DNA accordingto Bard [3 – 4] and Pang [5]. From the calculated resultsabove, the E8’ of MG shifts to more negative potential by15 mV in the presence of DNA, suggesting an electrostaticinteraction of MG with DNA. Nonetheless, the evidence ofUV-vis spectra mentioned above suggests that the bindingmode of MG with DNA is intercalation. The deductionsdrawn from UV-vis and electrochemical experiments seemto be contradictious. Ibrahim and co-workers [12] reportedthe similar phenomenon when they studied the interactionof lumichrome (LC) with dsDNA. They found that thewavelength of absorption maximum of LC shifted to red andits absorption maximum had a hypochromism upon theaddition of DNA, which are the typical characteristics of LCintercalating into DNA. The E8’ of LC shifted to morepositive potential by 25 mV at hanging mercury dropelectrode (HMDE) in the presence of DNA, also revealingthat LC intercalated into DNA, which was consistent withthe evidence of UV-vis spectra. Nonetheless, at the sametime, they also found that the E8’ of LC shifted to morenegative potential in the presence of DNA at GCE,suggesting an electrostatic interaction of LC with the outernegatively charged DNA phosphate. Compared with theresults given by Ibrahim et al., herein the different bindingmodes of MG to DNA appeared in UV-vis spectra and in thecyclic voltammetry at GCE might be interpreted by theproperties of the electrode and the characteristics of cationicdye binding with DNA. The cationic dye could bind DNA bytwo modes, namely the electrostatic interaction and theintercalation interaction. If the two binding modes existsimultaneously and the predominant interaction is notclearly distinguished, the results of different type of experi-ments might reveal the characteristics of electrostaticinteraction or intercalation interaction. DNA could beadsorbed at the surface of HMDE, hence the reaction of LC
intercalating in DNA double helix happens easily atHMDE, and LC displays an intercalation interaction withDNA at HMDE. Whereas the DNA has no significantadsorption at the GCE, LC or MG binding with the outernegatively charged DNA phosphate occurs more easily atthe surface of GCE than intercalation mode, so the results ofexperiments at the GCE appear an electrostatic interactionof dye with DNA. Hence the predominant interaction ofMG binding with DNA is intercalation, as displayed in theUV-vis spectra, while it shows an electrostatic interaction atthe GCE.
3.2.5. Comparison of the Electrochemical Characteristicsof MG at the GCE and the ds-DNA/GCE
In order to further reveal the binding properties of MG todsDNA, the electrochemical behaviors of MG at the GCEand the ds-DNA/GCE were compared.
The noncovalent DNA-modified electrode is a powerfultool for studying the interaction of DNA and othermolecules. Pang and Abruna [5] utilized adsorption ofDNA on the gold electrode to prepare the DNA-modifiedelectrode and investigated the interaction of DNA withmetal complex. Wang et al. [6] used electrostatic adsorptionof DNA on the pretreated carbon paste electrode to preparethe DNA modified electrode and investigated the inter-action of DNA with daunomycin. The noncovalent immo-bilization of DNA on the GCE is difficult because DNAdoes not be adsorbed significantly at the surface of GCE. Wecombined the above methods and developed a method forthe immobilization of DNA on the GCE, which is describedin the part of experimental. So we can compare theelectrochemical behaviors of MG at the unpretreatedGCE, the pretreated GCE and the ds-DNA/GCE. BecauseMG is an electrochemical irreversible oxidizable molecule,it is very difficult to get the accurate E8’ value of MG atcertain condition. So the P1 potentials at scan rate 0.05 V/sinstead ofE8’ were used to study the interaction of MG withDNA. The results are listed in Table 1.
Compared to the results obtained from the unpretreatedGCE, the P1 potential at the pretreated GCE almost doesnot change but with the decrease of the P1 current. Afteraddition of 50.0 mg/mL DNA in MG solution, the P1 current
Table 1. Peak potential and peak current of P1 of MG and MG-DNA complex in cyclic voltammetry at unpretreated GCE, pretreatedGCE and dsDNA/GCE. Scan rate: 0.05 V/s, all the concentrations of MG was 0.10 mmol/L and DNA 50.0 mg/mL in 0.04 mol/L B – Rbuffer unless otherwise stated, all pH value were 7.0.
Electrode Solution P1 Potential (V) P1 Current (mA )
GCE unpretreated MG þ0.523 8.657MGþDNA þ0.514 5.937
GCE pretreated MG þ0.524 7.758MGþDNA þ0.519 6.849
dsDNA/GCE MG þ0.556 14.57MG in 0.005 mol/L PBS þ0.562 12.18
dsDNA/GCE after soaking in 1.0� 10�4 mol/L MG 0.04 mol/L B – R buffer þ0.508 3.1750.005 mol/L PBS buffer þ0.483 3.3200.005 mol/L PBSþ 0.5 mol/L NaCl þ0.513 3.462
617Interaction of Malachite Green with DNA
Electroanalysis 18, 2006, No. 6, 613 – 620 www.electroanalysis.wiley-vch.de H 2006 WILEY-VCH Verlag GmbH & Co. KGaA, Weinheim
at the unpretreated GCE decreases, accompanying with anegatively shift of the P1 potential, and the same changes butmore slightly at the pretreated GCE occur. The P1 current ofMG in the presence of DNA at the pretreated GCE is largerthan that at the unpretreated GCE. Maybe this is due to aweakly adsorption of DNA at the pretreated GCE surface.At the dsDNA/GCE, the P1 potential of MG shifts to morepositive by 30 to 40 mV than that at the GCE, which is thecharacteristics of intercalation interaction. The P1 current ofMG at the dsDNA/GCE is about double what it is at thepretreated GCE, demonstrating that MG is concentrated atthe dsDNA/GCE surface. The results suggest that more MGmolecules are bound to the dsDNA molecules on thedsDNA/GCE surface. Under lower ionic strength such as in0.005 mol/L PBS buffer, the P1 current of MG at the dsDNA/GCE is smaller than that under higher ionic strength,whereas it is much larger than that at the GCE, indicatingthat the ionic strength is not the key factor for the interactingof MG with dsDNA under these conditions.
The dsDNA/GCE was soaked in 1.0� 10�4 mol/L MG in0.04 mol/L pH 7.0 buffer solution for 20 min, and rinsedwith water to remove the unbound MG. Following, theelectrode was scanned in 0.04 mol/L B – R buffer solution,0.005 mol/L PBS buffer solution and 0.005 mol/L PBSbuffer þ0.50 mol/L NaCl solution, respectively. The poten-tial and current of P1 are also listed in Table 1. The P1
potentials in above three solutions shift negatively 16, 41and 11 mV, respectively, from that at the pretreated GCE in0.04 mol/L B – R buffer. These results suggest that electro-static interaction of MG binding to dsDNA also occurs,because, if the intercalation of MG binding to dsDNA is theonly binding mode, the P1 of DNA in blank buffer solutionshould shift positively too. Another deduction from thisexperiment is that the positively shift of P1 potential in MGsolution at dsDNA/GCE is not caused by the blockage ofDNA adsorption on the electrode surface.
These experiments, also the above experiments involvingin UV-vis spectra and cyclic voltammetry at the GCE, revealthat the nature of MG binding to dsDNA is different underdifferent conditions. Herein, when the dsDNA/GCE isimmersed into the MG solution and then scanned in thisbuffered MG solution, the predominant binding mode isintercalation. When the dsDNA/GCE is soaked in MGsolution for 20 min and then scanned in blank buffersolution after the unbound MG being rinsed away, thepredominant binding mode is electrostatic interaction.Probably the aggregation of MG on the surface-confineddsDNA make the electrostatic force between the cationicMG molecule and the out negatively charged DNAphosphate become the main interacting force.
3.3. Analytical Application
3.3.1. Differential Pulse Voltammetry
Differential pulse voltammetric method (DPV) was chosenfor analytical application because it is more sensitive than
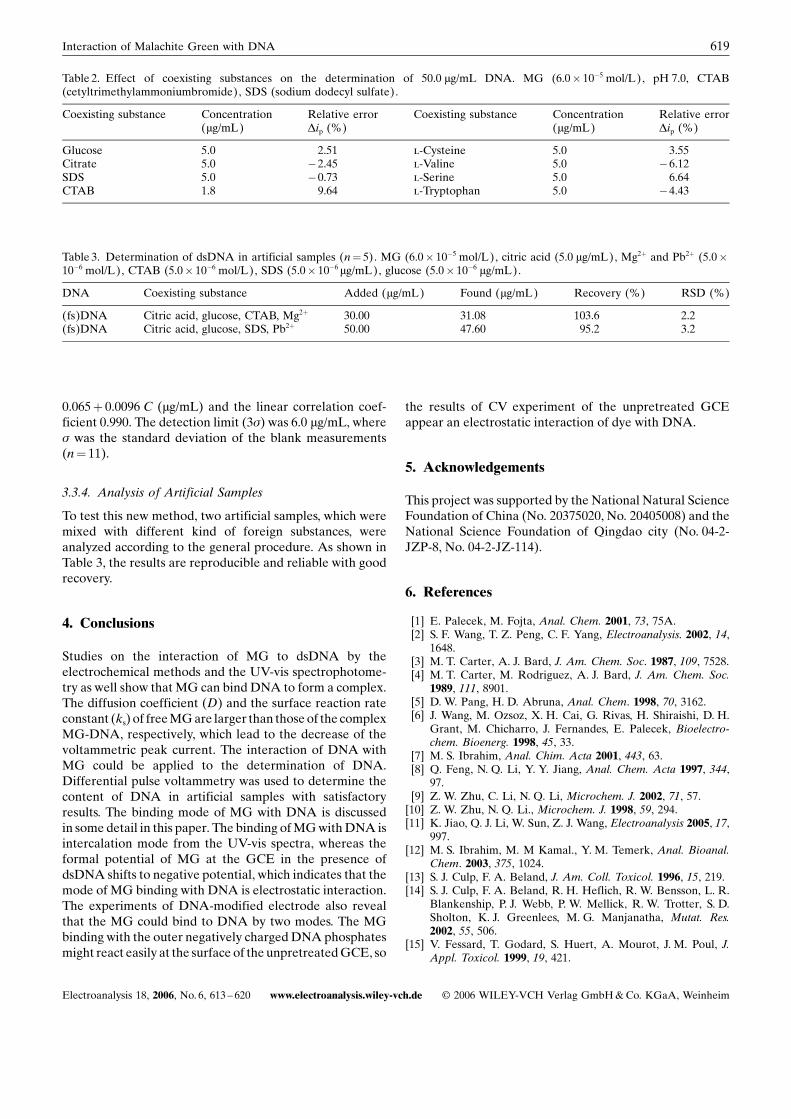
cyclic voltammetric method. The differential pulse voltam-mograms of MG in the absence and presence of DNA areshown in Figure 7. MG has an oxidation peak at 0.456 V,which is corresponding to the peak of P1 on the cyclicvoltammogram. After the addition of dsDNA, the peakcurrent decreases obviously. The decreasing value of thepeak current (Dip) is directly proportional to the DNAconcentration, which can be used for the detection of DNA.
3.3.2. Interference Test of Foreign Substances
Keeping the concentration of DNA as 50.0 mg/mL, theinfluences of different substances such as some aminoacids, glucose and surfactants at pH 7.0 on the determi-nation of DNA were tested according to the standardprocedure. The results are listed in Table 2. The commoncoexisting substances have a little effect on the determi-nation of DNA, which shows that the interaction of MGwith DNA provides a possibility for detecting the contentof DNA in practical samples. When cetyltrimethylammo-niumbromide (CTAB) exists in the test solution, the Dipincreases markedly, showing that CTAB might enhance theMG aggregation on the molecular surface of DNA [17 –19].
3.3.3. Calibration Curve and Detection Limit
Under the optimum conditions of the standard procedure,by keeping the concentration of MG as 6.0� 10�5 mol/L, thecalibration curve for detecting dsDNA was obtained. Whenthe concentration of DNA was in the range of 10.0 to100.0 mg/mL, a linear relationship of the decrease of theoxidative peak current (Dip) with DNA concentration (C)was obtained with a linear regression equation Dip(mA)¼
Fig. 7. Differential pulse voltammograms of MG-DNA reactionsystem. 1) 0.04 mol/L of pH 7.0 B – R buffer solution; 2) (1)þ6.0� 10�5 mol/L MG; 3) (2)þ 50.0 mg/mL DNA.
618 X. Hu, Kui et al.
Electroanalysis 18, 2006, No. 6, 613 – 620 www.electroanalysis.wiley-vch.de H 2006 WILEY-VCH Verlag GmbH & Co. KGaA, Weinheim
0.065þ 0.0096 C (mg/mL) and the linear correlation coef-ficient 0.990. The detection limit (3s) was 6.0 mg/mL, wheres was the standard deviation of the blank measurements(n¼ 11).
3.3.4. Analysis of Artificial Samples
To test this new method, two artificial samples, which weremixed with different kind of foreign substances, wereanalyzed according to the general procedure. As shown inTable 3, the results are reproducible and reliable with goodrecovery.
4. Conclusions
Studies on the interaction of MG to dsDNA by theelectrochemical methods and the UV-vis spectrophotome-try as well show that MG can bind DNA to form a complex.The diffusion coefficient (D) and the surface reaction rateconstant (ks) of free MG are larger than those of the complexMG-DNA, respectively, which lead to the decrease of thevoltammetric peak current. The interaction of DNA withMG could be applied to the determination of DNA.Differential pulse voltammetry was used to determine thecontent of DNA in artificial samples with satisfactoryresults. The binding mode of MG with DNA is discussedin some detail in this paper. The binding of MG with DNA isintercalation mode from the UV-vis spectra, whereas theformal potential of MG at the GCE in the presence ofdsDNA shifts to negative potential, which indicates that themode of MG binding with DNA is electrostatic interaction.The experiments of DNA-modified electrode also revealthat the MG could bind to DNA by two modes. The MGbinding with the outer negatively charged DNA phosphatesmight react easily at the surface of the unpretreated GCE, so
the results of CV experiment of the unpretreated GCEappear an electrostatic interaction of dye with DNA.
5. Acknowledgements
This project was supported by the National Natural ScienceFoundation of China (No. 20375020, No. 20405008) and theNational Science Foundation of Qingdao city (No. 04-2-JZP-8, No. 04-2-JZ-114).
6. References
[1] E. Palecek, M. Fojta, Anal. Chem. 2001, 73, 75A.[2] S. F. Wang, T. Z. Peng, C. F. Yang, Electroanalysis. 2002, 14,
1648.[3] M. T. Carter, A. J. Bard, J. Am. Chem. Soc. 1987, 109, 7528.[4] M. T. Carter, M. Rodriguez, A. J. Bard, J. Am. Chem. Soc.
1989, 111, 8901.[5] D. W. Pang, H. D. Abruna, Anal. Chem. 1998, 70, 3162.[6] J. Wang, M. Ozsoz, X. H. Cai, G. Rivas, H. Shiraishi, D. H.
Grant, M. Chicharro, J. Fernandes, E. Palecek, Bioelectro-chem. Bioenerg. 1998, 45, 33.
[7] M. S. Ibrahim, Anal. Chim. Acta 2001, 443, 63.[8] Q. Feng, N. Q. Li, Y. Y. Jiang, Anal. Chem. Acta 1997, 344,
97.[9] Z. W. Zhu, C. Li, N. Q. Li, Microchem. J. 2002, 71, 57.
[10] Z. W. Zhu, N. Q. Li., Microchem. J. 1998, 59, 294.[11] K. Jiao, Q. J. Li, W. Sun, Z. J. Wang, Electroanalysis 2005, 17,
997.[12] M. S. Ibrahim, M. M Kamal., Y. M. Temerk, Anal. Bioanal.
Chem. 2003, 375, 1024.[13] S. J. Culp, F. A. Beland, J. Am. Coll. Toxicol. 1996, 15, 219.[14] S. J. Culp, F. A. Beland, R. H. Heflich, R. W. Bensson, L. R.
Blankenship, P. J. Webb, P. W. Mellick, R. W. Trotter, S. D.Sholton, K. J. Greenlees, M. G. Manjanatha, Mutat. Res.2002, 55, 506.
[15] V. Fessard, T. Godard, S. Huert, A. Mourot, J. M. Poul, J.Appl. Toxicol. 1999, 19, 421.
Table 2. Effect of coexisting substances on the determination of 50.0 mg/mL DNA. MG (6.0� 10�5 mol/L), pH 7.0, CTAB(cetyltrimethylammoniumbromide), SDS (sodium dodecyl sulfate).
Coexisting substance Concentration(mg/mL)
Relative errorDip (%)
Coexisting substance Concentration(mg/mL)
Relative errorDip (%)
Glucose 5.0 2.51 l-Cysteine 5.0 3.55Citrate 5.0 �2.45 l-Valine 5.0 �6.12SDS 5.0 �0.73 l-Serine 5.0 6.64CTAB 1.8 9.64 l-Tryptophan 5.0 �4.43
Table 3. Determination of dsDNA in artificial samples (n¼ 5). MG (6.0� 10�5 mol/L), citric acid (5.0 mg/mL), Mg2þ and Pb2þ (5.0�10�6 mol/L), CTAB (5.0� 10�6 mol/L), SDS (5.0� 10�6mg/mL), glucose (5.0� 10�6 mg/mL).
DNA Coexisting substance Added (mg/mL) Found (mg/mL) Recovery (%) RSD (%)
(fs)DNA Citric acid, glucose, CTAB, Mg2þ 30.00 31.08 103.6 2.2(fs)DNA Citric acid, glucose, SDS, Pb2þ 50.00 47.60 95.2 3.2
619Interaction of Malachite Green with DNA
Electroanalysis 18, 2006, No. 6, 613 – 620 www.electroanalysis.wiley-vch.de H 2006 WILEY-VCH Verlag GmbH & Co. KGaA, Weinheim
[16] K. Mitrowska, A. Posyniak, Bull. Vet. Inst. Pulawy. 2004, 48,173 .
[17] Y. C. Chen, K. Xu, Y. F. Li, C. Z. Huang, J. Southwest ChinaNormal University ( Nature Science Edition), 2002, 27, 617.
[18] L. Li, G. W. Song, G. R. Fang, L. M. Liu, L. Xin, J. HubeiUniversity (Nature Science Edition) 2002, 24, 246.
[19] S. L. Feng, X. P. Liu, J. Fan, Spectrosc. Spectral Anal. 2004,24, 606.
[20] E. C. Long, J. K. Barton, Acc. Chem. Res. 1990, 23, 271.
[21] Z. Galus, R. N. Adams, J. Am. Chem. Soc. 1962, 84, 3207.[22] Z. Galus, R. N. Adams, J. Am. Chem. Soc. 1964, 86, 1666.[23] Z. W. Zhu, N. Q. Li, Mikrochim. Acta. 1999, 130, 301.[24] F. C. Anson, Anal. Chem. 1964, 36, 932.[25] A. J. Bard, L. R. Faulkner, Electrochemical Methods Funda-
mentals and Applications, 2nd ed. (Eds: Y. H. Shao, G. Y,Zhu, X. D. Dong, B. L. Zhang), Chemical Industry Press,Beijing 2004, p. 163.
620 X. Hu, Kui et al.
Electroanalysis 18, 2006, No. 6, 613 – 620 www.electroanalysis.wiley-vch.de H 2006 WILEY-VCH Verlag GmbH & Co. KGaA, Weinheim


![Electrochemical and Spectroscopic Studies on …...– 2 – fundamental conversion factors for the comparision of ac impedance measurents [6] with transient techniques. Furthermore](https://static.fdocuments.in/doc/165x107/5e6a8d22b99b4916a02c81a8/electrochemical-and-spectroscopic-studies-on-a-2-a-fundamental-conversion.jpg)