ELECTROCHEMICAL AND FTIR SPECTROSCOPIC …nathan.instras.com/MyDocsDB/doc-596.pdfelectrochemical...
12
411 J. Electroanal. Chem., 246 (1988) 411-422 Elsevier Sequoia S.A., Lausanne - Printed in The Netherlands ELECTROCHEMICAL AND FTIR SPECTROSCOPIC CHARACTERIZATION OF FERROCYANIDE-MODIFIED Ti02 ELECTRODES DESIGNED FOR EFFICIENT PHOTOSENSITIZATION JOHANN DESILVESTRO * and STANLEY PONS Department of Chemistry, University of Utah, Salt Lake City, UT 84112 (U.S.A.) ERSI VRACHNOU and MICHAEL GRjiTZEL Institut de Chimle Physque, Ecole PO&technique Fkdkrale, CH-1015 Luusanne (Switzerland) (Received 2nd December 1987) ABSTRACT The mechanism of the photosensitization of TiO, by adsorbed ferrocyanide has been investigated by electrochemical measurements and surface FTIR spectroscopy. It is shown that surface roughness factors of approximately 100-200 are necessary for efficient light harvesting. Ferrocyanide adsorbates on titania are compared to TqFe(CN),] films deposited by a novel electrochemical method onto metallic substrates. Cyclic voltammetry and analysis of the infrared vibrational spectra of TiOs-Fe(CN)i- surface com- plexes and Ti[Fe(CN),] indicate significant charge transfer from Fen to Tiv’. Ferrocyanide adsorption geometries are proposed on the basis of experimental data and geometric considerations of the anatase lattice. Light conversion efficiencies are discussed, and a model energy level diagram for the semiconduc- tor/sensitizer/electrolyte interface is presented. INTRODUCTION Recently, we have described efficient photosensitization of TiO, surfaces by adsorption of tris(2,2’-bipyridyl-4,4’-dicarboxylate)ruthenium(II) [l], carboxylated porphyrins [2], and Fe(CN)z- [3]. The latter system is of particular mechanistic interest since ferrrocyanide shows little optical absorption above 360 nm. However, brick-red coloration, obtained upon interaction of Fe(CN)z- with TiO,, is shown to be due to charge transfer complexation between Ti4+ and this anion. Prussian blue [4] and its analogues [5], M,[M’(CN),], (with M or M’ = V [6], Co [7], Ni [8], Cu [9], Ru [lo], Cd [ll]), have been studied extensively. However, only a few reports [7,12] describe brown to orange colored compounds obtained upon * Present address: Swiss Federal Institute for Reactor Research, CH-5303 Wiienlingen, Switzerland. 0022-0728/88/$03.50 0 1988 Elsevier Sequoia S.A.
Transcript of ELECTROCHEMICAL AND FTIR SPECTROSCOPIC …nathan.instras.com/MyDocsDB/doc-596.pdfelectrochemical...
411
J. Electroanal. Chem., 246 (1988) 411-422 Elsevier Sequoia S.A., Lausanne - Printed in The Netherlands
ELECTROCHEMICAL AND FTIR SPECTROSCOPIC CHARACTERIZATION OF FERROCYANIDE-MODIFIED Ti02 ELECTRODES DESIGNED FOR EFFICIENT PHOTOSENSITIZATION
JOHANN DESILVESTRO * and STANLEY PONS
Department of Chemistry, University of Utah, Salt Lake City, UT 84112 (U.S.A.)
ERSI VRACHNOU and MICHAEL GRjiTZEL
Institut de Chimle Physque, Ecole PO&technique Fkdkrale, CH-1015 Luusanne (Switzerland)
(Received 2nd December 1987)
ABSTRACT
The mechanism of the photosensitization of TiO, by adsorbed ferrocyanide has been investigated by electrochemical measurements and surface FTIR spectroscopy. It is shown that surface roughness factors of approximately 100-200 are necessary for efficient light harvesting. Ferrocyanide adsorbates on titania are compared to TqFe(CN),] films deposited by a novel electrochemical method onto metallic substrates. Cyclic voltammetry and analysis of the infrared vibrational spectra of TiOs-Fe(CN)i- surface com- plexes and Ti[Fe(CN),] indicate significant charge transfer from Fen to Tiv’. Ferrocyanide adsorption geometries are proposed on the basis of experimental data and geometric considerations of the anatase lattice. Light conversion efficiencies are discussed, and a model energy level diagram for the semiconduc- tor/sensitizer/electrolyte interface is presented.
INTRODUCTION
Recently, we have described efficient photosensitization of TiO, surfaces by adsorption of tris(2,2’-bipyridyl-4,4’-dicarboxylate)ruthenium(II) [l], carboxylated porphyrins [2], and Fe(CN)z- [3]. The latter system is of particular mechanistic interest since ferrrocyanide shows little optical absorption above 360 nm. However, brick-red coloration, obtained upon interaction of Fe(CN)z- with TiO,, is shown to be due to charge transfer complexation between Ti4+ and this anion.
Prussian blue [4] and its analogues [5], M,[M’(CN),], (with M or M’ = V [6], Co [7], Ni [8], Cu [9], Ru [lo], Cd [ll]), have been studied extensively. However, only a few reports [7,12] describe brown to orange colored compounds obtained upon
* Present address: Swiss Federal Institute for Reactor Research, CH-5303 Wiienlingen, Switzerland.
0022-0728/88/$03.50 0 1988 Elsevier Sequoia S.A.
412
mixing acidic Ti4+ or Ti3+ solutions with Fe(CN)z- or Fe(CN)i- solutions. On the basis of X-ray diffraction data and Miissbauer spectra, Milligan and co-workers [7,12b] suggested a structure of Ti’“[Fe”(CN),], even when TiCl, and Fe(CN)i- were used as the starting materials. Ti[M(CN),], with M = Co, Rh, Ir, have been characterized by X-ray diffraction, IR, optical, and X-ray photoelectron spec- troscopy [13].
It is therefore appropriate to present an analysis of the electrochemical and infrared spectroscopic analysis of ferrocyanide complexes at titania surfaces. In the first part we will treat the electrochemistry of the semiconductor/surface complex/ electrolyte interface and discuss relationships between surface roughness and mono- chromatic photocurrent efficiencies. The effect of hydroquinone as a cosensitizer will also be discussed. In the second part, we treat the interaction of Fe(CN$ and TiO, in terms of the results of electrode surface FTIR spectroscopy. We demon- strate here a novel method for the preparation of Ti[Fe(CN),] films deposited on gold and platinum electrodes, and compare them to analogous species formed at titania surfaces. These results provide new information on the structure of the TiO,-Fe(CN)z- complex and the mechanism of photosensitization of semiconduc- tor surfaces.
EXPERIMENTAL
Materials Titanium metal sheet (0.5 mm thickness, Kobe Steel, Ltd.; nominal impurity
analysis 0 (0.099%), Fe (0.078%), C (0.014%), H (0.0035’%), and N (0.002%)) was used as the metallic electrode substrate. For dispersed electrode measurements, TiO,-P25C powder obtained from Degussa (W. Germany, BET area 55 m2 g-‘) was used. The relative crystalline distribution was 80% anatase and 20% i-utile. All chemicals were at least reagent grade and were used as supplied. Deionized water was filtered through activated charcoal and triply distilled. All solutions were deaerated with Ar or N, prior to use.
Electrodes Pt, Au, and Ti disk electrodes were sealed into glass tubes with silicon glue or
epoxy and polished with increasingly finer grades of alumina (down to 0.05 pm). Finally, the surfaces were briefly ultrasonicated in distilled water. The preparation of ca. 20 pm thick TiO, layers (anatase) on Ti rods (6 mm in diameter) has been described previously [2,14]. Surface oxide roughness factors exceeding 100 were obtained by preparing the surfaces in a 50% humidified atmosphere. Thin polycrys- talhne Ti02 films were obtained by scanning the potential of a Ti electrode, immersed in 0.1 M H,SO,, at 10 mV s-r from -0.5 to 3.0 V (vs. SCE) and to 6.0 V. No oxide film was observed visually for films formed with the scan to + 3.0 V, whereas polarizations to + 6.0 V resulted in the formation of films which exhibited a golden interference color. This is in agreement with similar experiments by
413
Blackwood [15], who estimated the film thicknesses to be 10 nm at 3.0 V and 20 nm at 6.0 V.
TiO, surface complexation was effected in the dark by exposing TiO, electrodes to Ar-deaerated solutions of 0.01 M HClO, with 0.01 M K,Fe(CN), for 5 h. The 20 pm thick anatase layers thereupon exhibited a slight brick-red color. No visible color change was observed after ferrocyanide adsorption on thin TiO, films pre- pared by electrochemical oxidation of titanium substrates. Before characterization, the electrodes were thoroughly rinsed with 0.01 M HClO, and distilled water and dried in vacua.
Ti[Fe(CN),] on gold and platinum was prepared by electrochemically induced precipitation of the complex ion, similar to the preparation of corresponding colloidal compounds that has been described previously [7,12b]. The corresponding metal working electrode was immersed in 10 ml of deaerated mechanically stirred 0.06-0.12 M K,Fe(CN), solution. The electrode potential was switched to 0.0 V and 10 ml of 0.06-0.12 M TiC14 in 6 M HCl was injected into the cell. The reduction current dropped to zero within the range 50 s (for 0.06 M) to 5 s (for 0.12 M) whereupon a yellow film appeared. Prussian blue films were prepared according to the method of Itaya et al. [4b].
Apparatus Electrochemical experiments were carried out in standard two- or three-compart-
ment electrochemical cells. Cells for photoelectrochemical or infrared spectro- electrochemical measurements were equipped with flat Pyrex or CaF, windows, respectively, and have been described previously [16]. For driving the electro- chemical experiments, a HI-TEK Model DT 2101 potentiostat was used with a HI-TEK Model PPRl waveform generator and a Houston Model 200 XY recorder. All potentials were measured and are quoted versus the saturated calomel electrode (SCE).
TiOZ electrodes were illuminated with radiation from a 55 W tungsten-halogen lamp dispersed through a monochromator (Bentham Model M300). Monochromatic photocurrent efficiencies were determined by a calibrated Si photodiode. The detector was covered by a mask which was of the same size as the electrode. Polychromatic irradiation, provided by the same lamp, was low-frequency at- tenuated by a 14 cm thickness water filter and high-frequency limited by a 490 nm cutoff filter. The light intensities were measured with a Scientech Model 362 power energy meter.
Infrared reflectance spectra were obtained with a Bruker FT-98 vacuum spec- trometer modified for surface studies, as has been described previously [16]. For the mid-infrared region, a KBr beamsplitter, a KBr optical bench window, and a 77 K cooled HgCdTe detector were employed in the measurements. Interferograms were recorded at a resolution of 4 cm-‘; the optical bench was maintained at pressures (< 120 Torr), where interference due to atmospheric absorbance was insignificant. The sample chamber was purged with dry nitrogen. The difference vibrational reflectance spectrum was obtained by ratioing the average of up to 2000 spectra of the sample surface with the same number of spectra of the untreated surface.
414
RESULTS AND DISCUSSION
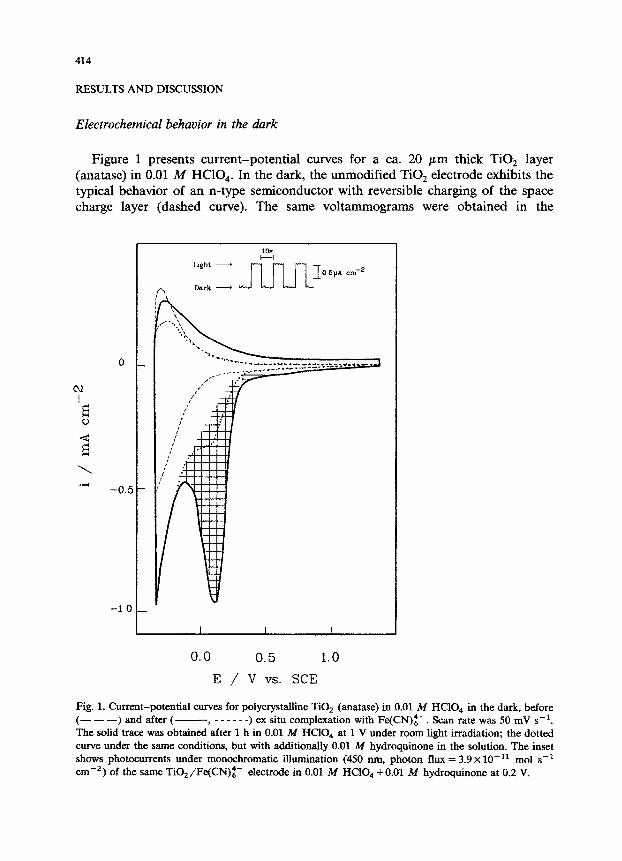
Figure 1 presents current-potential curves for a ca. 20 pm thick TiO, layer (anatase) in 0.01 A4 HClO,. In the dark, the unmodified TiO, electrode exhibits the typical behavior of an n-type semiconductor with reversible charging of the space charge layer (dashed curve). The same voltammograms were obtained in the
I I I
0.0 0.5 1.0
E / V vs. SCE
Fig. 1. Current-potential curves for polycrystalline TiO, (anatase) in 0.01 M HClO., in the dark, before (- - -) and after (- ______ ) ex situ complexation with Fe(CN)z-. Scan rate was 50 mV s-i. The solid trace was obtained’after 1 h in 0.01 M HClO, at 1 V under room light irradiation; the dotted curve under the same conditions, but with additionally 0.01 M hydroquinone in the solution. The inset shows photocurrents under monochromatic i&&nation (450 rtm, photon flux = 3.9 x 10-r’ mol s-t cm-‘) of the same TiOa/Fe(CN)~- etectrode in 0.01 M HClO, +O.Ol M hydr~~one at 0.2 V.
415
presence of 0.01 M hydroquinone. After surface complexation with Fe(CN)z-, increased cathodic currents were measured for E -z 0.9 V in 0.01 M HCIO, and a cathodic wave appeared with a peak potential at about 0.04 V. The anodic currents increased only slightly, and did not show an oxidation wave. This result can be explained if we assume a slow electron transfer to the hexacyanoferrate species through the space charge layer of the semiconductor operated in the depletion mode. It is possible that the peak potential of this reduction is far negative of the standard potential of the surface complex since the electron transfer kinetics at poly~st~e semiconductors is kinetically controlled in a complex way by the magnitude of the band bending, the charge transfer through the Helmholtz layer, and the mass transfer conditions [17].
The magnitude of the cathodic peak current at potentials > 0.5 V depended critically on the optical saturation of the electrode. After 30 to 60 min room light illumination at 1.0 V, maximum surface oxidation was attained (cf. also Fig. 2 below), Subsequent volt~et~ of this surface in the dark resulted in the response shown by the solid trace in Fig. 1. Visually, no color change could be observed at the surface during the oxidation.
If the Fe(CN$-modified TiO, was held at 1.0 V in the presence of 0.01 M hydroquinone, the observed reduction currents were significantly smaller (dotted curve in Fig. 1). This result indicates that the oxidized TiO,/Fe(CN)z- complex is reduced by hydr~u~one (E o = 0.44 V at pH = 0 [18]) and that hydr~~none can act as a cosensitizer in photochemical experiments (see below). From this result we estimate a lower limit for E o of the surface species to be = 0.4 V.
The chemisorption of Fe(CN$ was also studied at dispersions of TiO, particles (cf. also ref. 3). TiO, powder was stirred in an aqueous solution of 10m4 to lo-* M K,Fe(CN), in 10m2 M HCIO,. After equilibration for 5 h under an Ar atmosphere, we collected the TiO, by cent~fugatio~. The con~ntration of free Fe(CN)z- was determined by cyclic voltammetry of the supematant. A saturation coverage of 7 x lo-’ mol g-’ TiO, or 1.3 x lo-” mol cm-* was calculated. This surface concentration corresponds to slightly less than one molecular monolayer coverage, which may be due to deviation from the assumption of close-packing surface orientation or to the micropores being too small for penetration by Fe(CN)z- *.
The saturation coverage of the titania surfaces and the data presented in Fig. 1 may be used for determining the electrochemically active area of TiO, electrodes. Generally, the surface roughness of a polycrystalline semiconductor electrode can- not be determined from impedance measurements unless the minority carrier density can be determined independently, e.g. from Hall and bulk resistivity me~urements. In the case of TiO, (anatase), electron microscopy yielded only qualitative data on the el~tr~he~c~ly active area [19]_ Recently we showed, however, that the surface roughness factor of polycrystalline semiconductors can be
* Assuming a radius of 0.46 gm for Fen-, a close-packed monolayer corresponds to 2.3 x lo-” mol cm-’ and, in the case of a one-electron transfer, to 2.2~ lo-* C cm-‘.
416
estimated by adsorption of a suitable ion and subsequent voltammetric measure- ments [17b].
In order to obtain meaningful data from such an approach, at least three conditions have to be fulfilled:
(i) The saturation caverage should correspond to one monolayer. Thus charged and rather spherical molecules are preferable.
(ii) The adsorbate has to be stable at the pH values required for adsorption. The pH has to be below the isoelectric point of the semiconductor for adsorption of an anion and above for a cation.
(iii) The adsorbate has to undergo a redox reaction with a standard potential at more positive values than the flat band potential in the case of an n-type semicon- ductor.
Requirements (i) to (iii) are fulfilled for the system TiOz/Fe(CN)i+ in slightly acidic solutions. From the shaded area in Fig. 1 which corresponds to 3.1 mC cme2 and by assuming a monomolecular coverage of around 1.8 x 10-i’ mol cmw2 (see above) we conclude that the electrochemically active area is around 180 times higher than the apparent geometrical area.
Photoelectrochemical behavior
The inset in Fig. 1 shows photocurrents obtained under monochromatic irradia- tion (wavelength A = 450 nm) of a TiO,/Fe(CN)i- electrode in 0.01 M HClO, + 0.01 M hydroquinone at a potential of 0.2 V. The monochromatic photocurrent efficiency (defined as electron flux divided by photon flux) corresponds to 26% which is in agreement with earlier reported values (cf. Fig. 2 in ref 3). One of the electrodes showed, however, a significantly lower efficiency, 7% at 450 nm. Interest- ingly, its electrochemically determined surface roughness factor of ca. 40 was also much lower than for the electrode presented in Fig. 1. This finding further corroborates the necessity of high surface area electrodes for efficient dye sensitiza- tion [l-3] and explains the much lower sensitization efficiencies reported for single crystals and low area polycrystalline electrodes [20].
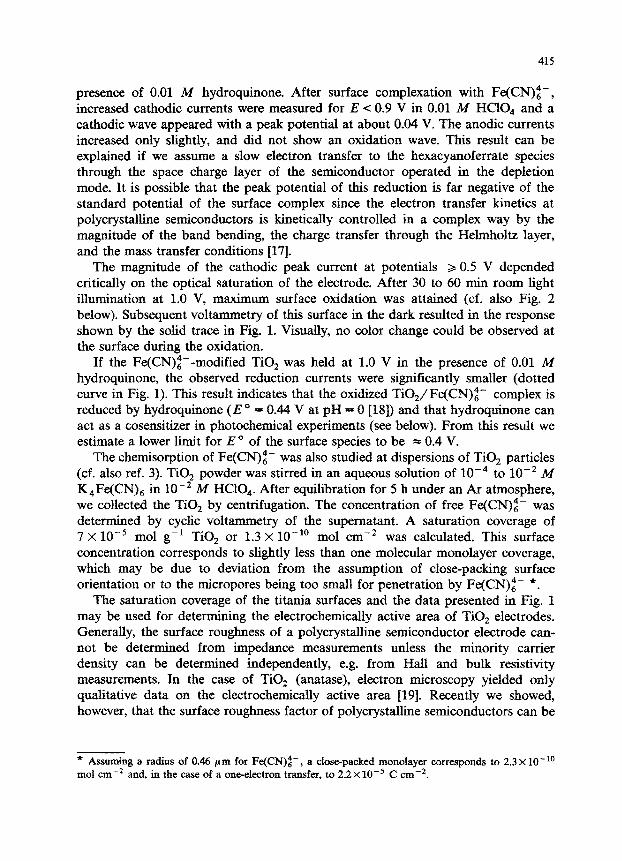
The effect of hydroquinone as a cosensitizer is demonstrated in Fig. 2. Without hydroquinone (lower curve) the photocurrents decreased exponentially during the first 100 s of polychromatic illumination (X > 490 nm). The apparently slower decay afterwards may be due partly to sub-bandgap effects of the TiO, electrode (cf. Fig. 2 in ref. 1) and partly to slow cation (probably proton) migration out of the fractal structure of the electrode. The oxidation charge during 5 min of irradiation corresponded to 1.7 mC cmw2 or to only 55% conversion of the ferrocyanide film. In the presence of hydroquinone however (upper curve), the photocurrents stabilized at 0.046 mA cmP2 after an induction period of around 40 s. After 2 h of continuous illumination the photocurrents were still as high as 0.044 mA cme2, which illustrates the efficiency with which hydroquinone reduces the oxidized surface complex.
Light intensities of 58 mW cmm2 (h > 420 nm) resulted in an initial photocurrent density of 0.32 mA cmw2 in 0.1 M hydroquinone at pH 2. Within 17 h of
25s I -
I -2 10 yA cm
Light on Light off
Time
AR
R
I I I 2200 2100 2000
WAVENUMBER / cni’
Fig. 2. Photocurrent-time behavior for the TiO, electrode presented in Fig. 1. Polychromatic (X > 490 nm) irradiance was 6.5 mW cmm2. The 0.01 M HClO, solution was deaerated with Ar during illumination. Lower curve: no hydroquinone; upper curve: 0.01 M hydroquinone in 0.01 A4 HClO,.
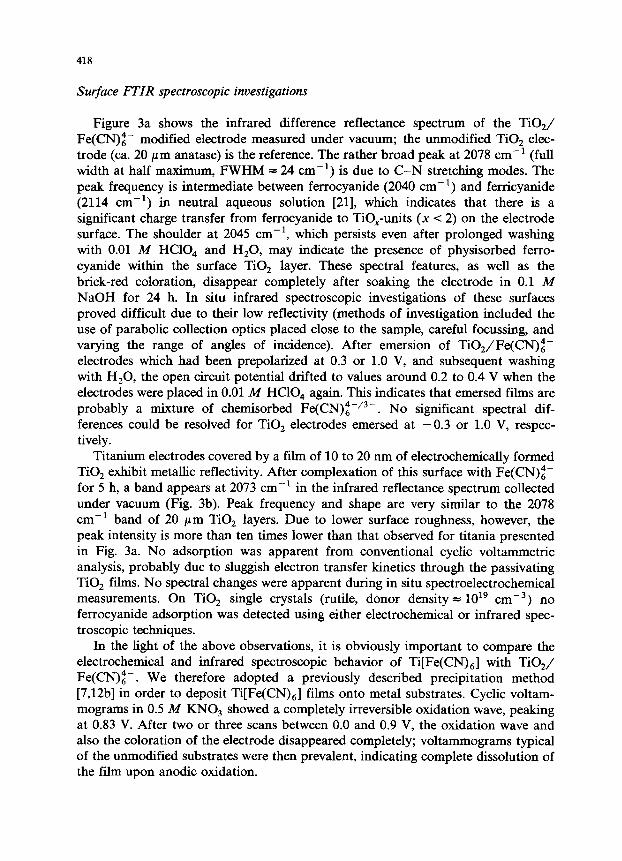
Fig. 3. Surface reflectance FTIR spectra of various ferrocyanide complexes. All spectra were obtained under vacuum. (a) Fe(CN);f- chemisorbed on a 20 pm TiOa layer (anatase). (b) Fe(CN)z- chemisor- bed on an electrochemically generated fiIm of ca. 20 pm Ti02 on Ti. Only p-polarized IR radiation was analyzed. (c) Ti[Fe(CN),] film on gold prepared by adding a 0.12 M TiCl, +6 M HCl solution to a preelectrolyzed (0.0 V) 0.12 M K,Fe(CQ solution. (d) Prussian blue on gold prepared at a constant cathodic current density of 0.01 mA cm -2 for 60 sin 0.01 iU FeCls +O.Ol it4 K,Fe(CN), (pH 2). Cyclic voltammetry revealed a surface charge of 1.08 mC cmm2.
polychromatic irradiation the current dropped to 0.11 mA cme2. From the total charge of 9.0 C cmm2 driven through the cell we calculate a turnover number of 3000, demonstrating the photocatalytic behavior of TiO,/Fe(CN)z- .
418
Surface FTIR spectroscopic investigations
Figure 3a shows the infrared difference reflectance spectrum of the TiO,/ Fe(CN)z- modified electrode measured under vacuum; the unmodified TiO, elec- trode (ca. 20 pm anatase) is the reference. The rather broad peak at 2078 cm-’ (full width at half maximum, FWHM = 24 cm-‘) is due to C-N stretching modes. The peak frequency is intermediate between ferrocyanide (2040 cm-‘) and ferricyanide (2114 cm-‘) in neutral aqueous solution [21], which indicates that there is a significant charge transfer from ferrocyanide to TiO,-units (x < 2) on the electrode surface. The shoulder at 2045 cm-‘, which persists even after prolonged washing with 0.01 M HClO, and H,O, may indicate the presence of physisorbed ferro- cyanide within the surface TiO, layer. These spectral features, as well as the brick-red coloration, disappear completely after soaking the electrode in 0.1 A4 NaOH for 24 h. In situ infrared spectroscopic investigations of these surfaces proved difficult due to their low reflectivity (methods of investigation included the use of parabolic collection optics placed close to the sample, careful focussing, and varying the range of angles of incidence). After emersion of TiO,/Fe(CN)z- electrodes which had been prepolarized at 0.3 or 1.0 V, and subsequent washing with H,O, the open circuit potential drifted to values around 0.2 to 0.4 V when the electrodes were placed in 0.01 M HClO, again. This indicates that emersed films are probably a mixture of chemisorbed Fe(CN)i-/3-. No significant spectral dif- ferences could be resolved for TiO, electrodes emersed at -0.3 or 1.0 V, respec- tively.
Titanium electrodes covered by a film of 10 to 20 nm of electrochemically formed TiOZ exhibit metallic reflectivity. After complexation of this surface with Fe(CN)i- for 5 h, a band appears at 2073 cm-’ in the infrared reflectance spectrum collected under vacuum (Fig. 3b). Peak frequency and shape are very similar to the 2078 cm -’ band of 20 pm TiO, layers. Due to lower surface roughness, however, the peak intensity is more than ten times lower than that observed for titania presented in Fig. 3a. No adsorption was apparent from conventional cyclic voltammetric analysis, probably due to sluggish electron transfer kinetics through the passivating TiOZ films. No spectral changes were apparent during in situ spectroelectrochemical measurements. On TiOZ single crystals @utile, donor density = 1019 cmM3) no ferrocyanide adsorption was detected using either electrochemical or infrared spec- troscopic techniques.
In the light of the above observations, it is obviously important to compare the electrochemical and infrared spectroscopic behavior of Ti[Fe(CN),] with TiOJ Fe(CN)i-. We therefore adopted a previously described precipitation method [7,12b] in order to deposit Ti[Fe(CN),] films onto metal substrates. Cyclic voltam- mograms in 0.5 M KNO, showed a completely irreversible oxidation wave, peaking at 0.83 V. After two or three scans between 0.0 and 0.9 V, the oxidation wave and also the coloration of the electrode disappeared completely; voltammograms typical of the unmodified substrates were then prevalent, indicating complete dissolution of the film upon anodic oxidation.
419
Figure 3c shows an ex situ spectrum of a Ti[Fe(CN),] film on gold prior to oxidation. We note an asymmetric band with a maximum at 2106 cm-* and a FWHM of ca. 45 cm- ‘. This band disappeared completely after oxidation of the ferrocyanide film at 1.0 V. The same results were obtained with gold and platinum substrates. More detailed electrochemical and in situ IR spectroscopic data on Ti[Fe(CN),] films will be presented elsewhere.
X-ray data for powdered Ti[Fe(CN),] [7,12b] revealed the same face-centered cubic unit cell (space group F,&Oz) as determined for Prussian blue [22]. Therefore we also included a reflection spectrum of Prussian blue, deposited on gold, in Fig. 3d. The spectra presented in Figs. 3c and 3d show exactly the same peak frequency. However, on the basis of the very different electrochemical behav- ior and the different coloration, there remains no doubt that the two samples are chemically different. Similar IR spectra of Prussian blue with a broad asymmetric band centered at 2080-2090 cm-’ have been reported in the literature [23].
~t~ucturaI and mechanistic ~rn~~~~ati5ns
If TiO, is covered by only one monolayer of “Fe(CN)z- “, the surface complex is expected to have a different structure from Ti[Fe(CN),]. This is supported experi- mentally by the different infrared and electrochemical results. The behavior of the
nm L-----
L___..---.I
0.3785 nm
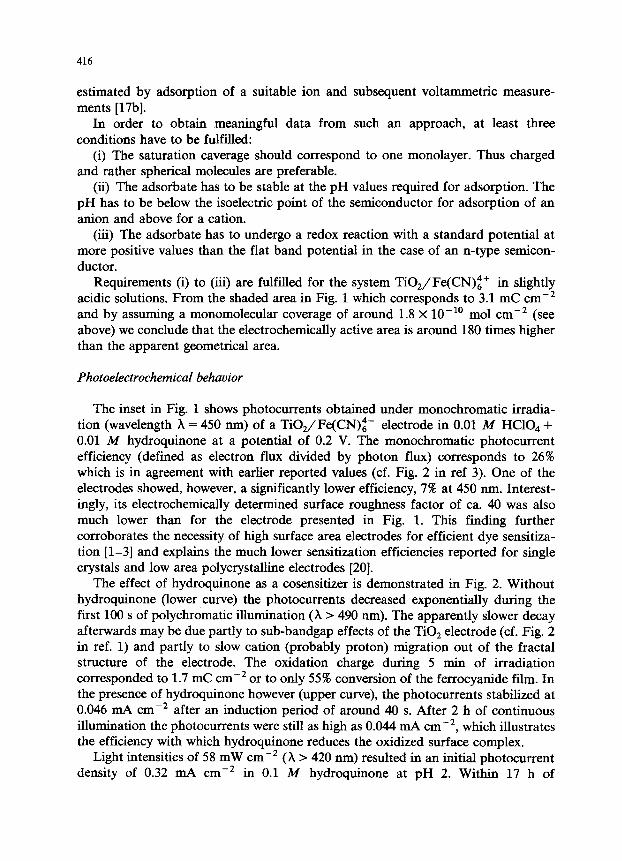
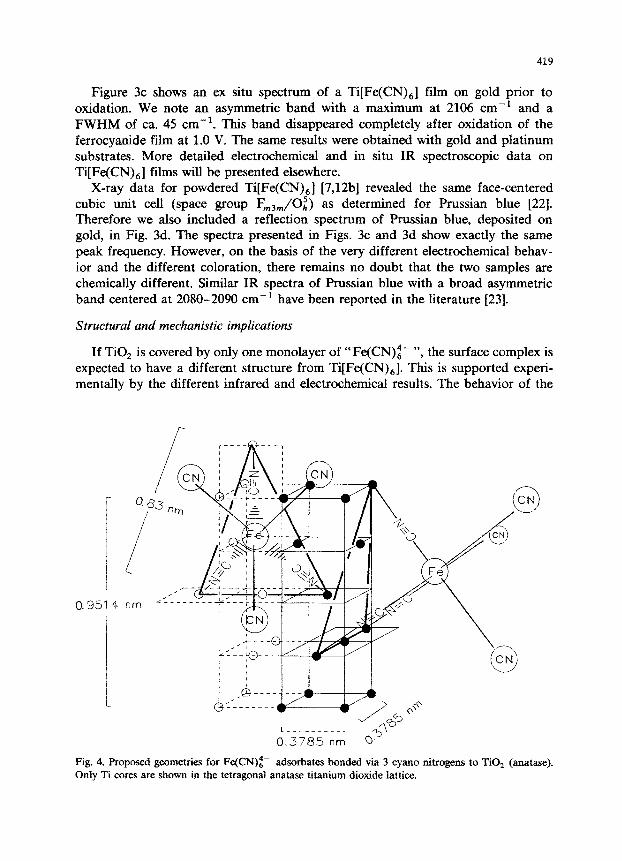
Fig. 4. Proposed geometries for Fe(CN)z- adsorbates bonded via 3 cyan0 nitrogens to Ti02 (anatase). Only Ti cores are shown in the tetragonal anatase titanium dioxide lattice.
420
CN stretching modes indicates a higher degree of charge transfer from ferrocyanide to Ti” in the case of formation of Ti[Fe(CN),] and suggests that the ferrocyanide units are less readily oxidized in Ti[Fe(CN),] than in the case of TiO,/Fe(CN)z-. We conclude from the irreversible oxidation wave at 0.8 V for the former complex that the E o value for (TiOJFe(CN)z-) is less than 0.8 V.
The question arises as to whether ferrocyanide is bonded to the surface oxide by 1, 2, or 3 cyan0 nitrogens. The CN bond is expected to weaken (with respect to solution 0, symmetry) because of coordination to Ti centers. This decrease in bond strength seems to be more than compensated for by the lower occupancy of the II& orbital due to decreased electron density of the Fe cores. Model calculations [24] have shown that the Fi, mode splits according to the symmetry of the surface complex and as a function of binding energy. The largest blue-shifts (compared to 0, symmetry) are expected when binding occurs through one or two nitrogens to the surface. From the present data however, a blue-shift of 38 cm-’ for TiO,/ Fe(CN)z- (cf. ref. 21 for free Fe(CN)z-) cannot be related unambiguously to coordination geometry and binding energy.
-2
-1
0
1
2
3
E
-
EC 0
+--- ------
Ef
Ti02
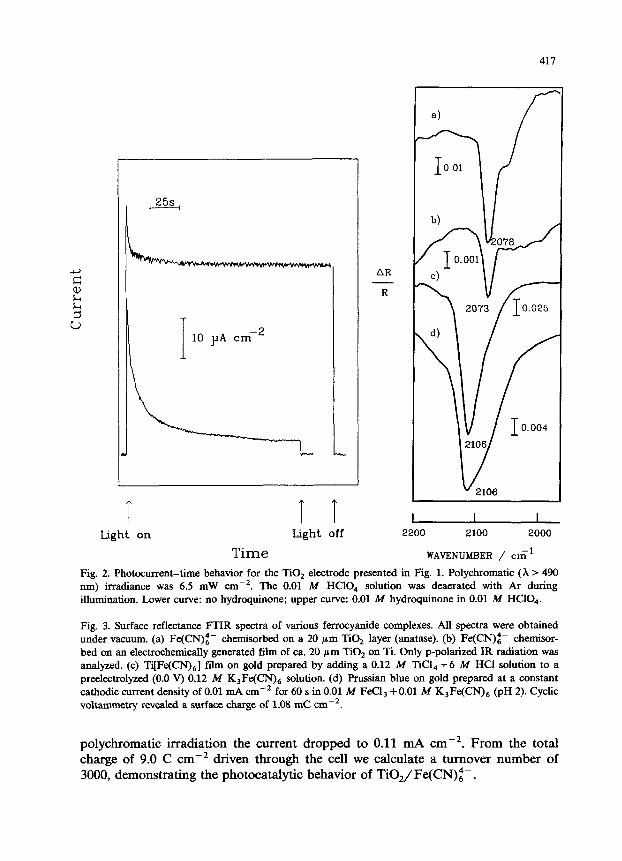
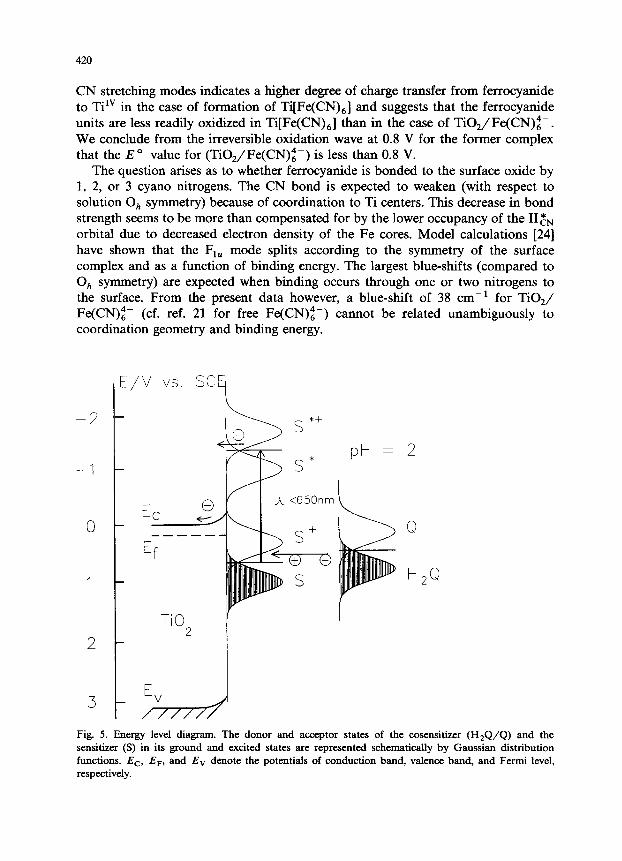
Fig. 5. Energy level diagram. The donor and acceptor states of the cosensitizer (HzQ/Q) and the sensitizer (S) in its ground and excited states are represented schematically by Gaussian distribution functions. EC, E,, and Ev denote the potentials of conduction band, valence band, and Fermi level, respectively.
421
The following qualitative conclusions can be drawn by considering the Fe(CN)z- and the TiO, geometry. From the crystal structure of Prussian blue with a lattice constant of 1 nm [4b] we conclude that the Ti cores, which bind ferrocyanide via two or three N atoms, have to be separated by at least 0.7 nm. The tetragonal structure of anatase with the lattice parameters a = b = (0.3785 f 0.0002) nm and c = (0.9514 f 0.0006) nm [25] offers many possibilities for Fe(CN)t- coordination to 2 Ti atoms separated by 0.757 nm. Figure 4 shows that even coordination via 3 N is feasible based on geometric considerations. Further adsorption studies as well as electrochemical and IR-spectroscopic measurements on various TiO, (anatase, rutile) samples are needed to investigate the adsorbate geometry.
On the basis of the band positions of TiO, (anatase) [26] and the optical [3] and electrochemical properties (see above) of TiO,/Fe(CN)z-, an approximate energy level diagram can be drawn for the semiconductor/ sensitizer/ electrolyte interface (Fig. 5). Even at wavelengths as long as 650 nm the driving force for electron injection to the TiO, conduction band is fairly high (> 0.5 ev), resulting in quantum efficiencies of up to 37% [3]. On the other hand, overall energy conversion efficien- cies of photosensitized photoelectrochemical cells will be limited by the rather high overpotential for electron injection. Excited states of other transition metal cyanides forming charge-transfer complexes with TiO, may match the semiconductor con- duction band energetically in a more favorable way. Such compounds are presently being investigated.
ACKNOWLEDGEMENTS
We thank the Office of Naval Research and the Fonds National Suisse de la Recherche Scientifique for support of this work.
REFERENCES
1 J. Desilvestro, M. Gr;itzel, L. Kavan, J. Moser and J. Augustynski, J. Am. Chem. Sot., 107 (1985)
2988.
2 K. Kalyanasundaram, N. Vlachopoulos, V. Krishnan, A. Monnier and M. Gratzel, J. Phys. Chem., 91
(1987) 2342. 3 E. Vrachnou, N. Vlachopoulos and M. Grltzel, J. Chem. Sot. Chem. Commun., (1987) 868.
4 (a) D. Ellis, M. Eckhoff and V.D. Neff, J. Phys. Chem., 85 (1981) 1225; (b) K. Itaya, T. Ataka and S.
Toshima, J. Am. Chem. Sot., 104 (1982) 4767.
5 For a review, see: A. Ludi and H.U. Giidel, Struct. Bonding (Berlin), 14 (1973) 1.
6 Dong ShaoJun and Li Fengbin, (a) J. Electroanal. Chem., 217 (1987) 49; (b) 210 (1986) 31.
7 K. Maer, Jr., M.L. Beasley, R.L. Collins and W.O. Milligan, J. Am. Chem. Sot., 90 (1968) 3201.
8 (a) S. Sinha, B.D. Humphrey and A.B. Bocarsly, Inorg. Chem., 23 (1984) 203; (b) B.D. Humphrey, S.
Sinha and A.B. Bocarsly, J. Phys. Chem., 91 (1987) 586.
9 (a) L.M. Siperko and T. Kuwana, Electrochim. Acta, 32 (1987) 765; (b) E.W. Grabner and S.
Kalwellis-Mohn, J. Appl. Electrochem., 17 (1987) 653.
10 K. Itaya, T. Ataka and S. Toshima, J. Am. Chem. Sot., 104 (1982) 3751. 11 H. Rubin, D.J. Arent, B.D. Humphrey and A.B. Bocarsly, J. Electrochem. Sot., 134 (1987) 93.
12 (a) Gmelins Handbuch der Anorganischen Chemie, 8. Auflage, Eisen, Teil B, Verlag Chemie GmbH,
Berlin, 1930, pp. 604, 646; (b) H.B. Weiser, W.O. Milligan and J.B. Bates, J. Phys. Chem., 46 (1942)
99.
422
13 H. Inoue and E. Fluck, Z. Naturforsch. Teil B, 39 (1984) 185.
14 C. Stalder and J. Augustynski, J. Electrochem. Sot., 126 (1979) 2007.
15 D.J. Blackwood, Ph.D. Thesis, University of Southampton, 1986.
16 See for example; (a) A. Bewick and S. Pons in R. Clark and R. Hester (Eds.), Advances in Infrared
and Raman Spectroscopy, Hayden, London, 1985, p. 1; (b) J. Foley and S. Pons, Anal. Chem., 57
(1985) 945A.
17 (a) J. Desilvestro, M. Gratzel and T. Pajkossy, J. Electrochem. Sot., 133 (1986) 331; (b) J. De-
silvestro, Ph.D. Thesis, Swiss Federal Institute of Technology, Lausamre, Switzerland, 1985.
18 M.P. Soriaga and A.T. Hubbard, J. Am. Chem. Sot., 104 (1982) 2735.
19 (a) M. Koudelka, A. Monnier, J. Sanchez and J. Augustynski, J. Mol. Catal., 25 (1984) 295; (b) M.
Grltzel in E. Pelizzetti and N. Serpone (Eds.), Homogeneous and Heterogeneous Photocatalysis,
NATO AS1 Series, Vol. 174, Reidel, Dordrecht, 1986, p. 105.
20 Cf. refs. 2a-n and 3a-i in ref. 1.
21 S. Pons, M. Datta, J.F. McAleer and A.S. Himnan, J. Electroanal. Chem., 160 (1984) 369.
22 J.F. Keggin and F.D. Miles, Nature (London), 137 (1936) 577.
23 (a) R.E. Wilde, S.N. Ghosh and B.J. Marshall, Inorg. Chem., 9 (1970) 2512; (b) J.W. Childers, A.
Crumbliss, P.S. Lugg and R.A. Palmer, J. Phys. Colloq., C6 (1983) 285; (c) K. Niwa and K.
Doblhofer, Electrochim. Acta, 31 (1986) 439.
24 C. Korzeniewski, M.W. Severson, P.P. Schmidt, S. Pons and M. Fleischmann, J. Phys. Chem., 91
(1987) 5568.
25 R.C. Weast (Ed.), CRC Handbook of Chemistry and Physics, 59th ed., CRC Press, West Palm Beach,
1978-1979, p. B240.
26 J. Moser and M. Grlatzel, J. Am. Chem. Sot., 105 (1983) 6547.