
LEVERAGING BEHAVIORALSTRATEGIES FOR BUILDING DECARBONIZATION

© 2017 Electric Power Research Institute, Inc. All rights reserved.
Electrification and Decarbonization
Geoffrey J. Blanford, Ph.D.Technical Executive
Energy and Environmental Analysis, EPRI
Energy and Climate Seminar, Washington, DCMay 10, 2017

2© 2017 Electric Power Research Institute, Inc. All rights reserved.
Reducing carbon emissions through electrification
In many cases, replacing fossil fuels with electricity at the end-use results in lower overall carbon emissions– Leverage will only increase with tighter constraints on power sector CO2Key questions:
– What are the potential drivers?– How much fossil use could be cost-effectively replaced by electricity even
without a carbon price?– For the remainder, how does carbon pricing change the equation, i.e.
how does electrification compare with other mitigation options? – In either case, how do we think about adoption and diffusion in the
context of consumer behavior?

3© 2017 Electric Power Research Institute, Inc. All rights reserved.
Potential Drivers of Electrification
Policy drivers (at federal, state, or local level)– Economy-wide carbon incentives– Sector-specific targets or mandates– Air quality regulations in non-attainment areasNon-policy drivers
– Technological change (e.g., declining battery costs)– Fuel markets– New business models (e.g., autonomous vehicles,
indoor agriculture)– Changing rate structures

4© 2017 Electric Power Research Institute, Inc. All rights reserved.
Final Energy by Sector / End-Use (2014)
0
2
4
6
8
10
12
14
16
18Q
uad
BTU
s
Electricity Coal Petroleum Natural Gas Bioenergy
* Excludes upstream and midstream energy use, e.g. power generation, oil & gas extraction, refining, and pipelines
Electric Vehicles
Heat Pumps Electric arc furnaces,Infrared drying, etc.
Water heaters, dryers, ranges, etc. Public buses,
Delivery trucks, etc.HVAC, forklifts, etc.
Indoor Ag?
5© 2017 Electric Power Research Institute, Inc. All rights reserved.
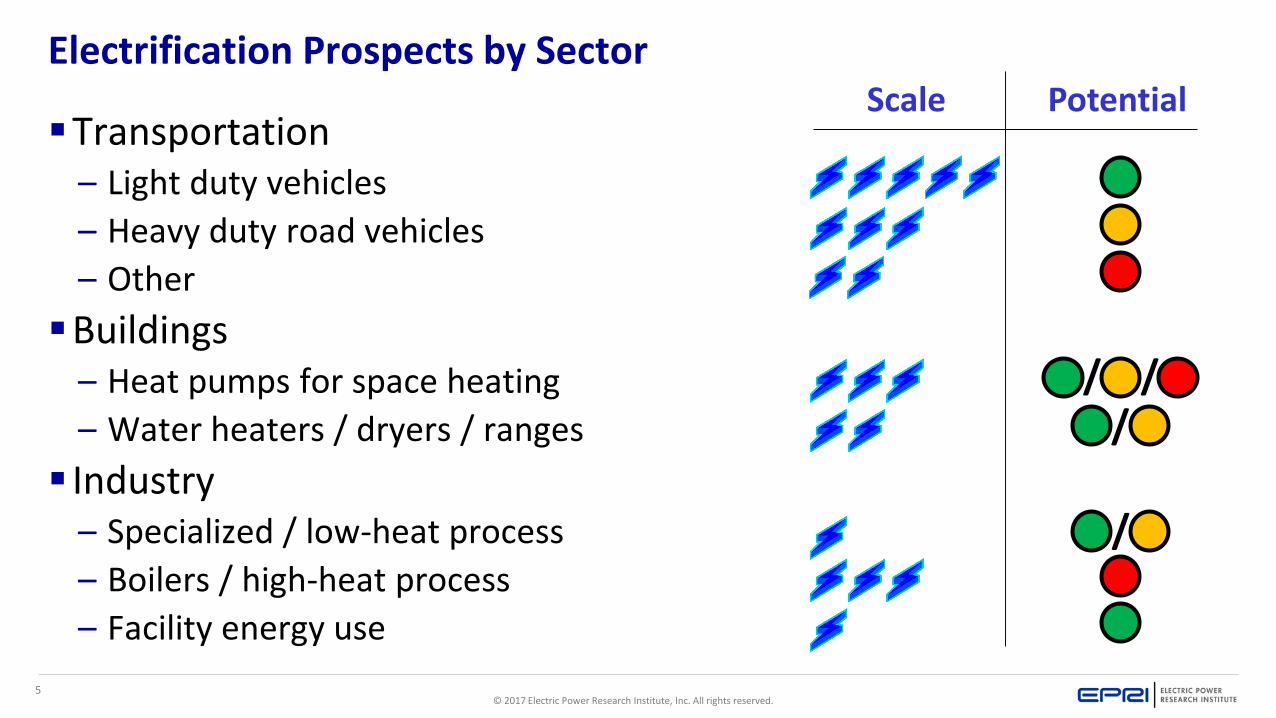
Electrification Prospects by Sector
Transportation– Light duty vehicles– Heavy duty road vehicles– OtherBuildings
– Heat pumps for space heating– Water heaters / dryers / ranges Industry
– Specialized / low-heat process– Boilers / high-heat process– Facility energy use
Scale Potential
//
/
/

6© 2017 Electric Power Research Institute, Inc. All rights reserved.
US-REGEN End-Use Model
End-Use Simulation ModelChoice by
region/vintage/sector/ class (e.g., climate zone/
consumer type)
Building Data(RECS / CBECS)
Industrial Energy(MECS)
Industrial Mix(IMPLAN)
Hourly Temperature(MERRA)
Vehicle/Driver Data(NHTS)
Service Demands(AEO)
Cost/Performance(EPRI)
Electricity Load Profile
Pacific
US-REGEN Electric Sector
Model
Non-Electric Energy Use
Emissions/ Air Quality
Energy Prices
Updated Electricity
PricesRECS = Residential Energy Consumption Survey (from EIA)CBECS = Commercial Buildings Energy Consumption Survey (from EIA)MECS = Manufacturing Energy Consumption Survey (from EIA)IMPLAN = Impact Analysis for Planning (state- and industry-level economic data)MERRA = Modern-Era Retrospective analysis for Research and Applications (gridded historical weather data from NASA)NHTS = National Household Transportation Survey (US Department of Transportation)AEO = Annual Energy Outlook (from EIA)

7© 2017 Electric Power Research Institute, Inc. All rights reserved.
Light-Duty Vehicles
Currently EVs and PHEVs have a very small market share but may be on the cusp of much more widespread deployment– Technology is moving fast, especially battery costs– Autonomous vehicle service could change the landscape dramaticallySignificant customer heterogeneity
– Urban / Suburban / Rural– Low / Medium / High annual mileage– Single / multiple car households– Attitude / Access to electric charging / ride serviceModel trade-offs including economic and non-economic factors

8© 2017 Electric Power Research Institute, Inc. All rights reserved.
-$1,500
-$1,000
-$500
$0
$500
$1,000
PHEV-10 PHEV-20 PHEV-40 EV-100 EV-150 EV-250
Annu
alize
d Co
st D
elta
vs I
CEV
Purchase Price Behavioral Maintenance Fuel Carbon Net Delta vs ICEV
Electric Vehicle Cost Delta vs Conventional Vehicle- EPRI assumptions about vehicle costs for 2030 (no incentives) - ORNL estimates of behavioral costs - current fuel prices + $100/tCO2
Median consumer type

9© 2017 Electric Power Research Institute, Inc. All rights reserved.
Electric vehicles may not work for all consumer types
-$1,500
-$500
$500
$1,500
$2,500
$3,500
$4,500
$5,500
PHEV-10 PHEV-20 PHEV-40 EV-100 EV-150 EV-250
Annu
alize
d Co
st D
elta
vs I
CEV
Purchase Price Behavioral Maintenance Fuel Carbon Net Delta vs ICEV
Rural, high mileage, late majority, high electricity price consumer type
- EPRI assumptions about vehicle costs for 2030 (no incentives) - ORNL estimates of behavioral costs - current fuel prices + $100/tCO2

10© 2017 Electric Power Research Institute, Inc. All rights reserved.
Modeling Autonomous Vehicles
Autonomous Vehicle Service
Private Vehicle Ownership
ICEV Electric
PHEV EV
Typical weekday distribution of vehicle miles traveled (based on NHTS, 2009)
0%
1%
2%
3%
4%
5%
6%
7%
8%
9%
10%
0 1 2 3 4 5 6 7 8 9 10 11 12 13 14 15 16 17 18 19 20 21 22 23Pe
rcen
t of D
aily
VM
T by
hou
rHours (typical weekday)
Household-level Decision

11© 2017 Electric Power Research Institute, Inc. All rights reserved.
Electric Heating in Buildings
Currently about 1/3 of residential buildings in the US have electricity as the main heat source, according to EIA surveys– Concentrated in regions with mild climates / favorable relative fuel
prices, e.g. Florida and Pacific NW– Higher shares in smaller housing units / recent vintages– 25% share of floorspace in commercial buildingsNew opportunities for air source heat pump (ASHP) technologyWe model the economic trade-offs for ASHP vs. conventional
furnace (+ A/C) in each region / climate zone based on temperature profile and retail fuel prices

12© 2017 Electric Power Research Institute, Inc. All rights reserved.
120°W 110°W 100°W 90°W 80°W 70°W
45°N
40°N
35°N
30°N
25°N
Heating/Cooling Zones based on HDD × CDD
CDD
HDD
Based on hourly temperature data in NASA
MERRA2 dataset

13© 2017 Electric Power Research Institute, Inc. All rights reserved.
Distribution across US of Electric Heating Cost Premium
-500
-400
-300
-200
-100
0
100
200
300
400
500
0 50 100 150 200
Cost
Pre
miu
m fo
r Ele
ctric
Hea
ting
($ p
er y
ear)
Cumulative square footage installing new equipment 2015-2030 (billions)
Based on today’s fuel prices and new vintage technology
Areas where electric heating has the
lowest total costs
Areas where electric heating has a cost
premium relative to gas
FloridaPacific
SE-CentralMtn-S
CaliforniaTexas SW-CentralS-Atlantic
Mid-Atlantic
New York
Mtn-N
NW-Central
NE-CentralNew England

14© 2017 Electric Power Research Institute, Inc. All rights reserved.
Higher carbon prices more electric heating in the money
-500
-400
-300
-200
-100
0
100
200
300
400
500
0 50 100 150 200
Cost
Pre
miu
m fo
r Ele
ctric
Hea
ting
($ p
er y
ear)
Cumulative square footage installing new equipment 2015-2030 (billions)
$0/tCO2
$100/tCO2
$200/tCO2
$300/tCO2
Based on carbon-adjusted fuel prices and new vintage technology
FloridaPacific SE-Central Mtn-S
California
TexasSW-Central
S-Atlantic
Mid-Atlantic
New York
Mtn-N
NW-Central
NE-CentralNew England

15© 2017 Electric Power Research Institute, Inc. All rights reserved.
0
10
20
30
40
J F M A M J J A S O N D
GWEffect of Electrification on Load Shapes
Space Heating
Space Cooling
Non-Seasonal
• As end-use mix changes, relative size of heating and cooling vs. non-seasonal loads will result in potentially very different aggregate profile / alignment with renewables
• New shapes will be introduced, in particular vehicle charging
• Result could improve or exacerbate generation asset utilization
• Better resource integration could allow more flexibility in demand response
Florida 2010
Preliminary: Subject to further calibration
High Electric Heating Share, Mild Climate

16© 2017 Electric Power Research Institute, Inc. All rights reserved.
Key Insights and Ongoing Research
What is the role of the electric sector along potential pathways for energy system transformation?– Significant potential to reduce non-electric fossil fuel use and emissions
through increased electric share, especially in vehicles and buildings– Some energy applications unlikely to be electrified even with carbon
policy incentives, e.g. aviation, heavy industry, heating in cold climates– Need to ensure that policies, regulations, and rate structures align
incentives for electrification where appropriate– First-order electric system impacts: need integrated modeling approachNational Electrification Assessment: EPRI study Dec 2017

17© 2017 Electric Power Research Institute, Inc. All rights reserved.
Together…Shaping the Future of Electricity