Electricity sector opportunities FINAL - Esteri · IEA Report for the Clean Energy Ministerial...
20
IEA Report for the Clean Energy Ministerial OPPORTUNITIES TO TRANSFORM THE ELECTRICITY SECTOR IN MAJOR ECONOMIES 2010
Transcript of Electricity sector opportunities FINAL - Esteri · IEA Report for the Clean Energy Ministerial...

IEA Report for the Clean Energy Ministerial
OPPORTUNITIES TO TRANSFORM
THE ELECTRICITY SECTOR IN MAJOR ECONOMIES
2010

INTERNATIONAL ENERGY AGENCY
The International Energy Agency (IEA), an autonomous agency, was established in November 1974. Its mandate is two-fold: to promote energy security amongst its member countries through collective response to physical disruptions in oil supply and to advise member
countries on sound energy policy.
The IEA carries out a comprehensive programme of energy co-operation among 28 advanced economies, each of which is obliged to hold oil stocks equivalent to 90 days of its net imports. The Agency aims to:
n Secure member countries’ access to reliable and ample supplies of all forms of energy; in particular, through maintaining effective emergency response capabilities in case of oil supply disruptions.
n Promote sustainable energy policies that spur economic growth and environmental protection in a global context – particularly in terms of reducing greenhouse-gas emissions that contribute to climate change.
n Improve transparency of international markets through collection and analysis of energy data.
n Support global collaboration on energy technology to secure future energy supplies and mitigate their environmental impact, including through improved energy
efficiency and development and deployment of low-carbon technologies.
n Find solutions to global energy challenges through engagement and dialogue with non-member countries, industry,
international organisations and other stakeholders. IEA member countries:
Australia Austria
Belgium Canada
Czech RepublicDenmark
Finland France
GermanyGreece
HungaryIreland
ItalyJapan
Korea (Republic of)LuxembourgNetherlandsNew Zealand NorwayPolandPortugalSlovak RepublicSpainSwedenSwitzerland
TurkeyUnited Kingdom
United States
The European Commission also participates in
the work of the IEA.
Please note that this publication is subject to specific restrictions that limit its use and distribution.
The terms and conditions are available online at www.iea.org/about/copyright.asp
© OECD/IEA, 2010International Energy Agency
9 rue de la Fédération 75739 Paris Cedex 15, France

IEA Report for the Clean Energy Ministerial
OPPORTUNITIES TO TRANSFORM
THE ELECTRICITY SECTOR IN MAJOR ECONOMIES
2010


Opportunities to Transform the Electricity Sector in Major Economies – © OECD/IEA 2010
Page | 3
Table of contents Summary ......................................................................................................................................... 5
Introduction .................................................................................................................................... 6
Potential for improving energy efficiency and deploying clean energy in the electricity sector ... 6
Improving efficiency of electricity generation from fossil fuels .............................................. 7
Accelerating the deployment of clean energy technologies ................................................... 9
Costs and benefits of achieving electricity sector potentials ........................................................ 10
Investment requirements ...................................................................................................... 10
Fuel savings and environmental benefits .............................................................................. 10
The impact of removing electricity consumption subsidies .......................................................... 12
References ..................................................................................................................................... 14
List of figures
Figure 1: Electricity generation in Major Economies, Reference and 450 Scenarios ..................... 7
Figure 2: Efficiency of coal- and gas-fired electricity generation in Major Economies in 2008 ...... 8
Figure 3: Coal-fired electricity generation in Major Economies, by plant type .............................. 8
Figure 4: Electricity sector capacity additions in Major Economies, 450 Scenario ......................... 9
Figure 5: Cumulative electricity sector investments in Major Economies .................................... 10
Figure 6: Energy-related CO2 emissions abatement from the electricity sector of Major Economies........................................................................................................................... 11
Figure 7: Fossil fuel consumption subsidies in Major Economies, 2007 and 2008 ....................... 12
Figure 8: Impacts of phasing out fossil fuel consumption subsidies (including electricity) in Major Economies, 2011-20 ........................................................................................................... 14
List of tables
Table 1: Plans to phase out subsidies to electricity consumption or raise domestic electricity prices in Major Economies ............................................................................................................ 13
List of boxes
Box 1: Broader impact of fossil fuel subsidies in Major Economies ............................................. 14

Opportunities to Transform the Electricity Sector in Major Economies – © OECD/IEA 2010
Page | 5
The electricity sector in Major Economies1 offers significant potential to transform the profile of future energy supply through improved electricity generation efficiency and accelerated deployment of clean energy. Such a transformation would result in important fossil fuel and carbon dioxide (CO2) emissions savings from the electricity sector, but requires additional investment with a sustained focus on cleaner, more efficient technologies. Additional costs could be partially offset by the removal of electricity consumption subsidies,2 a policy that could serve as one important option for further advancing energy efficiency and clean energy.
The World Energy Outlook (WEO) 450 Scenario projects global energy trends out to 2030 driven by global implementation of policies and regulatory frameworks to limit emissions of greenhouse gases.3 It highlights a future in which a cleaner, more secure electricity sector emerges, and leads to tremendous opportunities for technology innovation. The 450 Scenario therefore provides a useful tool to evaluate the potential to transform the electricity sector in Major Economies, and the relative costs and benefits compared to a scenario in which no policy or regulatory changes are assumed, as in the WEO Reference Scenario.
Summary
• Significant potential exists in Major Economies to raise the efficiency of electricity generation from fossil fuels and accelerate deployment of clean energy in the electricity sector. Achieving this potential would result in diversification of the electricity mix, reduced dependence on fossil fuels and abatement of CO2 emissions, all of which help to improve energy security and mitigate climate change.
• Using the 450 Scenario to evaluate this potential in Major Economies out to 2030, the average efficiency of electricity generation from coal rises to 42% (from 36% in 2008); that of gas rises to 52% (from 48%). In the overall electricity mix, the share of electricity generation from clean energy – renewables, nuclear and plants with carbon capture and storage (CCS) – increases to 63% (from 33%) by 2030, requiring that three-quarters of capacity additions in Major Economies over 2010-30 represent clean energy.
• Total investment of USD 6.5 trillion is needed over 2010-30 to improve the efficiency of electricity generation and accelerate clean energy deployment in Major Economies in line with the 450 Scenario – this includes incremental investment of USD 1.5 trillion over the Reference Scenario. About 85% of total investment goes to clean energy technologies.
• In reaching electricity sector potentials in the 450 Scenario, Major Economies could achieve annual fossil fuel savings of 1 800 million tonnes of oil equivalent (Mtoe) and CO2 emissions reductions of 8.0 gigatonnes (Gt) (including end-use savings) versus the Reference Scenario. This represents nearly 60% of annual world CO2 emissions abatement required to meet the 450 Scenario.
1 In this paper, “Major Economies” include Australia, Brazil, Canada, China, countries of the European Union, India, Indonesia, Japan, Korea, Mexico, Russia, South Africa and the United States. 2 Subsidies that reduce final consumer prices below the full cost of supply. 3 The 450 Scenario assumes that different groups of countries, in successive steps, employ carbon markets (resulting in rising CO2 prices), sectoral agreements and national policies in order meet economy-wide targets for stabilising the atmospheric concentration of greenhouse gases at 450 parts per million (ppm) CO2-equivalent. Further details on these assumptions can be found in the WEO-2009.

Opportunities to Transform the Electricity Sector in Major Economies – © OECD/IEA 2010
Page | 6
• Removing electricity consumption subsidies in Major Economies could help enable electricity sector transformation. Subsidised electricity consumption cost Major Economies USD 42 billion (on average) per year over 2007 and 2008, or roughly 60% of the annual incremental investment needed in the electricity sector to reach the 450 Scenario. Phase out of all fossil fuel consumption subsidies in Major Economies over 2011-20 could result in annual fossil fuel savings of 320 Mtoe (including 1.4 million barrels per day of oil savings) and 1.0 Gt of CO2 emissions abatement by 2020.
Introduction
Recent actions by many governments to promote more efficient, cleaner sources of energy signify positive steps to help improve energy security and mitigate climate change. Transformation of the energy sector, however, requires that commitments to energy efficiency and clean energy be sustained on a global level for many years to come.
Given current trends, the Major Economies must lead this transformation. They will account for 71% of incremental global energy demand and 73% of global energy-related CO2 emissions growth from 2008 to 2030; of this new energy demand, three-quarters will be met by fossil fuels. In 2008, the electricity sector within Major Economies was responsible for 39% of their primary energy demand and 42% of their energy-related CO2 emissions. Therefore, the electricity sector in this group of economies represents an important opportunity to transform the profile of energy supply. This background paper evaluates:
• The potential to improve efficiency of electricity generation from fossil fuels and accelerate clean energy deployment in the electricity sector of Major Economies;
• The costs and benefits of achieving those potentials; and, • The impact of removing electricity consumption subsidies in Major Economies. This background paper utilises IEA data and statistics and projections from WEO Reference and 450 Scenarios, tailored to analyse the electricity sector in Major Economies.
Potential for improving energy efficiency and deploying clean energy in the electricity sector
In the Reference Scenario, without any policy changes, electricity generation in the Major Economies rises from 16 650 terawatt-hours (TWh) in 2008 to 27 420 TWh in 2030. The mix is dominated by fossil fuels without CCS technology, which account for two-thirds of total electricity generation in 2030 – roughly the same share as today.
The 450 Scenario depicts how Major Economies might transform the electricity sector, achieving a more diverse mix and reducing dependence on fossil fuels (Figure 1). Coal- and gas-fired electricity generation without CCS technology continue to play a key role, but decline both in absolute terms and as a share of total generation over the projection period. Cleaner technologies including renewables, nuclear, and coal and gas with CCS supplant fossil fuels as the majority of electricity generation soon after 2020; by 2030 they account for 63% of electricity generation. This dramatic shift to a cleaner portfolio of electricity generation is aided by end-use efficiency gains, which reduce overall generation needs by 13% in 2030.

Opportunities to Transform the Electricity Sector in Major Economies – © OECD/IEA 2010
Page | 7
In the 450 Scenario, Major Economies seize several opportunities that contribute to transformation of the electricity sector throughout the projection period: improved efficiency of electricity generation from fossil fuels, accelerated deployment of clean energy technologies and reduced electricity generation requirements through end-use efficiency.
Figure 1: Electricity generation in Major Economies, Reference and 450 Scenarios
0
5 000
10 000
15 000
20 000
25 000
30 000
2008 2015 2020 2025 2030
TW
h
Nuclear
Renewables
CCS
Oil
Gas (no CCS)
Coal (no CCS)
Reference Scenario
450 Scenario
Source: IEA data and analysis.
Improving efficiency of electricity generation from fossil fuels
In 2008, coal-fired generation accounted for 7 730 TWh, or 46% of electricity generated in the Major Economies; the average efficiency of coal-fired electricity generation was 36% (Figure 2). In the 450 Scenario, the average efficiency of coal-fired electricity generation in Major Economies rises to 42% in 2030. This is enabled through adoption of best available technologies and retirement of older, inefficient plants. Although coal-fired electricity generation declines over the projection period, increased efficiency can preserve a larger role for coal in the mix than would otherwise be possible in reaching the 450 Scenario.
Potential also exists for improving the average efficiency of gas-fired electricity generation in Major Economies. Gas-fired generation accounted for 2 950 TWh or 18% of electricity generated in 2008; the average efficiency of gas-fired electricity generation was 48%. In the 450 Scenario, the average efficiency of gas-fired electricity generation in Major Economies increases to 52% in 2030. Adoption of the best available technology, namely combined-cycle gas turbines (CCGT), leads to this improved level of efficiency.
Even small gains in electricity generation efficiency can have important benefits. If the average efficiency of coal- and gas-fired plants in all Major Economies was increased by one percentage point in 2008, fossil fuel savings would have totalled 62 Mtoe – coal savings would have been equivalent to the total coal consumption of Indonesia and Japan in 2008. The corresponding reduction in CO2 emissions in 2008 would have equaled 0.7 Gt or the combined energy-related CO2 emissions of Australia and Spain in the same year.
When assessing opportunities to advance efficiency in the electricity sector, technology, domestic fuel quality and environmental factors must all be considered. Technologies employed, however, are the most critical element for achieving potential efficiency gains from electricity generation. For coal in particular, the opportunity to shift the technology mix is dramatic (Figure 3).

Opportunities to Transform the Electricity Sector in Major Economies – © OECD/IEA 2010
Page | 8
Figure 2: Efficiency of coal- and gas-fired electricity generation in Major Economies in 2008
0% 10% 20% 30% 40% 50% 60% 70%0%10%20%30%40%50%
AustraliaBrazil
CanadaChina
European UnionFrance
GermanyIndia
IndonesiaItaly
JapanKoreaMexicoRussia
South AfricaUnited Kingdom
United States
Average in 2008 Average in 2030 (450 Scenario)
Coal-fired efficiency Gas-fired efficiency
Note: According to IEA statistics, South Africa does not have any electricity generation from gas-fired plants. For some countries, achievable efficiencies are limited by domestic fuel quality and climate. Source: IEA data and analysis. Figure 3: Coal-fired electricity generation in Major Economies, by plant type
25%
30%
35%
40%
45%
50%
0%
20%
40%
60%
80%
100%
2008 2020 2030
450 Scenario
Effic
ien
cy
Shar
e o
f co
al g
ene
rati
on
Coal CHP
Advanced coal with CCS
Advanced coal
Supercritical
Subcritical
Average efficiency
Note: Advanced coal includes ultra-supercritical and IGCC technologies. Source: IEA data and analysis.
Nearly three-quarters of the current fleet of coal plants in Major Economies utilise subcritical technology, which can achieve efficiencies ranging from 34% to 37%. In the 450 Scenario, there is a marked transition away from subcritical plants, which account for a declining share of coal-fired generation: 73% in 2008, 53% by 2020 and 20% by 2030. This shift occurs as older, inefficient units are retired and replaced by coal plants using more advanced technologies, or by renewables and nuclear. In the 450 Scenario, the average level of efficiency reached in 2030 is within the range achievable today using ultra-supercritical and integrated gasification

Opportunities to Transform the Electricity Sector in Major Economies – © OECD/IEA 2010
Page | 9
combined-cycle (IGCC) technologies (a range of 40% to 46%). Furthermore, 19% of generation is fitted with CCS equipment in 2030, helping to reduce the carbon intensity of the coal fleet in Major Economies.
Accelerating the deployment of clean energy technologies
Accelerating the deployment of clean energy – particularly renewables, nuclear and CCS – in the electricity sector in Major Economies would lead to a more diverse, lower-carbon electricity mix. In the 450 Scenario, installed capacity of clean energy electricity generation rises sharply in Major Economies over 2010-30, underpinned by rapid deployment (Figure 4). Of cumulative capacity additions over 2010-30, 73% represent clean energy (55% renewables, 11% nuclear and 7% CCS).
Figure 4: Electricity sector capacity additions in Major Economies, 450 Scenario
0 100 200 300 400 500 600
Other renewables
Wind
Hydro
Nuclear
Coal and gas with CCS
Gas without CCS
Coal without CCS
GW
2010-20
2021-30
Source: IEA data and analysis. There is a significant shift in the profile of technologies deployed, however, moving from 2010-20 to 2021-30. Over the period from 2010 to 2020, significant coal- and gas-fired capacity (without CCS) continues to be installed in the Major Economies. In the following decade, fossil fuel-based capacity additions fall off in favour of clean technologies, which become more competitive primarily as a result of increasing CO2 prices4 and reductions in technology costs (enabled through higher levels of deployment). Over 2021-30, the largest installment of generating capacity is for wind (540 GW), followed by hydropower (310 GW), nuclear (210 GW) and CCS (200 GW). Other renewables such as solar (photovoltaics and thermal), biomass and geothermal account for nearly 220 GW of total capacity installation over 2021-30.
4 In the 450 Scenario, CO2 is traded in two separate markets: the OECD+ (Organisation for Economic Co-operation and Development plus the European Union) and Other Major Economies (including China, Russia, Brazil, South Africa and countries of the Middle East). The CO2 price reaches USD 50 per tonne in OECD+ in 2020; it rises to USD 110/t in OECD+ and USD 65/t in Other Major Economies in 2030.

Opportunities to Transform the Electricity Sector in Major Economies – © OECD/IEA 2010
Page | 10
Costs and benefits of achieving electricity sector potentials
Investment requirements
In Major Economies over 2010-30, total investment required in the electricity sector to meet the 450 Scenario is USD 6.5 trillion (Figure 5). Most investment over the projection period – USD 5.5 trillion or nearly 85% – goes into clean energy, representing a massive shift away from current trends. Renewables account for the bulk of cumulative investment at USD 3.8 trillion (58%); nuclear power reaches USD 1.1 trillion (17%); and CCS receives USD 0.6 trillion (9%). Additional investments, USD 1.0 trillion (16%), are for electricity generation from more efficient coal- and gas-fired technologies without CCS.
Figure 5: Cumulative electricity sector investments in Major Economies
0.0
1.0
2.0
3.0
4.0
2010-20 2021-30 2010-20 2021-30
Reference Scenario 450 Scenario
USD
trill
ion Coal without CCS
Gas without CCS
Coal and gas with CCSNuclear
Hydro
Wind
Other renewables
Source: IEA data and analysis. Beyond the requirements of the Reference Scenario, incremental investment in electricity generation needed to meet the 450 Scenario over the period 2010-30 is USD 1.5 trillion, or less than one-third higher. Electricity sector investment needs are substantially more from 2021-30 (USD 3.9 trillion) than in the preceding decade (USD 2.6 trillion) due to the focus on more capital-intensive technologies and the need for more capacity arising from retirement of older, inefficient coal-fired capacity in the later years. Tremendous opportunities would exist for innovation among manufacturers of electricity generation technologies, which would also need to invest in new production facilities.
Fuel savings and environmental benefits
Achieving energy efficiency and clean energy potential in the electricity sector of Major Economies consistent with the 450 Scenario would result in important fossil fuel savings and CO2 emissions abatement. In assessing potential gains for both, results of the 450 Scenario in Major Economies are compared against the results of the Reference Scenario. Thus, in the comparison, average efficiencies of coal- and gas-fired generation rise, clean technologies rapidly displace fossil fuels and improved end-use electricity efficiency reduces electricity

Opportunities to Transform the Electricity Sector in Major Economies – © OECD/IEA 2010
Page | 11
output requirements. The presence of CO2 prices in the 450 Scenario is a key difference that enables fossil fuel and CO2 emissions savings.
In the 450 Scenario, fossil fuel savings of 520 Mtoe in 2020 and 1 800 Mtoe in 2030 are achievable compared to the Reference Scenario. These savings are overwhelmingly from coal – owing to the displacement of coal-fired plants by other cleaner technologies, and the significant increase in average electricity generation efficiencies. Gas savings are much smaller since gas is not affected as dramatically by retirements, and because the large deployment of gas-fired generation in the Reference Scenario accounts for most of the efficiency increases that occur in the 450 Scenario.
Figure 6: Energy-related CO2 emissions abatement from the electricity sector of Major Economies
5.0
6.0
7.0
8.0
9.0
10.0
11.0
12.0
13.0
14.0
15.0
2008 2015 2020 2025 2030
Gt
End-use
Switch coal to gasMore efficicent fossil fuelsCCS
Renewables
Nuclear450 Scenario
Reference Scenario
Source: IEA data and analysis. A comparison of the two scenarios also reveals that Major Economies could avoid 8.0 Gt of energy-related CO2 emissions per year by 2030 compared to the Reference Scenario (Figure 6). This represents nearly 60% of the total annual abatement required globally by 2030 to meet the 450 Scenario. Changing the profile of electricity supply would result in approximately 5.1 Gt of the total CO2 emissions reductions in 2030; end-use electricity consumption efficiency would lead to 2.9 Gt or 36% of total CO2 savings in the electricity sector of Major Economies. The early retirement of old, inefficient coal-fired plants and replacement with more efficient plants is responsible for 8% of the total reduction. Increased deployment of renewables accounts for another 26% of total annual CO2 emissions savings accrued. Nuclear and CCS each represent about 15% of total abatement potential from the electricity sector in 2030.

Opportunities to Transform the Electricity Sector in Major Economies – © OECD/IEA 2010
Page | 12
The impact of removing electricity consumption subsidies
Transforming the electricity sector of Major Economies on the scale projected by the 450 Scenario requires a co-ordinated, sustained combination of policies to enable energy efficiency and clean energy. Removing electricity consumption subsidies is one policy option that could aid this transformation, particularly if used in combination with others such as pricing emissions of CO2, committing financial support to advance targeted clean energy technologies, adopting best available fossil fuel generating technologies and rationalising electricity pricing.
Governments subsidise energy consumption in different ways, but one of the most common is to artificially lower end-use prices below levels that would otherwise prevail in a competitive market. They may be implemented in order to promote economic development or alleviate poverty, but often such approaches are not well-targeted. Consumers benefiting from subsidies have little incentive to conserve energy or use it more efficiently and power companies are deprived of revenues. Moreover, in the case of electricity subsidies, power companies struggle to recover their operating costs and have little ability or incentive to invest to expand the grid, reduce loses and build new generating plants. As a result, consumption subsidies can slow the uptake of energy efficiency (both in energy production and end-use) and clean energy and work against efforts to increase access to energy.
Figure 7: Fossil fuel consumption subsidies in Major Economies, 2007 and 2008
0
40
80
120
160
200
2007 2008
USD
bill
ion
Other fossil fuels
Electricity
Note: Electricity consumption subsidies are quantified for fossil fuel inputs to electricity generation. Subsidies for direct consumption of fossil fuels (oil products, gas and coal) are also included. Source: IEA data and analysis. Energy consumption subsidies can be estimated using the price-gap approach, which compares final consumer prices with reference prices that reflect the full cost of supply. For electricity, reference prices are based on annual average-cost pricing5 in each Major Economy (weighted by the levels of output of each generating option). In other words, electricity reference prices account for the cost of production, but no other costs (such as investment).
5 Electricity reference prices in each Major Economy were determined using estimated reference prices for fossil fuel inputs and annual average fuel efficiencies for power generation. An allowance of USD 15/MWh and USD 40/MWh was added to account for transmission and distribution costs for industrial and residential uses, respectively.
Opportunities to Transform the Electricity Sector in Major Economies – © OECD/IEA 2010
Page | 13
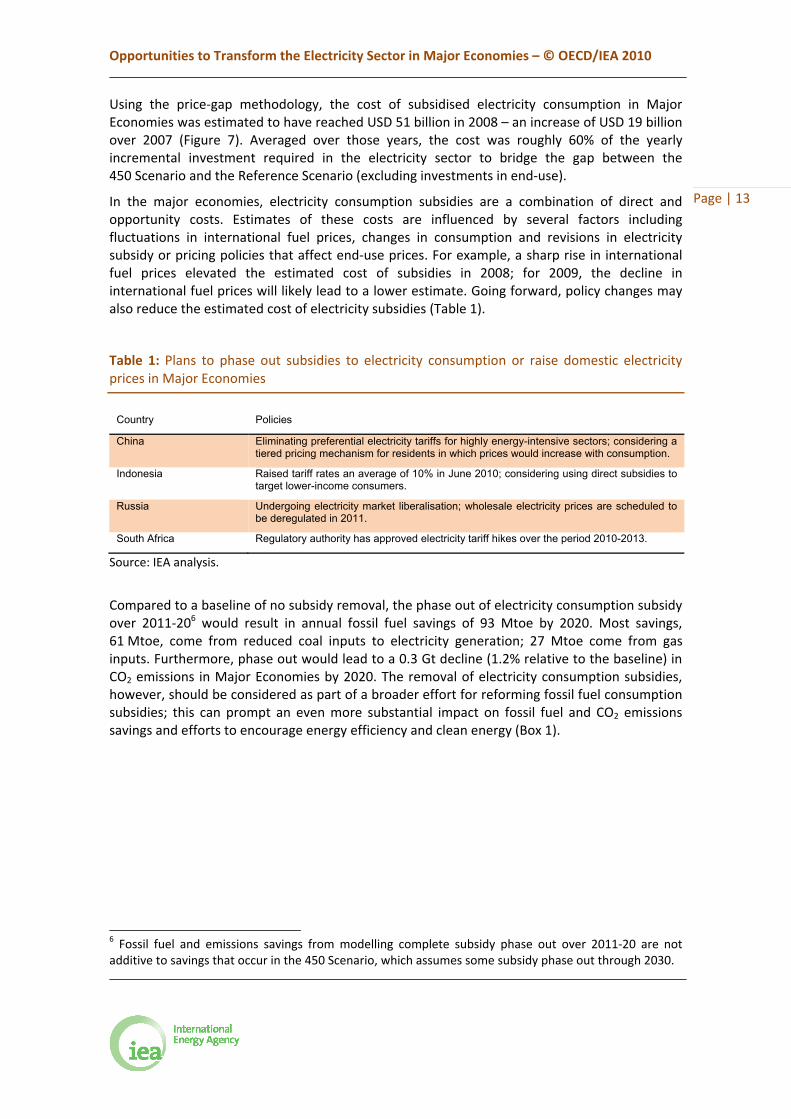
Using the price-gap methodology, the cost of subsidised electricity consumption in Major Economies was estimated to have reached USD 51 billion in 2008 – an increase of USD 19 billion over 2007 (Figure 7). Averaged over those years, the cost was roughly 60% of the yearly incremental investment required in the electricity sector to bridge the gap between the 450 Scenario and the Reference Scenario (excluding investments in end-use).
In the major economies, electricity consumption subsidies are a combination of direct and opportunity costs. Estimates of these costs are influenced by several factors including fluctuations in international fuel prices, changes in consumption and revisions in electricity subsidy or pricing policies that affect end-use prices. For example, a sharp rise in international fuel prices elevated the estimated cost of subsidies in 2008; for 2009, the decline in international fuel prices will likely lead to a lower estimate. Going forward, policy changes may also reduce the estimated cost of electricity subsidies (Table 1).
Table 1: Plans to phase out subsidies to electricity consumption or raise domestic electricity prices in Major Economies
Country Policies
China Eliminating preferential electricity tariffs for highly energy-intensive sectors; considering a tiered pricing mechanism for residents in which prices would increase with consumption.
Indonesia Raised tariff rates an average of 10% in June 2010; considering using direct subsidies to target lower-income consumers.
Russia Undergoing electricity market liberalisation; wholesale electricity prices are scheduled to be deregulated in 2011.
South Africa Regulatory authority has approved electricity tariff hikes over the period 2010-2013.
Source: IEA analysis.
Compared to a baseline of no subsidy removal, the phase out of electricity consumption subsidy over 2011-206 would result in annual fossil fuel savings of 93 Mtoe by 2020. Most savings, 61 Mtoe, come from reduced coal inputs to electricity generation; 27 Mtoe come from gas inputs. Furthermore, phase out would lead to a 0.3 Gt decline (1.2% relative to the baseline) in CO2 emissions in Major Economies by 2020. The removal of electricity consumption subsidies, however, should be considered as part of a broader effort for reforming fossil fuel consumption subsidies; this can prompt an even more substantial impact on fossil fuel and CO2 emissions savings and efforts to encourage energy efficiency and clean energy (Box 1).
6 Fossil fuel and emissions savings from modelling complete subsidy phase out over 2011-20 are not additive to savings that occur in the 450 Scenario, which assumes some subsidy phase out through 2030.

Opportunities to Transform the Electricity Sector in Major Economies – © OECD/IEA 2010
Page | 14
Box 1: Broader impact of fossil fuel subsidies in Major Economies
In September 2009, the G-20 countries committed to “rationalise and phase out over the medium term inefficient fossil fuel subsidies that encourage wasteful consumption”. To help inform the G-20 initiative, the IEA quantified fossil fuel consumption subsidies and modelled the impact of their phase out over the period 2011-20.
From this analysis, fossil fuel consumption subsidies were estimated at USD 110 billion in 2007 and USD 187 billion in Major Economies in 2008 (Figure 7). Consumption subsidies for oil, gas and coal pose additional barriers to the penetration of efficiency and clean energy by distorting market signals and creating fossil fuel dependence. They also undermine development and commercialisation of clean technologies, and foster both inefficient consumption and production patterns. By modeling total phase out of fossil fuel subsidies (including electricity) in the Major Economies over 2011-20, notable energy security and environmental benefits emerge.
Compared to a baseline of no subsidy removal, phase out of these subsidies leads to a 2.9% decline in energy demand in Major Economies 2020. Annual fossil fuel savings total 320 Mtoe in 2020 with oil savings, largely accrued in the transport sector, amounting to 1.4 md/d (67 Mtoe for the year) (Figure 8). Environmental benefits include a 3.7% (1.0 Gt) reduction in annual energy-related CO2 emissions by 2020.
Figure 8: Impacts of phasing out fossil fuel consumption subsidies (including electricity) in Major Economies, 2011-20 Annual fossil fuel savings in Major Economies Energy-related CO2 emissions in Major Economies
0
40
80
120
160
2015 2020
Mto
e
Oil Gas Coal
18
21
24
27
30
2005 2010 2015 2020
Gt
No subsidy removalSubsidy removal 2011-2020
Source: IEA data and analysis.
References International Energy Agency (2009), World Energy Outlook 2009, OECD/IEA, Paris.
IEA (2010), World Energy Outlook 2010, OECD/IEA, Paris (forthcoming).
IEA (2010), Energy Balances of Non-OECD Countries, OECD/IEA, Paris (forthcoming).
IEA (2010), Energy Balances of OECD Countries, OECD/IEA, Paris (forthcoming).


International Energy Agency
9 rue de la Fédération, 75739 Paris Cedex 15, France
www.iea.org