Electricity and the cost of doing business in the...
41
Electricity and the cost of doing business in the Philippines Philippe Reveilhac President Schneider Electric Philippines 2nd European Union-Philippines Meeting on Energy Energy Efficiency to Boost Economic Growth 29 th May 2013
Transcript of Electricity and the cost of doing business in the...

Electricity and the cost of doing
business in the Philippines
Philippe Reveilhac
President
Schneider Electric Philippines
2nd European Union-Philippines Meeting on Energy
Energy Efficiency to Boost Economic Growth 29th May 2013
2
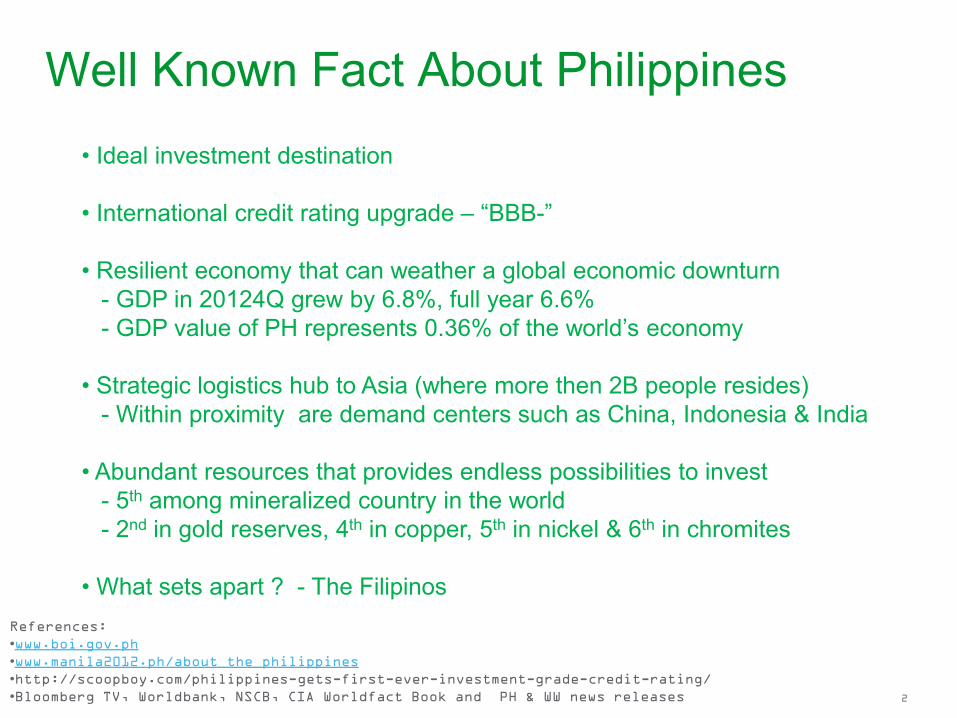
Well Known Fact About Philippines
• Ideal investment destination
• International credit rating upgrade – “BBB-”
• Resilient economy that can weather a global economic downturn
- GDP in 20124Q grew by 6.8%, full year 6.6%
- GDP value of PH represents 0.36% of the world’s economy
• Strategic logistics hub to Asia (where more then 2B people resides)
- Within proximity are demand centers such as China, Indonesia & India
• Abundant resources that provides endless possibilities to invest
- 5th among mineralized country in the world
- 2nd in gold reserves, 4th in copper, 5th in nickel & 6th in chromites
• What sets apart ? - The Filipinos
References:
•www.boi.gov.ph
•www.manila2012.ph/about_the_philippines
•http://scoopboy.com/philippines-gets-first-ever-investment-grade-credit-rating/
•Bloomberg TV, Worldbank, NSCB, CIA Worldfact Book and PH & WW news releases
3
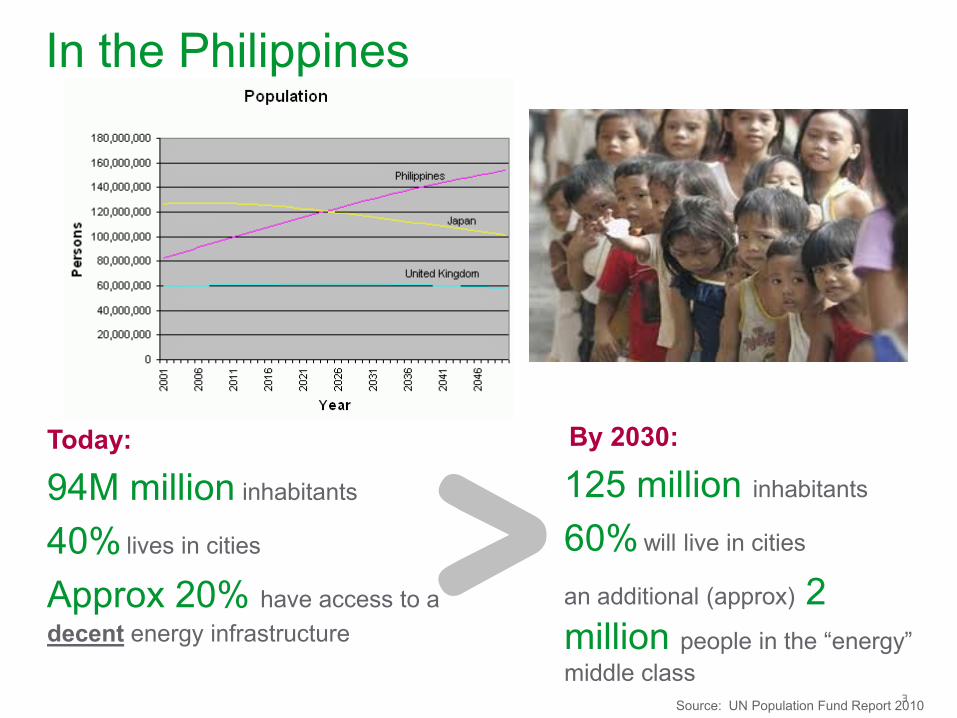
In the Philippines
By 2030:
125 million inhabitants
60% will live in cities
an additional (approx) 2
million people in the “energy”
middle class
Today:
94M million inhabitants
40% lives in cities
Approx 20% have access to a
decent energy infrastructure
Source: UN Population Fund Report 2010
4
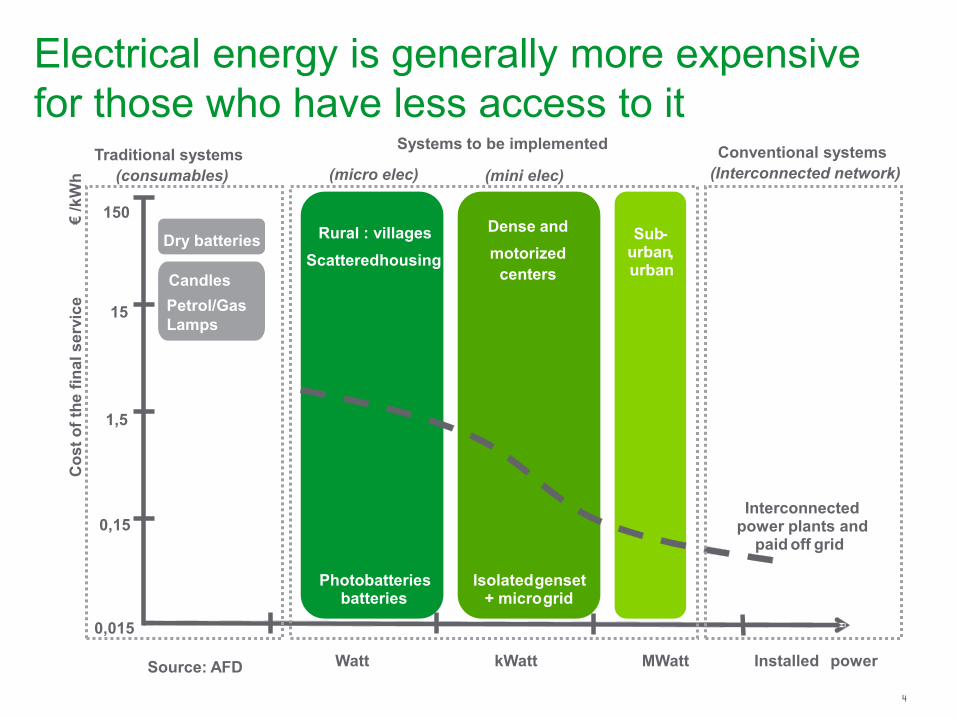
Electrical energy is generally more expensive
for those who have less access to it
150
15
1,5
0,15
0,015
Co
st
of
the
fin
al
se
rvic
e
€ /k
Wh
Dry batteries
Candles
Petrol/Gas
Lamps
Watt kWatt MWatt Installed power
Traditional systems
(consumables)
Systems to be implemented
(micro elec) (mini elec)
Conventional systems
(Interconnected network)
Rural : villages
Scattered housing
Dense and
motorized centers
Sub - urban , urban
Isolated genset + micro grid
Photobatteries batteries
Interconnected power plants and
paid off grid
Source: AFD

5
Energy Cost * Philippines is one of the highest rated country in the world!
References:
http://www.interaksyon.com/business/40664/ph-electricity-rates-among-10-highest-in-survey-of-44-countries
http://www.abs-cbnnews.com/business/10/10/11/ph-power-rates-5th-highest-world
International Energy Agency – www.iea.org
6
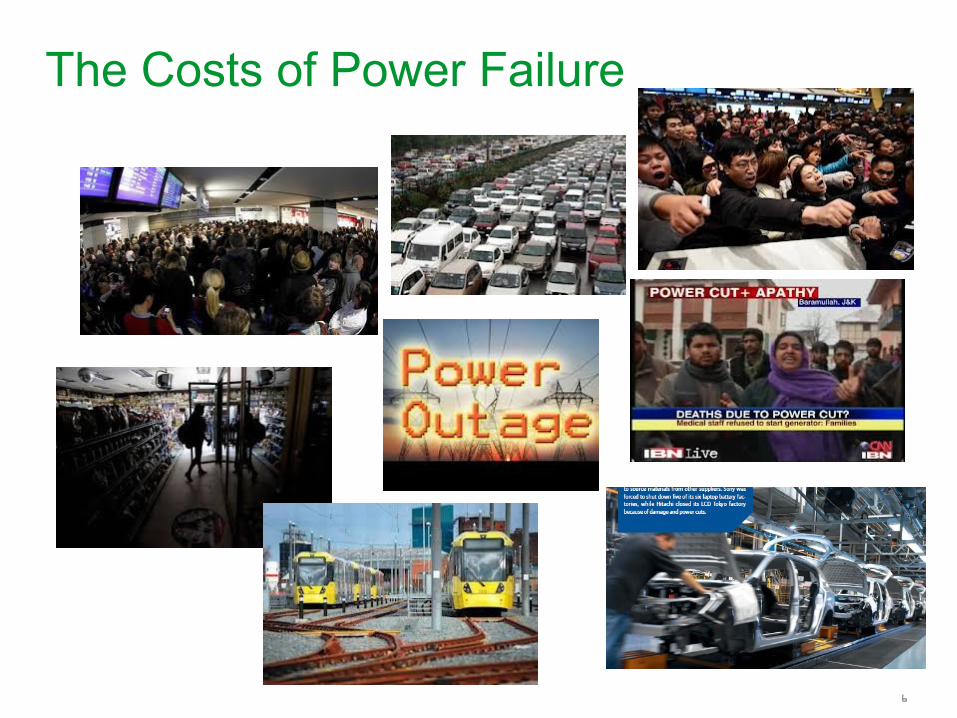
The Costs of Power Failure
7
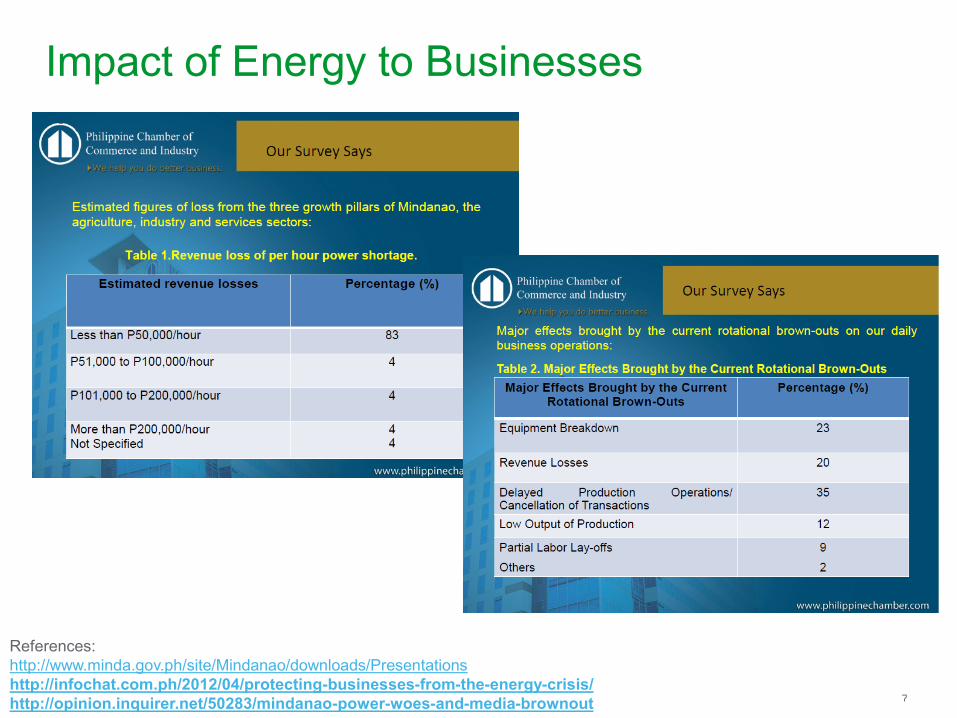
Impact of Energy to Businesses
References:
http://www.minda.gov.ph/site/Mindanao/downloads/Presentations
http://infochat.com.ph/2012/04/protecting-businesses-from-the-energy-crisis/
http://opinion.inquirer.net/50283/mindanao-power-woes-and-media-brownout
8
Controlling energy
risks should not just
be limited to having
emergency
generators!
- Michael Bruch, AGCS Allianz
9
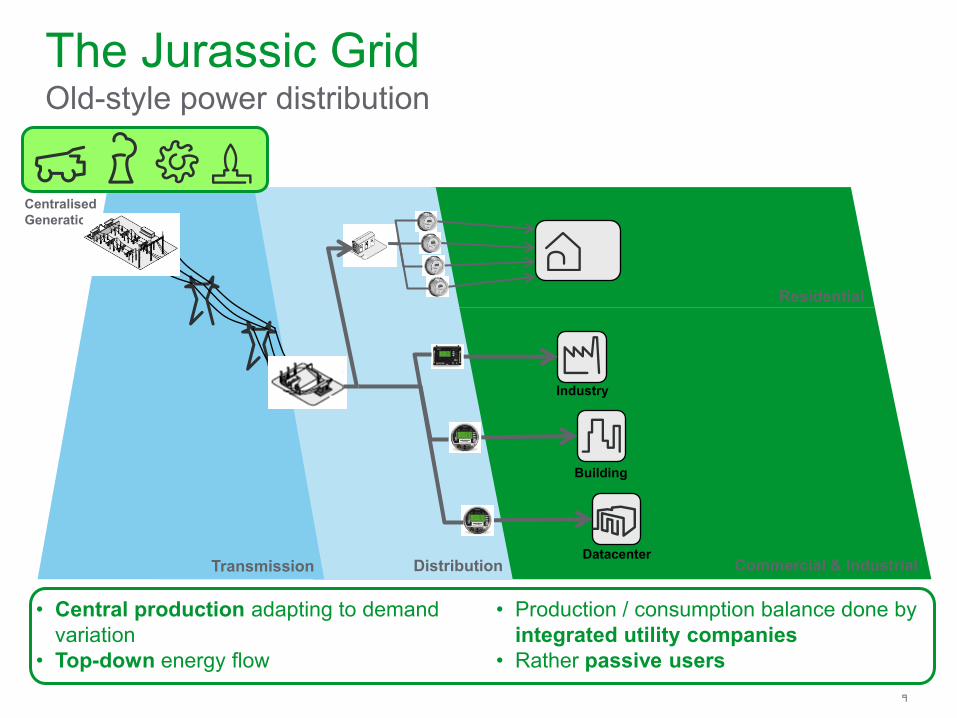
Transmission Commercial & Industrial
Residential
Distribution
The Jurassic Grid Old-style power distribution
Centralised
Generation
Industry
Building
Datacenter
• Central production adapting to demand
variation
• Top-down energy flow
• Production / consumption balance done by
integrated utility companies
• Rather passive users

10 Schneider Electric
Electricity networks are becoming more
complex, less stable!
Growing electricity demand
Need to reduce CO2 emissions Active government & regulators
Active end-users
Technology availability
Constraints on existing networks
accelerators
making the Smart Grid happen
drivers
To continue to efficiently balance supply & demand, the grid needs to become smarter
11 Schneider Electric
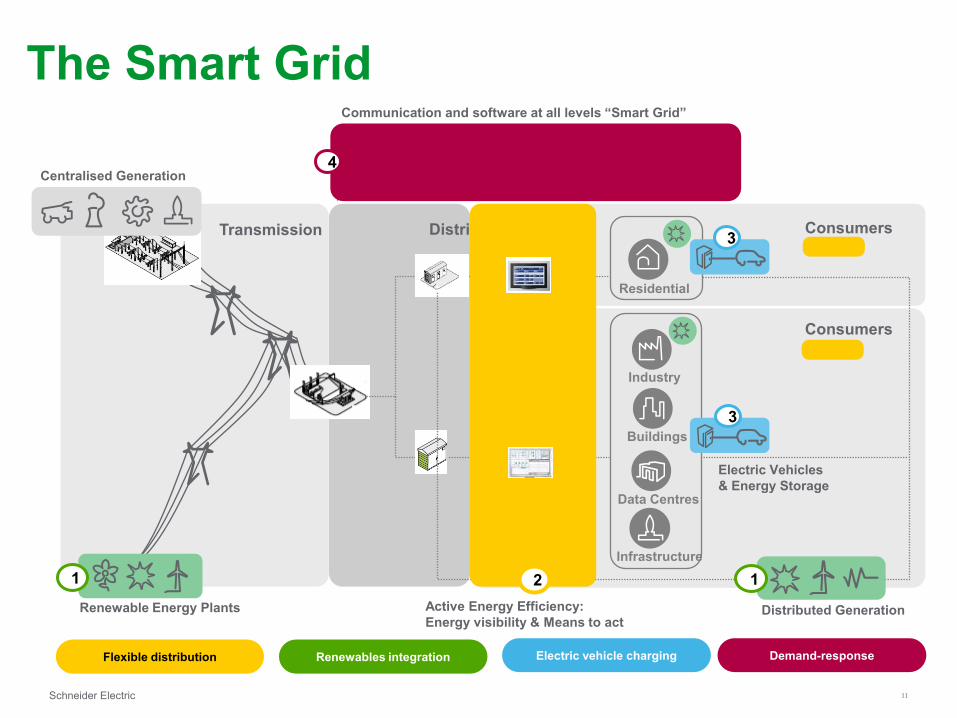
Transmission Distribution
Centralised Generation
Utility network Consumers
Industry
Buildings
Data Centres
Infrastructure
Distributed Generation
1
Renewable Energy Plants
1
Communication and software at all levels “Smart Grid”
4
Consumers
Consumers
Active Energy Efficiency:
Energy visibility & Means to act
2
Active
Active
Residential
3
Electric Vehicles
& Energy Storage
3
The Smart Grid
Flexible distribution Renewables integration Electric vehicle charging Demand-response
Schneider Electric 12
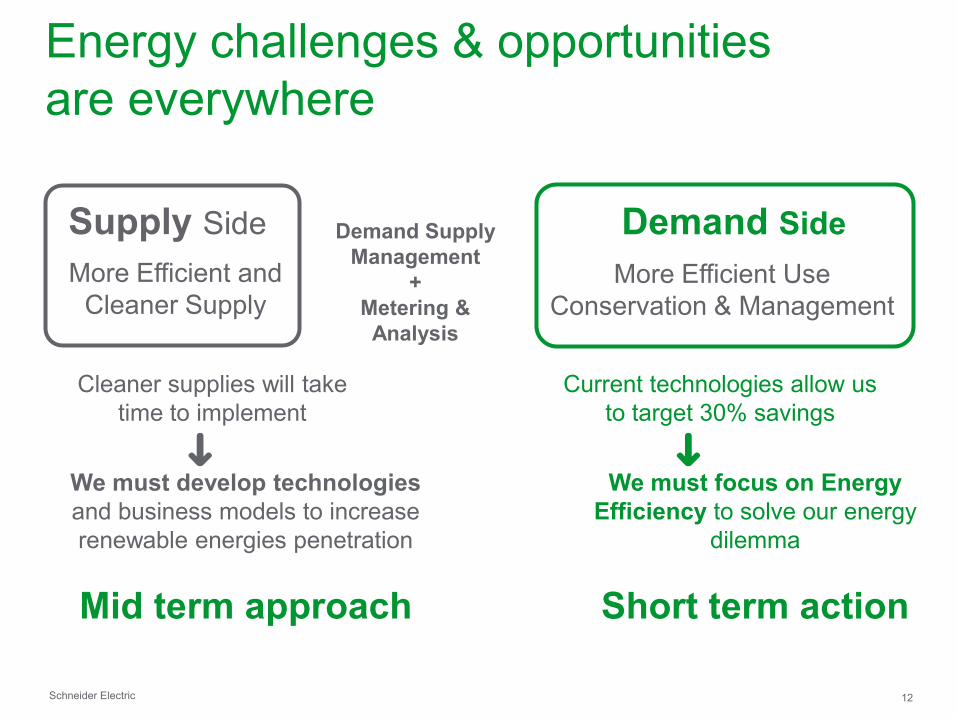
Energy challenges & opportunities
are everywhere
Demand Side
More Efficient Use
Conservation & Management
Supply Side
More Efficient and
Cleaner Supply
Demand Supply
Management
+
Metering &
Analysis
We must develop technologies
and business models to increase
renewable energies penetration
Mid term approach
Cleaner supplies will take
time to implement
We must focus on Energy
Efficiency to solve our energy
dilemma
Short term action
Current technologies allow us
to target 30% savings
13 Schneider Electric
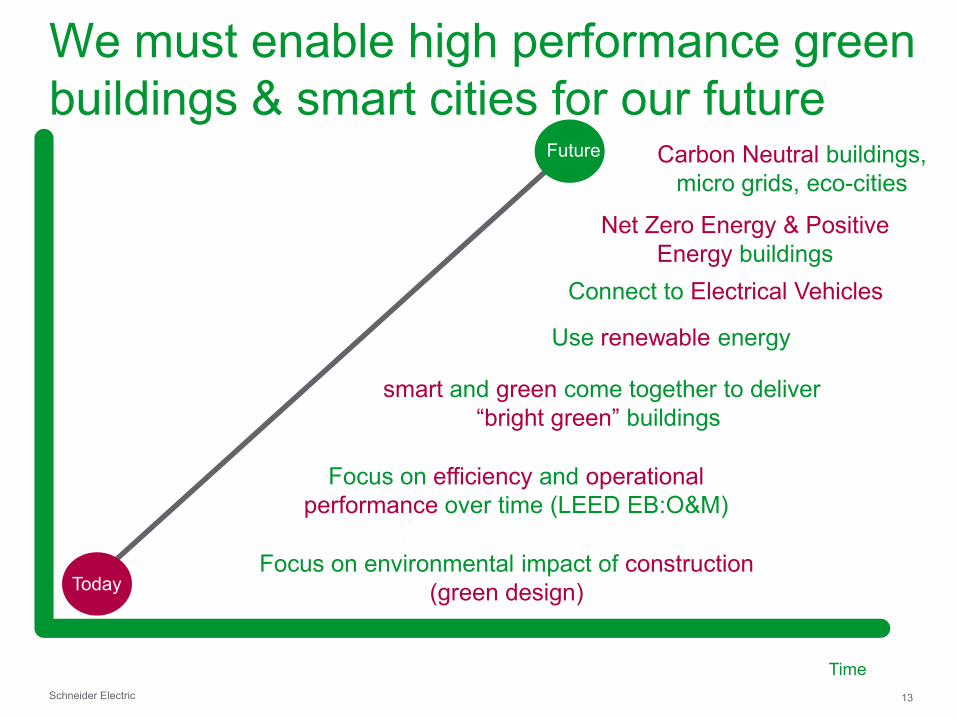
We must enable high performance green
buildings & smart cities for our future
Time
Today
Future
Focus on environmental impact of construction
(green design)
smart and green come together to deliver
“bright green” buildings
Focus on efficiency and operational
performance over time (LEED EB:O&M)
Use renewable energy
Net Zero Energy & Positive
Energy buildings
Carbon Neutral buildings,
micro grids, eco-cities
Connect to Electrical Vehicles
14 Schneider Electric
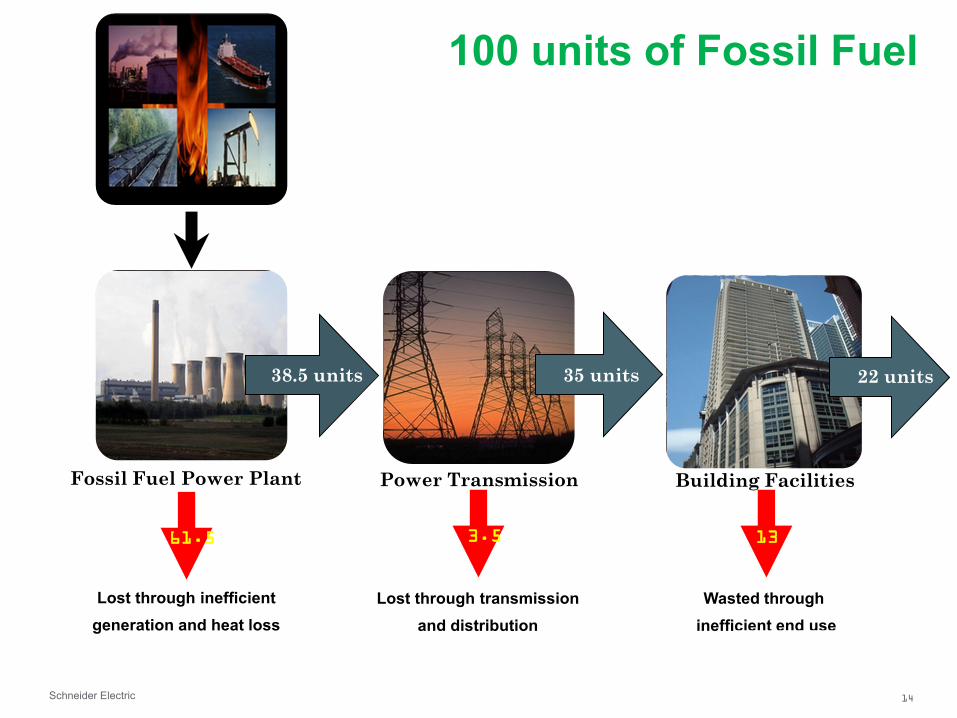
100 units of Fossil Fuel
Fossil Fuel Power Plant
38.5 units
Power Transmission
35 units
Building Facilities
22 units
61.5
Lost through inefficient
generation and heat loss
3.5
Lost through transmission
and distribution
13
Wasted through
inefficient end use
15 Schneider Electric
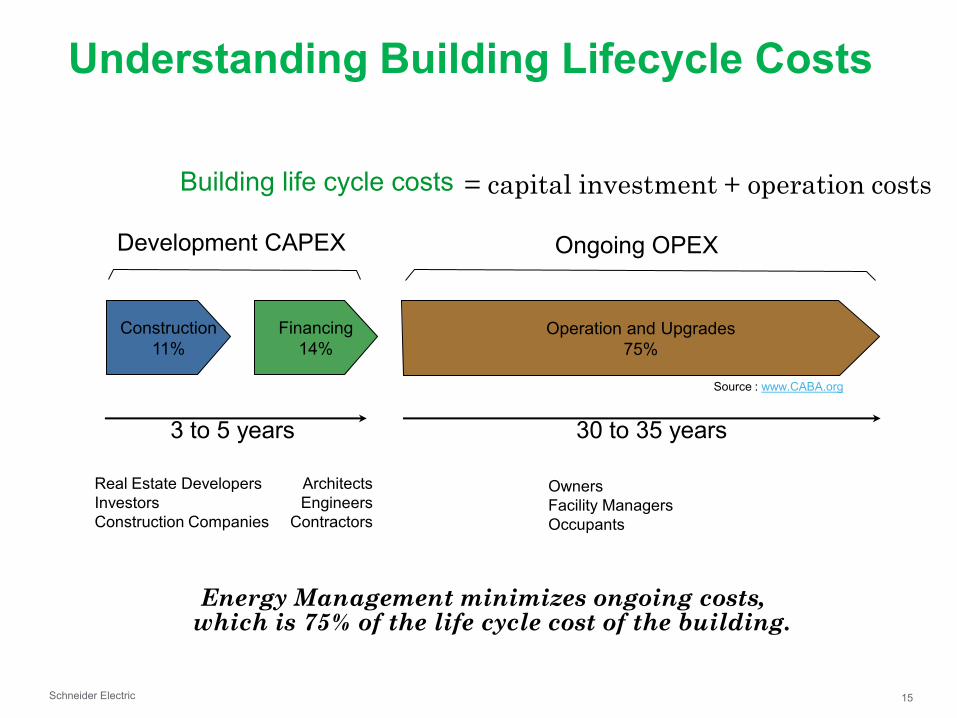
Understanding Building Lifecycle Costs
Building life cycle costs
Energy Management minimizes ongoing costs, which is 75% of the life cycle cost of the building.
Construction
11%
Financing
14%
Operation and Upgrades
75%
= capital investment + operation costs
Source : www.CABA.org
Development CAPEX Ongoing OPEX
3 to 5 years 30 to 35 years
Real Estate Developers
Investors
Construction Companies
Architects
Engineers
Contractors
Owners
Facility Managers
Occupants
16 Schneider Electric
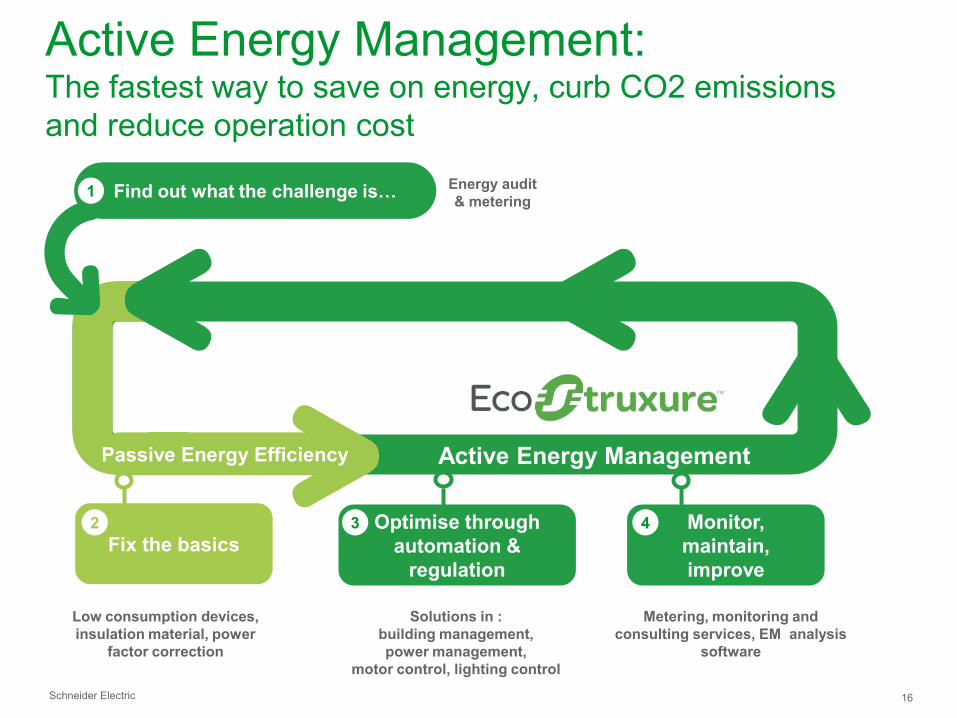
Low consumption devices,
insulation material, power
factor correction
Active Energy Management Passive Energy Efficiency
Optimise through
automation &
regulation
Monitor,
maintain,
improve
Fix the basics
Solutions in :
building management,
power management,
motor control, lighting control
Metering, monitoring and
consulting services, EM analysis
software
Active Energy Management: The fastest way to save on energy, curb CO2 emissions
and reduce operation cost
2 3 4
Find out what the challenge is… Energy audit
& metering 1

17
A few examples
of
REAL
$aving$
18
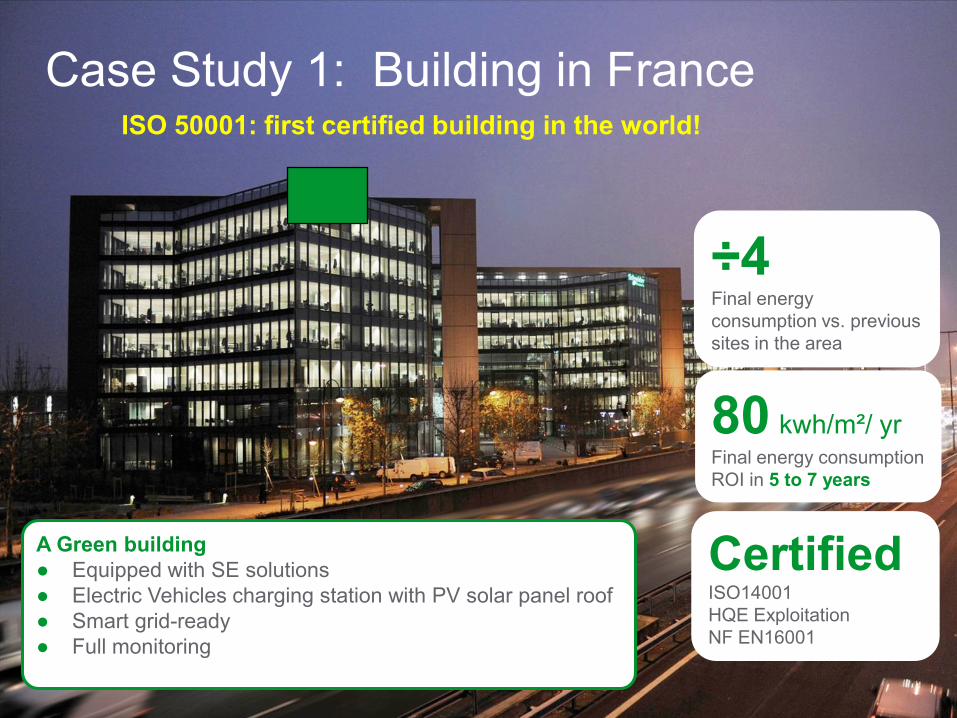
Case Study 1: Building in France
÷4 Final energy
consumption vs. previous
sites in the area
80 kwh/m²/ yr Final energy consumption
ROI in 5 to 7 years
Certified ISO14001
HQE Exploitation
NF EN16001
A Green building
● Equipped with SE solutions
● Electric Vehicles charging station with PV solar panel roof
● Smart grid-ready
● Full monitoring
ISO 50001: first certified building in the world!
20
21
22
23
24

25
Case Study 2: A Manufacturing Plant in Philippines
Schneider Electric 26
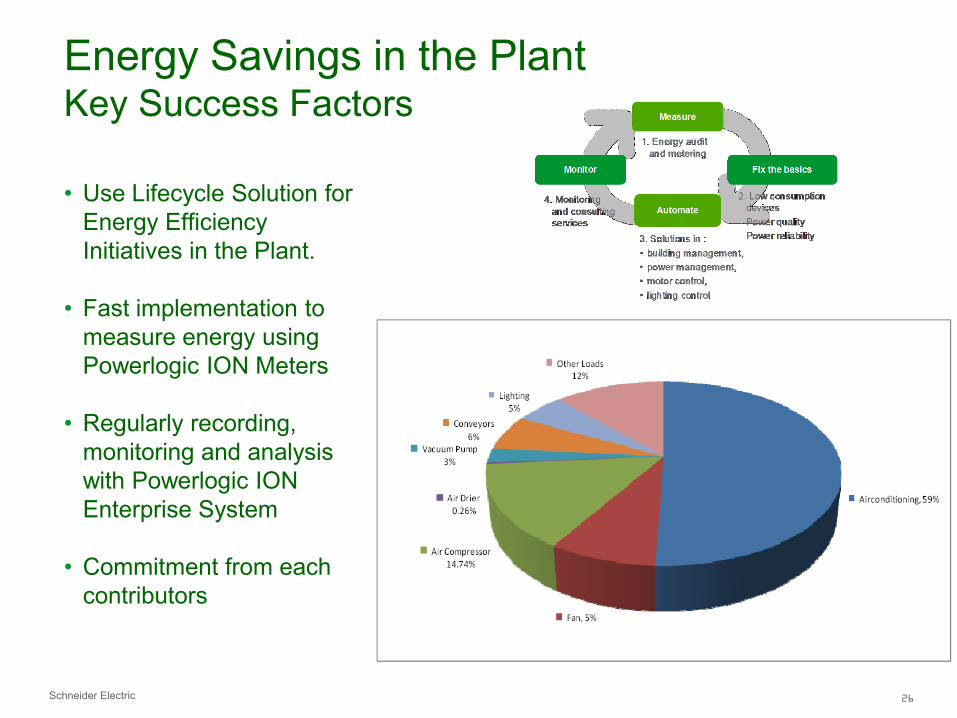
Energy Savings in the Plant Key Success Factors
• Use Lifecycle Solution for
Energy Efficiency
Initiatives in the Plant.
• Fast implementation to
measure energy using
Powerlogic ION Meters
• Regularly recording,
monitoring and analysis
with Powerlogic ION
Enterprise System
• Commitment from each
contributors
Schneider Electric 27
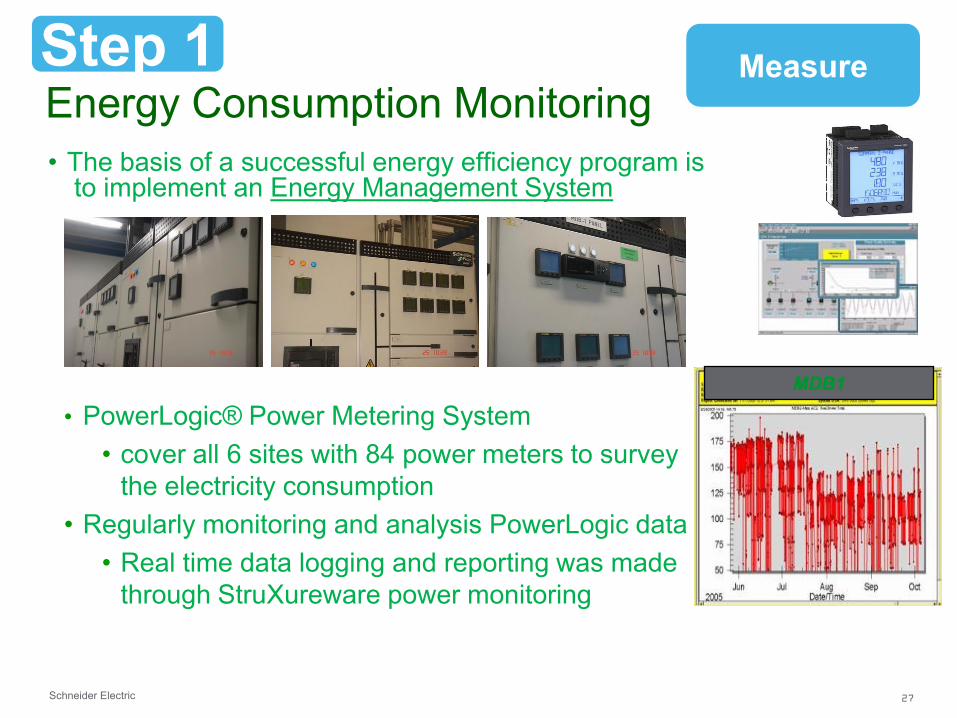
Energy Consumption Monitoring
• The basis of a successful energy efficiency program is to implement an Energy Management System
Savings: ~10%
Measure
• PowerLogic® Power Metering System
• cover all 6 sites with 84 power meters to survey
the electricity consumption
• Regularly monitoring and analysis PowerLogic data
• Real time data logging and reporting was made
through StruXureware power monitoring
MDBMDB11
Step 1
Schneider Electric 28
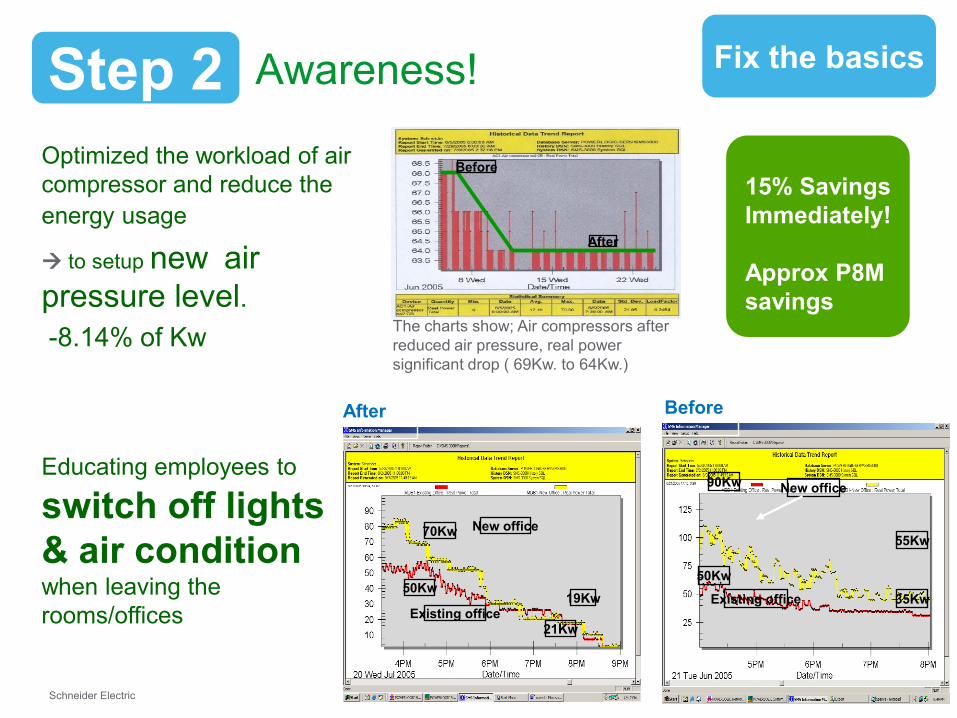
Fix the basics
Optimized the workload of air
compressor and reduce the
energy usage
to setup new air
pressure level.
-8.14% of Kw
Before
After
The charts show; Air compressors after
reduced air pressure, real power
significant drop ( 69Kw. to 64Kw.)
Educating employees to
switch off lights
& air condition when leaving the
rooms/offices
New office
Existing office
55Kw
90Kw
35Kw
50Kw
After
New office
Existing office 19Kw
70Kw
21Kw
50Kw
Before
Step 2 Awareness!
15% Savings
Immediately!
Approx P8M
savings
Schneider Electric 29
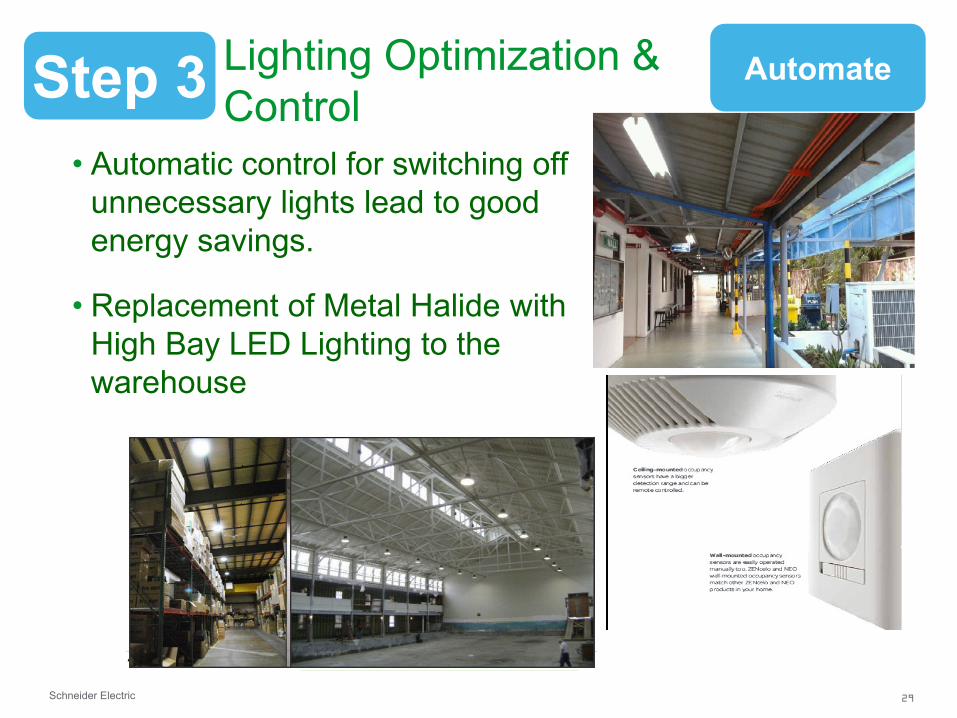
Lighting Optimization &
Control
• Automatic control for switching off
unnecessary lights lead to good
energy savings.
• Replacement of Metal Halide with
High Bay LED Lighting to the
warehouse
Savings: 5-7%
Step 3 Automate
Schneider Electric 30
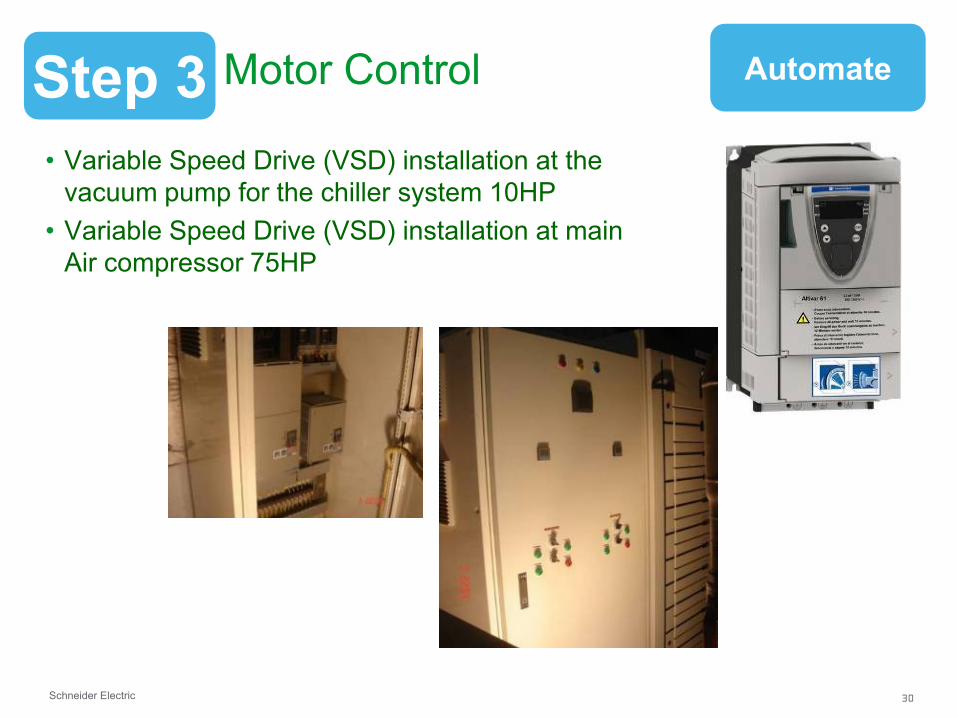
• Variable Speed Drive (VSD) installation at the
vacuum pump for the chiller system 10HP
• Variable Speed Drive (VSD) installation at main
Air compressor 75HP
Step 3 Automate Motor Control
Schneider Electric 31
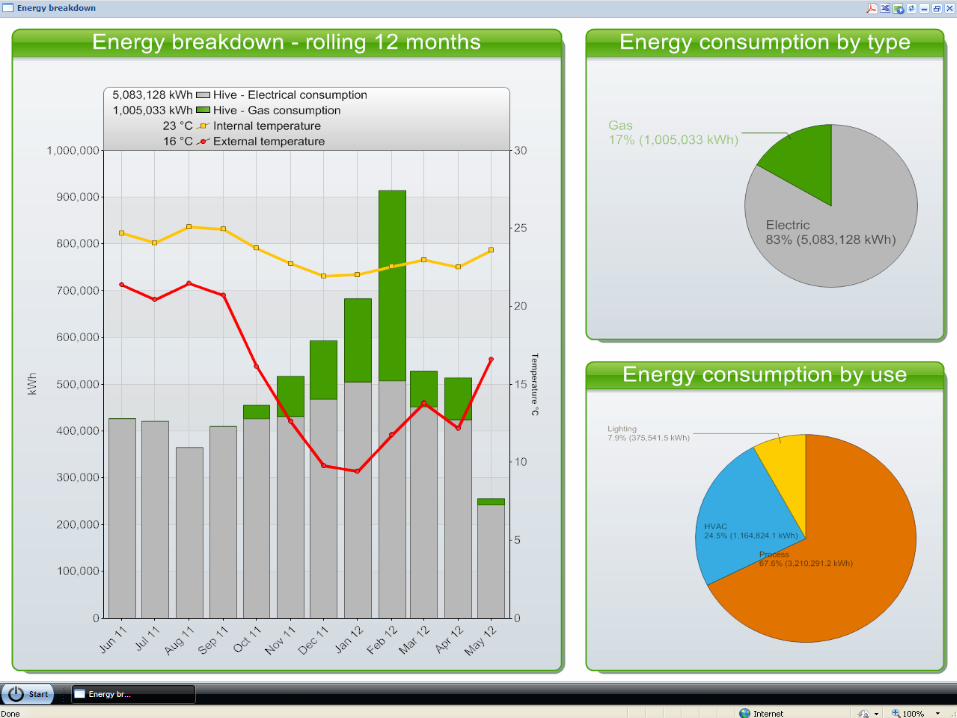
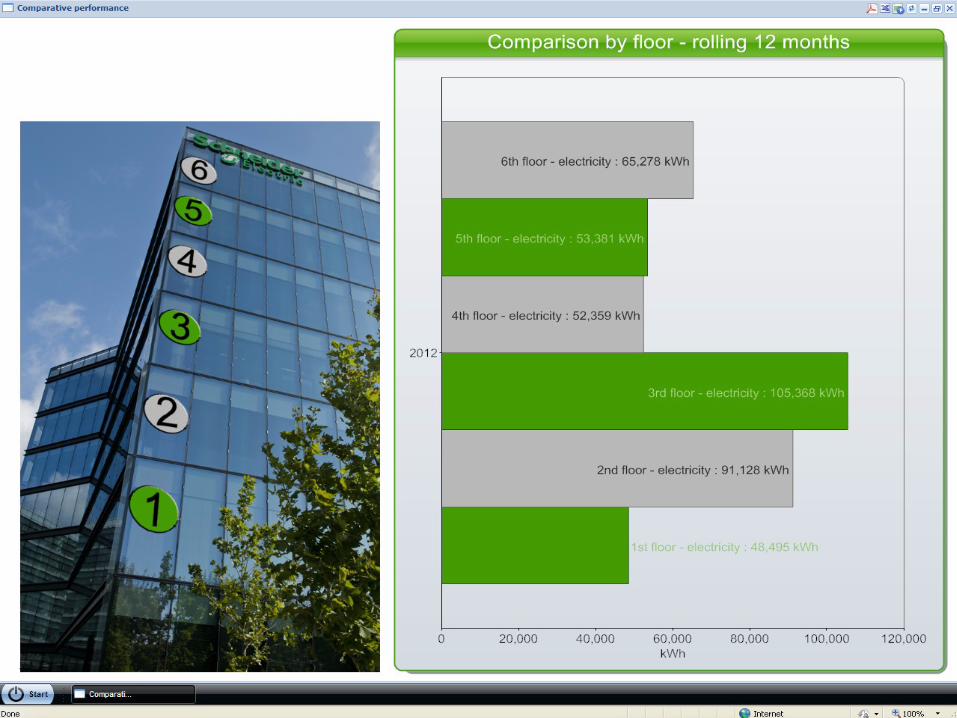
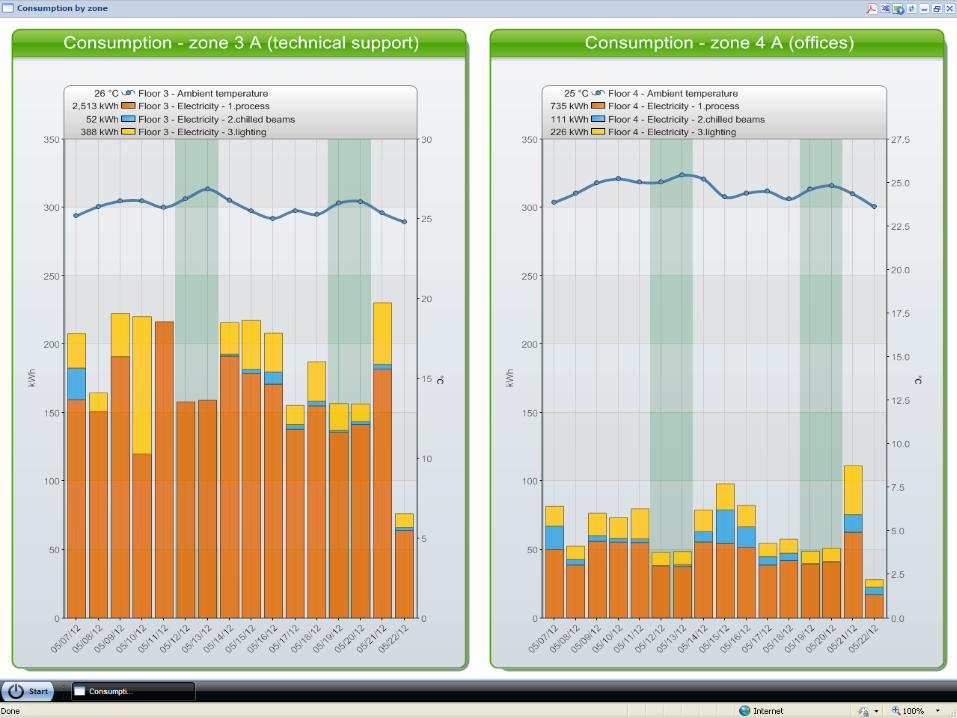
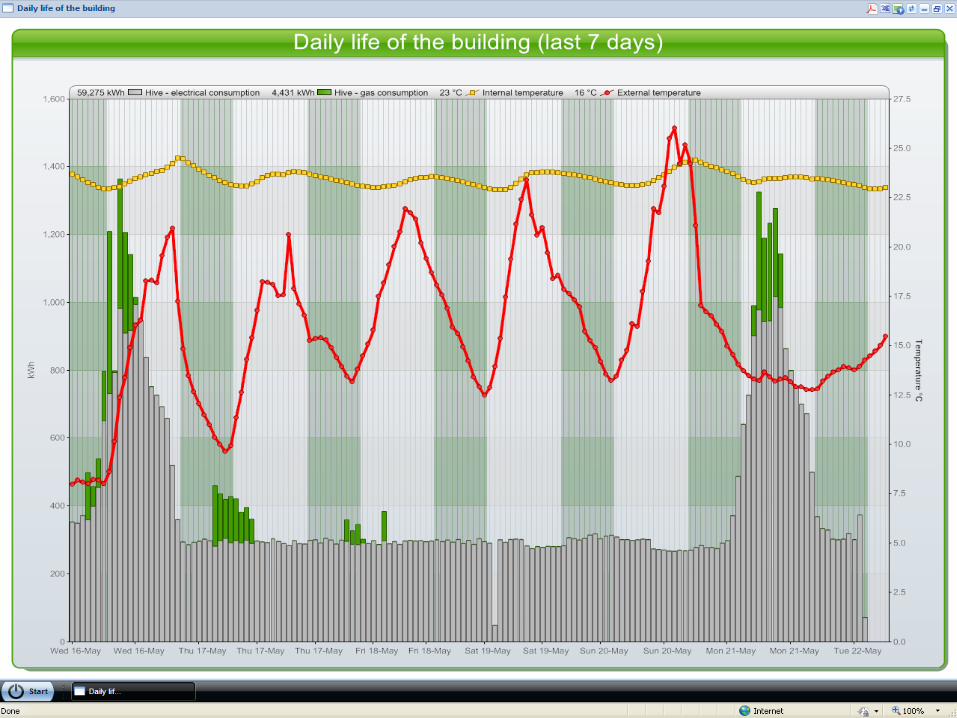
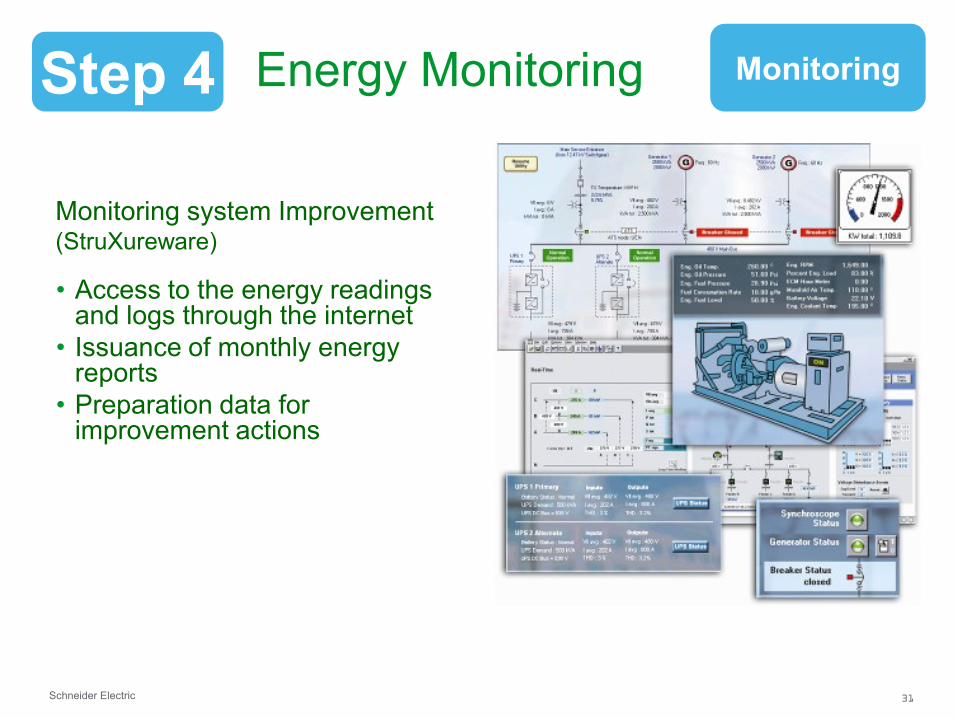
Energy Monitoring
• Access to the energy readings and logs through the internet
• Issuance of monthly energy reports
• Preparation data for improvement actions
Monitoring system Improvement (StruXureware)
Step 4 Monitoring

Schneider Electric 32
Results: Significant Energy Savings!
Initial Savings:
P43M worth
energy savings
3,953,576 kWh
savings
Schneider Electric 33
Case Study 3: A Factory in the Philippines
Energy Target Setting
Scope of Work:
• Analysis of electricity consumption
• Contract Tariff Analysis
• Transformer load & distribution
• Assessment of Industrial Services
• Compressed Air Generation
• Refrigeration Plant
• Cooling Tower
• Water Pumping
• Boiler house & Air heaters
• HVAC
• Lighting
• Assessment of Process
• Detailed Project Description with savings calculation and required CAPEX for the EE initiatives.

Schneider Electric 34
Energy Efficiency Initiatives: A Factory in Philippines
What was done?
• Replaced Air Handling Unit (AHU) chilled water distribution pumps with VFD and high efficiency pumps
• Replace Valve Absorption Motor (VAM) with electrical chillers
• New Cooling water pumps with VFD and new rerouted headers
• Install new cooling water pumps with VFD and new headers
• Improvement of Power Factor in electrical distribution
More than P45M
worth of savings
Above 6000 MWh
energy saved
equivalent of 0.0471
tons of CO2/t
28,980 trees to offset
per year!
As project is still ongoing, more savings are expected!
Schneider Electric 35
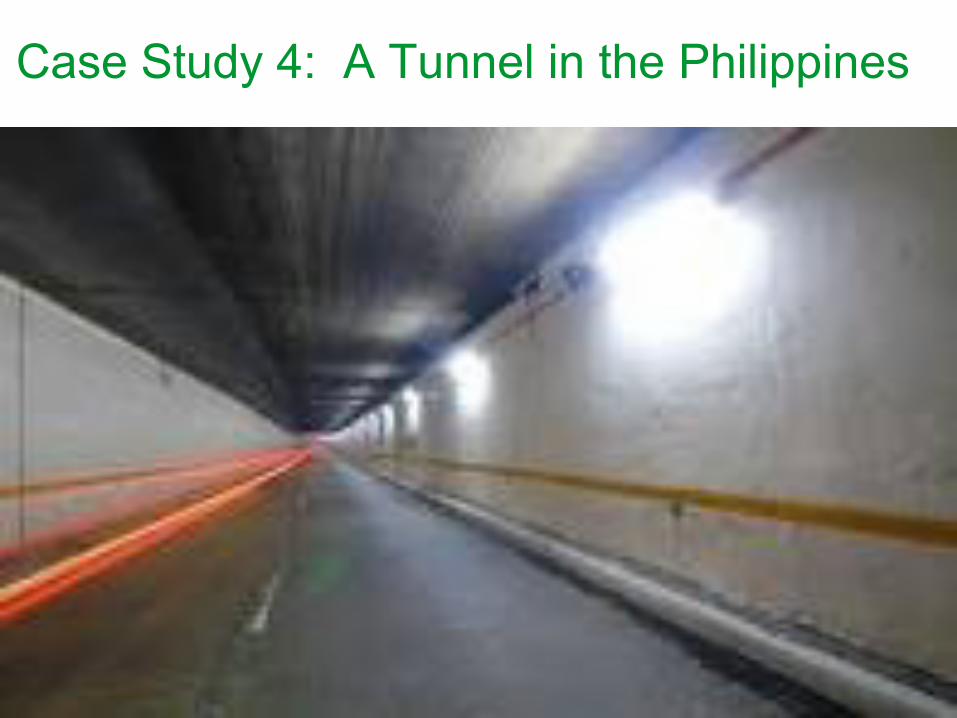
Case Study 4: A Tunnel in the Philippines

Schneider Electric 36
Solar Structure
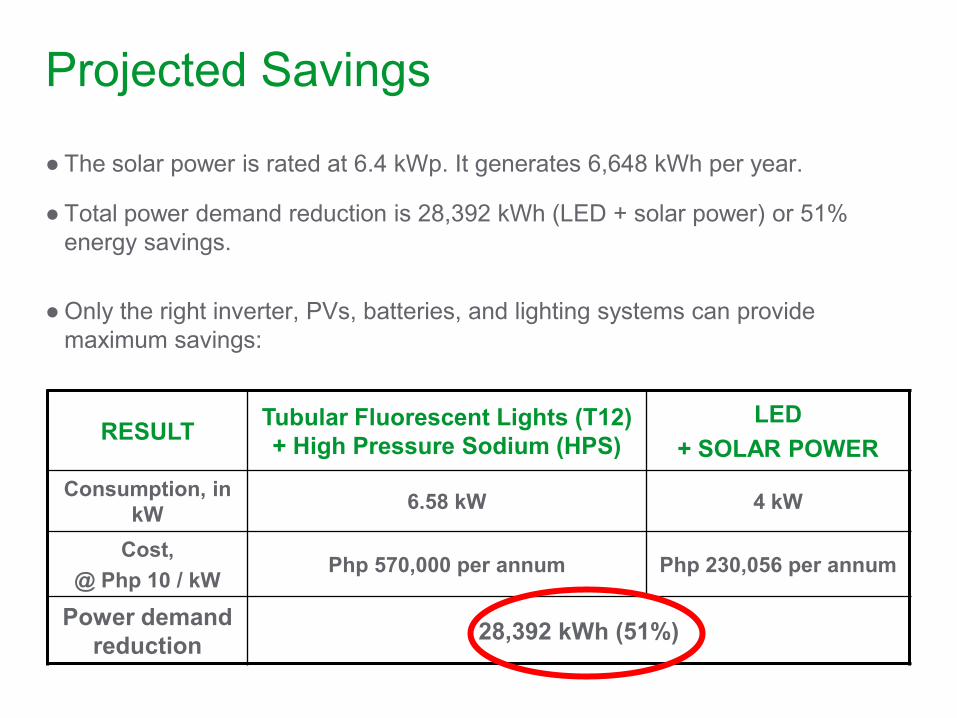
Projected Savings
● The solar power is rated at 6.4 kWp. It generates 6,648 kWh per year.
● Total power demand reduction is 28,392 kWh (LED + solar power) or 51%
energy savings.
●Only the right inverter, PVs, batteries, and lighting systems can provide
maximum savings:
RESULT Tubular Fluorescent Lights (T12)
+ High Pressure Sodium (HPS)
LED
+ SOLAR POWER
Consumption, in
kW 6.58 kW 4 kW
Cost,
@ Php 10 / kW Php 570,000 per annum Php 230,056 per annum
Power demand
reduction 28,392 kWh (51%)
We cannot stop energy demand growth
But we can change the way we
use energy and reduce GHG
emissions & eventually realize
the savings from energy reduction
In Conclusion
Schneider Electric 39
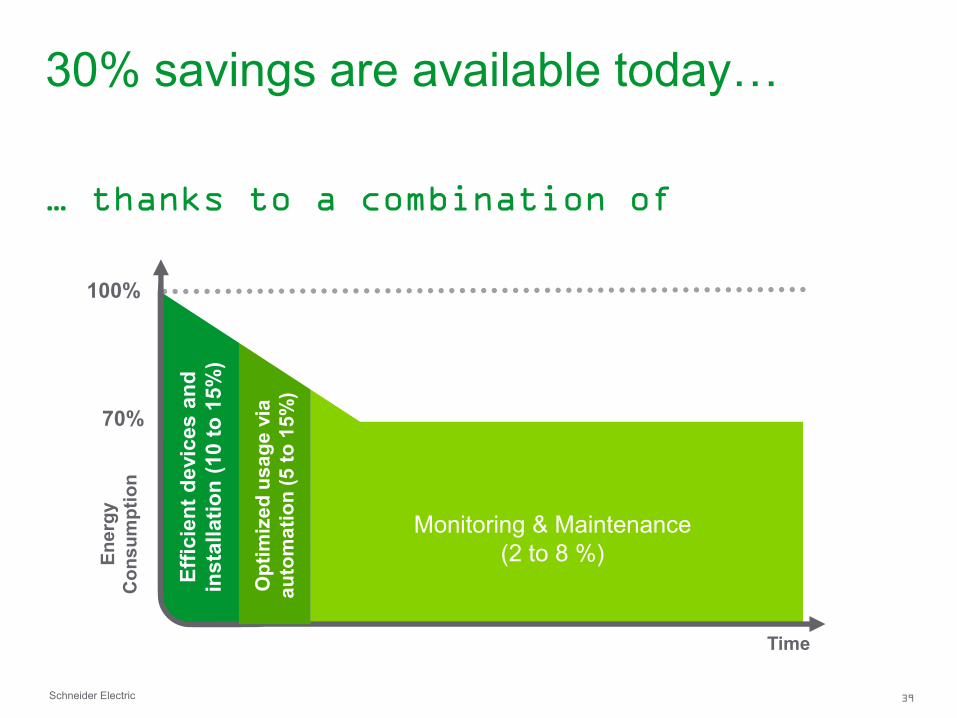
… thanks to a combination of
30% savings are available today… E
ne
rgy
Co
ns
um
pti
on
100%
70%
Eff
icie
nt
devic
es
an
d
insta
llati
on
(10 t
o 1
5%
)
Monitoring & Maintenance
(2 to 8 %)
• Up to 8% per year is lost without
monitoring and maintenance program
• Up to 12% per year is lost without
regulation and control systems
Time
Op
tim
ize
d u
sa
ge
via
au
tom
ati
on
(5
to
15
%)
Schneider Electric 40
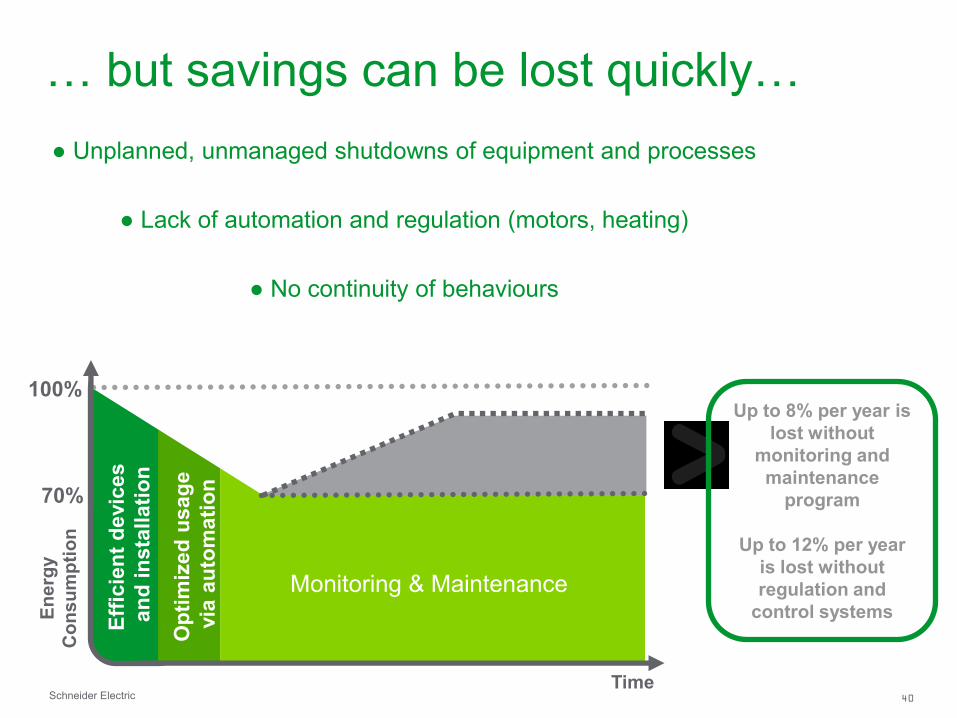
… but savings can be lost quickly… E
ne
rgy
Co
ns
um
pti
on
100%
70%
Eff
icie
nt
devic
es
an
d i
nsta
llati
on
Op
tim
ized
usag
e
via
au
tom
ati
on
Monitoring & Maintenance
Time
● Unplanned, unmanaged shutdowns of equipment and processes
● Lack of automation and regulation (motors, heating)
● No continuity of behaviours
Up to 8% per year is
lost without
monitoring and
maintenance
program
Up to 12% per year
is lost without
regulation and
control systems

We make the most of your energy!
Thank you