Electrical Rotating Machine APM Overview...electrical rotating machines design and manufacturing...
16
Electrical Rotating Machine APM Overview gepowerconversion.com
Transcript of Electrical Rotating Machine APM Overview...electrical rotating machines design and manufacturing...
Electrical Rotating Machine APM Overview
gepowerconversion.com

Abstract— Electrical Rotating Machine APM is the name of a new technology being developed by GE Power. The objective of the development was to create a disruptive solution for monitoring motor and generator health to detect impending failures with two main performance characteristics; a cost position low enough that would allow fleet-wide deployment, even covering low-voltage motors, and being deployable in brownfield applications. The overall intent is to create new service models with a digital component. The solution has been launched to date in oil and gas, metals, paper and marine.
I. IntroductionElectrical rotating machines (ERM) is the catch-all name for millions of motors and generators that work to power our world. Whether a steel mill, a cargo ship, an LNG plant or a production site manufacturing any one of a million different products; rotating machines are at the heart of our industrial ecosystem.
When an ERM fails, the consequences are significant; ranging from operational outages to significant power system disruptions including blackouts. For example, a mid-size LNG facility could suffer costs of $4 million/day through unplanned downtime. On a global scale, unplanned shutdowns in the process industry cost 5 percent of total annual production—that’s as much as $30 billion a year.
Traditionally, failures in rotating machines were detected using vibration sensors. However, vibration sensors are limited in the failure modes they can detect and therefore, common electrical failure issues such as insulation degradation in high- and medium-voltage motors, ground faults or broken rotor bars are not detectable. Furthermore, vibration sensors are relatively fragile and liable to fail themselves. The cost of hundreds, or perhaps thousands, of vibration sensors plus their installation make their universal deployment in large-scale processes uneconomic. This has led to monitoring being limited to critical machines.
The sharp decline in the cost of big data analytics and cloud solutions, along with new sensing techniques, has enabled a completely different way of monitoring the health of rotating machines.
Over the past year, several GE business units have been working to bring together different existing technologies within GE, such as Electrical Signature Analysis (ESA) from GE’s Global Research Centre (GRC), data acquisition & filtering techniques, together with electrical rotating machines design and manufacturing expertise from GE Power Conversion, to form a cost-effective, holistic rotating machine monitoring solution. Combining these technologies with GE Power Conversion’s intimate knowledge of the industries it serves and ERM and variable frequency drives (VFDs) technologies, a new and disruptive solution for monitoring ERMs that does not require vibration sensors has been created.
II. Market ERMs and VFDs are ubiquitously used across all industries. Per IHS [1], every year, roughly 41 million low-voltage (LV) and 60,000 medium-voltage (MV) motors are manufactured. Each year, more and more rotating machines are being applied with VFD technology due to the energy efficiency savings vs. direct speed technologies, which means that most of those motors will be accompanied by a VFD or some other form of power electronics, like automatic voltage regulators or exciters.
A. SteelSteel is used in almost every aspect of day-to-day life – from cars to construction, from cargo ships to surgical scalpels. This ubiquity has not stopped the steel industry from suffering from the worst downturn in 50 years, driven by unbalanced supply and demand. Last year, China—the world’s largest producer and consumer of steel—announced over half a million redundancies as part of a program to manage overcapacity within the steel making industry.
A steel processing plant presents a challenging environment for any equipment, and breakdowns and operational disruptions are a common occurrence. Avoiding unplanned downtime is a critical driver of productivity, customer experience and profitability, but maintaining equipment to ensure peak performance drives costs upwards. As important as avoiding unplanned downtime is maintaining production quality and controlling energy consumption.
The steel companies that will thrive in an ever more-competitive environment will be those that manage to address those challenges and continue to improve their profitability even during the challenging downturn of the market.
1. Digital solutions for one of the world’s original inventions
The production of steel requires significant numbers of rotating machines – a single processing line can have hundreds of motors running conveyor belts and driving rolling mills, all of which have an impact on product quality, productivity and ultimately profits. Therefore, ensuring they stay online and working optimally is crucial.
Every single step in a production process can generate powerful data, and that’s no different for the rotating machines deployed in a steel mill. If you want to understand intimately how the process is behaving, there is no better place to look at than the information provided by the heart and muscles of the process – the motors and the drives.
2. Solving the billion dollar problem1
A single hot strip mill can lose up to $30 million in annual revenue to unplanned downtime. With the hot strip mill being only one part of finished steel processing, this extrapolates to billions of dollars of revenue lost across the industry. To avoid this loss, motors need to be monitored to ensure that failures are caught in advance and parts replaced before an operational disruption occurs.
Maintenance costs are a very large expenditure item for process plants, potentially higher in value than unplanned maintenance. Reduction of maintenance costs by leveraging better asset and process information and providing prescriptive analytics vs. prognostics (see Section 11) will provide operators with the right information at the right time and recommendations on what actions to take. Once operators have gained confidence in the intelligence provided by these types of systems, substantial reductions in maintenance costs can be achieved by avoidance of unnecessary maintenance actions.
1 All financial figures in this section were derived from continued customer interviews and discovery sessions.
B. PaperPaper is another industry that has motors and drives at the core of its process.
A paper mill will typically produce between 2,000 to 3,000 tons of paper per day using about 60 million gallons of water. Typically, they have no finished product storage and manufacture to order, so any loss of production due to unplanned downtime translates directly to lost profit.
One paper plant may have up to 4,000 motors. Most of them will be driven by VFDs. Operators typically deploy every type of VFD, from common bus PWM drives to standalone to LCI, and nearly every combination of DOL and protection schemes. A large paper mill manufacturer will spend around $65 million/year on motors, both new and repair.
The energy consumed in a paper mill, a large percentage of which is consumed in electric motors, places paper amongst the top five most energy intensive industries [2].
In a typical paper mill, the total process downtime due to motor faults is between $16 million and $35 million/year in lost production time, not including repairs, time and material, etc., as the loss is quantified before the repair is done to categorize it. For the typical paper mill the cost of downtime is $25,000 per hour.
A sophisticated paper manufacturer will have a lot of reliability analysis systems, both offline or online with portable test kits. They outsource the offline testing to third-party companies and use the data reactively not proactively.
Being able to detect bearing or vibration issues through electrical signal analysis represents a huge opportunity for paper mill operators, as it would allow them to detect the root cause of issues and cover their full fleet from small to large motors.
C. Other IndustriesAlthough the numbers stated reflect our current understanding of steel and paper industries, the fact remains that the pain points are generally common to any process industry in which there is a large concentration of rotating machines and drives. As such, the solution and services described in this paper will be equally applicable to other industries such as gas separation, petrochemical, mining, marine, etc.
III. The GE DifferenceA. Edge & Cloud Analytics Over the past few years, a plethora of companies capable of doing big data analytics have been created. Those companies usually rely on agnostic algorithms that make use of historical data to create “envelopes of normality” of how a healthy asset or process operates. By understanding the points in time at which failures occurred and identifying the data patterns that led to those failures, the algorithms can “learn” to identify various failure modes as they begin to develop and to some extent predict when failures will occur. These methods are undoubtedly powerful, and GE makes use of them too with great success in multiple applications. The great advantage is that, given enough historical data, there is no need to have deep expertise on the asset to be able to create good analytics. However, they suffer several limitations, for example:
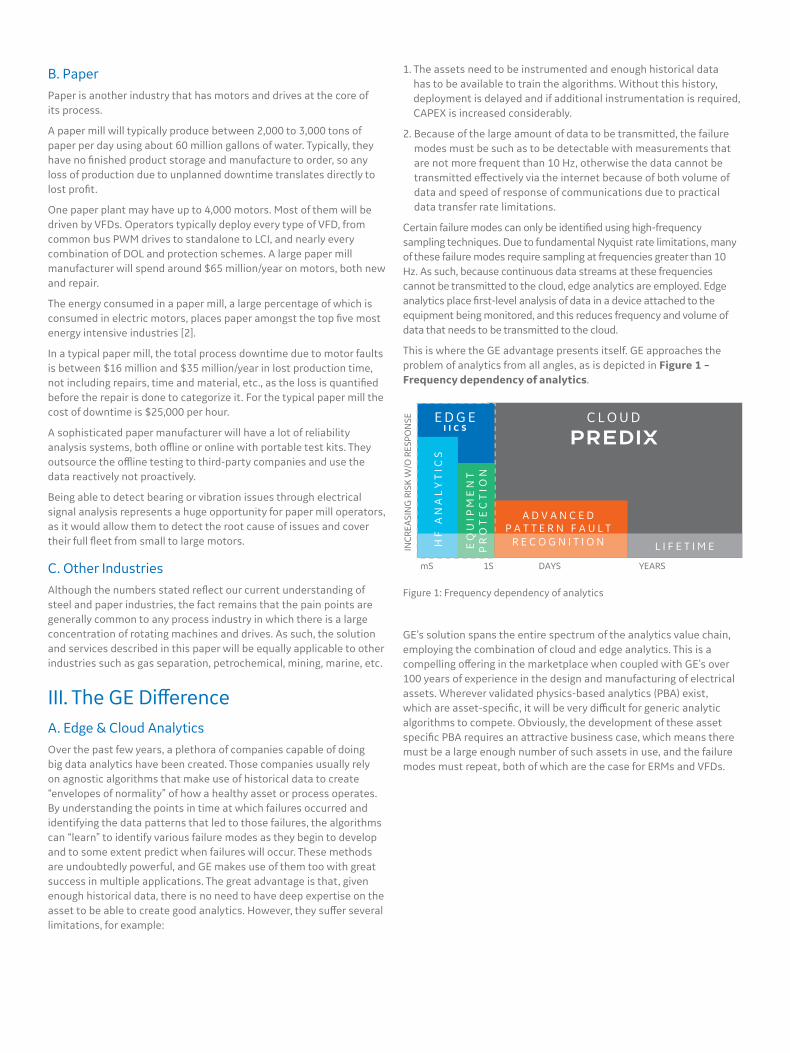
Figure 1: Frequency dependency of analytics
1. The assets need to be instrumented and enough historical data has to be available to train the algorithms. Without this history, deployment is delayed and if additional instrumentation is required, CAPEX is increased considerably.
2. Because of the large amount of data to be transmitted, the failure modes must be such as to be detectable with measurements that are not more frequent than 10 Hz, otherwise the data cannot be transmitted effectively via the internet because of both volume of data and speed of response of communications due to practical data transfer rate limitations.
Certain failure modes can only be identified using high-frequency sampling techniques. Due to fundamental Nyquist rate limitations, many of these failure modes require sampling at frequencies greater than 10 Hz. As such, because continuous data streams at these frequencies cannot be transmitted to the cloud, edge analytics are employed. Edge analytics place first-level analysis of data in a device attached to the equipment being monitored, and this reduces frequency and volume of data that needs to be transmitted to the cloud.
This is where the GE advantage presents itself. GE approaches the problem of analytics from all angles, as is depicted in Figure 1 – Frequency dependency of analytics.
GE’s solution spans the entire spectrum of the analytics value chain, employing the combination of cloud and edge analytics. This is a compelling offering in the marketplace when coupled with GE’s over 100 years of experience in the design and manufacturing of electrical assets. Wherever validated physics-based analytics (PBA) exist, which are asset-specific, it will be very difficult for generic analytic algorithms to compete. Obviously, the development of these asset specific PBA requires an attractive business case, which means there must be a large enough number of such assets in use, and the failure modes must repeat, both of which are the case for ERMs and VFDs.
E D G E C L O U D
L I F E T I M E
A D V A N C E D P A T T E R N F A U L T
R E C O G N I T I O N EQ
UIP
ME
NT
P
RO
TE
CT
ION
HF
AN
AL
YT
ICS
INC
REA
SIN
G R
ISK
W/O
RES
PON
SE
1S DAYS YEARS mS
I I C S
IV. PHYSICS-BASED ANALYTICSFailure mode detection through PBA techniques, such as electrical signature analysis (ESA), analysis in the phasor domain or creating digital twins of the ERM and VFD, are not new techniques: the first publications date back to the ’80s. However, it is a technique that industrially has not been exploited to its full potential until now. The PBA algorithms continuously monitor the stator voltage and current of the ERMs and capture it in the form of a time series. In a continuous fashion, the algorithms convert those time series to the frequency domain by calculating the Fast Fourier Transform (FFT) of these time series and closely monitoring for changes in the frequency domain. They also transform the time series to the phasor domain and the time series are compared with the theoretical output of the ERM digital twin, generated taking into account the operational inputs. All of these techniques provide a holistic view of the ERM and different types of analytics to maximize the chance of detecting a failure.
Through years of research and experience, and thanks to a deep understanding of the design and failure mechanisms of ERMs, different algorithms have been developed that are capable of not only detecting a change in the behavior of the ERM, but also identifying the specific failure mode that is developing.
The basic principle of PBA is to develop very high-fidelity physics-based models of the ERMs and VFDs that incorporate all the knowledge of the design and manufacturing engineers of these assets. Analyses of multiple parameters of these assets and continuous comparison against the model predicted behavior allow for the detection of nascent defects. However, to fully understand PBA techniques, it’s important to first, understand frequency analysis, as it plays a very important role in failure mode detection.
A. Fast Fourier Transform and the Frequency DomainAll mechanical systems will have natural modes. When those systems are excited by motion, they respond by vibrating around the frequencies dictated by their natural modes. A first order mode system will vibrate around a single frequency. A second order system will vibrate around the frequencies dictated by its two natural modes.
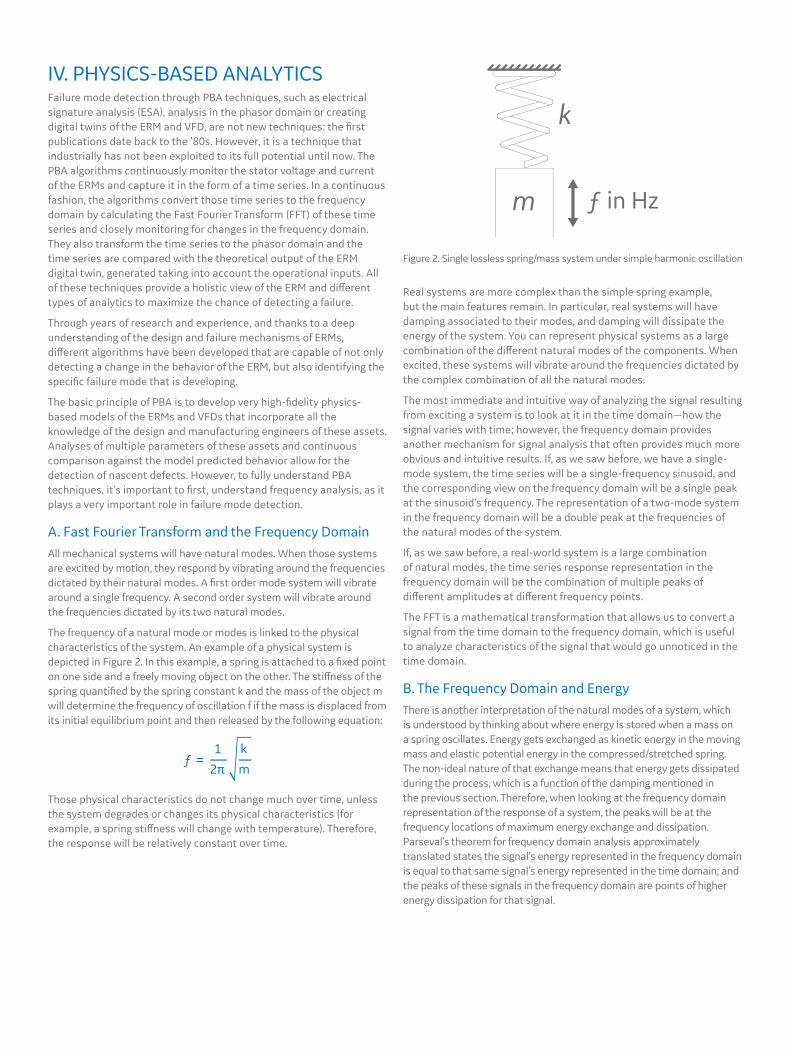
The frequency of a natural mode or modes is linked to the physical characteristics of the system. An example of a physical system is depicted in Figure 2. In this example, a spring is attached to a fixed point on one side and a freely moving object on the other. The stiffness of the spring quantified by the spring constant k and the mass of the object m will determine the frequency of oscillation f if the mass is displaced from its initial equilibrium point and then released by the following equation:
Real systems are more complex than the simple spring example, but the main features remain. In particular, real systems will have damping associated to their modes, and damping will dissipate the energy of the system. You can represent physical systems as a large combination of the different natural modes of the components. When excited, these systems will vibrate around the frequencies dictated by the complex combination of all the natural modes.
The most immediate and intuitive way of analyzing the signal resulting from exciting a system is to look at it in the time domain—how the signal varies with time; however, the frequency domain provides another mechanism for signal analysis that often provides much more obvious and intuitive results. If, as we saw before, we have a single-mode system, the time series will be a single-frequency sinusoid, and the corresponding view on the frequency domain will be a single peak at the sinusoid’s frequency. The representation of a two-mode system in the frequency domain will be a double peak at the frequencies of the natural modes of the system.
If, as we saw before, a real-world system is a large combination of natural modes, the time series response representation in the frequency domain will be the combination of multiple peaks of different amplitudes at different frequency points.
The FFT is a mathematical transformation that allows us to convert a signal from the time domain to the frequency domain, which is useful to analyze characteristics of the signal that would go unnoticed in the time domain.
B. The Frequency Domain and EnergyThere is another interpretation of the natural modes of a system, which is understood by thinking about where energy is stored when a mass on a spring oscillates. Energy gets exchanged as kinetic energy in the moving mass and elastic potential energy in the compressed/stretched spring. The non-ideal nature of that exchange means that energy gets dissipated during the process, which is a function of the damping mentioned in the previous section. Therefore, when looking at the frequency domain representation of the response of a system, the peaks will be at the frequency locations of maximum energy exchange and dissipation. Parseval’s theorem for frequency domain analysis approximately translated states the signal’s energy represented in the frequency domain is equal to that same signal’s energy represented in the time domain; and the peaks of these signals in the frequency domain are points of higher energy dissipation for that signal.
Those physical characteristics do not change much over time, unless the system degrades or changes its physical characteristics (for example, a spring stiffness will change with temperature). Therefore, the response will be relatively constant over time.
Figure 2. Single lossless spring/mass system under simple harmonic oscillation

If the physical system doesn’t change over time, then its blueprint (the normal response expected from the asset) in the frequency domain should also remain constant. Therefore, when, over time, the frequency representation of a signal measured in a system changes and, for example, with a spike in the frequency spectrum appearing, the conclusions that can be reached are that:
1. Something has changed in the system.
2. There’s a new element in the system in which energy is being exchanged and dissipated at a new frequency, and since this new frequency component has appeared over time, it could be resulting from degradation or change of the system. That’s where PBA techniques come in.
C. Failure ModesTable 1 depicts a list of the different failure modes and electrical supply parameter estimations that can be detected using PBA techniques. Not all algorithms will be ready from the initial release of the product, but there will be a continuous effort of validation over time.
V. ANALYTICS TUNING AND CONTINUOUS IMPROVEMENT
A. Overview A largely unexplored area on the now somewhat trite topic of industrial analytics is the metrics to measure the effectiveness of the analytics and how to incorporate the field return of experience to ensure continuous improvement. This is a very interesting area, as today most companies working in the areas of digital and industrial analytics will talk at length about the quality of their algorithms, but nothing at all about how we measure that quality and what process and mechanisms are in place to ensure that the results obtained during the life of the analytic is fed back into the original algorithm to improve its performance. At GE, we’ve incorporated our experience in service agreement execution in this topic and established a very strong process.
B. The Confusion Matrix The starting point to determine whether an algorithm is performing well or not is defining the possible outcomes of that algorithm. To that purpose, the confusion matrix determines four possible outcomes for a binary test, plus a series of metrics associated to those outcomes:
True Positive (TP): An alarm is raised and after a predetermined period of time, the asset fails or signals of impending failure are apparent.
False Positive (FP): An alarm is raised and after a predetermined period of time the asset doesn't fail or signals of impending failure are not apparent.
True Negative (TN): No alarm is raised and no impending failure is identified.
False Negative (FN): An asset failure occurs without prior alarm being raised.
Associated to these outcomes we can define the following metrics:
TABLE I. ANALYTICS
DETECTION METHOD
MOTOR/GENERATORTECHNOLOGY (MV/LV)
FOUR POSSIBLE OUTCOMES FOR A BINARY TEST
Figure 3. Confusion Matrix
Positive Condition
Negative Condition
Test Outcome Positive
True Positive (TP)
False Positive (FP)
Positive Predicted Value
(PPV)
Test Outcome Negative
False Negative (FN)
True Negative (TN)
Negative Predicted Value
(NPV)
True Positive Rate Sensitivity
(TPR)
True Negative Rate or Specifity
(TNR)

Whereas all metrics are interesting, we focus mainly on the TPR and the PPV, as they are the ones most highly correlated with the financial metrics we try to optimize. The TPR, in effect, is related to the avoided cost of downtime, as every failed asset makes the customer incur unplanned downtime. Assuming that when a TP is received, action is taken to replace the asset, the PPV measures the cost of replacing one asset when the positive is wrongly diagnosed, and is in effect a FP, so the asset did not need to be replaced.
Those costs are application dependent, and therefore, the tuning of the algorithms will be done in conjunction with them.
C. Algorithm Thresholding In order to achieve the optimal performance of each algorithm, we calculate the Receiver Operation Curve. This curve represents, for a given operation point of the asset and a given algorithm, the relation between TPR and PPV, see Figure 4. Out of this curve, an operation point will be chosen that will minimize the cost function between avoiding cost of down-time and replacing an asset, which will be done in collaboration with the customer. As an example, when looking at a rolling table of a steel mill with LV motors and drives, it might be more cost-effective to replace the motor at the least sign of degradation than to have any FN. On the opposite end of the spectra, when monitoring the electric thruster on a marine vessel, we might want to avoid at all costs replacing an asset unless there is absolute certainty that the asset is going to fail, so the operational point chosen in the curve will be other.
D. Return of Experience Once the Motor Fleet APM system is connected and the optimal point on the ROC curve has been selected, the algorithms associated with the different failure modes will start calculating the Health Indexes (HIs) automatically. Every event will be categorized in one of the four categories mentioned above, and over time a distribution will be generated that will look like that of Figure 5.
True Positive Rate (TPR): Rate at which the condition is detected positive, given that the condition is positive.
False Positive Rate (FPR): Rate at which a positive response was given when the condition was actually negative.
Positive Predicted Value (PPV): Rate at which the positive response/alarm generation correctly predicted the condition actually existing given that there is a positive response (an alarm was generated).
False Discovery Rate (FDR): Rate of production of tests that are incorrect (nuisance alarms).
False Negative Rate (FNR): Rate that we declare the condition is not present, given that the condition is present (undetected failures).
ROC Curve
Optimal TPR/PPV for this curve
Perfect Detectability TPR=100%, PPV=100%
Figure 4. Receiver Operation Curve
Figure 5. Health Indexes Distribution
However, this is only the beginning of the work. The intent is to continuously improve both the algorithms and the thresholds so as to minimize the cost function and therefore the overlap between TN and TP and therefore, minimize FN and FP.
In order to achieve that, it is of the utmost importance to have a feedback loop between the performance of the algorithms on the field and the results. This is the mission of the Managed Services team and the target of the process mentioned above. The overall intent of that process is to capture 100 percent of those instances in which the algorithm did not behave as expected, analyze the data leading to that instance and, if required, do a post-mortem analysis of the actual asset to confirm the physical status of the asset when compared to the represented status provided by the analytics. A high-level representation of that process can be seen in Figure 6 on next page.
This feedback loop is the cornerstone to the long-term accuracy of the algorithms. It is to be expected that, when applying the algorithms to a new technology, there is some overlap between the TN and the TPs curves, as in Figure 5. With enough time and data, the algorithms and the thresholds will be improved.
Threshold SelectedFault Index Distribution, Fault Severity Within Acceptable Limits
Fault Index Distribution, Fault Severity Exceeds Acceptable Limit in Motor
TN TP
FN FP
Fault Index Value

VI. RMDM PLATFORM FOR PBAThe Rotating Machines Diagnostic Module (RMDM) HW platform utilizes a standard industrial controller for the sampling of the data and algorithm execution. For both cost-of-development and time-to-market reasons, an existing platform has been used.
The product has two different variants, with different HW platforms associated with them, as depicted in Figure 7.
A. Series 100x – PECe Lite BasedThe initial platform chosen was the PECe Lite, which is a low-cost industrial controller used in LV VFDs. This controller has very fast I/O capabilities, as it was designed as a power electronics control platform. That fast I/O characteristic has been used to sample current and voltage
True Positive True Negative
False Positive False Negative
Figure 6. Continuous Improvement Process
Figure 7. RMDM Product Variants
up to 5 kHz, which, as discussed above, is the frequency required for the most complex application of the ESA algorithms.
Although the system is a 12-bit system, via oversampling, the equivalent accuracy of a 16-bit system is achieved, which allows it to match the resolutions achieved by more expensive commercial systems.
The 10x version is capable of monitoring 1 or 2 ERMs depending on whether or not we include High Sensitivity Current Transformers (HSCT).
B. Series 300x – RXi Based The 300 series uses the high-performance version of the PECe Lite, the RXi controller, which offers a higher power processor. This allows the controller to monitor more than one motor by connecting multiple motors via a fast-sampling remote I/O and examining all the motors in a round-robin configuration.
To process FFTs and obtain sufficiently accurate results, you need a continuously sampled data set that is stable over the entire window of data. The operating system of the controller, called High-Performance Controller for Industry (HPCi), will store time series from all motors connected, sequencing between them, analyze which of the time series collected is adequate for FFT calculation and once it’s found such a data set, perform the FFT and the ESA analytics.
The approach brings Edge analytics to almost any ERM application. The advantage of this configuration is that, for a high number of motors, there is a dramatic reduction in the cost of deploying monitoring on each ERM. This is a step change in the practicality of deploying monitoring, therefore achieving a truly disruptive solution to large processes.
RMDM B T V P H – xxx
B – Product Variant1 = PECe Lite Based – 1 or 2 Motors/Generators Max3 = Rxi Based – Up to 20 motors
T – Temperature Option0 = no temperature1 = temperature option
V – Vibration Option0 = no vibration1 = vibration option
P – Power Supply Option0 = no power supply1 = power supply option
H – Insulation Degradation Option— = no HSCTH = HSCT option
– xxx – Environmental Option– ATX = ATEX Environment– MAR = Marine Environment
Collect newly available data
from Edge monitoring system
Repair faulted machine and implement lessons
learned if applicable
Revise Fault Index algorithms and re-process data if needed
Evaluate False Positive and False
Negative Rates
Update Thresholds using ROC Curve
Analysis
Post-Mortem Assessment: Receive motor from site and determine the actual physical fault parameters that caused the fault/ failure
Analyze data with algorithms
in the cloud
Compare calculated Fault Index values to
defined Threshold
C. FunctionalityThe conversion of the relevant signals from the time domain to the frequency domain along with the ESA algorithms are executed in the RMDM box. Once an algorithm raises an alarm, the alarm is communicated to APM and a high-frequency snapshot of data is uploaded to the cloud for storage and further analysis.
In addition, the RMDM box will also take periodic snapshots of high-frequency data and upload it for storage in the cloud. The RMDM box also contains functionality to accept remote triggers of data snapshots.
VII. CONNECTIVITY ARCHITECTUREEstablishing the correct architecture is as important as having the right building blocks. This properly designed architecture brings everything together and allows for:
1. Simple and safe connectivity of the sensors at site.
2. Reliable transmission of the data to the cloud, with cybersecurity at the core.
3. Accessibility of that data by the service team who will be making data-driven decisions.
4. Scalability to enable the system to grow over time as more assets get integrated and monitored.
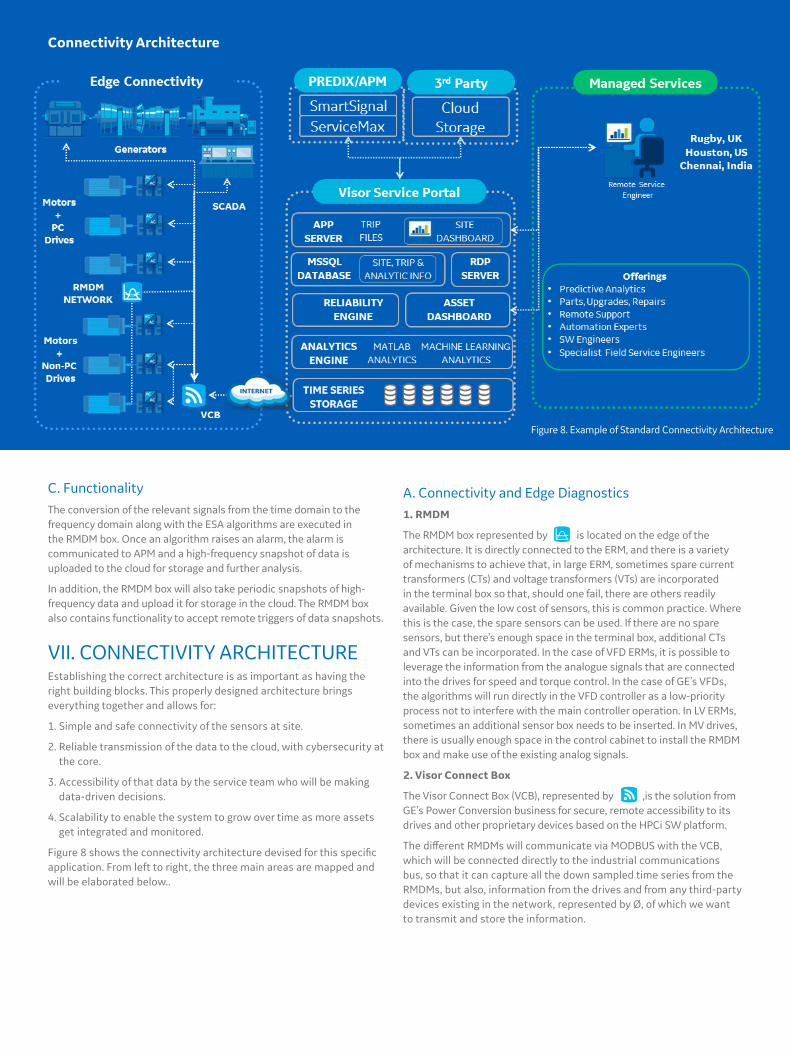
Figure 8 shows the connectivity architecture devised for this specific application. From left to right, the three main areas are mapped and will be elaborated below..
Figure 8. Example of Standard Connectivity Architecture
A. Connectivity and Edge Diagnostics1. RMDM
The RMDM box represented by is located on the edge of the architecture. It is directly connected to the ERM, and there is a variety of mechanisms to achieve that, in large ERM, sometimes spare current transformers (CTs) and voltage transformers (VTs) are incorporated in the terminal box so that, should one fail, there are others readily available. Given the low cost of sensors, this is common practice. Where this is the case, the spare sensors can be used. If there are no spare sensors, but there’s enough space in the terminal box, additional CTs and VTs can be incorporated. In the case of VFD ERMs, it is possible to leverage the information from the analogue signals that are connected into the drives for speed and torque control. In the case of GE’s VFDs, the algorithms will run directly in the VFD controller as a low-priority process not to interfere with the main controller operation. In LV ERMs, sometimes an additional sensor box needs to be inserted. In MV drives, there is usually enough space in the control cabinet to install the RMDM box and make use of the existing analog signals.
2. Visor Connect Box
The Visor Connect Box (VCB), represented by ,is the solution from GE’s Power Conversion business for secure, remote accessibility to its drives and other proprietary devices based on the HPCi SW platform.
The different RMDMs will communicate via MODBUS with the VCB, which will be connected directly to the industrial communications bus, so that it can capture all the down sampled time series from the RMDMs, but also, information from the drives and from any third-party devices existing in the network, represented by Ø, of which we want to transmit and store the information.
Connectivity Architecture

The VCB is a GE product with 20 years’ experience and hundreds of units shipped. The Visor™ Service Portal is GE’s own secure remote access point for all of GE’s equipment via the VCB. The VCB provides the following functionality:
• Remote connectivity for service engineering.
• Storage of all information pertinent to the site.
• 256 gigabytes of local storage of historical site data (90 days), including time-series data (analogue and digital).
• Automated archiving of historical site data onto portable media or remote transfer via ftp.
• 100+ industrial protocols compatible.
• Drive trips notification for PEC/PECe-based devices.
• Automatic service case management on system fault.
• Two or three (for dual-network sites) firewalls to isolate the VCB from admin and control networks and provide a secure DMZ zone.
As the RMDM is also based on HPCi, the VCB is also used to provide analytics and SW remote upgrades to ensure that the most accurate level of prognostics is always available on-site.
B. Analytics and Data ManagementAs discussed above, the VCB will securely transmit information to the cloud. Once in the cloud, the time series will be stored in the data lake for future usage. The fault indices and alarms will also be stored and time stamped to the time series to ensure that future trending of alarms versus time series leading to those alarms is possible.
All alarms are accessible via APM, which is the main point of data consumption for both the customer and the M&D engineers. Within APM, asset models that cover all ERM technologies are created, so that we can correlate and trend failure modes with respect to different ERM technologies, sizes and technical characteristics.
Within the APM product, a site hierarchy that will represent the customer plant and process will be created.
Managed services, which will be explained below, are offered, leveraging the data contained within this architecture.
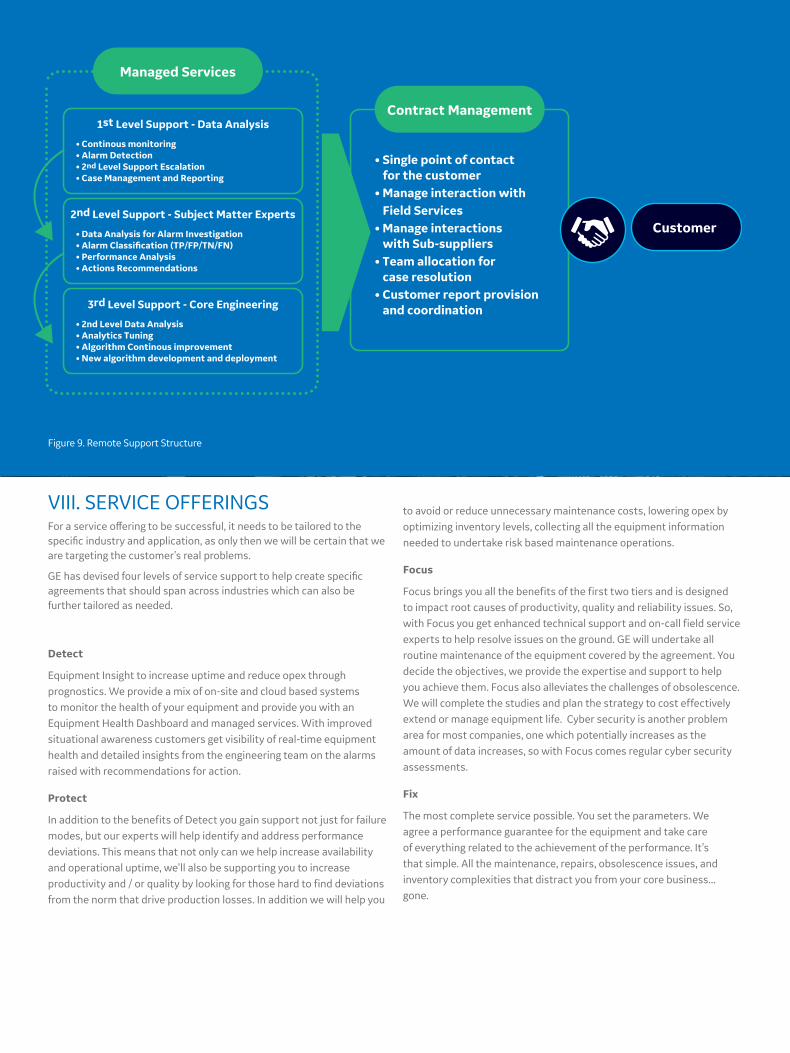
C. Managed ServicesOnce the data is in APM, it is critical to have a support organization capable of monitoring the data and responding with added value insights once an issue arises.
The support organization is in charge of driving internal processes, actions to deliver the customers’ multiyear agreements plus ensuring that the analytics are continuously improved using the return from experience.
A strong service organization begins with a strong support organization, which, together with the intimate knowledge of industrial assets and applications, and our edge-to-cloud solutions, are some of the key features of differentiation that GE has from other companies with offerings in this market, such as Microsoft or IBM.
The support organization is organized in different levels. As the complexity of the problem increases, its resolution is passed to different levels of support [5].
1. 1st Level Support – Data Analysts
Data Analysts team continuously monitors the health status of all assets under management and will examine every alarm raised by our analytics globally. In the case that our internal escalation processes require further data analysis, the Data Analysts team will engage the 2nd Level Support team in close collaboration with the contract manager.
Once the case is closed, the Data Analysts team is in charge of drafting up the case report that will be provided to the contract manager.
2. 2nd Level of Support – Subject Matter Experts
The 2nd Level Support team is comprised of experienced subject matter experts, asset experts and field service engineers. Main responsibilities include:
• Configure algorithms to specific technologies after initial deployment.
• Technical review of alerts with product and process expertise.
• Examine the data leading to the fault in order to draft a recommendation for action.
• Diagnose operational or asset health anomalies.
• Produce customer communication reports including all pertinent tech data.
• Generate all asset performance reports.
3. 3rd Level of Support – Core Engineering
The 3rd Level Support team is in charge of the algorithm fine-tuning and continuous development. In the case of false positives or false negatives, the Core Engineering team will intervene to further tune or correct the algorithm.
The Core Engineering team is also in charge of the continuous improvement of the algorithms and ensures that the field experience driven continuous improvement incorporated into the analytics.
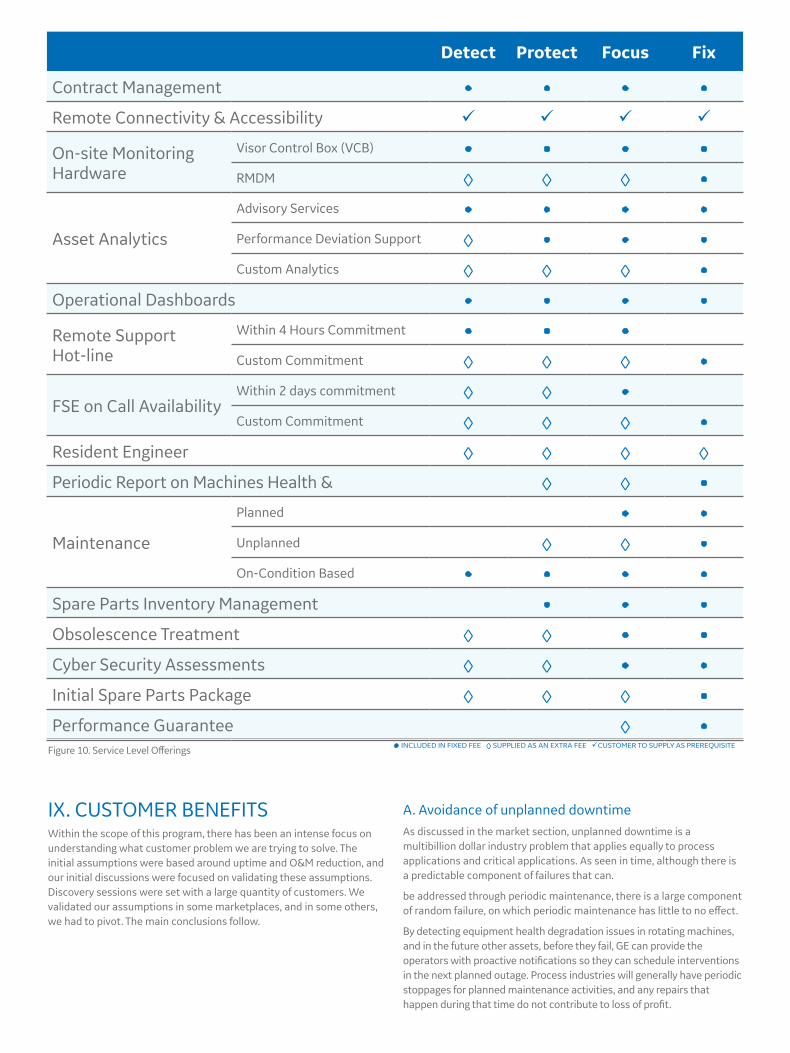
to avoid or reduce unnecessary maintenance costs, lowering opex by optimizing inventory levels, collecting all the equipment information needed to undertake risk based maintenance operations.
Focus
Focus brings you all the benefits of the first two tiers and is designed to impact root causes of productivity, quality and reliability issues. So, with Focus you get enhanced technical support and on-call field service experts to help resolve issues on the ground. GE will undertake all routine maintenance of the equipment covered by the agreement. You decide the objectives, we provide the expertise and support to help you achieve them. Focus also alleviates the challenges of obsolescence. We will complete the studies and plan the strategy to cost effectively extend or manage equipment life. Cyber security is another problem area for most companies, one which potentially increases as the amount of data increases, so with Focus comes regular cyber security assessments.
Fix
The most complete service possible. You set the parameters. We agree a performance guarantee for the equipment and take care of everything related to the achievement of the performance. It’s that simple. All the maintenance, repairs, obsolescence issues, and inventory complexities that distract you from your core business... gone.
VIII. SERVICE OFFERINGSFor a service offering to be successful, it needs to be tailored to the specific industry and application, as only then we will be certain that we are targeting the customer’s real problems.
GE has devised four levels of service support to help create specific agreements that should span across industries which can also be further tailored as needed.
Detect
Equipment Insight to increase uptime and reduce opex through prognostics. We provide a mix of on-site and cloud based systems to monitor the health of your equipment and provide you with an Equipment Health Dashboard and managed services. With improved situational awareness customers get visibility of real-time equipment health and detailed insights from the engineering team on the alarms raised with recommendations for action.
Protect
In addition to the benefits of Detect you gain support not just for failure modes, but our experts will help identify and address performance deviations. This means that not only can we help increase availability and operational uptime, we’ll also be supporting you to increase productivity and / or quality by looking for those hard to find deviations from the norm that drive production losses. In addition we will help you
Figure 9. Remote Support Structure
Managed Services
1st Level Support - Data Analysis
• Continous monitoring• Alarm Detection• 2nd Level Support Escalation• Case Management and Reporting
• Single point of contact for the customer• Manage interaction with Field Services• Manage interactions with Sub-suppliers• Team allocation for case resolution• Customer report provision and coordination
2nd Level Support - Subject Matter Experts
• Data Analysis for Alarm Investigation• Alarm Classi�cation (TP/FP/TN/FN)• Performance Analysis• Actions Recommendations
3rd Level Support - Core Engineering
• 2nd Level Data Analysis• Analytics Tuning• Algorithm Continous improvement • New algorithm development and deployment
Contract Management
Customer
IX. CUSTOMER BENEFITSWithin the scope of this program, there has been an intense focus on understanding what customer problem we are trying to solve. The initial assumptions were based around uptime and O&M reduction, and our initial discussions were focused on validating these assumptions. Discovery sessions were set with a large quantity of customers. We validated our assumptions in some marketplaces, and in some others, we had to pivot. The main conclusions follow.
A. Avoidance of unplanned downtimeAs discussed in the market section, unplanned downtime is a multibillion dollar industry problem that applies equally to process applications and critical applications. As seen in time, although there is a predictable component of failures that can.
be addressed through periodic maintenance, there is a large component of random failure, on which periodic maintenance has little to no effect.
By detecting equipment health degradation issues in rotating machines, and in the future other assets, before they fail, GE can provide the operators with proactive notifications so they can schedule interventions in the next planned outage. Process industries will generally have periodic stoppages for planned maintenance activities, and any repairs that happen during that time do not contribute to loss of profit.
Figure 10. Service Level Offerings • INCLUDED IN FIXED FEE ◊ SUPPLIED AS AN EXTRA FEE CUSTOMER TO SUPPLY AS PREREQUISITE
Detect Protect Focus Fix
Contract Management • • • •
Remote Connectivity & Accessibility
On-site Monitoring Hardware
Visor Control Box (VCB) • • • •
RMDM ◊ ◊ ◊ •
Asset Analytics
Advisory Services • • • •
Performance Deviation Support ◊ • • •
Custom Analytics ◊ ◊ ◊ •
Operational Dashboards • • • •
Remote Support Hot-line
Within 4 Hours Commitment • • •
Custom Commitment ◊ ◊ ◊ •
FSE on Call AvailabilityWithin 2 days commitment ◊ ◊ •
Custom Commitment ◊ ◊ ◊ •
Resident Engineer ◊ ◊ ◊ ◊
Periodic Report on Machines Health & ◊ ◊ •
Maintenance
Planned • •
Unplanned ◊ ◊ •
On-Condition Based • • • •
Spare Parts Inventory Management • • •
Obsolescence Treatment ◊ ◊ • •
Cyber Security Assessments ◊ ◊ • •
Initial Spare Parts Package ◊ ◊ ◊ •
Performance Guarantee ◊ •

Figure 11. Distribution of failures with time
(Primarily random wear) 89%
Slow agingBest newConstant random failureWorst new
14%
68% 5%
7%
B. O&M OptimizationO&M expenditures are one of the main line items of industrial manufacturing companies. A steel mill will spend >$30 million on O&M per year. Some of the tasks will be done by internal personnel, but in general, plant maintenance is largely outsourced to third-party service companies. While they routinely perform the maintenance tasks during planned plant downtime, that approach simply cannot guarantee to prevent the plant from future unplanned outages, given that random failures will continue to occur, as can be seen in Figure 11 [7].
In order to future-proof the manufacturing processes, a more intelligent maintenance approach is needed to help companies maintain rotating machinery in a cost-effective manner as well as to achieve long-term cost targets.
Motor Fleet APM’s data-driven approach will enable a shift from calendar-based towards predictive maintenance – only carrying out the maintenance required when it’s truly needed to avoid equipment shutdown or premature failure.
C. Inventory Management OptimizationLarge process-driven industries, for example a paper mill, which as described above can have up to 4,000 motors, will carry millions of dollars in spares inventory. It is customary that LV motors, for example, are not maintained, and spares are kept on the shelf and then replaced once a failure occurs.
The effect of this is that, given the variety of motor technologies and types, a large amount of capital is tied up in inventory.
By monitoring a larger quantity of motors than before, and thanks to GE’s service organization, Motor Fleet APM can trigger alarms when a motor health issue occurs that, given the unique identifiers associated to each motor, will launch purchasing and dispatch of the specific motors within 24 hours.
D. Quality and Process ImprovementsProduct quality is of paramount significance, directly affecting a company’s reputation and its revenue.
If the process is not running the way it should be, it affects productivity as well as the quality, leading to material waste and a lower margin, as finished products that fail to meet the required quality standard will have to be scrapped, reworked or sold at a discounted price.
Detecting quality and process variation, however, is a much tougher challenge than detecting motor failures, as it entails the step up from asset health models to a process health model. Slight process deviations from its standard operational envelopes will not directly stop the process or lead to quality issues in the current batch, but will be an indication of downstream quality issues.
Therefore, the steps towards addressing and improving on quality issues pass through monitoring and mapping the process as a whole and creating the digital twin of the process. The digital twin is a detailed mathematical representation that, run in parallel to the real process, will compare the simulated output with the real output and will both estimate fatigue issues and raise flags on performance deviations.
The building of a digital twin for a customer’s process is a complex process of which GE has demonstrable experience; it needs to be addressed on a case-by-case basis and commissioned as a standalone project.
E. Energy EfficiencyProcess industries are hugely energy intensive, as evidenced by the fact that the chemical, paper and steel industries are three of the top four most energy-intensive industries in the U.S., with the steel industry by itself consuming 5.2 percent of the total energy consumed in the U.S. manufacturing sector [5].
When looking for profitability, energy is one of the top focus items, and direct line of actions addressing energy usage are being taken by some of the leading steel companies. Energy prices not only play a role because of the direct cost impact of energy consumption; in addition, energy price volatility acts as an additional risk factor for operational costs.
Energy efficiency measures will follow a parallel path to that of quality improvements, in that, to have a significant impact, it will not be addressed by motors only, but we need to have a holistic process view.
F. Business IntelligenceThe growing trend of mergers and acquisition activities as industries consolidate has caused a dilution of skills and experience in some areas. Lack of standard practices has further resulted in fragmented and uneven performance across plants. Different data acquisition mechanisms, alarms, triggers and fault descriptions also pose a challenge for global companies to obtain data insights across facilities, which, in turn, limits their ability to achieve cost and process improvement at a global level.
Using APM, all data can be analyzed, giving a complete view of the entire process - even when split across several plants. This central and holistic view could be applied not just to supply chains, but to plant performance across multiple sites.
A connected approach enables one single data repository to retain knowledge, process information and deliver accurate analytics. Operators can assess the real-time performance of any plant anywhere for global benchmarking and smarter decision-making, driven by data (rather than local experience alone). Best practices can therefore be identified, modelled and then scaled globally for consistent, efficient performance across a business, irrespective of location.

X. COMMERCIAL APPROACHThe commercial model around this project is going to be heavily dependent upon the final application, but generically, we can divide in two.
A. Process ApplicationsBy this we refer to applications such as metals, paper, gas separation or petrochemical, in which there is a large quantity of motors per site, some of which will be critical, some of which will not be critical, but which failures will still drive significant losses and maintenance costs.
In these types of applications, the managed services agreement will take the form of an outcome-based contract, incorporating customer KPIs against which performance will be measured and an associated LD/bonus regime.
Value Selling
ProposalBase Price= + _
Deployment + Licenses
Risk/Reward
Incentivised
Figure 12. Value Pricing Structure
The deployment of the contract will be done such that there will be an initial phase for benchmarking to ensure that the historical information and targets agreed with the customer are correct. The specific period of baselining will be dependent upon the actual application, frequency of failures, as enough failures need to occur before having a significant sample that we can consider the benchmark. This period will also be used to ensure that the diagnostics algorithms are working properly and to tune the thresholds to provide an acceptable level of false positives/false negatives. If historical data is available, then the benchmarking period can be substantially reduced.
After the benchmarking period, the service agreement will start and, once proven successful to the customer, we can start working on extending the scope to additional opportunities/assets for the same customer.
B. Critical ApplicationsBy this, we refer to applications such as LNGs, marine or power, in which the number of ERM is reduced. They tend to be of large size, and events occur rarely, but when they occur, they drive significant losses. The ERM is normally a critical part of the application.
In these applications, creating an outcome-based service agreement built on avoidance of downtime is challenging, as events will happen spaced in time, and the avoided loss of revenue from utilizing Motor Fleet APM is hard to quantify.
The commercial approach for these types of applications is a more traditional monitoring and diagnostics-based contract, with a yearly fee where we incorporate other services, such as field service availability or periodic reports.
XI. METHODOLOGY - LEAN START-UPFastWorks, GE’s own implementation of Lean Start-up techniques, was thoroughly applied during the development. This was an ideal candidate for a FastWorks development as:
1 – There was no initial prejudice as to what the product and service might look like. There was an enormous amount of ambiguity and ill-definition at the start of the development.
2 – It was clear to all team members that the business case and commercialization model were to be key to the success of the program.
3 – The development had been attempted at least four times before and failed each time, never due to technical failures.
A cross-functional team was set in place from the beginning of the development, including marketing, sales, engineering, program management and product management. A set of Leap of Faith Assumptions (LOFAs) was created which represented every point where the team believed the program could trip or fail. The LOFAs were categorized as important and urgent, as per the chart that follows.
Minimum Viable Products (MVPs), which were not physical products, but a set of experiments targeted at de-risking specific set of LOFAs, were devised.
The first LOFA was “We understand the customer problem,” to, precisely, challenge every pre-conceived assumption the team had around the customer problem. The MVP 1 was focused on ensuring that we had a good understanding of where the value was.
Figure 13. Roadmap of Activities
Y1 Y2
H1 H2 H1 H2
Baselining
Execution
Additional Assets
MVP 2 was targeted at technically de-risking the solution enough to ensure that, should we have an order, we could execute. The technical team was lean—two full-time engineers and one part-time technical leader, with support from the GRC—and the intent was never to develop anything that was not immediately focused on de-risking a LOFA. By the time the team obtained the first bookable LOC, barely $150,000 had been spent on the program.
The FastWorks development of the program was challenging, as the team had to mature in their understanding of FastWorks during the implementation. A pragmatic approach was undertaken, leveraging the spirit of FastWorks and Lean/Agile Principles.
Some rework and revalidation was required, as we had not fully bounded and scoped our hypotheses, measures and tests to know if we had (in)validated our LOFAs. However, the benefit of this was that it forced us to go deeper to discover the root assumptions, which gave the team key insights to what the customer really needs.
There was a single team meeting every week, rigidly limited to one hour. The team ran the call as a whole, self-organizing, with no leader, and during that meeting, we reviewed two key metrics:
1 – Say/Do ratio of the actions agreed the week before.
2 – Actions next week – and for every action the team would keep highlighted what LOFA it was attempted at de-risking.
It would be untruthful to say we never carried out any action that was not targeted at de-risking some LOFA, but those actions were debated.
A. Near TermThe development to date has been focused around detecting health of the motors and predicting failure modes. Transmission of data into the cloud and alarm detection and logging in APM has also been achieved. Moving forward, the team intends to deploy these algorithms in new GE Power HW Platforms—such as drives, AVRs, motor protection relays, motor control centers—reinforcing the point that the value is on the algorithms, reducing the cost of deployment, creating upgrade solutions into our installed base and therefore, enabling new service models.
Direct integration into motors and generators is also desirable, as it would allow the commercialization of “smart motors,” with self-diagnostic capabilities.
A new dedicated HW platform also needs to be created for cost optimization in those instances in which another HW platform is not readily available.
The integration of Motor Fleet APM into GE platforms needs to be deepened. Since we can target different industries, which will have different use cases and pain points, it would be interesting to create “segment-dedicated solutions” (digital metals, digital paper), that would bring together Motor Fleet APM with brilliant manufacturing and APM to carry out prognostics on other types of assets and create the digital twins of the processes required for energy optimization and quality improvements.
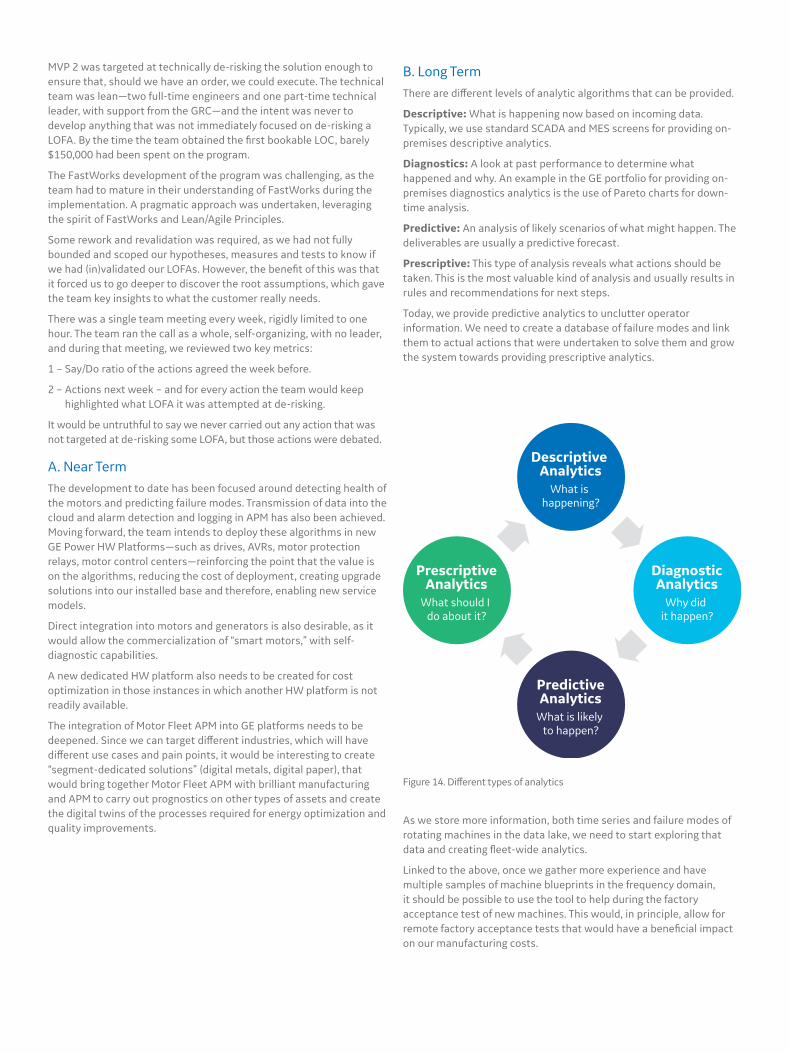
B. Long TermThere are different levels of analytic algorithms that can be provided.
Descriptive: What is happening now based on incoming data. Typically, we use standard SCADA and MES screens for providing on-premises descriptive analytics.
Diagnostics: A look at past performance to determine what happened and why. An example in the GE portfolio for providing on-premises diagnostics analytics is the use of Pareto charts for down-time analysis.
Predictive: An analysis of likely scenarios of what might happen. The deliverables are usually a predictive forecast.
Prescriptive: This type of analysis reveals what actions should be taken. This is the most valuable kind of analysis and usually results in rules and recommendations for next steps.
Today, we provide predictive analytics to unclutter operator information. We need to create a database of failure modes and link them to actual actions that were undertaken to solve them and grow the system towards providing prescriptive analytics.
Descriptive Analytics
What is happening?
PredictiveAnalytics
What is likely to happen?
PrescriptiveAnalytics
What should I do about it?
DiagnosticAnalytics
Why did it happen?
Figure 14. Different types of analytics
As we store more information, both time series and failure modes of rotating machines in the data lake, we need to start exploring that data and creating fleet-wide analytics.
Linked to the above, once we gather more experience and have multiple samples of machine blueprints in the frequency domain, it should be possible to use the tool to help during the factory acceptance test of new machines. This would, in principle, allow for remote factory acceptance tests that would have a beneficial impact on our manufacturing costs.

References[1] IHS, LV Motors and MV Motors Reports, 2016
[2] Ernst Worrell, Paul Blinde, Maarten Neelis, Eliane Blomen, and Eric Masanet, Energy Efficiency Improvement and Cost Saving Opportunities for the U.S. Iron and Steel Industry
[3] Prabhakar Neti, Karim Younsi, Pinjia Zhang, A novel online stator ground-wall insulation monitoring scheme for inverter fed AC-Motors.
[4] Stuart Gray, Houston Digital Services presentation https://ge.box.com/s/e6p4oc55d8etjdgvogszd27aaygsntml
[5] Sergio Dominguez, Motor Fleet APM Service Levels Description https://ge.box.com/s/e6p4oc55d8etjdgvogszd27aaygsntml
[6] F.S. Nowlan, H.F. Heap, Reliability-Centered Maintenance
[7] BMS Team, BMs Overview June 2017 v16.
AuthorsSergio Dominguez, Product Leader, GE Power
Luke Solomon, PhD, Technical Leader, GE Power
Simon Baggott, Marketing Leader, GE Power
Stuart Gray, Technical Services Leader, GE Power
Andrew Ireland, FastWorks Coach, GE Power

*Trademark of General Electric Company.
© 2018 General Electric Company. All rights reserved.
GE Power reserves the right to make changes in specifications and features shown herein, or discontinue the product described at any time without notice or obligation. Contact your GE Power representative for the most current information. GE and the GE Monogram are trademarks of General Electric Company.
GEA33604 03/2019
About GEGE is the world’s Digital Industrial Company, transforming industry with software-defined machines and solutions that are connected, responsive and predictive. GE is organized around a global exchange of knowledge, the ‘GE Store’, through which each business shares and accesses the same technology, markets, structure and intellect. Each invention further fuels innovation and application across our industrial sectors. Through its people, services, technology and scale, GE delivers better outcomes for customers by speaking the language of industry. To learn more, please visit www.ge.com.
About GE Power ConversionGE’s Power Conversion business, a business unit of GE Energy Connections, applies the science and systems of power conversion to help drive the electric transformation of the world’s energy infrastructure. It does so by designing and delivering advanced motor, drive and control technologies that evolve today’s industrial processes for a cleaner, more productive future. Serving specialized sectors such as energy, marine, renewables and industry, through customized solutions and advanced technologies, GE Power Conversion partners with customers to maximize efficiency.
gepowerconversion.com