Electrical resistivity of nickel, iron and iron-silicon ...
189
Western University Western University Scholarship@Western Scholarship@Western Electronic Thesis and Dissertation Repository 12-5-2018 11:00 AM Electrical resistivity of nickel, iron and iron-silicon alloy melts at Electrical resistivity of nickel, iron and iron-silicon alloy melts at high pressure with implications for the thermal conductivity of the high pressure with implications for the thermal conductivity of the Earth’s core Earth’s core Reynold E. Silber, The University of Western Ontario Supervisor: Dr. Rick Secco, The University of Western Ontario A thesis submitted in partial fulfillment of the requirements for the Doctor of Philosophy degree in Geophysics © Reynold E. Silber 2018 Follow this and additional works at: https://ir.lib.uwo.ca/etd Part of the Geophysics and Seismology Commons Recommended Citation Recommended Citation Silber, Reynold E., "Electrical resistivity of nickel, iron and iron-silicon alloy melts at high pressure with implications for the thermal conductivity of the Earth’s core" (2018). Electronic Thesis and Dissertation Repository. 5883. https://ir.lib.uwo.ca/etd/5883 This Dissertation/Thesis is brought to you for free and open access by Scholarship@Western. It has been accepted for inclusion in Electronic Thesis and Dissertation Repository by an authorized administrator of Scholarship@Western. For more information, please contact [email protected].
Transcript of Electrical resistivity of nickel, iron and iron-silicon ...

Western University Western University
Scholarship@Western Scholarship@Western
Electronic Thesis and Dissertation Repository
12-5-2018 11:00 AM
Electrical resistivity of nickel, iron and iron-silicon alloy melts at Electrical resistivity of nickel, iron and iron-silicon alloy melts at
high pressure with implications for the thermal conductivity of the high pressure with implications for the thermal conductivity of the
Earth’s core Earth’s core
Reynold E. Silber, The University of Western Ontario
Supervisor: Dr. Rick Secco, The University of Western Ontario
A thesis submitted in partial fulfillment of the requirements for the Doctor of Philosophy degree
in Geophysics
© Reynold E. Silber 2018
Follow this and additional works at: https://ir.lib.uwo.ca/etd
Part of the Geophysics and Seismology Commons
Recommended Citation Recommended Citation Silber, Reynold E., "Electrical resistivity of nickel, iron and iron-silicon alloy melts at high pressure with implications for the thermal conductivity of the Earth’s core" (2018). Electronic Thesis and Dissertation Repository. 5883. https://ir.lib.uwo.ca/etd/5883
This Dissertation/Thesis is brought to you for free and open access by Scholarship@Western. It has been accepted for inclusion in Electronic Thesis and Dissertation Repository by an authorized administrator of Scholarship@Western. For more information, please contact [email protected].

ii
Abstract
The Earth’s liquid outer core (OC) is composed of Fe alloyed with up to 10% Ni and a
small fraction of light elements. However, the effect of light elements such as Si on the
transport properties of liquid Fe-alloy in Earth’s OC is not clear. Thermal conductivity
(κ) and related electrical resistivity (ρ) are the least constrained parameters in OC.
Therefore, the characterization of transport properties of Ni, Fe and Fe-Si at high pressure
has important geophysical implications for the Earth’s core. The ρ of solid and liquid Ni,
Fe and Fe 4%Si was measured at pressure and temperature up to 12 GPa and 2100 K,
respectively. All experiments were conducted in a large volume multi-anvil press and the
measurements were carried out using the new adaptation of the 4-wire method. A
standard COnsortium on Materials Properties Research in Earth Sciences (COMPRES)
octahedron cell was used as the pressure medium, while the internal components were
redesigned to permit the preservation of the liquid sample geometry, to contain the melt
and minimize the effect of diffusive contamination. In the solid state, the ρ of solid Fe
and Ni exhibits the familiar pressure-dependent decrease after the Curie temperature (Tc).
The anomalous ρ of Fe-4.5wt%Si above Tc is strongly modulated by temperature and
pressure, and it is attributed to the phase transitions and structural ordering in the alloy.
The ρ of liquid Ni remains constant at the onset of melting at all pressures. While ρ of
liquid Fe decreases up to 5 GPa, it remains invariant along the melting boundary after the
δ-γ-liquid triple point. The ρ of liquid Fe-4.5wt%Si remains constant along the melting
boundary and matches 120 μΩcm for pure liquid Fe within the experimental
uncertainties. The results are interpreted in the context of pressure dependent icosahedral
short range ordering (ISRO) in liquid 3d metals and alloys. Based on this, it is postulated
that ρ of Fe-alloys along the melting boundary remains invariant up to Earth’s inner core
boundary. The κ at the core-mantle boundary and inner core boundary were calculated
using the Weidemann-Franz law.

iii
Keywords
electrical resistivity, liquid transition metal, high pressure, Earth’s core, nickel, iron,
silicon

iv
Co-Authorship Statement
The core of this dissertation is based on three manuscripts:
1. Chapter 2: Silber, R. E., Secco, R. A. and Yong, W. (2017) Electrical Resistivity
Measurements of Solid and Liquid Ni up to 9 GPa, JGR-Solid Earth, 122,
doi:10.1002/2017JB014259
2. Chapter 3: Silber, R. E., Secco, R. A., Yong, W. and Littleton, J. (2018)
Electrical resistivity of liquid Fe to 12 GPa: Implications for heat flow in cores of
terrestrial bodies, Nature Scientific Reports, 8, 10758, doi: 10.1038/s41598-018-
28921-w
3. Chapter 4: Silber, R. E., Secco, R. A., Yong, W. and Littleton, J. (2018) Heat
flow in terrestrial cores from invariant electrical resistivity of Fe-Si on the melting
boundary, manuscript prepared for submission to a peer-reviewed journal
In each of the studies above, I performed research that included design and fabrication of
experimental components, running high pressure experiments in a 3000 ton multi-anvil
large press, and carrying out post-experimental work (e.g., cell sectioning, microscope
analyses). I analyzed the results, and was solely responsible for the interpretation of the
results. I also wrote the manuscripts and subsequent revisions. Rick Secco provided
instrumentation, materials and lab facilities and provided feedback on the manuscripts.
Wenjun Yong (Chapters 2-4) and Joshua Littleton (Chapters 3-4) assisted with
experiments and provided feedback on the manuscripts.

v
Dedication
To my Family

vi
Acknowledgments
While they say that it is the journey and not the destination that matters, I would beg to
disagree. There is a great sense of accomplishment when one successfully reaches that
destination and opens up a new chapter. I want to express my deep gratitude to my thesis
advisor, Dr. Rick Secco, who had a vision and enough confidence in me to entrust me
with the project of this magnitude. I also want to thank Dr. Secco for his input and
suggestions that greatly improved my published work. I would like to thank my Advisory
Committee, Dr. Sean Shieh and Dr. Tony Withers, for their support. Furthermore, I
would like to express my great appreciation to my colleagues, and present and past
labmates, Dr. Wenjun Yong, Joshua Littleton, Dr. Tim Officer, and Dr. Innocent Ezenwa,
for making this journey fun. My thanks also goes to Jon Jacobs for his assistance in
experimental parts fabrication at the beginning of my journey. Also big thanks to Marc
Beauchamp and Stephen Wood, who have helped me in my sample analyses. I would like
to thank many academics, students and staff in the Department of Earth Sciences, whom I
have interacted with over the years. I apologize for not naming you all, but you know
who you are. Finally, I want to thank my wife and my children for their immense
patience, love, and support that have made my success possible. Last, but not least, I want
to thank (not) about 50 academics in the field of high pressure geophysics and related
fields, for their “good manners” and “timely” responses to my postdoc inquiries, as those
have steered me in the right direction after all. Sometimes trials and tribulations indeed
make you a stronger character and a stronger researcher.

vii
Table of Contents
Abstract ............................................................................................................................... ii
Co-Authorship Statement................................................................................................... iv
Dedication ........................................................................................................................... v
Acknowledgments.............................................................................................................. vi
List of Figures ..................................................................................................................... x
List of Appendices ............................................................................................................ xii
List of Symbols ................................................................................................................ xiii
Chapter 1 ............................................................................................................................. 1
1. Introduction ..................................................................................................................... 1
1.1. Background .............................................................................................................. 1
1.2. The Earth’s Core ...................................................................................................... 2
1.3. Thermal Conductivity and Electrical Resistivity of Liquid Transition Metals and
Alloys at High Pressure .................................................................................................. 4
1.3.1. General Background ......................................................................................... 4
1.3.2. The Relationship Between Thermal Conductivity and Electrical Resistivity... 5
1.3.3 Thermal Conductivity of Liquid Transition Metals ........................................... 6
1.3.4 Experimental Measurements of Electrical Resistivity and Thermal
Conductivity ................................................................................................................ 7
1.4 Aim of This Thesis.................................................................................................... 9
References ..................................................................................................................... 10
Chapter 2 ........................................................................................................................... 15
2. Constant Electrical Resistivity of Ni Along the Melting Boundary up to 9 GPa ......... 15
2.1. Introduction ............................................................................................................ 15
2.2. Methods.................................................................................................................. 19
2.3. Results .................................................................................................................... 23
2.4. Discussion .............................................................................................................. 34
2.4.1 Fermi Surface and the Hall Coefficient in Liquid Transition Metals .............. 35

viii
2.4.2 The Role of d-electrons in Liquid Structure and the Electron Mean Free Path 39
2.5. Conclusion ............................................................................................................. 43
References ..................................................................................................................... 44
Chapter 3 ........................................................................................................................... 55
3. Electrical resistivity of liquid Fe to 12 GPa: Implications for heat flow in cores of
terrestrial bodies ................................................................................................................ 55
3.1. Introduction ............................................................................................................ 55
3.2. Methods.................................................................................................................. 57
3.2.1. Instrumentation ............................................................................................... 57
3.2.2. Use of Tungsten (W) Disc .............................................................................. 58
3.2.3. Electron Microprobe Data ............................................................................... 59
3.2.4. Determination of Electrical Resistivity Along the Melting Boundary ........... 66
3.2.5. Uncertainties and Sectioned Samples Geometry ............................................ 67
3.3. Results .................................................................................................................... 69
3.4. Discussion and Conclusions .................................................................................. 71
3.4.1. Liquid Structure, Liquid Properties and Melting Boundary ........................... 71
3.4.2. Thermal Conductivity and Heat Flow in the Cores of Terrestrial Bodies ...... 76
References ..................................................................................................................... 80
Chapter 4 ........................................................................................................................... 86
4. Heat Flow in Terrestrial Cores from Invariant Electrical Resistivity of Fe-Si on the
Melting Boundary to 9 GPa .............................................................................................. 86
4.1. Introduction ............................................................................................................ 86
4.2. Additional Challenges and Uncertainties in Constraining the Transport Properties
of the Liquid Fe Alloys ................................................................................................. 89
4.2.1 The Composition of the Outer Core ................................................................. 89
4.2.2. Electrical Resistivity and Thermal Conductivity of Fe and its Alloys ........... 92
4.3. Methods.................................................................................................................. 96
4.3.1. Experiments .................................................................................................... 96
4.3.2 EMP Analyses .................................................................................................. 98

ix
4.4. Results .................................................................................................................... 98
4.4.1. Electrical Resistivity of Solid Fe-4.5Si Alloy ................................................. 98
4.4.2. Melting Points and Phase Diagram of Fe-4.5Si for Pressures 3-9 GPa ........ 103
4.4.3. The Electrical Resistivity of liquid Fe-Si Along the Melting Boundary ...... 106
4.4.4. EMP and Sectioned Samples ........................................................................ 109
4.5. Discussion ............................................................................................................ 112
4.5.1. The Effect of Si on Electrical Resistivity of Fe-4.5Si................................... 112
4.5.2. Electronic Structure of Liquid Transition Metals and Alloys ....................... 116
4.5.3. Short and Medium Range Ordering In Liquid Transition Metals and Alloys
................................................................................................................................. 118
4.5.4. Implications of ISROs for Electrical Resistivity........................................... 122
4.5.5. Thermal Conductivity of the Outer Core ...................................................... 125
4.5.6. General Implications for Core Evolution and Heat Flow ............................. 128
4.6. Summary and Conclusions .................................................................................. 131
References ................................................................................................................... 132
Chapter 5 ......................................................................................................................... 154
5. Conclusions and Outlook ............................................................................................ 154
References ................................................................................................................... 157
Appendix ......................................................................................................................... 158
Copyright Permissions .................................................................................................... 166
Curriculum Vitae ............................................................................................................ 171

x
List of Figures
Figure 2.1: Cross-section of the experimental pressure cell. ............................................ 20
Figure 2.2: The T-dependence of electrical resistivity of solid and liquid Ni .................. 24
Figure 2.3: The ratio of the electrical resistivity of molten Ni on the melting boundary at
pressures 3 – 9 GPa ........................................................................................................... 27
Figure 2.4: The temperature coefficient of electrical resistivity. ...................................... 28
Figure 2.5: The dependence of the Curie temperature on pressure compared with the
values from earlier studies. ............................................................................................... 31
Figure 2.6: Logarithmic electrical resistivity of solid Ni along isotherms a. ................... 32
Figure 2.7: A comparison of the melting temperatures of Ni ........................................... 32
Figure 2.8: Calculated electronic thermal conductivity, κe ............................................... 34
Figure 3.1: The high pressure experimental cell design ................................................... 57
Figure 3.2: A representative example of EMP-EDS. ........................................................ 61
Figure 3.3: Close-up of the region with surface diffusion of W into liquid Fe ................ 62
Figure 3.4: Representative EMP-EDS of a sample compressed to 7 GPa ........................ 63
Figure 3.5: EMP-WDS of the sample in Figure 3.4. ........................................................ 64
Figure 3.6: EMP-EDS of the sample compressed to 3 GPa. ............................................ 65
Figure 3.7: The EMP-WDS scan of individual points on the sample in Figure 3.6. ........ 66
Figure 3.8: Illustration showing how the ρ along the melting boundary of Fe. ................ 67
Figure 3.9: Representative examples of recovered and sectioned sample cells. .............. 68
Figure 3.10: Electrical resistivity of solid and liquid Fe at 3 – 12 GPa. ........................... 69
Figure 3.11: Electrical resistivity curves at 3, 6 and 9 GPa .............................................. 70
Figure 3.12: Electrical resistivity of Fe along the melting boundary. .............................. 74
Figure 3.13: Melting curve of Fe from 3 to 12 GPa. ........................................................ 75
Figure 3.14: Values of electrical resistivity of γ-Fe just before melting. ......................... 77
Figure 3.15: Comparison of values of adiabatic core heat flow at the CMB of Moon,
Ganymede, Mercury and Mars ......................................................................................... 78
Figure 4.1: Electrical resistivity of solid and liquid Fe-4.5Si from 3 to 9 GPa ................ 99
Figure 4.2: P and T dependent behaviour of ρ which changes at the onset of different
phases. ............................................................................................................................. 101

xi
Figure 4. 3: Simplified P-T phase diagram of Fe-4.5Si from 3 GPa to 9 GPa and up to
2100 K. ............................................................................................................................ 104
Figure 4. 4: The melting curve of Fe-4.5Si compared with that of pure Fe ................... 105
Figure 4.5: Electrical resistivity of Fe-4.5Si along the melting boundary (3-9 GPa)
compared with that of a pure Fe. .................................................................................... 106
Figure 4.6: Thermal conductivity of solid and liquid Fe-4.5Si at pressures 3-9 GPa. .... 107
Figure 4.7: The results of EMP analysis. ........................................................................ 110
Figure 4.8: The preserved geometry of the Fe-4.5Si samples. ....................................... 111

xii
List of Appendices
Appendix ......................................................................................................................... 158

xiii
List of Symbols
∣ 𝑒 ∣2 Electron mean free path
A Area
Ar Proportionality factor
CP Heat capacity at constant pressure
D Sample length
e Electron charge
g Gravitational acceleration
I Current
k Boltzmann’s constant
kF Fermi wave vector
ktotal Total experimentally measured thermal conductivity
L Lorenz number
Lo Sommerfeld value (2.44·10−8
W Ω K−2
)
m* electron effective mass
n Charge carrier number density
P Pressure
qcond Adiabatic heat flow
R Resistance
r Planetary core radius
RH Hall coefficient
SF Area of the Fermi surface
T Temperature
TC Curie temperature
Tm Melting temperature
V Voltage
vF Fermi velocity

xiv
γ Linear factor of temperature dependent electronic contribution
to the heat capacity
εd Energy of the d-band electrons
εF Fermi energy
κ Thermal conductivity
κe Thermal conductivity, electronic component
κp Phonon component of thermal conductivity
ρ Electrical resistivity
ρliquid Electrical resistivity in liquid
ρsolid Electrical resistivity in solid
σe Electrical conductivity
τ Conduction electron relaxation time
ϕ Seismic parameter
ћ Planck constant
Thermal expansion

1
Chapter 1
1. Introduction
Shall I refuse my dinner because I do not fully understand the process of digestion?
- Oliver Heaviside
1.1. Background
High-pressure laboratory experiments aim to constrain the physical, chemical and
structural properties of matter under extreme compression. However, despite continuous
technological advances, high-pressure research faces a wide range of challenges. Some of
those challenges stem from understanding the responses and the behavior of compressed
matter on a quantum level to incorporating and interpreting that knowledge in order to
understand the behavior of macrosystems under extreme pressures (P) and temperatures
(T) in planetary interiors. Indeed, the parameters, such as physical, chemical and
structural properties, strongly influence the behavior of transport properties. Recently,
there has been a reinvigorated interest in thermal conductivity and related electrical
resistivity of the iron (Fe) alloys in the Earth’s core. These parameters are some of the
least constrained quantities in mineral physics. For instance, the importance of thermal
conductivity lies in the fact that it controls the spatio-temporal and thermal evolution
along with dynamics of the core. It plays a role in the present-day heat flow out of the
Earth’s core and the type of convection of the liquid alloy that generates the geomagnetic
field. Thermal conductivity also imposes a critical constraint on the age of the inner core
and overall thermal and spatio-temporal evolution of the Earth’s deep interior (Williams,
2018). Better understanding of thermal conductivity of the liquid outer core for example,
enables more comprehensive knowledge on the core cooling process and the rate which
in turn powers mantle convection, and subsequently plate tectonics. The rest of this
chapter reviews the key aspects related to this work, starting with the properties of the
Earth’s interior.

2
1.2. The Earth’s Core
Conceptually, the Earth’s core may be considered analogous to a giant furnace that
provides heat to the rest of the planet and plays an instrumental role in supporting the
existence of life. The radius of the liquid outer core is 3.485∙106 m (e.g., Gubbins et al.,
2015), while the radius of the comparatively smaller inner core is 1.221∙106 m. The total
mass of the core is 1.94∙1024
kg, while the mass of the outer core is 1.84∙1024
kg (e.g.,
Davies, 2015). The volume occupied by the core is about 16.3% of the Earth’s total
volume. Furthermore, seismological observations show that out of that percentage, 15.6%
belongs to the outer core and only 0.7% to the inner core (e.g., Zhang et al., 2016).
Due to experimental challenges, many of the core parameters remain poorly resolved. For
example, the temperature at the core side of the core-mantle boundary (CMB) is not
satisfactorily constrained. The estimates range from 3500 K to about 4500 K (e.g., Lay et
al., 2008), although recent work helps narrow that temperature range from 4000-4500 K
(Anzellini et al., 2013). The temperatures at the inner core boundary (ICB) are estimated
to be 5500-6000 K (Anzellini et al., 2013).
It is well-established that in addition to ~5-10% of Ni (Poirier, 1994), the core contains a
small amount of light elements that is necessary to account for the density in the liquid
outer core and solid inner core that is about 8% and 4% less than in the density of pure
Fe, respectively. Cosmochemical, geophysical and seismological constraints suggest that
the light elements meeting that criterion are Si, S, C, O, H, and Mg (McDonough and
Sun, 1995; Zhang et al., 2016; Litasov and Shatskiy, 2016; O'Rourke et al., 2017).
However, the exact compositional makeup and ratio of those elements in the outer core
are still strongly debated (e.g., Tateno et al., 2018). The presence of light elements is also
considered to lower the melting temperature of Fe at the core conditions (Zhang et al.,
2018).
Paleomagnetic evidence shows that the Earth’s magnetic field has been in existence for
4.2 Gyr (Tarduno et al., 2015). It is generated by the convective motion of the liquid alloy
in the outer core. The convective motion of the liquid alloy induces the current and it is

3
essentially a mechanism that converts the kinetic energy of the flow into generation of the
magnetic field. The helical motion of the liquid metal alloy in the outer core is roughly
co-axial with the Earth’s rotational axis and forms tangent cylinders (Taylor columns) to
the “stationary” inner core. However, during the cooling of the core, thermal conductivity
regulates if the amount of heat conducted through the OC toward the CMB is adiabatic,
super-adiabatic or sub-adiabatic through the outer core. The conductive regime dictates
whether the convection is thermally or compositionally driven (e.g., Davies et al., 2015;
Gubbins et al., 2015; Labrosse, 2015). If the conductive heat flow is sub-adiabatic, the
core is thermally unstable, and the thermal convection is a dominant contribution to the
overall convective process. This assumption was valid for low estimates of thermal
conductivity (e.g., Stacey and Anderson, 2001; Stacey and Loper, 2007). However,
recently revised values of high thermal conductivity strongly suggest that the main
mechanism driving core convection comes from the compositional buoyancy flow.
Freezing and growth of the inner core removes Fe from the molten alloy and frees up
light elements that move upward from the ICB toward the CMB.
The situation is further complicated in terms of the energy budget of the core. High
values of thermal conductivity require that the core cools at a fast rate, which leaves only
limited energy budget for the geodynamo (Davies, 2015; Davies et al., 2015; Labrosse,
2015; Gubbins et al., 2015). The high thermal conductivity regime also suggests that the
core temperature was much higher in the geological past, which is difficult to reconcile
from a theoretical perspective. Moreover, high thermal conductivity suggests that the
formation of the inner core took place relatively recently (~500 Myr) (Nimmo, 2015). A
young inner core presents a significant complication, as its growth is closely tied to the
compositional convection processes generating the geodynamo and the uninterrupted
existence of the magnetic field throughout most of Earth’s geologic time. Thus,
accounting for the existence of the magnetic field in the past 4.2 Gyr is theoretically
challenging in the presence of recent high values of thermal conductivity.
Mantle convection plays an important role in cooling of the outer core, and the lower
mantle is important in the convection of the outer core liquid alloy as it modulates the
amount of heat conducted across the CMB (Olson et al., 2015; Olson, 2016). However,

4
the heat flow across the CMB is not uniform (French and Romanowicz, 2015) and
depends on the presence and distribution of heterogeneous regions such as D”, which
have different composition and higher thermal conductivity than the rest of the CMB
(Ammann et al., 2014). The recently discovered post-perovskite phase in the lower
mantle (thought to be stable in D”) has significantly higher thermal conductivity than
perovskite (Hirose et al., 2015). The presence of thermal heterogeneities in the lower-
most mantle can disrupt potential stratification at the top most core (Davies et al., 2015).
This agrees well with seismic measurements (e.g., Lay et al., 2008) indicating a well-
mixed outer core. An additional uncertainty in the heat flow across the CMB comes from
the Fe substitution in ferropericlase and the subsequent high to low spin crossover, which
is capable of a drastic reduction in the value of thermal conductivity (Ohta et al., 2017).
Recent models of mantle convection suggest that the mantle is capable of absorbing
thermal energy from the core in the range 10-13 TW (Olson et al., 2015; Olson, 2016).
1.3. Thermal Conductivity and Electrical Resistivity of Liquid
Transition Metals and Alloys at High Pressure
1.3.1. General Background
To understand the behavior of liquid metals and alloys at extreme pressures and
temperature conditions corresponding to the Earth’s core, both experimental and
theoretical efforts are necessary. Even though high-pressure science has experienced a
significant development in the past several decades, direct experiments on liquid metals
and alloys at the core conditions are still out of reach. Nevertheless, diamond anvil cell
(DAC) experiments on solid matter can frequently reach the outer core pressure (e.g.,
Gomi et al., 2013; Ohta et al., 2016; Gomi and Hirose, 2015; Anzellini et al., 2013;
Morard et al., 2018). Appreciable progress has also been made in theoretical and
numerical approaches which can even simulate the conditions in the interior of “Super”
Earths (e.g., Smith et al., 2018). However, the dynamics and structure of liquid transition
metals under extreme pressures and temperatures are not entirely resolved. While
5
theoretical evaluation of transport properties of solids is more successfully achieved due
to the advantages given by the translational symmetry and lattice periodicity over the
long-range order, liquids are much more difficult to model. For example, the absence of
long range order makes the job of simulating the electron scattering processes very
challenging. However, there has been a significant development in recent years resulting
from appreciably higher computational capacity and more sophisticated theoretical
treatments of transport properties of liquids under high pressure. That is reflected in
recent studies of electrical resistivity and thermal conductivity of Earth’s outer core (e.g.,
de Koker et al., 2012; Pozzo et al., 2012).
From the fundamental perspective, pressure and temperature antagonistically compete for
the control over transport properties of liquid transition metals and alloys. Pressure
reduces the amplitude of ionic vibrations (reasonably analogous to the lattice vibrations
in solids) and increases the parameters in inverse space, such as the size of the Brillouin
zone (e.g., Templeton, 1966). Energy of atomic bonds is also modified by compression,
because atoms come closer together. Conversely, temperature increases the amplitude of
ionic vibrations in the liquid and increases the kinetic energy of the fluid components.
The problem of fully characterizing transport properties in liquid metals under high
pressure is not yet resolved completely. The structural and dynamical aspects of 3d-liquid
transition metals and their alloys diverge from simple metals (e.g., Lee and Lee, 2016),
especially under pressure. Some of those peculiarities in liquid transition metals, related
to the existence of unfilled 3d bands, include the presence of the icosahedral short-range
order (ISRO) structures. Because of their unique nature, the existence of these structures
has been experimentally confirmed only in recent years (Schenk et al., 2002) and need to
be included in evaluating the thermal conductivity and empirically related electrical
resistivity of the Earth’s core alloys.
1.3.2. The Relationship Between Thermal Conductivity and Electrical Resistivity
Thermal conductivity (κ) is inversely related to electrical resistivity (ρ) through the
Wiedemann-Franz law:

6
𝜅 = 𝐿𝑇/𝜌 (1.1)
where L is the Lorenz number (corresponding to the theoretical Sommerfeld value, Lo =
2.44·10−8
W Ω K−2
) and T is temperature. This relation is generally applicable to metals
and alloys where transport of both charge and heat is achieved primarily by electrons.
Electrical resistivity is determined from Ohm’s law: 𝜌 =𝑉
𝐼(𝐴
𝐷), if the voltage (V) drop
measured across a sample with a current (I) are experimentally known. The parameters in
parenthesis represent the area A, perpendicular to long axis of the cylindrical sample with
length D. This simple expression carries within it the elements of quantum mechanics,
such as relaxation time between electron collisions and it holds for any conductive
material, provided that the mean free path is well constrained.
The Earth’s core cannot be sampled directly, and consequently almost everything that is
known about its properties comes from indirect measurements such as seismic velocity
measurement profiles, chosmochemical constraints and mineral physics. Iron meteorites
might serve as reasonable proxies for core composition (McDonough and Sun, 1995). In
the same context, the direct measurement of thermal conductivity of compressed solid
and liquid metals at core conditions is very challenging (Konôpková et al., 2016).
However, the measurements of electrical resistivity are significantly easier from the
experimental perspective, but challenging nevertheless (Ohta et al., 2016).
1.3.3 Thermal Conductivity of Liquid Transition Metals
Thermal conductivity of liquid transition metals is substantially different from thermal
conductivity in a crystalline state. In solid metals, for example, the lattice vibrations (or
phonons) contribute substantially to thermal conductivity. However, in liquid metals, the
contribution of (analogous) ionic vibration is negligible and heat transport is carried by
electrons as noted earlier. This is advantageous as it allows the application of
Wiedemann-Franz law to estimate the thermal conductivity at conditions where it cannot
be directly measured. However, to do that, a reliable experimental value of electrical
resistivity of liquid metal should be available. Nevertheless, that is not the only problem
in determining thermal conductivity of liquid metals and alloys. The scattering of

7
electrons is relatively well understood in metals in the solid state (Abrikosov, 2017). The
scattering contribution in ordered solids with long range order may be from impurities,
electron-electron scattering, scattering by lattice vibrations and in ferromagnetic
transition metals, scattering by magnons (Abrikosov, 2017). The scattering in liquid
transition metals is greatly more complicated because of a highly disordered
environment. While the scattering of electrons in molten metals and alloys may take
place by ionic vibrations and electron-electron scattering, there are still mechanisms of
electron scattering that are not well understood (Mott, 1972). Some of those scattering
mechanisms can be attributed to the unfilled 3d electron band and inherently related local
structures in the melts. Another scattering mechanism which may affect transport
properties in molten metals and alloys is the presence of ISRO structures in liquid
transition metals and alloys (Li et al., 2017). These structures have potential to affect the
resistivity because they are act as scattering centers.
Finally, at high pressures and temperatures in the outer core, the electron scattering might
be inelastic where charge is preserved but not energy. Consequently, the value of the
Lorenz number in the Wiedemann-Franz law would be affected and the value of thermal
conductivity calculated from measured electrical resistivity would generally have a high
degree of uncertainty (Williams, 2018). While this has been discussed extensively by
Pourovskii et al. (2017) and Xu et al. (2018), the extent of inelastic scattering under core
conditions still remains unresolved. Additionally, the presence of light elements is
considered to increase the electrical resistivity (and subsequently decrease thermal
conductivity), but their overall contribution to the liquid alloy behavior at high pressures
is not clearly resolved.
1.3.4 Experimental Measurements of Electrical Resistivity and Thermal
Conductivity
Early efforts in measuring electrical resistivity and evaluating thermal conductivity of Fe
and Fe-alloys under very high pressures were limited to shock wave experiments (Keeler
and Mitchell, 1969; Matassov, 1977; Bi et al., 2002). However, the values of thermal
conductivity obtained from these shock wave measurements diverge significantly and it

8
is difficult to determine which value can be taken with a high degree of confidence. A
recent trend in experimental measurements, initiated by Seagle et al. (2013) and Gomi et
al. (2013), involves a DAC measurement of electrical resistivity on decompression. The
resistivity values obtained at room temperature are then used in Bloch-Gruneisen
equation to account for the effects of temperature on electrical resistivity. The subsequent
values of resistivity at high temperatures were then used in the Wiedemann-Franz law to
obtain thermal conductivity. While the effect of light elements on electrical resistivity at
room temperature and pressure is significant, and justify the use of Matthiessen’s rule
(e.g., Gomi et al., 2013; Seagle et al., 2013; Gomi and Hirose, 2015; Gomi et al., 2016;
Suehiro et al., 2017; Zhang et al., 2018), there are considerable doubts regarding its
validity at high pressure and temperature (e.g., Gomi et al., 2016). The validity of the
Bloch-Grüneisen formula in the liquid state, or even in the solid state at very high
temperatures, is not clear especially in the case of the observed resistivity change at phase
transitions, which may be associated with either increased or reduced structural ordering
(e.g., Baum et al., 1967) and in the context of resistivity saturation. In principle, while the
obtained values of both electrical resistivity and thermal conductivity in all these studies
vary, the differences are usually within experimental uncertainties. Most of these studies
report very low resistivity for pure Fe (generally below 90 μΩcm) and marginally
increased resistivity for Fe-alloys. The low values of electrical resistivity in turn produce
a high value of thermal conductivity in the outer core. However, in a recent study,
thermal conductivity of pure Fe was measured at conditions close to the outer core
(Konôpková et al., 2016). The results contradict the studies mentioned above and indicate
that Fe at the core conditions may have very low thermal conductivity (33 ± 7 W/mK), in
line with earlier semi-theoretical estimates (e.g., Stacey and Anderson, 2001; Stacey and
Loper, 2007). This indeed shows the need for a direct measurement of electrical
resistivity of liquid Fe and its alloys at high pressure, as a sensible way to better constrain
the value of electrical resistivity (and by extension, calculated thermal conductivity) in
the liquid outer core. However, there are only very few examples of such studies (Secco
and Schloessin, 1989; Ohta et al., 2016), with significantly diverging results. Of course,
obtaining thermal conductivity from the measured electrical resistivity is predicated on
the fact that the Wiedemann-Franz law holds to the core conditions.

9
1.4 Aim of This Thesis
The main aim of this work was to measure experimentally the high pressure electrical
resistivity and evaluate thermal conductivity of solid and liquid transition metals Fe and
Ni as the two main constituents of the Earth’s outer core. The emphasis was placed on
measuring electrical resistivity along the melting boundary (as a potential anchoring point
analogous to the inner core boundary). This is in part motivated by the theoretical
reasoning reported by Stacey and Anderson (2001) who suggested invariant electrical
resistivity of simple metals along melting boundary. In addition, the goal was to resolve
the behavior of the binary Fe-4.5wt%Si alloy, considering that Si is believed to be the
dominant light element in the outer core (e.g., Litasov and Shatskiy, 2016). Better
understanding of thermal conductivity of the liquid outer core, for example, enables more
comprehensive knowledge of the core cooling process and the rate which in turn powers
the mantle convection, and subsequently plate tectonics.
The electrical resistivity of solid and liquid Ni was investigated first (Chapter 2), as Ni is
an electronic analogue of Fe. The potential scattering mechanisms contributing to
electrical resistivity of liquid transition metals at high pressure along the melting
boundary were examined. Subsequently, the electrical resistivity of solid and liquid Fe at
pressures up to 12 GPa was measured and values were used to calculate temperature
dependent thermal conductivity values (Chapter 3). The implications were examined with
respect to small planetary bodies and moons in the solar system.
Finally, measurements of electrical resistivity on solid and liquid Fe-4.5wt%Si were done
at pressures 3-9 GPa (Chapter 4). The behavior of electrical resistivity along the melting
boundary was compared with the behavior of Ni and Fe. Based on the results obtained in
this work, a new mechanism is proposed which governs the electrical resistivity of liquid
Fe and its alloys to the inner core conditions. The reasoning based on these results and
recent developments in understanding the structural and dynamical properties of liquid
transition metals along the melting boundary will be extensively discussed in later
chapters in this thesis. It should be noted that the mechanism contributing to the electrical
resistivity of transition metals, and in particular Fe and its alloys, along the melting

10
boundary, has never been examined previously. To the best of my knowledge, this work
is indeed the first ever to consider the effects of local short-range ordering on electrical
resistivity of liquid transition metal and alloy at high pressure.
The conclusions and the recommendations for future work are presented in Chapter 5.
This thesis also includes Appendix, with additional figures illustrating the methods and
the consistency of parts fabrication.
References
Abrikosov, A. A. (2017), Fundamentals of the Theory of Metals, Courier Dover
Publications, Mineola, NY, USA.
Ammann, M. W., A. M. Walker, S. Stackhouse, J. Wookey, A. M. Forte, J. P. Brodholt,
and D. P. Dobson (2014), Variation of thermal conductivity and heat flux at the
Earth's core mantle boundary, Earth and Planetary Science Letters, 390, 175-185,
doi:10.1016/j.epsl.2014.01.009.
Anzellini, S., A. Dewaele, M. Mezouar, P. Loubeyre, and G. Morard (2013), Melting of
Iron at Earth’s Inner Core Boundary Based on Fast X-ray Diffraction, Science,
340(6131), 464.
Baum, B., P. Gel'd, and G. Tyagunov (1967), Resistivity of ferrosilicon alloys in the
temperature range 800–1700 C, The Physics of Metals and Metallography, 24,
181.
Bi, Y., H. Tan, and F. Jing (2002), Electrical conductivity of iron under shock
compression up to 200 GPa, Journal of Physics: Condensed Matter, 14(44),
10849, doi:10.1088/0953-8984/14/44/389.
Davies, C., M. Pozzo, D. Gubbins, and D. Alfè (2015), Constraints from material
properties on the dynamics and evolution of Earth’s core, Nature Geoscience, 8,
678, doi:10.1038/ngeo2492
Davies, C. J. (2015), Cooling history of Earth’s core with high thermal conductivity,
Physics of the Earth and Planetary Interiors, 247, 65-79,
doi:10.1016/j.pepi.2015.03.007.
de Koker, N., G. Steinle-Neumann, and V. Vlček (2012), Electrical resistivity and
thermal conductivity of liquid Fe alloys at high P and T, and heat flux in Earth’s
core, Proceedings of the National Academy of Sciences, 109(11), 4070-4073,
doi:10.1073/pnas.1111841109.

11
Deng, L., C. Seagle, Y. Fei, and A. Shahar (2013), High pressure and temperature
electrical resistivity of iron and implications for planetary cores, Geophysical
Research Letters, 40(1), 33-37, doi:10.1029/2012GL054347.
French, S. W., and B. Romanowicz (2015), Broad plumes rooted at the base of the
Earth's mantle beneath major hotspots, Nature, 525, 95,
doi:10.1038/nature14876
Gomi, H., and K. Hirose (2015), Electrical resistivity and thermal conductivity of hcp
Fe–Ni alloys under high pressure: Implications for thermal convection in the
Earth’s core, Physics of the Earth and Planetary Interiors, 247, 2-10,
doi:10.1016/j.pepi.2015.04.003.
Gomi, H., K. Hirose, H. Akai, and Y. Fei (2016), Electrical resistivity of substitutionally
disordered hcp Fe–Si and Fe–Ni alloys: Chemically-induced resistivity saturation
in the Earth's core, Earth and Planetary Science Letters, 451, 51-61,
doi:10.1016/j.epsl.2016.07.011.
Gomi, H., K. Ohta, K. Hirose, S. Labrosse, R. Caracas, M. J. Verstraete, and J. W.
Hernlund (2013), The high conductivity of iron and thermal evolution of the
Earth’s core, Physics of the Earth and Planetary Interiors, 224, 88-103,
doi:10.1016/j.pepi.2013.07.010.
Gubbins, D., D. Alfè, C. Davies, and M. Pozzo (2015), On core convection and the
geodynamo: Effects of high electrical and thermal conductivity, Physics of the
Earth and Planetary Interiors, 247, 56-64, doi:10.1016/j.pepi.2015.04.002.
Hirose, K., R. Wentzcovitch, D. Yuen, and T. Lay (2015), 2.05—Mineralogy of the deep
mantle—The post‐perovskite phase and its geophysical significance, in Treatise
on Geophysics, edited by G. Schubert, pp. 85-115, Elsevier, Oxford.
Keeler, R. N., and A. C. Mitchell (1969), Electrical conductivity, demagnetization, and
the high-pressure phase transition in shock-compressed iron, Solid State
Communications, 7(2), 271-274, doi:10.1016/0038-1098(69)90397-4.
Konôpková, Z., R. S. McWilliams, N. Gómez-Pérez, and A. F. Goncharov (2016), Direct
measurement of thermal conductivity in solid iron at planetary core conditions,
Nature, 534(7605), 99-101, doi:10.1038/nature18009.
Labrosse, S. (2015), Thermal evolution of the core with a high thermal conductivity,
Physics of the Earth and Planetary Interiors, 247, 36-55,
doi:10.1016/j.pepi.2015.02.002.
Lay, T., J. Hernlund, and B. A. Buffett (2008), Core–mantle boundary heat flow, Nature
Geoscience, 1, 25, doi:10.1038/ngeo.2007.44.

12
Lee, B., and G. W. Lee (2016), A liquid-liquid transition can exist in monatomic
transition metals with a positive melting slope, Scientific Reports, 6, 35564,
doi:10.1038/srep35564.
Li, M., H. Peng, Y. Hu, F. Li, H. Zhang, and W. Wang (2017), Five-fold local symmetry
in metallic liquids and glasses, Chinese Physics B, 26(1), 016104,
doi:10.1088/1674-1056/26/1/016104.
Litasov, K. D., and A. F. Shatskiy (2016), Composition of the Earth’s core: A review,
Russian Geology and Geophysics, 57(1), 22-46, doi:10.1016/j.rgg.2016.01.003.
Matassov, G. (1977), The electrical conductivity or iron alloys at high pressure and the
Earth’s core, PhD thesis, Lawrence Livermore Natl. Lab., Univ. of Calif.,
Livermore.
McDonough, W. F., and S. S. Sun (1995), The composition of the Earth, Chemical
Geology, 120(3), 223-253, doi:10.1016/0009-2541(94)00140-4.
Morard, G., S. Boccato, A. D. Rosa, S. Anzellini, F. Miozzi, L. Henry, G. Garbarino, M.
Mezouar, M. Harmand, and F. Guyot (2018), Solving controversies on the iron
phase diagram under high pressure, Geophysical Research Letters,
doi:10.1029/2018GL079950.
Mott, N. F. (1972), The electrical resistivity of liquid transition metals, Philosophical
Magazine, 26(6), 1249-1261, doi:10.1080/14786437208220339.
Nimmo, F. (2015), Thermal and compositional evolution of the core, in Core Dynamics,
Treatise on Geophysics, edited by G. Schubert, pp. 201-219, Elsevier, UK.
O'Rourke, J. G., J. Korenaga, and D. J. Stevenson (2017), Thermal evolution of Earth
with magnesium precipitation in the core, Earth and Planetary Science Letters,
458, 263-272, doi:10.1016/j.epsl.2016.10.057.
Ohta, K., Y. Kuwayama, K. Hirose, K. Shimizu, and Y. Ohishi (2016), Experimental
determination of the electrical resistivity of iron at Earth’s core conditions,
Nature, 534(7605), 95-98, doi:10.1038/nature17957.
Ohta, K., T. Yagi, K. Hirose, and Y. Ohishi (2017), Thermal conductivity of
ferropericlase in the Earth's lower mantle, Earth and Planetary Science Letters,
465, 29-37, doi:10.1016/j.epsl.2017.02.030.
Olson, P. (2016), Mantle control of the geodynamo: Consequences of top-down
regulation, Geochemistry, Geophysics, Geosystems, 17(5), 1935-1956,
doi:10.1002/2016GC006334.
Olson, P., R. Deguen, M. L. Rudolph, and S. Zhong (2015), Core evolution driven by
mantle global circulation, Physics of the Earth and Planetary Interiors, 243, 44-
55, doi:10.1016/j.pepi.2015.03.002.

13
Poirier, J.-P. (1994), Light elements in the Earth's outer core: A critical review, Physics of
the Earth and Planetary Interiors, 85(3), 319-337, doi:10.1016/0031-
9201(94)90120-1.
Pourovskii, L. V., J. Mravlje, A. Georges, S. I. Simak, and I. A. Abrikosov (2017),
Electron–electron scattering and thermal conductivity of ϵ -iron at Earth’s core
conditions, New Journal of Physics, 19(7), 073022, doi:10.1088/1367-
2630/aa76c9.
Pozzo, M., C. Davies, D. Gubbins, and D. Alfe (2012), Thermal and electrical
conductivity of iron at Earth/'s core conditions, Nature, 485(7398), 355-358,
doi:10.1038/nature11031.
Schenk, T., D. Holland-Moritz, V. Simonet, R. Bellissent, and D. M. Herlach (2002),
Icosahedral Short-Range Order in Deeply Undercooled Metallic Melts, Physical
Review Letters, 89(7), 075507, doi:10.1103/PhysRevLett.89.075507.
Seagle, C. T., E. Cottrell, Y. Fei, D. R. Hummer, and V. B. Prakapenka (2013), Electrical
and thermal transport properties of iron and iron‐silicon alloy at high pressure,
Geophysical Research Letters, 40(20), 5377-5381, doi:10.1002/2013GL057930.
Secco, R. A., and H. H. Schloessin (1989), The electrical resistivity of solid and liquid Fe
at pressures up to 7 GPa, Journal of Geophysical Research: Solid Earth, 94(B5),
5887-5894, doi:10.1029/JB094iB05p05887.
Smith, R. F., et al. (2018), Equation of state of iron under core conditions of large rocky
exoplanets, Nature Astronomy, 2(6), 452-458, doi:10.1038/s41550-018-0437-9.
Stacey, F. D., and O. L. Anderson (2001), Electrical and thermal conductivities of Fe–
Ni–Si alloy under core conditions, Physics of the Earth and Planetary Interiors,
124(3–4), 153-162, doi:10.1016/S0031-9201(01)00186-8.
Stacey, F. D., and D. E. Loper (2007), A revised estimate of the conductivity of iron alloy
at high pressure and implications for the core energy balance, Physics of the Earth
and Planetary Interiors, 161(1–2), 13-18, doi:10.1016/j.pepi.2006.12.001.
Suehiro, S., K. Ohta, K. Hirose, G. Morard, and Y. Ohishi (2017), The influence of sulfur
on the electrical resistivity of hcp iron: Implications for the core conductivity of
Mars and Earth, Geophysical Research Letters, 44(16), 8254-8259,
doi:10.1002/2017GL074021.
Tarduno, J. A., R. D. Cottrell, W. J. Davis, F. Nimmo, and R. K. Bono (2015), A Hadean
to Paleoarchean geodynamo recorded by single zircon crystals, Science,
349(6247), 521-524, doi:10.1126/science.aaa9114.

14
Tateno, S., K. Hirose, R. Sinmyo, G. Morard, N. Hirao, and Y. Ohishi (2018), Melting
experiments on Fe–Si–S alloys to core pressures: Silicon in the core?, American
Mineralogist, 103(5), 742-748, doi:10.2138/am-2018-6299.
Templeton, I. (1966), The effect of hydrostatic pressure on the Fermi surfaces of copper,
silver and gold, Proc. R. Soc. Lond. A, 292(1430), 413-423,
doi:10.1098/rspa.1966.0143.
Williams, Q. (2018), The Thermal Conductivity of Earth's Core: A Key Geophysical
Parameter's Constraints and Uncertainties, Annual Review of Earth and Planetary
Sciences, 46(1), 47-66, doi:10.1146/annurev-earth-082517-010154.
Xu, J., P. Zhang, K. Haule, J. Minar, S. Wimmer, H. Ebert, and R. Cohen (2018),
Thermal Conductivity and Electrical Resistivity of Solid Iron at Earth’s Core
Conditions from First Principles, Physical review letters, 121(9), 096601,
doi:10.1103/PhysRevLett.121.096601.
Zhang, Y., T. Sekine, H. He, Y. Yu, F. Liu, and M. Zhang (2016), Experimental
constraints on light elements in the Earth’s outer core, Scientific Reports, 6,
22473, doi:10.1038/srep22473.
Zhang, Y., T. Sekine, J. F. Lin, H. He, F. Liu, M. Zhang, T. Sato, W. Zhu, and Y. Yu
(2018), Shock Compression and Melting of an Fe‐Ni‐Si Alloy: Implications for
the Temperature Profile of the Earth's Core and the Heat Flux Across the Core‐Mantle Boundary, Journal of Geophysical Research: Solid Earth, 123(2), 1314-
1327, doi:10.1002/2017JB014723.

15
Chapter 2
2. Constant Electrical Resistivity of Ni Along the Melting
Boundary up to 9 GPa
The scientists of today think deeply instead of clearly. One must be sane to think clearly,
but one can think deeply and be quite insane.
- Nikola Tesla
A version of this chapter has been published as:
Silber, R. E., Secco, R. A. and Yong, W. (2017) Electrical Resistivity Measurements of
Solid and Liquid Ni up to 9 GPa, JGR-Solid Earth, 122, doi:10.1002/2017JB014259
2.1. Introduction
Recent advancements in both theoretical and experimental techniques at core-relevant
pressure (P) and temperature (T) conditions have resulted in revised estimates of core
electrical resistivity (Pozzo et al., 2012, 2013; de Koker et al., 2012; Gomi et al., 2013;
2016; Gubbins et al., 2015; Ohta et al., 2016) which are lower than that previously
accepted (Stacey and Anderson, 2001; Stacey and Loper, 2007). These lower values of
electrical resistivity require higher than expected values of thermal conductivity, in
excess of 90 Wm-1
K-1
as calculated by Pozzo et al. (2012), deKoker et al. (2012) and
Gomi et al (2013).
Conversely, the results from the most recent experimental work on solid iron
(Konôpková et al., 2016) indicate that the thermal conductivity of iron at the core-mantle
boundary (CMB) and the inner core boundary (ICB) is 33 Wm-1
K-1
and 46 Wm-1
K-1
,
respectively. These values are close to the earlier estimates by Stacey and Loper (2007).
Notably, Gomi et al. (2016) obtained the electronic thermal conductivity at the CMB
from electrical resistivity measurement that is a factor of three higher than the direct
experimental measurements of total thermal conductivity by Konopkova et al. (2016).

16
The possible reason(s) for the discrepancy between the two difficult-to-make
experimental studies has been discussed (Dobson 2016) but is yet to be resolved. High
values of core thermal conductivity yield high values of core adiabatic heat flux (Nimmo,
2015; Davies et al., 2015; Olson, 2016). Further review and discussion on thermal models
of core evolution and implications of thermal conductivity on core ages are given by
Davies et al. (2015) and references therein. The implications of these recently revised
parameter values have non-trivial impact on core evolution and energetics and involve
such fundamental questions as the age of the inner core and the main power source for
the Earth’s dynamo (Gubbins et al., 2015).
The secular cooling of the core and the release of light elements along with latent heat of
crystallization at the ICB (Labrosse et al., 2001) drive the magneto-hydrodynamic
convective processes in the outer core and are instrumental in generation of the
geodynamo (Labrosse and Macouin, 2003). The thermal power available to drive the
geodynamo comes from the heat flow by convection in excess of the heat conduction
down the adiabatic gradient (Stevenson, 2003; Labrosse, 2003; Nimmo, 2007). A
geodynamo powered mainly by compositionally-induced buoyancy or chemical
convection requires an inner core (IC) at least as old as the geomagnetic field. Recent
studies have shown the field has existed for at least 3.5 Ga (Tarduno et al., 2010; Biggin
et al., 2011) and perhaps as long as 4.2 Ga (Tarduno et al., 2015). Recent simulations
suggest the dynamo underwent a transition from weak-field non-dipolar dynamo to
strong-field dipolar dynamo at a 650 Ma, which was interpreted as a signal of the
nucleation of the IC (Driscoll, 2016). In addition, mantle global circulation models yield
internally consistent estimates for the time variations in heat loss from the core, which is
critical input for calculating the evolution of the core, and predict the age of the IC to be
0.4 - 0.95 Ga for the case of no radioactive heating in the core (Olson, 2016). This
discrepancy in IC age estimates and geomagnetic field age appears to call on thermal
convection as a major contributor to the geodynamo energy balance. If heat loss from the
core is taken to be known, then thermal conductivity of the core is thus a key parameter
in assessing the adiabatic heat flux in the core which allows the heat flux carried through
convection to be calculated.

17
Stacey and Anderson (2001) presented an elegant thermodynamic argument which
suggested that the electrical resistivity for pure metals is constant along the melting
curve. The electronic component of the thermal conductivity 𝜅e, of a metal can be
calculated from electrical resistivity using the Wiedemann-Franz law, 𝜅e = LT/ρ, where L
is the Lorenz number (with a theoretically defined constant value called the Sommerfeld
value, L0 of 2.44·10-8
WΩ/K2) and ρ is the electrical resistivity. A constant value of
electrical resistivity on the melting boundary of a metal, where liquid structural effects
are absent at sufficiently high pressures, may be a powerful means to apply robust low
pressure determinations of electrical resistivity to ICB conditions. Making some
reasonable assumptions for a value for L for Fe (Secco, 2017), thermal conductivity at the
ICB could thus be calculated from low pressure measurements of electrical resistivity of
Fe on its melting boundary (Powell, 1953; van Zytveld, 1980; Secco and Schloessin,
1989).
The aim of this study is to test experimentally the validity of the Stacey and Anderson
(2001) and Stacey and Loper (2007) postulates. More broadly however, we embark on a
new approach that has potential to contribute indirectly toward the resolution of the “new
core paradox” (Olson, 2013) by investigating experimentally the electrical resistivity of
solid and liquid Ni in the range of 3 to 9 GPa. The “new core paradox” refers to the
energy deficit for the generation and maintenance of magneto-hydrodynamic convection
necessary to sustain the geodynamo prior to the nucleation of the IC (Olson, 2013).
Ni has an electronic structure of [Ar] 4s2 3d
8 and was selected as a lower melting
temperature analogue to Fe ([Ar] 4s2 3d
6) and for its similarities of ferromagnetic and
paramagnetic states. Furthermore, Ni is integral to both the inner and the outer core
(Poirier, 1994; McDonough and Sun, 1995) and its alloying with Fe increases the
stability field of the high pressure phase relative to pure iron (Lin et al., 2002). The
presence of 5.5% of Ni in the core does not affect the hcp structure of the Fe alloy
(Tateno et al., 2012). Moreover, because of the similarities between Fe and Ni, ab-initio
calculations demonstrate that at high T, the seismic properties of Fe-Ni alloys are almost
indistinguishable from those of pure Fe (Martorell et al., 2013; Davies et al., 2015).In
addition, both Ni and Fe have similar behaviour of their melting curves (Japel et al.,

18
2005) that can be attributed to their d-electrons. Ross et al. (2007) predicted that partially
filled d-shells lower the energy of the liquid state at the onset of melting leading to a loss
of d-band structural periodicity compared to filled d-band metals (Japel et al., 2005). This
lowers the melting slope and may be characteristic of a select group of late transition
metals with partially filled d-bands. The partially filled d-band also has an impact on
compressibility and internal pressure anomalies, as observed in liquid Fe and Ni
(Steinemann and Keita, 1988). In contrast, the density of states (DOS) of Cu, with a filled
d-band, changes only slightly upon melting (Williams and Norris, 1974). The melting
line of Cu is much steeper than the melting lines of Ni and Fe.
The electronic structure of Ni (e.g., Busch et al., 1974; Waseda and Tamaki, 1975) and its
transport properties (Evans and Jain, 1972; Laubitz et al., 1976) have been the subject of
numerous theoretical and, to a lesser degree, experimental studies. The Ni melting curve
has also been investigated theoretically (some recent studies include Luo et al. (2010) and
Pozzo and Alfe (2013)) and experimentally (some recent studies include Japel et al.
(2005) and Ross et al. (2007)) although they are not always in complete agreement. The
1 atm electrical resistivity of liquid Ni has been investigated both theoretically (Fujiwara,
1979) and experimentally (e.g., Güntherodt et al., 1975). However, theoretical treatments
of the transport properties of liquid Ni were unable to replicate the experimental values
with any appreciable degree of success. In terms of experimental investigation of Ni
resistivity at high P, there has been very little reported since Bridgman (1952). The more
recent high P studies (Yousuf et al., 1986; Sundqvist, 1988; Decker and Chen, 1992)
were focused on the lower T regime around the Curie temperature, TC, and relatively low
P of up to 5 GPa. We are not aware of any experimental study of electrical resistivity of
liquid Ni at high P, and so were motivated to measure this transport behavior along its
melting boundary in the context of the Stacey and Anderson (2001) and SL 2007
predictions as well as thermal conductivity of terrestrial planetary cores.

19
2.2. Methods
The experiments were carried out using a 3000-ton multi-anvil large volume press with
the capability of fully automated pressure control and adjustable rates of heating. The
technical details of the press and its pressure calibration at room and high T have been
described elsewhere (Secco and Yong, 2012; 2016; Secco and Sukara, 2016). Detailed
expositions on the multi-anvil pressure cell design, materials, properties and applications
have been given by others (Frost et al., 2004; Leinenweber et al., 2012; Shatskiy et al.,
2011). For the specific experimental P and T conditions of this study, three important
experimental challenges had to be considered: i) control over the molten metal sample
containment and geometry; ii) reactivity with, and diffusion of, molten metal into its
container; iii) thermocouple/electrode - molten sample contamination. Each of these
problems was overcome as described below.
The main pressure medium was a semi-sintered MgO octahedron doped with 5% Cr2O3
with an edge length of 18 mm as shown in Figure 2.1. A hole was drilled between two
parallel faces of the octahedron to accommodate a ZrO2 sleeve which acted as thermal
insulation. Inside the ZrO2 sleeve were three stacked sleeves, each of 4 mm length. The
two outer sleeves (Figure 2.1) were MgO and the inner sleeve was hexagonal boron
nitride (hBN). Prior to cell assembly, hBN and two MgO sleeves, along with the ZrO2
hosting sleeve, were baked separately in a high temperature oven at 1073 K for
approximately 12 hours to remove any volatile phases including organic, hydrous or
other contaminants.
To maintain the geometry of the sample during the melt phase, a thick walled Al2O3 tube,
was used as the Ni sample container. A sample of 0.19 mm in radius and 1.50 mm in
length was cut from high purity Ni wire (Alfa Aesar, 99.99%). The sample length was cut
longer than the sample container by 0.05 mm on each end. The purpose was to ensure
good electrical contact with electrodes made of thermocouple (TC) wire. Before
emplacement into the ceramic tube, the Ni sample was lightly polished and cleaned with
alcohol to remove any oxidation and surface contaminants. The sample container and
thick walled ceramic tube was also carefully cleaned. The same procedure was repeated

20
on two Ni discs, having the same purity as the sample wire and with a diameter of 1.25
mm and thickness of 0.25 mm, emplaced between the sample end and the thermocouple
junction. The discs were used to ensure good electrical contact between the sample and a
geometrically imperfect TC junction of overlapping W5%Re and W26%Re wires.
Figure 2.1: Cross-section of the experimental pressure cell.
The discs also provided an initial barrier for inter-diffusion of Ni and TC in the melted
sample phase without affecting the initial voltage drop across the sample, and
consequently the measurement of electrical resistivity. The overall total resistivity
contribution of the discs was calculated to be ~ 1%. This is because the area of the disc is
much larger than that of the sample, and its thickness is very small relative to the length
of sample. When the total resistivity is calculated (adding ρ of discs and ρ of the sample),
the contribution of the discs to the total ρ is negligible. In the first 2 – 3 seconds
following melting, the contribution to the voltage drop across the sample by W and Re
contamination was negligible because of the relative size of the contact disc area
compared to the sample. Thus, the resistivity obtained in the initial stage of melting
comes almost entirely from the contribution of the cylindrical Ni sample. The diffusion of
W and Re from the TC into the liquid sample progressed with time; however, this

21
approach enabled the acquisition of accurate resistivity data on Ni at the moment of
melting which was the focus of this study.
W26%Re / W5%Re wires of 0.20 mm diameter were used as both thermocouples and
electrodes in the 4-wire resistivity measurement method employed in this study.
Thermocouple wires were threaded through 4-hole Al2O3 tubes which were
symmetrically emplaced within the MgO sleeves. Using a microscope and purpose-built
tool, a small indent was drilled in the bottom of each Al2O3 tube on the side oriented
toward the Ni disc and the sample, which hosted the TC junction. This prevented an
excess of TC wire from protruding from the 4-hole ceramic tube and altering the sample
geometry. Melt containment was achieved between the 4-hole Al2O3 tube hosting the TC
and the thick walled Al2O3 tube hosting the sample by minimizing the internal free
volume on cell assembly.
Resistive heating was achieved by using a Re cylindrical furnace that was emplaced
within the ZrO2 cylinder. In initial test runs, the maximum temperature difference
between the two TC’s located at each end of the 1.50 mm long sample was observed to
be ±50 K at temperatures up to 2000 K. The assembled octahedral pressure cell was
placed in a vacuum furnace at ~420 K for 12 – 24 hours to remove volatile phases and
other contaminants.
Following slow pressurization to the desired level, a fast rate of heating of up to 300
K/min was employed, during which data were collected in the voltage drop mode across
the sample and in TC mode to record the temperature. The reason for the rapid heating
and data collection was to minimize diffusive processes between the thermocouples and
the sample. A manual switch was used to alternate between the two modes. In the TC
mode, the thermal EMF corresponding to temperature was recorded and later converted
to the actual temperature using an in-house algorithm for type C thermocouples. Pressure
correction was not applied for type C thermocouples.
In the voltage drop mode, a constant DC current of 0.5 A was passed through one leg of
the TC, through the sample and out through the same wire type leg of the other TC. The
DC power source was a Keysight B2961A and DC voltages were recorded using a

22
Keysight 34470A digital multimeter and associated BenchVue software. Voltage drop
data were acquired in the solid state only when the temperature during heating was
stabilized. Temperatures in the melt were held for 20 – 40 s and the data were acquired
rapidly using the high data acquisition rate (up to 20 Hz) of the Keysight 34470A meter.
A manual polarity switch was used to mitigate any possible voltage contribution due to
the temperature differences between two thermocouple junctions and any other parasitic
voltages. The positive and negative polarity voltage drop data were averaged before
calculating resistance. Following excursion into the liquid phase, the T was quenched by
shutting off the furnace power.
The recovered samples were ground to obtain a section parallel to the long axis of the
cylindrical sample so that the sample could be optically and chemically analyzed. The
dimensions of the recovered sample were compared with the initial pre-experiment
values and while no appreciable changes in dimension were observed under the optical
microscope, the effects of thermal expansion and compressibility were included in the
overall error calculation discussed in the next section. The recovered samples were
investigated by wavelength dispersive X-ray spectroscopy using a JEOL JXA-8530F
field-emission electron microprobe (EMP). An accelerating voltage of 20 kV, and a probe
current of 50 nA, were used for all composition analyses.
The electrical resistance was calculated from Ohm’s law. After comparison of the initial
and recovered sample dimensions, the electrical resistivity of both solid and liquid states
of Ni was determined. The resistivity was calculated from Pouillet’s law, 𝜌 =𝑅𝐴
𝐷 , where
ρ is the resistivity of the sample, R is the sample resistance, and A and D are the area and
length of the cylindrical wire sample, respectively. The uncertainty in the sample
dimensions corresponds in part to uncertainties in caliper and microscope measurements.
The most significant error in sample length however, came from the difficulty in
distinguishing the shape of the boundary between the thermocouple and recovered melted
sample. That error was negligible in the solid, and estimated to be up to a factor of five
times that of the standard length uncertainty in the liquid state (in the extreme case). The
significantly larger error bars in the liquid state data reflect that. In principle, thermal
23
expansion at high T and compressibility at high P are antagonistic effects but they are not
cancelling and cannot be neglected. The errors due to thermal expansion and
compressibility were less than the uncertainties in length measurement and were included
in the final error calculations.
The standard temperature uncertainty in a type C thermocouple is ±4.4 K at 698 K and
about 1% at high temperatures. The primary contribution to T uncertainty in this study
comes from the related uncertainty in TC wires at high P and T. The error due to thermal
gradients was negligible in the lower temperature range and taken into account in the
higher temperature range. The maximum error contribution of the diffusion buffer Ni
discs to the measured electrical resistivity of the sample was evaluated to be 1.2%. The
thermal pressure effect to the overall pressure uncertainty, while very small, was included
in the overall error estimates. A standard error calculation and propagation was carried
out according to the formalism of Bevington and Robinson (2003). The contribution of
the diffused W and Re in the Ni sample following the initial melting is addressed in the
next section. The actual effect of alloying on the observed electrical resistivity, deeper in
the temperature range of the melt, is addressed via its effect on the T-coefficient of
resistivity.
2.3. Results
The T-dependence of electrical resistivity of both solid and liquid Ni at pressures in the
range 3 – 9 GPa are shown in Figure 2.2a. The high P,T data are shown in comparison to
the 1 atm data recommended by Chu and Chi (1981) and other studies at atmospheric
pressure are shown in Figure 2.2b. Throughout the pressure range discussed here, and in
the solid state temperature regime, our measured electrical resistivity data of Ni are self-
consistent and exhibit the expected T2 dependence (Calandra and Gunnarsson, 2002) in
the ferromagnetic state prior to the linear trend observed above the Curie temperature
(TC). The electrical resistivity of solid Ni decreases with increasing pressure which is
characteristic of most metals (Bridgman, 1952).

24
Figure 2.2: (a) The T-dependence of electrical resistivity of solid and liquid Ni at
pressures in the range 3 – 9 GPa compared with the resistivity at 1 atm. (b) The T-
dependence of electrical resistivity of solid and liquid Ni at atmospheric pressure
from various studies [Chu and Chi, 1981; Seydel and Fucke, 1977; Güntherodt et
al., 1975; Laubitz et al., 1976; Cezairliyan and Miiller, 1983. Güntherodt et al.
(1975) provides two datasets. The data from Regel and Mokrovsky (1953) are as

25
cited in Seydel and Fucke (1977). (c) Representative error bars for 5 GPa run (error
in T is within the symbol size).
We note, however, that the slope of electrical resistivity at high pressure between the
Curie temperature and melting is lower than that determined at atmospheric pressure. The
most likely reason is that above the Curie temperature, the long-range order of spin
magnetic moments is lost by the effects of temperature, and electron scattering by
magnons becomes greatly reduced. With higher temperature, magnetic moments are
increasingly destroyed, and consequently the compressibility is increased (as one of the
primary static properties controlled by d-electrons). This allows pressure to reduce the
amplitude of phonon vibrations more effectively in a way that temperature cannot
compensate, but also allows for pressure-induced modifications of the Fermi surface.
Furthermore, pressure acts in such way, that it reduces the density of states through band
splitting. Together, these factors account for the lower slope of electrical resistivity above
the Curie temperature in the high pressure datasets compared to the 1 atm dataset.
At the onset of the liquid region, there is a significant jump in resistivity. The electrical
resistivity curves of liquid Ni are also well-behaved with linear trends as shown in Figure
2.2a, clearly indicating the melt was contained. Earlier cell designs that showed post-
recovery evidence of liquid Ni leakage and sample geometry disruption had irregular
resistivity behaviour in the liquid region that was a revealing sign of liquid sample breach
of its container boundaries. Remarkably, at the moment of complete melting, the
electrical resistivity is constant at different pressures within the experimental
uncertainties. This means the electrical resistivity of liquid Ni is invariant along the
melting curve up to 9 GPa, which is the main result of this study.
The pressure effects on the resistivity observed in this study are consistent with the
pressure effects on the resistance of Ni observed by Sundqvist (1988) and Decker and
Chen (1992), despite different experimental methodologies and relatively narrow P-T
ranges adopted in their studies. In general, the decrease of electrical resistivity in the solid
state in the P-range of 3-9 GPa is linear and it is consistent with the observed behaviour
in resistance reported by Pu (1991). Figure 2.2c displays the representative calculated

26
error bars from different sources as discussed in the previous section. The error bars due
to the uncertainty in temperature are small and are within the symbol size.
At the onset of the melting, the resistivity behavior is characterized by a rapid increase in
resistivity of a magnitude consistent with the jump observed at 1atm. The continuous
increase in resistivity on increasing temperature during melting in our data, in contrast to
the apparent near vertical jump in the 1 atm data, can be interpreted as likely indication of
the presence of T-gradients in the cell which are exacerbated by a rapid rate of heating
through melting. The resistivity continues to rise as the sample progressively melts over a
narrow range of temperature and then assumes a different, that is, linear T-dependence in
the completely molten phase. The ratios of the electrical resistivity of the molten Ni on
the melting boundary at pressures in the range 3 – 9 GPa to the 1 atm value (Chu and Chi,
1981) hover around unity (Figure 2.3a) which demonstrate the invariance of resistivity
along the melting boundary.
Our initial resistivity values in the liquid are in good agreement with those of Seydel and
Fucke (1977) and Güntherodt et al. (1975). Another relevant finding in this study is
illustrated in Figure 2.3b, where the ratio of the liquid to solid electrical resistivity at the
melting temperature increases linearly and rapidly as plotted as a function of pressure.
This is discussed later in connection with the effects of P on the DOS at the melting
point.
The T-coefficients of resistivity in the liquid state, (dlnρ/dT)P obtained in this study are
plotted in Figure 2.4 and are compared with 1 atm studies. Although there is some
variation in values in the high pressure range, our values are in general agreement with 1
atm values. Our data for Ni are also compared with similar data for Fe at high pressure in
Figure 2.4. Both transition metals have generally similar values of (dlnρ/dT)P in the liquid
state providing further evidence of the similarity of charge transport behavior in liquid Ni
and Fe. The jump in values for Fe at ~5 GPa was interpreted to result from the changes in
short range atomic structural order in the liquid at the triple point in the P, T phase
diagram caused by different parent solid structures (Secco and Schloessin, 1989) and
later supported by measurements of other physical property changes in the liquid at 5GPa

27
(Sanloup et al., 2000; Terasaki et al., 2002), but Ni does not show any solid state
polymorphism in the range of pressures investigated here. The variability of (dlnρ/dT)P
for molten Ni may be an indication of the effects of diffusion of TC metals into the liquid
sample.
Figure 2.3: (a) The ratio of the electrical resistivity of molten Ni on the melting
boundary at pressures 3 – 9 GPa (ρP) and at ambient pressure (ρ0) (Chu and Chi,
1981). (b) The ratio of electrical resistivity of liquid Ni to that of solid Ni before
melting as a function of pressure.

28
Figure 2.4: The temperature coefficient of electrical resistivity, (dlnρ/dT)P, plotted
for liquid Ni for pressures from 3 GPa to 9 GPa. Error bars in pressure are within
the symbol size. The dlnρ/dT values for Ni are compared to values for liquid Fe in a
similar pressure range [Secco and Schloessin, 1989]. Additional comparison is made
with the dlnρ/dT at atmospheric pressure for both liquid Ni and Fe, derived in
earlier experimental work (Baum et al., 1967; Güntherodt et al., 1975; Kita et al.,
1978; Seydel and Fucke, 1977; van Zytveld, 1980; Chu and Chi, 1981). The data
point from Erskov et al. ([1976) is as cited in van Zytveld (1980), and the data point
from Regel and Mokrovsky (1953) is as cited in Seydel and Fucke (1977).
On the other hand, assuming that Matthiessen’s Rule is valid in liquid Ni (e.g.,
Matthiessen and Vogt, 1864; Zinov'ev et al., 1972; Stacey and Anderson, 2001), and
comparing the T-coefficient of electrical resistivity of Re and W in the high T solid state

29
(Powell et al., 1963; Desai et al., 1984) with that of liquid Ni at high pressures, there is a
notable similarity. It is possible that the contribution for the higher value of slope of
electrical resistivity of liquid Ni comes from the diffusion of W and Re into molten Ni.
While we make a note of this behavior, further study is needed to quantify it. Obviously,
the diffusion and dissolution of TC metals in liquid Ni (Natanzon et al., 1992) is a
problem if one wants to determine electrical resistivity of pure Ni at higher temperatures
in the melt. However, during initial test runs, Ni sample was rapidly heated to the melting
point at pressure and quenched immediately. The subsequent EMP analysis showed only
limited surface/grain boundary diffusion, but neither W nor Re was dissolved in the
sample. This demonstrates that, in the presence of a Ni disc and rapid heating with rapid
data acquisition, the initial few electrical resistivity points in liquid Ni (Figure 2.2a) come
only from the Ni sample contribution and are not affected by any diffused W and Re.
Indeed, the self-consistency of the data presented here seems to confirm that. This also
confirms that there is no appreciable W or Re diffusion in the Ni sample in the solid state
at high pressure which is consistent with the results of an earlier study that pressure has a
retarding effect on diffusion of Re in solid Ni (Watson et al., 2008). This highlights the
important role of the Ni disc in mitigating any potential diffusion from the relatively
small area of the TC tip.
It should be noted however, that in the recovered samples of the initial test runs (data
from which are not reported here) which were kept in the melt between 200 to 300 s, the
maximum combined content of W and Re in the recovered Ni sample never exceeded 50
wt% (~25 at.%). During that prolonged time in the melt, the content of W and Re
stabilized to a value close to the saturation limit of W in molten Ni (Natanzon et al.,
1992). However, the EMP results obtained from sectioned samples recovered from test
runs, heated up to 2173 K and held for up to 300 s in the melted sample phase, showed no
appreciable Al2O3 contamination in the sample.
The variation of the Curie temperature of Ni is plotted against pressure in Figure 2.5a.
The Curie temperature was obtained by resistivity curve fitting and then taking the
second derivative in the region between 500 K and 800 K. The Curie temperature of Ni
increases with increasing pressure as also reported by Decker and Chen (1992) and

30
Sundqvist (1988). The overall trend agrees reasonably well with the literature values,
within the uncertainty reported in this study demonstrating the well-known positive
pressure effect on the Curie temperature (Bloch and Pauthenet, 1965; Leger et al., 1972;
Sundqvist, 1988; Decker and Chen, 1992). Figure 2.5b shows the resistivity at TC with
increasing pressure. The overall decrease of the resistivity at TC with respect to pressure
is consistent with the earlier observations (Sundqvist, 1988; Decker and Chen, 1992).
Pressure coefficients of electrical resistivity, (dlnρ/dP)T, were determined from the lnρ vs.
P slopes for temperatures between 500 and 1500 K and are shown in Figure 2.6. Above
the Curie temperature, the value of pressure coefficients of electrical resistivity remains
relatively constant. In the inset of Figure 2.6, values of (dlnρ/dP)T for Ni are compared
with values for Fe (Secco and Schloessin, 1989) and the agreement between the two
metals provides consistent and further evidence of the parallel behavior of Ni and Fe.
The melting temperature of Ni is plotted as a function of pressure in Figure 2.7 and is
compared to the experimental data from Strong and Bundy (1959). There is good overall
agreement between the two datasets. A small amount of contamination of Re or W would
elevate the melting point of the Ni alloy (e.g., Okamoto, 2012) which additionally
confirms the absence of any appreciable contamination prior to onset of Ni melting. The
error bars correspond to the uncertainty associated with picking the melting point of a
sample that has progressively melted over a narrow T-range.

31
Figure 2.5: (a) The dependence of the Curie temperature on pressure compared
with the values from earlier studies (Leger et al., 1972; Sundqvist, 1988; Decker and
Chen, 1992). (b) Resistivity at Curie temperature as a function of pressure.

32
Figure 2.6: Logarithmic electrical resistivity of solid Ni along isotherms as a
function of pressure. The slopes of pressure coefficient of resistivity, (dlnρ/dP)T, are
plotted in the inset in units of GPa-1
.
Figure 2.7: A comparison of the melting temperatures of Ni obtained by resistivity
jump on melting in this study with earlier studies using other methods in large
volume press (yellow circles) and diamond anvil cells (other symbols) (Strong and
Bundy, 1959; Lazor et al., 1993; Errandonea et al., 2001; Japel et al., 2005;
Errandonea, 2013).

33
Finally, the electronic component of the thermal conductivity, ke, of Ni was calculated
using our electrical resistivity data and the constant Sommerfeld value of the Lorenz
number (L0 = 2.44x10⁻⁸
WΩ/K2). This is compared with the atmospheric pressure data of
the total experimentally measured thermal conductivity, ktotal, from Laubitz et al. (1976)
and Ho et al. (1972), as shown in Figure 2.8. The total experimentally measured thermal
conductivity includes both electronic and phonon components (kp) and is therefore
expected to be higher than our calculated electronic thermal conductivity values. This is
apparent in Figure 2.8, taking into account the observed trend of increasing electronic
thermal conductivity with pressure in the solid state. The inset figure shows the
temperature dependence of the Lorenz number, L(T), normalized to L0. The function L(T)
was determined from separate experimental measurements of electrical resistivity and
thermal conductivity of Ni (Laubitz et al., 1976). Values of L(T)/L0 are less than unity in
the low temperature range, indicating that if L(T) was used in our calculation, the thermal
conductivity values calculated with our experimental resistivity values would be even
lower than those plotted in the low temperature range. However, in the higher T range,
L(T)/Lo > 1 for Ni and this is also consistent with Fe as recently discussed (Secco, 2017).
The values of the electronic thermal conductivity of Ni display the same general trend as
the experimentally obtained total thermal conductivity at atmospheric pressure (Laubitz
et al., 1976; Ho et al., 1972). Moreover, while the thermal conductivity of Ni has a
positive P-dependence in the solid state, our results demonstrate that thermal conductivity
is effectively invariant in the liquid in the range of P and T investigated in this work.

34
Figure 2.8: Calculated electronic thermal conductivity, κe, for solid and liquid Ni at
pressures 3 - 9 GPa using the Wiedeman Franz law and the Sommerfeld value of the
Lorenz number (2.44·10-8 WΩK-2
). The electronic thermal conductivity of Ni is
compared with total thermal conductivity, κtotal, at atmospheric pressure obtained
by Laubitz et al. (1976) and Ho et al. (1972). The inset is the ratio of the
experimentally derived temperature dependent Lorenz number for Ni, as measured
by Laubitz et al. (1976), and the Sommerfeld value given above.
2.4. Discussion
The results obtained in this study demonstrate, within experimental uncertainties, that the
electrical resistivity of liquid Ni is invariant along the melting curve up to 9 GPa. This
diverges from the anticipated behaviour of electrical resistivity of liquid metals at high
pressure arising from the thermodynamic argument presented by Stacey and Anderson
(2001) and Stacey and Loper (2007). According to their prediction, the electrical
resistivity of Ni is expected to be non-constant along the melting curve because Ni is an
archetypical 3d transition metal and a very close electronic analogue of Fe. Recent
measurements however of the electrical resistivity of Co ([Ar] 4s2 3d
7) along its melting

35
boundary show invariant behavior (I.E. Ezenwa, personal communication) similar to
what is found in the current study on Ni. Therefore, in an attempt to reconcile the
predictions by Stacey and Anderson (2001) and Stacey and Loper (2007) and recent
theoretical (e.g., Pozzo et al., 2012; 2013) and experimental results (Gomi et al., 2013) on
liquid Fe with the results obtained in this work, we seek a physical mechanism that
explains such behaviour of Ni. Moreover, considering the electronic similarity of Ni and
Fe, we seek to understand if the behaviour observed in liquid Ni under high pressures
could potentially be extended Fe with important implications for the transport properties
of the Earth’s core. To make such a connection, it is important to discuss comparatively a
simple metal such as Cu since it bridges the gap between the transition and noble metals.
Additionally, Stacey and Anderson (2001) and Stacey and Loper (2007) suggested that
Cu should show invariant resistivity behavior along its melt boundary.
This chapter presents a qualitative discussion on the possibility of a P-invariant Fermi
surface and a constant electron mean free path at the onset of melting, as the physical
mechanisms responsible for the invariant electrical resistivity of liquid Ni along its
melting curve. Both phenomena are expected to manifest simultaneously. This chapter is
organized as follows: in Section 2.4.1, the possibility of a constant spherical Fermi
surface along the melting curve is examined; in Section 2.4.2, the role of d-band
electrons, the local structures in the early melt and their potential influence on the
electron mean free path is considered. Additionally, the correlation between the transition
metals that obey the Kadowaki-Woods (K-W) ratio (Kadowaki and Woods, 1986) and
those metals exhibiting anomalously shallow melting curves is also discussed in Section
2.4.2.
2.4.1 Fermi Surface and the Hall Coefficient in Liquid Transition Metals
The main factors that affect the electrical resistivity of liquid metals are the magnitude
and frequency of oscillatory motion of the ions, electron-electron scattering, and
scattering of electrons by disordered magnetic moments (e.g., Mott, 1964, 1972). Both
temperature and pressure affect the magnitude of these scattering mechanisms, where
pressure increase supresses the amplitude of atomic vibrations, thereby decreasing

36
electron scattering, while temperature has the opposite effect in both solid and liquid
metals.
From Mott’s formula for electrical conductivity (e.g., Mott, 1972, 1980; Shimoji, 1977)
which is the basis for the Kubo-Greenwood expression used to calculate resistivity of
transition metals (e.g., de Koker et al., 2012; Pozzo et al., 2012, 2013, 2014), the
electrical resistivity of liquid metals is inversely proportional to the Fermi surface size
and the mean free path of conduction electrons. Notably, in its unmodified form, the
expression below is best applicable to simple liquid metals; however, it can also be
applied to complex liquids (i.e., molten transition metals) (Mott, 1980):
𝜎𝑒 = 𝑆𝐹 ∣ 𝑒 ∣2 𝑙/12𝜋3ћ (2.1)
Here, σe is electrical conductivity, SF is the area of the Fermi surface, and ∣ 𝑒 ∣2 is the
electron mean free path which is defined as the product of the Fermi velocity, vF, and the
conduction electron relaxation time, τ, where λ = νF τ, and ћ is the modified Planck
constant. The relaxation time varies with the DOS at the Fermi level (Shimoji, 1977) and
the combined scattering mechanisms operating at a specific P and T.
If the electrical resistivity of a liquid metal at high pressures is invariant at the melting
point, then it is reasonable to examine if there is a fundamental physical reason that
would cause the Fermi surface and the mean free path of electrons in liquid transition
metals to remain invariant along the melting boundary (e.g., Gapotchenko et al., 1988).
To address those questions, a brief preamble needs to be given about the Hall coefficient
in liquid metals since it can yield information about the shape of the Fermi surface and
correspondingly, electronic transport (Chien and Westgate, 1980). In contrast to most
solid metals, where the Hall coefficient, RH, is a subtle indicator of the geometry of the
Fermi surface, liquid simple metals (treated as simple liquids) are generally characterized
by 𝑅𝐻 =–(1
𝑛𝑒) , where n and e are the charge carrier number density and electron charge,
respectively. This provides evidence that the Fermi surface can be treated as spherical
(Faber, 1972; Evans, 1978). Generally, this can be extended to liquid transition metals
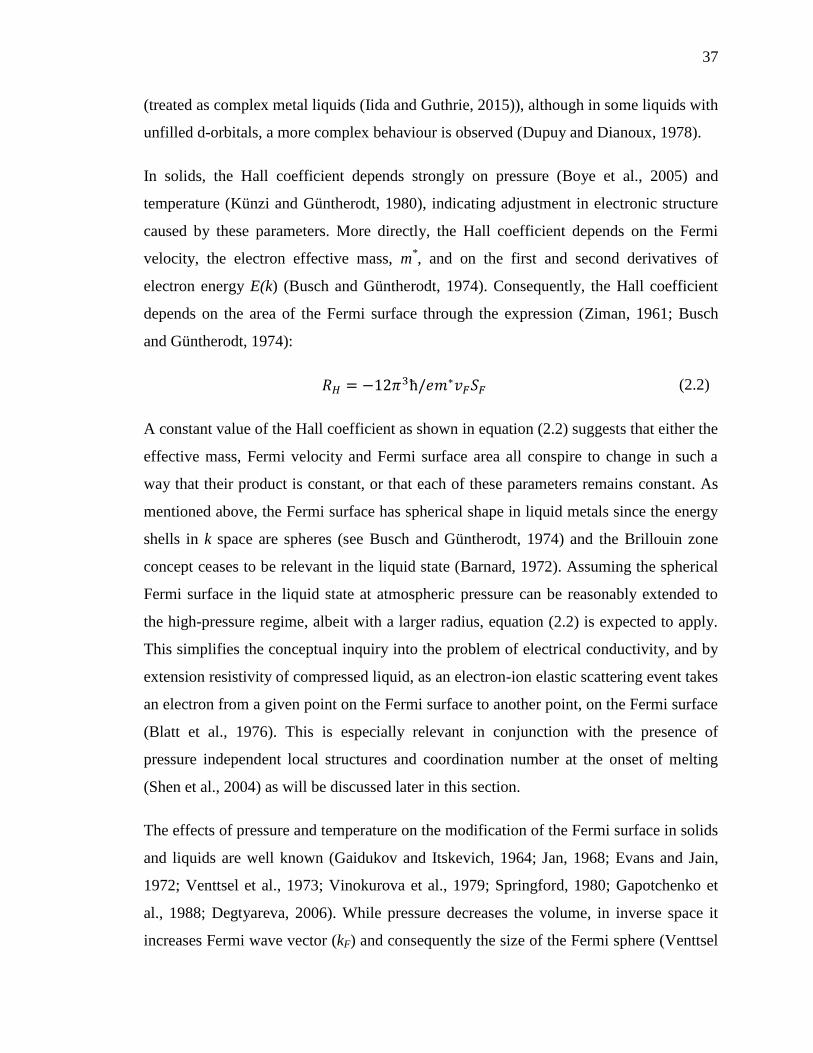
37
(treated as complex metal liquids (Iida and Guthrie, 2015)), although in some liquids with
unfilled d-orbitals, a more complex behaviour is observed (Dupuy and Dianoux, 1978).
In solids, the Hall coefficient depends strongly on pressure (Boye et al., 2005) and
temperature (Künzi and Güntherodt, 1980), indicating adjustment in electronic structure
caused by these parameters. More directly, the Hall coefficient depends on the Fermi
velocity, the electron effective mass, m*, and on the first and second derivatives of
electron energy E(k) (Busch and Güntherodt, 1974). Consequently, the Hall coefficient
depends on the area of the Fermi surface through the expression (Ziman, 1961; Busch
and Güntherodt, 1974):
𝑅𝐻 = −12𝜋3ћ/𝑒𝑚∗𝑣𝐹𝑆𝐹 (2.2)
A constant value of the Hall coefficient as shown in equation (2.2) suggests that either the
effective mass, Fermi velocity and Fermi surface area all conspire to change in such a
way that their product is constant, or that each of these parameters remains constant. As
mentioned above, the Fermi surface has spherical shape in liquid metals since the energy
shells in k space are spheres (see Busch and Güntherodt, 1974) and the Brillouin zone
concept ceases to be relevant in the liquid state (Barnard, 1972). Assuming the spherical
Fermi surface in the liquid state at atmospheric pressure can be reasonably extended to
the high-pressure regime, albeit with a larger radius, equation (2.2) is expected to apply.
This simplifies the conceptual inquiry into the problem of electrical conductivity, and by
extension resistivity of compressed liquid, as an electron-ion elastic scattering event takes
an electron from a given point on the Fermi surface to another point, on the Fermi surface
(Blatt et al., 1976). This is especially relevant in conjunction with the presence of
pressure independent local structures and coordination number at the onset of melting
(Shen et al., 2004) as will be discussed later in this section.
The effects of pressure and temperature on the modification of the Fermi surface in solids
and liquids are well known (Gaidukov and Itskevich, 1964; Jan, 1968; Evans and Jain,
1972; Venttsel et al., 1973; Vinokurova et al., 1979; Springford, 1980; Gapotchenko et
al., 1988; Degtyareva, 2006). While pressure decreases the volume, in inverse space it
increases Fermi wave vector (kF) and consequently the size of the Fermi sphere (Venttsel

38
et al., 1973). Temperature has an opposite effect, as it causes dilation of the electron
shells (Kreutz et al., 1998; Sanloup et al., 2002). To gain some insight into relative
magnitudes of these opposing effects on the Fermi surface a comparison is made of the
isothermal compressibility and thermal expansion of liquid Ni and Cu (Nix and MacNair,
1941; Crawley, 1974; Drotning, 1981; Yokoyama et al., 1983; Ivanov et al., 1984;
Hixson et al., 1990; Anderson and Ahrens, 1994; Nasch and Steinemann, 1995; Itami,
1995; Iida and Guthrie, 2015). While liquid Cu has a higher thermal expansion
coefficient than liquid Ni by ~14%, the compressibility of liquid Cu is about ~40% larger
than that of liquid Ni. High pressure brings atoms closer together and increases their
exchange-interaction energy, thus causing broadening and overlap of the electron energy
levels (Al'tshuler et al., 1968). Furthermore, pressure-induced broadening decreases the
3d DOS, which corresponds to volume reduction. It is the d-band density of states in both
solid and liquid Ni that contributes the most to overall density of states at the Fermi level
(Jank et al., 1991) and to the dominant s-d scattering mechanisms.
The implication of the above is that Cu will have significantly larger increase in its Fermi
surface under compression, at melting, compared to the relatively more stable Fermi
surface of Ni. Cu exhibits such behaviour, primarily because of the absence of an
anomalous unfilled d band contribution, and its resistivity would be expected to decrease
in the melt as a function of pressure in the absence of s-d electron scattering. This is
contrary to what Stacey and Anderson (2001) and Stacey and Loper (2007) predicted but
what has been shown by a recent experimental study on Cu up to 5 GPa (Ezenwa et al.,
2017). Consequently, it would not be surprising if other transition metals with unfilled 3d
shell might have a similar behaviour to Ni, as recently shown by a very recent
experimental study on the resistivity of Co along its melting boundary (Ezenwa and
Secco, 2017), although some exceptions to this are possible. That similarity is primarily
due to their electronic structure and unfilled d-bands; the transition metals exhibit
anomalous compressibility relative to simple and noble metals (Steinemann and Keita,
1988). However, in reality, complexities arise as the pressure derivative of the Fermi
surface is generally highly nonlinear (Gapotchenko et al., 1988) in different transition
metals. Moreover, in some solid metals, such as Co, the Fermi surface pressure derivative

39
is negative (Gapotchenko et al., 1988). For comparison, the Fermi surface pressure
derivative for solid and liquid Ni is positive.
Based on the experimental results presented in this study, and the controlling effect of
electronic properties of unfilled d-band transition metals on the size of the Fermi surface
discussed above, it is reasonable to expect the possibility that under the opposite effects
of pressure and temperature, the Fermi surface will remain invariant along the melting
boundary. We note that experimental evidence of constant Fermi surface along the
pressure dependent melting curve could be obtained by measuring the Hall coefficient of
the compressed liquid metal.
The qualitative argument is extended to other physical properties of Ni in order to
understand the possible role of the local short range structures in the liquid Ni and
reasons for possible constant electron mean free path at melting points. Additionally,
other similar 3d metals are briefly considered.
2.4.2 The Role of d-electrons in Liquid Structure and the Electron Mean Free Path
The structure and electronic properties of liquid transition metals have been studied
extensively (Ziman, 1961; Evans and Jain, 1972; Mott, 1972; Busch et al., 1974; Busch
and Güntherodt, 1974; Waseda and Tamaki, 1975; Meyer et al., 1976; Evans, 1978;
Khanna and Cyrot-Lackmann, 1978; Fujiwara, 1979; Shvets, 1982; Dose et al., 1986;
Jank et al., 1991; Jakse et al., 1996; Baria, 2004; Thakor et al., 2009). As a transition
metal, Ni has vacant 3-d-states. The 3d-band of Ni, which is narrow in the solid state at 1
atm and broadens at higher pressure, has a high DOS relative to the s-band (Meyer et al.,
1976; Khanna and Cyrot-Lackmann, 1978; Dose et al., 1986). However, the specific
feature of a d-band is that it consists of five sub-d-bands, formed from wave functions of
different symmetries (Blatt et al., 1976). The structure of a Ni d-band is complex due to
the presence of preferential spin states and the DOS varies strongly with energy within
the band.
In transition metals, both d-band and s-band electrons reside above the Fermi energy and
have a contribution in electrical conductivity. The d-electrons have higher effective mass

40
and have lower velocity while lower effective mass and more mobile s-electrons are
mainly responsible for transport of charge (Mott, 1972, 1980). The s-d scattering
mechanism, favoured by Mott (1964, 1972, 1980), can be described in terms of
hybridization of s-d orbitals, where s-electron makes a transition to the d-like part of the
Fermi surface and this mechanism will be present in the high-pressure environment. The
electron scattering is confined in an energy range within kT of the Fermi energy, where k
is the Boltzmann’s constant. In the solid, the number of scattering events is smaller than
in the liquid.
The effective electron scattering cross sections in transition metals can be expressed as:
∑𝑠𝑐(𝑘𝑇)2/(𝜀𝑑 − 𝜀𝐹)
2 where εd is the energy of the d-band electrons within kT of the
Fermi level that could contribute to s-d scattering (e.g., see Mott Mott, 1964, 1972; Blatt
et al., 1976) and εF is Fermi energy. As temperature increases, the scattering cross section
increases and hence the contribution of the electron-electron scattering to the resistivity
as highly mobile s-electrons get scattered into much less mobile d-states. However, the
exact magnitude of such contribution to electrical resistivity of liquid transition metal
remains unclear.
In the liquid state, the 3d band of Ni is wider and 3d DOS is lower than that in solid Ni at
1 atm because of the reduction in the number of nearest neighbours (Khanna and Cyrot-
Lackmann, 1978). The experimentally obtained results for DOS of solid and liquid Ni
show that the d-band width increases by factor of 1.4 between solid and liquid (Dose et
al., 1986). Theory predicts that this ratio scales almost linearly to the jump in electrical
resistivity between solid and liquid Ni, which is about 1.3 at atmospheric pressure, but
increases with pressure (Dose et al., 1986). Indeed, the results in this work demonstrate
that the jump in electrical resistivity between solid and liquid is progressively higher with
increasing pressure, and the trend is linear as shown in Figure 2.3b.
When McLachlan and Ehlers (1971) studied the effects of pressure on the melting
temperature of metals, they noticed that Ni and a few select transition metals diverge
from the trend theoretically predicted (see Japel et al., 2005 and references therein).
Consequently, one of the unusual features of Fe, Ni, Co, Mo and Pt is their shallow

41
melting curves (Japel et al., 2005). These authors experimentally studied the melting
curves of Ni and Cu and compared the results with the available model. According to the
model discussed by Japel et al. (2005), partially filled d-electron bands lose structural
periodicity associated with melting, which in turn changes the DOS in the liquid and
lowers the liquid energy relative to the solid. Furthermore, at high pressure, s-d electron
transfer lowers the slope of the melting curve of unfilled 3d-band metals. On the other
hand, because of the filled d-band in Cu, its melting curve does not diverge from the
theoretical model (Japel et al., 2005). This indeed has important ramifications for the
discussion here, as it relates characteristics of the filled and unfilled 3d-band atomic
structure to melting boundary behaviour. Ross et al. (2007) discussed the Peierls/Jahn-
Teller distortion and the possibility that pressure-induced s-d electron “promotion”
provides a mechanism for creating and enhancing the stability of local structures by
enabling energetically preferred local ordering for liquids of metals with partially filled d-
bands (e.g., Ni and Fe). The partially filled d-shell has the capacity to form locally
preferred structures, which lowers the free energy of the liquid and hence lowers the
melting temperature (Luo et al., 2010). Supporting such an argument is the well
established presence of local ordering in liquid Ni where there are clusters with
icosahedral short range order (ISRO) (Schenk et al., 2002; Lee et al., 2004; Ross et al.,
2007). ISRO clusters incorporate 12 atoms exhibiting 5-fold symmetry surrounding a
central atom (Lee et al., 2004). These clusters interact via a Lennard-Jones potential,
which has energy that is 8.4% lower than a close packed arrangement in the solid
(Schenk et al., 2002).
Could the presence of local structures in the melt discussed above mean that the electron
mean free path is controlled by the length scale of ISRO clusters such that it remains
invariant at the onset of melting and independent of P? The experimentally observed
local structural invariance of Fe, at the onset of melting and up to 58 GPa (Shen et al.,
2004) may be used as an indicator of what can be expected for Ni. Shen et al. (2004) used
x-ray scattering in a laser heated diamond anvil cell to demonstrate that liquid Fe remains
a closed packed hard sphere liquid with the same shape of the structure factor up to 58
GPa. They concluded that for liquid metals with close-packed structures and isotropic

42
metallic bonding, changes of local atomic configuration are generally not seen with
pressure. The experimental results presented in this study seem to support the argument
that the overall arrangement of local structures and preferred ordering in Ni upon the
onset of melting, remains relatively constant with increasing pressure (as manifested on
the melting boundary) and consequently maintains a constant electron mean free path.
That argument is additionally supported, at least in part, by theoretical work on the
structure of liquid Ni along the melting curve (Cao et al., 2015). These authors found that
the pair distribution function remains stable at pressures in the range of 20 - 100 GPa,
while the coordination number decreases slightly from about 14.5 at atmospheric pressure
to about 14 at 100 GPa.
Now, the correlation among unfilled 3d-band transition metals that obey the K-W ratio
(Kadowaki and Woods, 1986; Jacko et al., 2009) is considered. The K-W ratio compares
the temperature dependence of the resistivity of a metal to that of its heat capacity. When
plotted on the standard K-W plot, select transition metals (Fe, Ni, Co, Pt, Pd, Re, and Os)
have the same trend with a slope of 𝐴𝑟
𝛾2≈ 0.4𝜇𝛺𝑐𝑚𝑚𝑜𝑙2𝐾−2𝐽−2 (Jacko et al., 2009),
where γ is the linear factor of temperature dependent electronic contribution to the heat
capacity, and Ar is the proportionality factor to the quadratic term of T2
in resistivity at
low temperature. Considering that the K-W ratio is a reflection of electron-electron
scattering in strongly correlated systems (Rice, 1968), such as heavy fermions, we expect
that the K-W ratio reveals similar information about electron-electron scattering in 3d
transition metals (Jacko et al., 2009). The common thread between Ni and the select
group of transition metals that follow the K-W ratio is the relation between the
temperature dependent electronic contribution to the heat capacity and electron-electron
scattering. We expect that the similarity in K-W behaviour extends to transport properties
and that the invariant electrical resistivity behaviour observed in compressed liquid Ni,
will be potentially present in those 3d transition liquid metals that also have unfilled d-
shells.
Finally, the metals that have a shallow melting curve also exhibit a common trend on a
K-W plot (e.g., Fe, Ni, Pt). Considering that both phenomena are caused by the

43
contribution of unfilled d-band electrons, we can reasonably predict that the transition
metals to which both phenomena apply, will have invariant electrical resistivity along the
melting curve. The recent experimental work by McWilliams et al. (2015) demonstrated
that electrical resistivity and thermal conductivity of liquid Pt remain relatively invariant
along its melting boundary, up to Earth’s core pressures. Experimental verification of
constant resistivity of Fe along its melting boundary has not yet been obtained.
2.5. Conclusion
High pressure electrical resistivity of Ni is constant along the melting curve. The
electrical resistivity behaviour of Ni at melting (as a close analogue to Fe) disagrees with
Stacey and Loper (2007) conclusion that such behaviour can only be applicable to simple
liquid metals. Furthermore, the results presented here are consistent with conclusions of
the recent experimental studies on Pt (McWilliams et al., 2015). The nature of such
electrical resistivity behaviour in liquid Ni is attributed to the possibility of a constant
Fermi surface and an invariant electron mean free path in the initial Ni melt. This may be
associated with local symmetry structures observed in molten transition metals with
unfilled d-band which has been shown to be responsible for the shallow melting curves.
Based on the arguments presented and supportive evidence in the literature, it is proposed
that the same electrical resistivity behaviour as observed in liquid Ni will be observed in
other liquid transition metals that follow the Kadowaki-Woods ratio. The same argument
predicts that Stacey and Anderson’s (2001) theoretical interpretation will not be
applicable to some liquid simple metals with a filled d-band, such as Cu. With respect to
our results on Ni and their implications for the behaviour of electrical resistivity of Fe
and its alloys in Earth’ s outer core, it is premature to make any predictions other than to
highlight the similarity between Ni and Fe electronic structure and behaviour.
Experimental resistivity data of the major core component, Fe, and its alloys along the
melting boundary are needed and if shown to be constant, this could have important
implications for heat flow in Earth’s core.

44
References
Al'tshuler, L., A. Bakahova, and I. Dudoladov (1968), Effect of electron structure on the
compressibility of metals at high pressure, Soviet Physics JETP, 26(6), 1115-
1120.
Anderson, W. W., and T. J. Ahrens (1994), An equation of state for liquid iron and
implications for the Earth's core, Journal of Geophysical Research: Solid Earth,
99(B3), 4273-4284, doi:10.1029/93JB03158.
Baria, J. (2004), Unified study of electrical resistivity of simple and non-simple liquid
metals, Brazilian journal of physics, 34(3B), 1185-1188, doi:10.1590/S0103-
97332004000600008
Barnard, R. D. (1972), Thermoelectricity in metals and alloys, 259 pp., Halsted Press,
New York.
Baum, B., P. Gel'd, and G. Tyagunov (1967), Resistivity of ferrosilicon alloys in the
temperature range 800–1700 C, The Physics of Metals and Metallography, 24,
181.
Bevington, P. R., and D. K. Robinson (2003), Data reduction and error analysis,
McGraw-Hill., New York, pp. 336.
Biggin, A. J., M. J. de Wit, C. G. Langereis, T. E. Zegers, S. Voûte, M. J. Dekkers, and
K. Drost (2011), Palaeomagnetism of Archaean rocks of the Onverwacht Group,
Barberton Greenstone Belt (southern Africa): Evidence for a stable and
potentially reversing geomagnetic field at ca. 3.5 Ga, Earth and Planetary Science
Letters, 302(3–4), 314-328, doi:10.1016/j.epsl.2010.12.024.
Blatt, F. J., P. A. Schroeder, C. L. Foiles, and D. Greig (1976), Thermoelectric power of
metals, 264 pp., Springer Science and Business Media, New York.
Bloch, D., and R. Pauthenet (1965), Magnetic Properties under Pressure of Some
Transition Metal Alloys, Journal of Applied Physics, 36(3), 1229-1231,
doi:10.1063/1.1714181.
Boye, S. A., P. Lazor, and R. Ahuja (2005), Magnetoresistance and Hall effect
measurements of Ni to 6 GPa, Journal of Magnetism and Magnetic Materials,
294(3), 347-358, doi:10.1016/j.jmmm.2004.12.031.
Bridgman, P. W. (1952), The Resistance of 72 Elements, Alloys and Compounds to
100,000 kg/cm2, Proceedings of the American Academy of Arts and Sciences,
81(4), 165-251, doi:10.2307/20023677.

45
Busch, G., H.-J. Güntherodt, H. Künzi, H. Meier, L. Schlapbach, and J. Keller (1974),
Electronic structure of liquid transition and rare-earth metals and their alloys, Le
Journal de Physique Colloques, 35(C4), C4-329-C324-336,
doi:10.1051/jphyscol:1974463.
Busch, G., and H. J. Güntherodt (1974), Electronic Properties of Liquid Metals and
Alloys, in Solid State Physics, edited by F. S. Henry Ehrenreich and T. David, pp.
235-313, Academic Press, doi:10.1016/S0081-1947(08)60426-9.
Calandra, M., and O. Gunnarsson (2002), Electrical resistivity at large temperatures:
Saturation and lack thereof, Physical Review B, 66(20), 205105,
doi:10.1103/PhysRevB.66.205105.
Cao, Q.-L., P.-P. Wang, D.-H. Huang, J.-S. Yang, M.-J. Wan, and F.-H. Wang (2015),
Properties of Liquid Nickel along Melting Lines under High Pressure, Chinese
Physics Letters, 32(8), 086201, doi:10.1088/0256-307X/32/8/086201.
Cezairliyan, A., and A. P. Miiller (1983), Heat capacity and electrical resistivity of nickel
in the range 1300–1700 K measured with a pulse heating technique, International
Journal of Thermophysics, 4(4), 389-396, doi:10.1007/BF01178788.
Chien, C. L., and C. R. Westgate (1980), The Hall effect and its applications, Plenum
Press, New York, pp. 550.
Chu, T. K., and T. C. Chi (1981), Properties of Selected Ferrous Alloying Elements, Vol.
III-1, 269 pp., McGraw-Hill, Washington.
Crawley, A. F. (1974), Densities of Liquid Metals and Alloys, International
Metallurgical Reviews, 19(1), 32-48, doi:10.1179/imtlr.1974.19.1.32.
Davies, C., M. Pozzo, D. Gubbins, and D. Alfe (2015), Constraints from material
properties on the dynamics and evolution of Earth[rsquor]s core, Nature Geosci,
8(9), 678-685, doi:10.1038/ngeo2492.
de Koker, N., G. Steinle-Neumann, and V. Vlček (2012), Electrical resistivity and
thermal conductivity of liquid Fe alloys at high P and T, and heat flux in Earth’s
core, Proceedings of the National Academy of Sciences, 109(11), 4070-4073,
doi:10.1073/pnas.1111841109.
Decker, D. L., and W. Chen (1992), High-precision measurement of electrical resistivity
of nickel near the ferromagnetic phase transition at high pressure, Physical
Review B, 46(13), 8237-8243, doi:10.1103/PhysRevB.46.8237.
Degtyareva, V. F. (2006), Simple metals at high pressures: the Fermi sphere–Brillouin
zone interaction model, Physics-Uspekhi, 49(4), 369,
doi:10.1070/PU2006v049n04ABEH005948.

46
Desai, P., T. Chu, H. M. James, and C. Ho (1984), Electrical resistivity of selected
elements, Journal of physical and chemical reference data, 13(4), 1069-1096,
doi:10.1063/1.555723.
Dobson, D. (2016), Geophysics: Earth's core problem. Nature, 534(7605), 45-45, doi:
10.1038/534045a.
Dose, V., R. Drube, and A. Härtl (1986), Empty electronic states in solid and liquid
nickel, Solid State Communications, 57(4), 273-275, doi:10.1016/0038-
1098(86)90156-0.
Driscoll, P. E. (2016), Simulating 2 Ga of geodynamo history, Geophysical Research
Letters, 43(11), 5680-5687, doi:10.1002/2016GL068858.
Drotning, W. (1981), Thermal Expansion of Iron, Cobalt, Nickel, and Copper at
Temperatures up to 600 deg K Above Melting, High Temp. High Pressures,
13(4), 441-458.
Dupuy, J., and A. J. Dianoux (1978), Microscopic structure and dynamics of liquids,
Plenum Press, New York, doi:10.1007/978-1-4684-0859-1.
Errandonea, D. (2013), High-pressure melting curves of the transition metals Cu, Ni, Pd,
and Pt, Physical Review B, 87(5), 054108, doi:10.1103/PhysRevB.87.054108.
Errandonea, D., B. Schwager, R. Ditz, C. Gessmann, R. Boehler, and M. Ross (2001),
Systematics of transition-metal melting, Physical Review B, 63(13), 132104,
doi:10.1103/PhysRevB.63.132104.
Evans, R. (1978), Electronic Theory of the Thermodynamics and Structure of Liquid
Metals, in Microscopic Structure and Dynamics of Liquids, edited by J. Dupuy
and A. J. Dianoux, pp. 153-219, Springer US, Boston, MA, doi:10.1007/978-1-
4684-0859-1_4.
Evans, R., and A. Jain (1972), Calculations of electrical transport properties of liquid
metals at high pressures, Physics of the Earth and Planetary Interiors, 6(1-3),
141-145, doi:10.1016/0031-9201(72)90046-5.
Ezenwa, I. C. and R. A. Secco, (2017), Invariant Electrical Resistivity of Co along the
Melting Boundary, Earth and Planetary Science Letters, in press.
Ezenwa, I. C., R. A. Secco, W. Yong, M. Pozzo and Alfè, D. (2017), Electrical
Resistivity of Solid and Liquid Cu to 5 GPa: Decrease along the Melting
Boundary, Journal of the Physics and Chemistry of Solids, in revision.
Faber, T. E. (1972), Introduction to the theory of liquid metals, Cambridge University
Press, Cambridge.

47
Frost, D. J., B. T. Poe, R. G. Trønnes, C. Liebske, A. Duba, and D. C. Rubie (2004), A
new large-volume multianvil system, Physics of the Earth and Planetary
Interiors, 143–144, 507-514, doi:10.1016/j.pepi.2004.03.003.
Fujiwara, T. (1979), Electronic states and transport in amorphous and liquid transition
metals; Fe, Co and Ni, Journal of Physics F: Metal Physics, 9(10), 2011,
doi:10.1088/0305-4608/9/10/011.
Gaidukov, Y. P., and E. Itskevich (1964), Effect of Pressure on the Fermi Surfaces of
Zinc and Cadmium, Soviet Physics JETP, 18(1), 51-58.
Gapotchenko, A., E. Itskevich, and E. Kulatov (1988), Fermi Surface of Magnetic
Transition Metals Under Pressure, in The Magnetic and Electron Structures of
Transition Metals and Alloys, edited by V. G. Veselago and L. I. Vinokurova, pp.
137-163, Nova Publishers.
Gomi, H., K. Hirose, H. Akai, and Y. Fei (2016), Electrical resistivity of substitutionally
disordered hcp Fe–Si and Fe–Ni alloys: Chemically-induced resistivity saturation
in the Earth's core, Earth and Planetary Science Letters, 451, 51-61,
doi:10.1016/j.epsl.2016.07.011.
Gomi, H., K. Ohta, K. Hirose, S. Labrosse, R. Caracas, M. J. Verstraete, and J. W.
Hernlund (2013), The high conductivity of iron and thermal evolution of the
Earth’s core, Physics of the Earth and Planetary Interiors, 224, 88-103,
doi:10.1016/j.pepi.2013.07.010.
Gubbins, D., D. Alfè, C. Davies, and M. Pozzo (2015), On core convection and the
geodynamo: Effects of high electrical and thermal conductivity, Physics of the
Earth and Planetary Interiors, 247, 56-64, doi:10.1016/j.pepi.2015.04.002.
Güntherodt, H. J., E. Hauser, H. U. Künzi, and R. Müller (1975), The electrical resistivity
of liquid Fe, Co, Ni and Pd, Physics Letters A, 54(4), 291-292, doi:10.1016/0375-
9601(75)90263-7.
Hixson, R. S., M. A. Winkler, and M. L. Hodgdon (1990), Sound speed and
thermophysical properties of liquid iron and nickel, Physical Review B, 42(10),
6485-6491, doi:10.1103/PhysRevB.42.6485.
Ho, C. Y., R. W. Powell, and P. E. Liley (1972), Thermal Conductivity of the Elements,
Journal of Physical and Chemical Reference Data, 1(2), 279-421,
doi:10.1063/1.3253100.
Iida, T., and R. I. Guthrie (2015), The Thermophysical Properties of Metallic Liquids:
Volume 1: Fundamentals, 296 pp., Oxford University Press.
Itami, T. (1995), Condensed matter–liquid transition metals and alloys, in Condensed
Matter Disordered Solids, edited, pp. 123-250, World Scientific Publishing Co.,
doi:10.1142/9789812831576_0003

48
Ivanov, V. V., S. V. Lebedev, and A. I. Savvatimskii (1984), Thermal expansion of liquid
Al, Cu, Mo, Ta and W, Journal of Physics F: Metal Physics, 14(7), 1641-1650,
doi:10.1088/0305-4608/14/7/013.
Jacko, A. C., J. O. Fjaerestad, and B. J. Powell (2009), A unified explanation of the
Kadowaki-Woods ratio in strongly correlated metals, Nat Phys, 5(6), 422-425,
doi:10.1038/nphys1249.
Jakse, N., J. F. Wax, J. L. Bretonnet, and A. Pasturel (1996), Structure and
thermodynamics of the 3d-transition metals in the liquid state, Journal of Non-
Crystalline Solids, 205, 434-437, doi:10.1016/S0022-3093(96)00255-4.
Jan, J. P. (1968), The effect of a change in lattice parameter on the Fermi surface of the
monovalent noble metals, Journal of Physics and Chemistry of Solids, 29(4), 561-
564, doi:10.1016/0022-3697(68)90022-X.
Jank, W., C. Hausleitner, and J. Hafner (1991), Electronic structure of the liquid 3d and
4d transition metals, Journal of Physics: Condensed Matter, 3(24), 4477,
doi:10.1088/0953-8984/3/24/016.
Japel, S., B. Schwager, R. Boehler, and M. Ross (2005), Melting of Copper and Nickel at
High Pressure: The Role of $d$ Electrons, Physical Review Letters, 95(16),
167801, doi:10.1103/PhysRevLett.95.167801.
Kadowaki, K., and S. B. Woods (1986), Universal relationship of the resistivity and
specific heat in heavy-Fermion compounds, Solid State Communications, 58(8),
507-509, doi:10.1016/0038-1098(86)90785-4.
Khanna, S. N., and F. Cyrot-Lackmann (1978), Density of electronic states in liquid Ni,
Philosophical Magazine Part B, 38(2), 197-203,
doi:10.1080/13642817808245676.
Kita, Y., S. Ohguchi, and Z.-i. Morita (1978), Measurement of Electrical Resistivity of
Molten Iron, Cobalt, and Nickel by Improved Four-Probe Method, Tetsu-to-
Hagane, 64(6), 711-719.
Konôpková, Z., R. S. McWilliams, N. Gómez-Pérez, and A. F. Goncharov (2016), Direct
measurement of thermal conductivity in solid iron at planetary core conditions,
Nature, 534(7605), 99-101, doi:10.1038/nature18009.
Kreutz, T. J., T. Greber, P. Aebi, and J. Osterwalder (1998), Temperature-dependent
electronic structure of nickel metal, Physical Review B, 58(3), 1300-1317,
doi:10.1103/PhysRevB.58.1300.
Künzi, H. U., and H. J. Güntherodt (1980), Hall Effect in Liquid Metals: Experimental
Results, in The Hall Effect and Its Applications, edited by C. L. Chien and C. R.
Westgate, pp. 215-252, Springer US, Boston, MA, doi:10.1007/978-1-4757-1367-
1_7.

49
Labrosse, S. (2003), Thermal and magnetic evolution of the Earth’s core, Physics of the
Earth and Planetary Interiors, 140(1–3), 127-143,
doi:10.1016/j.pepi.2003.07.006.
Labrosse, S., and M. Macouin (2003), The inner core and the geodynamo, Comptes
Rendus Geoscience, 335(1), 37-50, doi:10.1016/S1631-0713(03)00013-0.
Labrosse, S., J.-P. Poirier, and J.-L. Le Mouël (2001), The age of the inner core, Earth
and Planetary Science Letters, 190(3–4), 111-123, doi:10.1016/S0012-
821X(01)00387-9.
Laubitz, M. J., T. Matsumura, and P. J. Kelly (1976), Transport properties of the
ferromagnetic metals. II. Nickel, Canadian Journal of Physics, 54(1), 92-102,
doi:10.1139/p76-011.
Lazor, P., G. Shen, and S. K. Saxena (1993), Laser-heated diamond anvil cell
experiments at high pressure: Melting curve of nickel up to 700 kbar, Physics and
Chemistry of Minerals, 20(2), 86-90, doi:10.1007/BF00207200.
Lee, G. W., A. K. Gangopadhyay, K. F. Kelton, R. W. Hyers, T. J. Rathz, J. R. Rogers,
and D. S. Robinson (2004), Difference in Icosahedral Short-Range Order in Early
and Late Transition Metal Liquids, Physical Review Letters, 93(3), 037802,
doi:10.1103/PhysRevLett.93.037802.
Leger, J. M., C. Loriers-Susse, and B. Vodar (1972), Pressure Effect on the Curie
Temperatures of Transition Metals and Alloys, Physical Review B, 6(11), 4250-
4261, doi:10.1103/PhysRevB.6.4250.
Leinenweber, K. D., J. A. Tyburczy, T. G. Sharp, E. Soignard, T. Diedrich, W. B.
Petuskey, Y. Wang, and J. L. Mosenfelder (2012), Cell assemblies for
reproducible multi-anvil experiments (the COMPRES assemblies), American
Mineralogist, 97(2-3), 353, doi:10.2138/am.2012.3844.
Lin, J.-F., D. L. Heinz, A. J. Campbell, J. M. Devine, W. L. Mao, and G. Shen (2002),
Iron-Nickel alloy in the Earth's core, Geophysical Research Letters, 29(10), 109-
101-109-103, doi:10.1029/2002GL015089.
Luo, F., X.-R. Chen, L.-C. Cai, and G.-F. Ji (2010), Solid−Liquid Interfacial Energy and
Melting Properties of Nickel under Pressure from Molecular Dynamics, Journal
of Chemical and Engineering Data, 55(11), 5149-5155, doi:10.1021/je1007058.
Martorell, B., J. Brodholt, I. G. Wood, and L. Vočadlo (2013), The effect of nickel on the
properties of iron at the conditions of Earth's inner core: Ab initio calculations of
seismic wave velocities of Fe–Ni alloys, Earth and Planetary Science Letters,
365, 143-151, doi:10.1016/j.epsl.2013.01.007.

50
Matthiessen, A., and C. Vogt (1864), Ueber den Einfluss der Temperatur auf die
elektrische Leitungsfähigkeit der Legirungen, Annalen der Physik, 198(5), 19-78,
doi:10.1002/andp.18641980504.
McDonough, W. F., and S. s. Sun (1995), The composition of the Earth, Chemical
Geology, 120(3), 223-253, doi:10.1016/0009-2541(94)00140-4.
McLachlan, D., and E. G. Ehlers (1971), Effect of pressure on the melting temperature of
metals, Journal of Geophysical Research, 76(11), 2780-2789,
doi:10.1029/JB076i011p02780.
McWilliams, R. S., Z. Konôpková, and A. F. Goncharov (2015), A flash heating method
for measuring thermal conductivity at high pressure and temperature: Application
to Pt, Physics of the Earth and Planetary Interiors, 247, 17-26,
doi:10.1016/j.pepi.2015.06.002.
Meyer, A., M. J. Stott, and W. H. Young (1976), Densities of electronic states in liquid
transition metals, Philosophical Magazine, 33(2), 381-385,
doi:10.1080/00318087608225784.
Mott, N., F. (1980), Liquid and Amorphous Metals, J. Phys. Colloques, 41(C8), C8-1-
C8-7.
Mott, N. F. (1964), Electrons in transition metals, Advances in Physics, 13(51), 325-422,
doi:10.1080/00018736400101041.
Mott, N. F. (1972), The electrical resistivity of liquid transition metals, Philosophical
Magazine, 26(6), 1249-1261, doi:10.1080/14786437208220339.
Nasch, P. M., and S. G. Steinemann (1995), Density and Thermal Expansion of Molten
Manganese, Iron, Nickel, Copper, Aluminum and Tin by Means of the Gamma-
Ray Attenuation Technique, Physics and Chemistry of Liquids, 29(1), 43-58,
doi:10.1080/00319109508030263.
Natanzon, Y. V., V. P. Titov, and R. V. Antonchenko (1992), Solubility and kinetics of
solution of tungsten in liquid nickel at 1525°C, Soviet Powder Metallurgy and
Metal Ceramics, 31(2), 161-165, doi:10.1007/BF00794054.
Nimmo, F. (2007), Thermal and compositional evolution of the core, in Core Dynamics,
Treatise on Geophysics, edited by G. Schubert, pp. 217-241, Elsevier, UK.
Nimmo, F. (2015), Thermal and compositional evolution of the core, in Core Dynamics,
Treatise on Geophysics, edited by G. Schubert, pp. 201-219, Elsevier, UK.
Nix, F. C., and D. MacNair (1941), The Thermal Expansion of Pure Metals: Copper,
Gold, Aluminum, Nickel, and Iron, Physical Review, 60(8), 597-605,
doi:10.1103/PhysRev.60.597.

51
Ohta, K., Y. Kuwayama, K. Hirose, K. Shimizu, and Y. Ohishi (2016), Experimental
determination of the electrical resistivity of iron at Earth’s core conditions,
Nature, 534(7605), 95-98, doi:10.1038/nature17957.
Okamoto, H. (2012), Ni-Re (Nickel-Rhenium), Journal of Phase Equilibria and
Diffusion, 33(4), 346-346, doi:10.1007/s11669-012-0053-9.
Olson, P. (2013), The New Core Paradox, Science, 342(6157), 431-432,
doi:10.1126/science.1243477.
Olson, P. (2016), Mantle control of the geodynamo: Consequences of top-down
regulation, Geochemistry, Geophysics, Geosystems, 17(5), 1935-1956,
doi:10.1002/2016GC006334.
Poirier, J.-P. (1994), Light elements in the Earth's outer core: A critical review, Physics of
the Earth and Planetary Interiors, 85(3), 319-337, doi:10.1016/0031-
9201(94)90120-1.
Powell, R.W., 1953. The electrical resistivity of liquid iron, The London, Edinburgh, and
Dublin
Philosophical Magazine and Journal of Science, 44(354), 772-775.
Powell, R. W., R. P. Tye, and M. J. Woodman (1963), The thermal conductivity and
electrical resistivity of rhenium, Journal of the Less Common Metals, 5(1), 49-56,
doi:10.1016/0022-5088(63)90043-2.
Pozzo, M., and Alfè, D. (2013), Melting curve of face-centered-cubic nickel from first-
principles calculations. Physical Review B, 88(2), 024111, doi:
10.1103/PhysRevB.88.024111.
Pozzo, M., C. Davies, D. Gubbins, and D. Alfè (2012), Thermal and electrical
conductivity of iron at Earth's core conditions, Nature, 485(7398), 355-358,
doi:10.1038/nature11031.
Pozzo, M., C. Davies, D. Gubbins, and D. Alfè (2013), Transport properties for liquid
silicon-oxygen-iron mixtures at Earth's core conditions, Physical Review B, 87(1),
014110, doi:10.1103/PhysRevB.87.014110.
Pozzo, M., Davies, C., Gubbins, D., Alfè, D. (2014), Thermal and electrical conductivity
of solid iron and iron-silicon mixtures at Earth’s core conditions, Earth and
Planetary Science Letters, 393:159–164, doi: 10.1016/j.epsl.2014.02.047.
Pu, F. (1991), Electron transfer and electrical resistance of nickel under high pressure up
to 42 GPa, Physics Letters A, 157(2), 151-154, doi:10.1016/0375-9601(91)90089-
Q.

52
Rice, M. J. (1968), Electron-Electron Scattering in Transition Metals, Physical Review
Letters, 20(25), 1439-1441, doi:10.1103/PhysRevLett.20.1439.
Ross, M., R. Boehler, and D. Errandonea (2007), Melting of transition metals at high
pressure and the influence of liquid frustration: The late metals Cu, Ni, and Fe,
Physical Review B, 76(18), 184117, doi:10.1103/PhysRevB.76.184117.
Sanloup, C., F. Guyot, P. Gillet, and Y. Fei (2002), Physical properties of liquid Fe alloys
at high pressure and their bearings on the nature of metallic planetary cores,
Journal of Geophysical Research: Solid Earth, 107(B11), ECV 4-1-ECV 4-9,
doi:10.1029/2001JB000808.
Sanloup, C., F. Guyot, P. Gillet, G. Fiquet, R. J. Hemley, M. Mezouar, and I. Martinez
(2000), Structural changes in liquid Fe at high pressures and high temperatures
from Synchrotron X-ray Diffraction, EPL (Europhysics Letters), 52(2), 151-157,
doi:10.1209/epl/i2000-00417-3.
Schenk, T., D. Holland-Moritz, V. Simonet, R. Bellissent, and D. M. Herlach (2002),
Icosahedral Short-Range Order in Deeply Undercooled Metallic Melts, Physical
Review Letters, 89(7), 075507, doi:10.1103/PhysRevLett.89.075507.
Secco, R. A. (2017), Thermal Conductivity and Seebeck Coefficient of Fe and Fe-Si
Alloys: Implications for Variable Lorenz Number, Physics of the Earth and
Planetary Interiors, doi:10.1016/j.pepi.2017.01.005.
Secco, R. A., and H. H. Schloessin (1989), The electrical resistivity of solid and liquid Fe
at pressures up to 7 GPa, Journal of Geophysical Research: Solid Earth, 94(B5),
5887-5894, doi:10.1029/JB094iB05p05887.
Secco, R. A., and W. Yong (2012), New 3000 Ton Large Volume Multi-Anvil Apparatus
Installed at the University of Western Ontario, abs. American Geophysical
Union, Fall Meeting 2012.
Secco, R. A., and Yong, W. (2016). Low temperature system for a large volume multi-
anvil press. Review of Scientific Instruments, 87(12), 123901-4.
Secco, R. A., and Sukara, R. E. (2016). Indoor Microgravity Survey. The Physics
Teacher, 54(4), 213-215.
Seydel, U., and W. Fucke (1977), Sub-Microsecond Pulse Heating Measurements of
High Temperature Electrical Resistivity of the 3d-Transition Metals Fe, Co, and
Ni, Zeitschrift für Naturforschung A, 32(9), 994, doi:10.1515/zna-1977-0913.
Shatskiy, A., T. Katsura, K. D. Litasov, A. V. Shcherbakova, Y. M. Borzdov, D.
Yamazaki, A. Yoneda, E. Ohtani, and E. Ito (2011), High pressure generation
using scaled-up Kawai-cell, Physics of the Earth and Planetary Interiors, 189(1–
2), 92-108, doi:10.1016/j.pepi.2011.08.001.

53
Shen, G., V. B. Prakapenka, M. L. Rivers, and S. R. Sutton (2004), Structure of Liquid
Iron at Pressures up to 58 GPa, Physical Review Letters, 92(18), 185701,
doi:10.1103/PhysRevLett.92.185701.
Shimoji, M. (1977), Liquid metals, Academic Press, London, pp. 402.
Shvets, V. T. (1982), Influence of s-d hybridization of the electrical conductivity of liquid
transition metals, Theoretical and Mathematical Physics, 53(1), 1040-1046,
doi:10.1007/BF01014802.
Springford, M. (1980), Electrons at the Fermi surface, Cambridge University Press, New
York, pp. 558.
Stacey, F. D., and O. L. Anderson (2001), Electrical and thermal conductivities of Fe–
Ni–Si alloy under core conditions, Physics of the Earth and Planetary Interiors,
124(3–4), 153-162, doi:10.1016/S0031-9201(01)00186-8.
Stacey, F. D., and D. E. Loper (2007), A revised estimate of the conductivity of iron alloy
at high pressure and implications for the core energy balance, Physics of the Earth
and Planetary Interiors, 161(1–2), 13-18, doi:10.1016/j.pepi.2006.12.001.
Steinemann, S., and N. Keita (1988), Compressibility and internal pressure anomalies of
liquid 3d transition metals, Helvetica Physica Acta, 61(4), 557-565,
doi:10.5169/seals-115960.
Stevenson, D. J. (2003), Planetary magnetic fields, Earth and Planetary Science Letters,
208(1–2), 1-11, doi:10.1016/S0012-821X(02)01126-3.
Strong, H. M., and F. P. Bundy (1959), Fusion Curves of Four Group VIII Metals to 100
000 Atmospheres, Physical Review, 115(2), 278-284,
doi:10.1103/PhysRev.115.278.
Sundqvist, B. (1988), Electrical resistance of nickel in the range 300-725 K and 0-2 GPa,
Physical Review B, 38(17), 12283-12289, doi:10.1103/PhysRevB.38.12283.
Tarduno, J. A., R. D. Cottrell, W. J. Davis, F. Nimmo, and R. K. Bono (2015), A Hadean
to Paleoarchean geodynamo recorded by single zircon crystals, Science,
349(6247), 521-524, doi:10.1126/science.aaa9114.
Tarduno, J. A., R. D. Cottrell, M. K. Watkeys, A. Hofmann, P. V. Doubrovine, E. E.
Mamajek, D. Liu, D. G. Sibeck, L. P. Neukirch, and Y. Usui (2010), Geodynamo,
Solar Wind, and Magnetopause 3.4 to 3.45 Billion Years Ago, Science,
327(5970), 1238-1240, doi:10.1126/science.1183445.
Tateno, S., K. Hirose, T. Komabayashi, H. Ozawa, and Y. Ohishi (2012), The structure of
Fe-Ni alloy in Earth's inner core, Geophysical Research Letters, 39(12), n/a-n/a,
doi:10.1029/2012GL052103.

54
Terasaki, H., T. Kato, S. Urakawa, K. Funakoshi, K. Sato, A. Suzuki, and T. Okada
(2002), Viscosity change and structural transition of Molten Fe at 5 GPa,
Geophysical Research Letters, 29(8), 68-61-68-63, doi:10.1029/2001GL014321.
Thakor, P. B., Y. A. Sonvane, and A. R. Jani (2009), Electronic transport properties of
some transition liquid metals, Physics and Chemistry of Liquids, 47(6), 653-662,
doi:10.1080/00319100903046120.
van Zytveld, J., B. (1980), Electrical resistivities of liquid transition metals, J. Phys.
Colloques, 41(C8), C8-503-C508-506, doi:10.1051/jphyscol:19808126.
Venttsel, V., O. Voronov, A. Likhter, and A. Rudnev (1973), Effect of pressure on the
Fermi surface of zinc, Zhurnal Eksperimentalnoi i Teoreticheskoi Fiziki, 65(6),
2445-2454.
Vinokurova, L., A. Gapotchenko, E. Itskevich, E. Kulatov, and N. Kulikov (1979), Effect
of pressure on the electron-structure of ferromagnetic nickel and iron, Zhurnal
Eksperimentalnoi i Teoreticheskoi Fiziki, 76(5), 1644-1654.
Waseda, Y., and S. Tamaki (1975), The structures of 3d-transition metals in the liquid
state, Philosophical Magazine, 32(2), 273-281, doi:10.1080/14786437508219953.
Watson, H. C., E. B. Watson, and Y. Fei (2008), Diffusion of Au, Pd, Re, and P in FeNi
alloys at High Pressure, Geochimica et Cosmochimica Acta, 72(14), 3550-3561,
doi:10.1016/j.gca.2008.04.034.
Williams, G. P., and C. Norris (1974), The density of states of liquid copper, Journal of
Physics F: Metal Physics, 4(8), L175, doi:10.1088/0305-4608/4/8/001.
Yokoyama, I., I. Ohkoshi, and T. Satoh (1983), Thermodynamic properties of liquid Fe,
Co and Ni based on the Percus-Yevick phonon description, Journal of Physics F:
Metal Physics, 13(4), 729, doi:10.1088/0305-4608/13/4/008.
Yousuf, M., P. C. Sahu, and K. G. Rajan (1986), High-pressure and high-temperature
electrical resistivity of ferromagnetic transition metals: Nickel and iron, Physical
Review B, 34(11), 8086-8100, doi:10.1103/PhysRevB.34.8086.
Ziman, J. M. (1961), A theory of the electrical properties of liquid metals. I: The
monovalent metals, Philosophical Magazine, 6(68), 1013-1034,
doi:10.1080/14786436108243361.
Zinov'ev, V. E., S. H. S. H. Abel'skii, M. I. Sandakova, L. N. Petrova, and P. V. Gel'd
(1972), Matthiessen's rule and the electric resistance of solid solutions of silicon
in iron at high temperatures, Zhurnal Eksperimental'noi i Teoreticheskoi Fiziki,
63, 2221-2225.

55
Chapter 3
3. Electrical resistivity of liquid Fe to 12 GPa: Implications for
heat flow in cores of terrestrial bodies
Today's scientists have substituted mathematics for experiments, and they wander off
through equation after equation, and eventually build a structure which has no relation
to reality.
- Nikola Tesla
A version of this chapter has been published under the Creative Commons license as:
Silber, R. E., Secco, R. A., Yong, W. and Littleton, J. (2018) Electrical resistivity of
liquid Fe to 12 GPa: Implications for heat flow in cores of terrestrial bodies, Nature
Scientific Reports, 8, 10758, doi: 10.1038/s41598-018-28921-w
3.1. Introduction
Electrical and thermal transport properties of liquid iron (Fe) control the amount of heat
conducted through the outer core (OC) to the core-mantle boundary (CMB) (de Koker et
al., 2012; Gomi et al., 2013; Goncharov et al., 2015; Konôpková et al., 2016; Ohta et al.,
2016; Pozzo et al., 2012; Stacey and Loper, 2007) in terrestrial planetary bodies.
Experimental evaluation of electrical resistivity (ρ) and thermal conductivity (κ) of liquid
Fe under high pressures (P) is very challenging (Ohta et al., 2016; Shen et al., 2004), and
remains one of the key aspects in rigorously constraining the thermal, spatial and
temporal evolution of terrestrial cores and dynamos Gubbins et al., 2015. Despite recent
advances in high pressure experimental techniques, thus far only two experimental
investigations of ρ of liquid Fe in the lower P region below 7 GPa are reported in
literature (Deng et al., 2013; Secco and Schloessin, 1989).
Recent theoretical (de Koker et al., 2012; Pozzo et al., 2012) and experimental (Gomi et
al., 2013; Ohta et al., 2016) studies present a revised set of low ρ values and

56
corresponding κ values for the Earth’s liquid outer core that are up to 4 times higher than
previously accepted (Stacey and Loper, 2007). Such high values of κ for the outer core,
in the range 90 – 130 Wm-1
K-1
, directly affect estimates of the age of the inner core
(Gubbins et al., 2015), as well as the energy budget available to power and maintain the
geodynamo (Gubbins et al., 2015) for the past 4.2 Ga (Tarduno et al., 2015). However, in
contrast to the low values of ρ and high values of κ in the Earth’s liquid core, the first
direct experimental measurements (Konôpková et al., 2016) of κ of Fe showed κ to be in
line with previously accepted values (Stacey and Loper, 2007). New diamond anvil cell
(DAC) experimental data (Goncharov et al., 2015; Hsieh et al., 2017; Ohta et al., 2017;
Okuda et al., 2017) place constraints on the κ of lower mantle minerals, which
subsequently limits the magnitude of heat flux through the CMB. These experimental
results are complemented by numerical studies (Drchal et al., 2017; Pourovskii et al.,
2017) of Fe at core conditions which demonstrate the important role of electron-electron
scattering and spin disorder. The absence of a consensus on κ and uncertainty in ohmic
losses in the core necessitate a consideration of alternative sources of energy required to
generate the Earth’s magnetic field throughout history (O’Rourke and Stevenson, 2016).
It was recently postulated on the basis of theoretical reasoning that ρ may be invariant for
pure simple liquid metals, but not for liquid transition metals, along their respective
melting curves (Stacey and Loper, 2007). However, new experimental work
demonstrated that transition metals, Ni and Co have invariant ρ along the melting
boundary (Silber et al., 2017; Ezenwa and Secco, 2017). This study is motivated by the
possibility that liquid Fe may exhibit the same melting boundary behavior of ρ as Ni and
Co, and enable better insight into the thermal state and dynamics of experimentally
reachable conditions of cores, particularly at the boundary between the solid inner and
liquid outer cores, particularly at the boundary between the solid inner and liquid outer
cores, of the small terrestrial bodies Mercury, Mars, Moon and Ganymede.

57
3.2. Methods
3.2.1. Instrumentation
We used a large volume 3000 ton multi-anvil press and a 4-wire method, along with
polarity switching to measure electrical resistivity (ρ). The cell design (Figure 3.1) and
the experimental methods are described in detail elsewhere (Silber et al., 2017). The
radial geometry of the liquid Fe sample is preserved by using the high density ceramic
tube in which a highly polished Fe wire is tightly fitted with tolerances less than 0.001
mm. The only notable difference in this work is the use of a W-foil to contain the Fe melt
and preserve the axial geometry of the liquid sample. The advantages of this method
(Silber et al., 2017) are: (i) liquid containment; (ii) preservation of sample geometry
through the full range of P-T experimental conditions; and (iii) delaying the onset of
diffusion and sample contamination, such that the ρ values collected through rapid data
acquisition at the melting temperature are predominantly from the Fe-sample
contribution. The experimental approach to evaluate the effects of W diffusion in liquid
Fe, and detailed compositional analyses by Electron Microprobe (EMP) data and images,
are reported in this section.
Figure 3.1: The high pressure experimental cell design (after Silber et al., 2017).

58
3.2.2. Use of Tungsten (W) Disc
The most optimal way to measure electrical resistivity of molten materials is to maintain
direct contact between the electrodes and the sample. However, such an approach is not
possible in the case of liquid transition metals (Ezenwa and Secco, 2017; Silber et al.,
2017) Ni and Co, and even more so in the case of liquid Fe since most electrode materials
will easily diffuse into these transition metals. In this work we used type C
thermocouples (TC) and diffusion of W and Re from a TC wire junction in direct contact
with the molten Fe sample is unavoidable and would inevitably skew readings of both
voltage drop and temperature. A modified approach (Silber et al., 2017) can be adopted
to postpone the effect of diffusion, data are acquired rapidly. This method relies on use of
W as an intermediary highly conductive material, located between 4-wire
electrode/thermocouple junctions and the sample, enclosed in a high density ceramic tube
(CT) (Figure 3.1). A W-disc emplaced at these positions is also instrumental in
containing molten Fe and maintaining axial geometry. The thickness of W disc is 0.1 mm
and a radius of approximately 3 times that of the sample. Considering that electrical
resistivity of W is half that of the solid Fe sample at 300 K, the overall contribution to
measured ρ is less than 1% with the thickness and length utilized in this work).
Therefore, the measurement of electrical resistivity of the liquid Fe is minimally affected.
Moreover, the choice of W as an intermediary material is influenced by the requirement
that its melting temperature is much higher than the melting temperature of the measured
Fe sample. By using W disc as a contact/containment medium, we preserve the chemical
(and thermoelectric) integrity of the TC/electrode during the initial rapid set of electrical
resistivity measurements that are mainly due to the contribution of the liquid Fe sample.
However, such an approach can only be effective if it can be demonstrated that there is
little or no immediate diffusion of W throughout the sample, at the onset of melting. To
confirm this, we performed electron microprobe (EMP) analyses on our post-
experimental recovered samples that were compressed and heated to temperatures below
melting, to the melting temperature, and to temperatures of 50 K and 188 K above
melting. The heated experimental cell was immediately quenched after reaching the

59
target temperature. Additionally, we used high density, thick walled, ceramic tubes
(Al2O3) to maintain the lateral geometry of the liquid sample.
3.2.3. Electron Microprobe Data
EMP data was collected using a JEOL JXA-8530F field-emission electron microprobe at
the Centre of Planetary Science & Exploration, Western University, London, Ontario,
Canada. For all the analyses in this work, an accelerating voltage of 20 kV, a probe
current of 50 nA, and a spot size (∼100 nm) beam were used. In terms of compositional
analyses, our samples were compared against the pure metal standards (Fe, Ni, W, Re)
and silicate phase references (Si).
EMP results for samples recovered from heating to high temperatures but not melted
showed negligible (<0.4wt%) W diffusion into solid Fe. The EMP results for samples
heated to melting and above are given in Figures 3.2 – 3.7. Figure 3.2 shows sample
compressed to 3 GPa and heated to the melting point. In the energy dispersive X-ray
spectroscopy (EDS) data sets and images shown in Figure 3.2 and 3.3, it can be seen that
at the onset of melting, diffusion of W into the cylindrical ends of the Fe sample takes
place. However, the initial set of voltage drop measurements across the liquid sample is
primarily due to Fe. The corresponding recovered and sectioned sample is shown in the
inset.
In the sample compressed to 7 GPa and heated to 50 K above the melting point (Figures
3.4), the evidence of W diffusion into the Fe sample is clearly visible. However, Fe is still
dominant at 97.16 at%. Figure 3.5 shows wavelength dispersive X-ray spectroscopy
(WDS) analyses (the annotated values of point analyses correspond to the table values)
and the progression of diffusion can be seen. The corresponding optical image of the
same recovered sample is shown in the inset of Figure 3.4.
In a sample heated to a temperature of 188 K above the melting T, W diffusion in liquid
Fe is clearly evident (Figures 3.6 and 3.7). However, it must be emphasized that diffusion
is also sensitive to the amount of time spent in melt. After careful observation, it can be
seen in plots of ρ (see the results section) that the linear positive slope of ρ in liquid Fe

60
starts decreasing after the first 3 – 6 data points in the complete melt. This is interpreted
to be caused by the progression of W diffusion in liquid Fe, which starts to lower ρ. For
all experimental pressures in this work, we observed that the trend line of ρ in the liquid
changes sharply to a negative slope at about the 16 second mark in melt. We note a rapid
decrease in ρ after a duration of 16 seconds in the melt, but these data are not shown here.
A reasonable interpretation is that after approximately 16 seconds (following the onset of
melt), the effect of W in the liquid Fe starts to dominate in the measured electrical
resistivity. This leads to rapid decrease of ρ, observed in liquid at all pressures in this
study. Therefore, in determination of ρ along the melting boundary, we only consider
those first few ρ points in the liquid Fe that exhibit a distinct linear trend.

61
Figure 3.2: A representative example of EMP-EDS of a sample compressed to 3 GPa
and heated to the melting point used in determination of diffusion of W into Fe at
the melting point. The heated experimental cell was immediately quenched after
reaching the target temperature. Surface diffusion along the grain boundaries is
visible; however overall Fe is 99.42 at%. The yellow outlined rectangular are is the
region probed by EDS. Inset: Corresponding image of post-experiment recovered
and sectioned sample.

62
Figure 3.3: Close-up of the region with surface diffusion of W into liquid Fe. The
sample was compressed to 3 GPa and heated to the melting point. The heated
experimental cell was immediately quenched after reaching the target temperature.
The regions are W (or W/Re TCs) and the dark gray metal in the middle is the Fe
sample. The light grey regions at the ends of the sample contain some W.

63
Figure 3.4: Representative EMP-EDS of a sample compressed to 7 GPa and heated
to 50 K over the melting point, and then quenched. The diffusion of W can be seen
throughout the sample which is still dominated on average by Fe (97.16 at%). The
upper part of the sample is less contaminated due to the fact that it was on the
bottom during the experiment, and diffusion is likely uneven because of the
influence of gravity. The rectangular area outlined in yellow is the region probed by
EDS. Inset: The corresponding post-experimentally recovered and sectioned sample.
The image in the inset is rotated 180° relative to the EMP image.

64
Figure 3.5: EMP-WDS of the sample in Figure 3.4. The annotated points on the
sample correspond to the point numbers in the table. The notation “nd” means not
at detectable levels.

65
Figure 3.6: EMP-EDS of the sample compressed to 3 GPa and heated to 188 K
above the melting point. It is possible to see the formation of dendritic structures at
the ends of the sample because the TC wires penetrated the disc and were in touch
with the liquid Fe sample, which enabled diffusion of both W and Re into liquid Fe.
The rectangular area outlined in yellow is the region probed by EDS. Inset:
Magnified dendritic structures in the lower part of the sample.

66
Figure 3.7: The EMP-WDS scan of individual points on the sample in Figure 3.6.
The points and values in the table correspond to the annotated points throughout
the sample.
3.2.4. Determination of Electrical Resistivity Along the Melting Boundary
Figure 3.8 illustrates the procedure of determining ρ of Fe along its melting boundary.
The procedure consists of fitting a linear trend through data points of ρ in the solid and
connecting the last ρ point in the solid with the points in the liquid using a linear trend
through intermediate points between the two phases. The intersection between the linear
fit through the first few ρ points in liquid (with a clear linear trend) and the line through
intermediate points, connecting the solid and liquid phase, is taken to be ρ along the

67
melting boundary. It is interpreted that Fe is fully melted at that point so that the
measured ρ is the resistivity of only the liquid.
Figure 3.8: Illustration showing how the ρ along the melting boundary of Fe and Δρ
(ρliquid – ρsolid) were determined.
3.2.5. Uncertainties and Sectioned Samples Geometry
The errors calculated in this study reflect the standard deviation between the absolute
value of positive and negative polarity voltage readings during data collection, as well as
the uncertainty in length of the sample that arises from volumetric changes at high P and
T including melting, and slight changes in shape of the recovered sample. The uncertainty
in length in the solid phase is 0.01 mm and in the liquid phase 0.05 mm. Overall, the
same methodology in error determination as discussed in detail by Silber et al. (2017) is
followed in this work.

68
For illustrative purposes, Figure 3.9 shows images of representative post-experiment
samples recovered from a range of pressures that were heated deep into liquid to illustrate
the preserved geometry in quenched samples.
Figure 3.9: Representative examples of recovered and sectioned sample cells heated
and compressed to (a) 8 GPa, (b) 9 GPa, (c) 11 GPa and (d) 12 GPa. The maximum
temperatures are stated in the figures. Panels (a) – (c) show 18/11 cell and panel (d)
shows 14/8 cell. A W-disc was employed throughout.

69
3.3. Results
Here, the results of measurements of ρ of solid and liquid Fe (99.99% purity), between 3
and 12 GPa (Figure 3.10) are reported. Representative error bars are shown in Figure
3.11 for 3, 6 and 9 GPa of this study. The measured ρ(P,T) for all experiments are
compared to data from atmospheric and other high pressure studies. Overall, the values of
ρ obtained for solid Fe follow the similar trend observed in measurements at 1atm and in
earlier measurements (Secco and Schloessin, 1989) up to 7 GPa, but diverge significantly
from recent work (Deng et al., 2013) for 5 and 7 GPa (Figure 3.10).
Figure 3.10: Electrical resistivity of solid and liquid Fe at 3 – 12 GPa. Our data
compared with ρ from the earlier results (as shown in the legend), obtained at 1
atm., 5, 5.3, 7 and 26 GPa.

70
Figure 3.11: Electrical resistivity curves at 3, 6 and 9 GPa with representative error
bars and combined with available literature values of ρ obtained at atmospheric
pressure and at 5, 5.3, 7 and 26 GPa. The simultaneous increase in ρ and T in the
melting interval are likely the result of the presence of T-gradients in the cell which
are exacerbated by the rapid rate of heating through melting.
We have not observed the effects of the ε-phase on ρ at 12 GPa, nor did we see any
deviation from the standard α-phase scattering before the Curie T (Tc), suggesting that the
sample did not enter the ε-phase. The electrical resistivity of α-Fe remains invariant as a
function of P up to Tc because of strong magnon scattering and a large Fe magnetic
moment (2.2μB) (Landrum and Dronskowski, 2000). Notably, while Tc (1040 K at 1 atm)
remains constant up to 1.75 GPa (Leger et al., 1972), continuous pressure dependent
decrease in Tc that approximately follows the α-γ boundary was observed. The electrical
resistivity decreases almost linearly above Tc as a function of P in the γ-phase, primarily

71
because the long-range order of spin magnetic moments is lost by the effects of
temperature, and the electron scattering by magnons becomes reduced compared to
temperature-induced phonon scattering, which itself is suppressed by the effects of
pressure. Our results demonstrate, within experimental uncertainties, that ρ of liquid Fe,
along its melting boundary, decreases from 3 to 5 GPa and remains invariant from 6 to 12
GPa. For all experimental P above the δ-γ-liquid triple point at 5.2 GPa, the ρ values of
liquid Fe at melting remain remarkably constant at ~120 μΩcm up to 12 GPa (Figure
3.12a). This value is consistent with recent DAC data (Ohta et al., 2016) for ρ of liquid
Fe at 26 GPa.
In comparison with Ni and Co, the interpretation of ρ of liquid Fe is more complex due to
the polymorphism in solid state before and after the δ-γ-liquid triple point pressure. Such
behavior requires additional consideration. Although not previously reported by
experimental studies to-date, the abrupt and distinct change in ρ of liquid Fe at the δ-γ-
liquid triple point is not unexpected. There is also a significant change observed in other
properties of liquid Fe at this triple point, such as the temperature coefficient of resistivity
(Secco and Schloessin, 1989), structure factor, compressibility, and density (Sanloup et
al., 2000) and viscosity (Terasaki et al., 2002).
3.4. Discussion and Conclusions
3.4.1. Liquid Structure, Liquid Properties and Melting Boundary
Liquid-liquid phase transitions under high pressure are not uncommon in transition
metals (Lee and Lee, 2016). The existence of such a phase transition in liquid Fe around
5 GPa just above the melting boundary, influencing structural changes and many of its
properties, has been considered recently (Sanloup et al., 2000). However, we cannot
interpret the change in our observed ρ of liquid Fe around 5.2 GPa as an equilibrium
liquid-liquid phase transition, as such a transition is thermodynamically not plausible at
the existing triple point. This leads us to support the premise (Secco and Schloessin,
72
1989) that the solid Fe-parent phase has a direct influence on the structure and properties
of the liquid in short and medium range order at temperatures very close to the melting
boundary. The existence of spin scattering similarities between the liquid and solid Fe-
phase (Waseda and Suzuki, 1970) seems to support that. Correspondingly, in-situ high
pressure X-ray scattering study shows that liquid Fe originating from the γ-parent solid
phase remains structurally stable along its melting boundary from 27 to 58 GPa (Shen et
al., 2004). The aforementioned results impose significant constraints on the
thermodynamic and transport properties of liquid Fe (Shen et al., 2004). The conclusions
of that study imply possible P-independent electron mean free (Silber et al., 2017) path
along the Fe melting boundary and may corroborate why our observed constant value of
ρ above 5 GPa for liquid Fe is in line with ρliquid at 26 GPa (Ohta et al., 2016) as shown in
Figure 3.12a. This suggests that such a trend may extend to the ε-γ-liquid triple point.
The structural invariance (Shen et al., 2004) of liquid Fe at high P is consistent with
report that the product of thermal expansivity and isothermal bulk modulus (αKT) for Fe
remains nearly constant at high pressures and temperatures (Wasserman et al., 1996). In
the liquid late transition metals under pressure, Peierls/Jahn-Teller distortion (symmetry-
breaking rearrangements of atomic structures) and s-d electron promotion (Ross et al.,
2007) leads to the existence of highly concentrated stable local structures that maximize
packing density while lowering electronic binding energy. Although this phenomenon is
considered to lower the melting slopes of Fe, Ni and Co, it may also be responsible for
maintaining the constant electron mean free path in the liquid at the onset of melt (Silber
et al., 2017). Indeed, it was found that the packing fraction along the melting curve of Fe
remains nearly constant (Shen et al., 2004). For Ni, electron-electron scattering was
discussed in the context of the Kadowaki-Woods ratio (Silber et al., 2017), which
compares the temperature dependence of ρ to that of heat capacity of a particular metal
(Kadowaki and Woods, 1986). The Kadowaki-Woods ratio indicates the presence of
strong electron-electron scattering in heavy fermions and weaker scattering in a select
group of transition metals (Jacko et al., 2009), including Fe and Ni. This suggests that the
contribution of such scattering to overall ρ is not negligible, especially for liquid Fe at
high pressure (Drchal et al., 2017; Pourovskii et al., 2017).
73
The jump in ρ between the last solid and first liquid (∆ρl-s) decreases linearly from 3 to 5
GPa, and then increases at pressures above the 5 GPa δ-γ-liquid triple point (Figure
3.12b). We have not measured ρ of the ε-phase nor the subsequent ∆ρl-s at corresponding
melting points. However, it can be reasonably expected, based on recent results (Gomi et
al., 2013), that ρ of the ε-phase saturates at high pressures (above 60 GPa). That would
imply that ∆ρl-s from the ε-phase does not increase linearly at high pressures and it likely
tapers off. Consequently, given the apparent effects of the δ-γ-liquid triple point on the P-
dependence of ∆ρl-s, in the absence of experimental results in the liquid above the ε-γ-
liquid triple point P, it is not reasonable to speculate on the precise value of ρ in Earth’s
OC and at the ICB. However, we do not expect that ρ of liquid Fe, originating from a
parent ε-phase, would be considerably different from the value of approximately 120
μΩcm, obtained for liquid Fe between 6 and 12 GPa in this study and corroborated by a
similar value measured (Ohta et al., 2016) at 26 GPa. Nevertheless, the increasing
magnitude of ∆ρl-s (Figure 3.12b) implies that caution needs to be exercised in terms of
estimating ρ of liquid Fe obtained from solid phase measurement and extrapolated to core
conditions.

74
Figure 3.12: Electrical resistivity of Fe along the melting boundary and the change
in resistivity from solid to liquid. (a) ρ at the first melt for pressures 3 – 12 GPa,
compared to the earlier results (as shown in the legend) obtained at 1 atm, 2.5, 3.8,
5.3 and 26 GPa. (b) The change in ρ on melting demonstrating an abrupt change at
5 GPa. The triple point (Strong et al., 1973) pressure is indicated by the arrow.

75
The melting curve (Tm) determined by the jump in ρ during the solid-liquid phase
transition is compared to available values in the literature (Figure 3.13). The Tm values
obtained in this work agree well with one study (Strong, 1959) and are below the values
compared to the other two (Strong et al., 1973; Liu and Bassett, 1975). However, there
are no other literature data available for the low P melting curve of Fe, thus making the
extent of uncertainties due to the choice of experimental set up in previous studies
(Strong et al., 1973; Liu and Bassett, 1975) unclear, when compared with our values. It is
important to note that the sensitivity of our measurements had sufficiently high resolution
to detect the change in slope of the δ-liquid and γ-liquid parts of the melting curve at the
δ-γ-liquid triple point, as thermodynamics requires.
Figure 3.13: Melting curve of Fe from 3 to 12 GPa. The melting results, as inferred
from ρ measurement, are compared with other studies. The triple point (Strong et
al., 1973) pressure is indicated by the arrow.

76
3.4.2. Thermal Conductivity and Heat Flow in the Cores of Terrestrial Bodies
The findings have direct implications for constraining electrical and thermal transport
properties in the cores of terrestrial bodies made of Fe. Mercury has both a solid inner
and liquid outer core which generates a weak dynamo (Dumberry and Rivoldini, 2015).
Pressure in the center of Mercury’s solid γ-Fe inner core is about 36 GPa and the
temperature is in the range (Dumberry and Rivoldini, 2015) 2200 – 2500 K. The
pressures at the top of its liquid outer core, near the CMB range from approximately 5 to
8 GPa and temperature estimates (Hauck et al., 2013) are between 1850 – 2200 K. If we
assume a linear decrease of ρ of solid γ-Fe phase just before melting (Figure 3.14), we
obtain a value for ρ of 87 ± 10 μΩcm for an Fe core at the center of the planet. The
electronic component of thermal conductivity (ke) is inversely proportional to ρ and can
be calculated from the Wiedemann-Franz law, 𝑘𝑒 =𝐿𝑇
𝜌, using for the Lorenz number, L,
the Sommerfeld value of Lorenz number, L0 = 2.44 × 10⁻⁸
WΩ/K2
, which has been
shown to be a reasonably valid approximation (Secco, 2017) for Fe at Mercury’s core, as
well as to much higher (de Koker et al., 2012; Pozzo et al., 2013), P and T. For Mercury’s
solid core temperatures, the values of thermal conductivity of 62 – 70 Wm-1
K-1
are
obtained. At the top of a pure liquid Fe outer core, the value of κe is calculated to be 41 ±
4 Wm-1
K-1
. The range of thermal conductivity calculated in this study stems from the
range of values used for temperatures of Mercury’s CMB. The calculated value of
thermal conductivity of 41 ± 4 Wm-1
K-1
, using the measured value of electrical resistivity
of liquid Fe at 5 GPa, is in very good agreement with a recently obtained value (Secco,
2017) of 42.6 Wm-1
K-1
based on measured thermal conductivity of for liquid Fe at 1atm
along with added pressure-dependence of thermal conductivity, as well as a value of 55 ±
8Wm-1
K-1
obtained by first principles calculations (de Koker et al., 2012) at similar P,T.

77
Figure 3.14: Values of electrical resistivity of γ-Fe just before melting. ρ of γ-Fe (6 –
12 GPa), just before melting, extrapolated to the Mercury core pressure, and
compared to ρ (with error bars) of γ-Fe before melting4 at 26 GPa. Also, we show ρ
of δ-Fe (3 – 5 GPa) just before melt (the yellow shaded area on the left). The change
in the trend between δ-Fe and γ-Fe as a function of pressure is clearly visible. The
green shaded polygonal area on the right represents the uncertainty in ρ and P at
the center of Mercury’s core.
Similar calculations for the top of the liquid Fe cores of Moon, Ganymede, and Mars
were carried out. Thermal conductivity values derived from the electrical resistivity
measurements obtained in this work were used with values for thermal expansion (),
gravitational acceleration (g), and heat capacity at constant pressure (CP) to calculate the
adiabatic heat flow (qcond) on the core side of the CMB of these terrestrial bodies using
the following equation:
𝑞𝑐𝑜𝑛𝑑 = 𝑘𝑒 (𝑑𝑇
𝑑𝑟)𝑎𝑑
= 𝑘𝑒𝛼𝑔𝑇
𝐶𝑃
(3.1)
The ranges of adiabatic heat flow values are compared with several other studies (Figure
3.15). The parameter values used in our study are given in the figure legends.

78
References for legend parameters and for heat flow values from other studies: ref 1 Scheinberg et al. (2015) ref 2 Shibazaki et al. (2011) ref 3 Sohl et al. (2002) ref 4 Stegman et al. (2003) ref 5 Evans et al. (2014) ref 6 Rückriemen et al. (2018) ref 7 Rivoldini & Van Hoolst (2013) ref 8 Sohl & Spohn (1997) B08 Bland et al. (2008) D11 Dwyer et al. (2011) D13 Deng et al.( 2013) D18 Davies & Pommier (2018) E14 Evans et al. (2014) H06 Hauck et al. (2006) K09 Kimura et al. (2009) K18 Knibbe et al. (2018) L14 Laneuville et al. (2014) N00 Nimmo & Stevenson (2000) R15 Rückriemen et al. (2015) R18 Rückriemen et al. (2018) S83 Stevenson et al. (1983) S88 Schubert et al. (1988) S03 Stegman et al. (2003) S15 Schelnberg et al. (2015) T13 Tost et al. (2013) Z13 Zhang et al. (2013)
Figure 3.15: Comparison of values of adiabatic core heat flow at the CMB of Moon,
Ganymede, Mercury and Mars. Values obtained in this study (hatched rectangles)
were calculated using the parameter values given in the legends. The CMB
pressures at which the heat flow values were calculated are: Moon - 4.9 GPa
(Steinberger et al., 2015); Ganymede - 5.9 GPa (Hussmann et al., 2007); Mercury -
5.0 GPa (Rivoldini and Van Hoolst, 2013); Mars – 23 GPa (Sohl and Spohn, 1997).
The range of values of heat flux conducted along the adiabat is usually attributed to
poorly constrained values for thermal conductivity and thermal expansion (Davies and
Pommier, 2018; Knibbe and van Westrenen, 2018; Rückriemen et al., 2015; Scheinberg

79
et al., 2015). Our experimentally measured values of electrical resistivity of liquid Fe at
high pressures lead to robust thermal conductivity values and this focuses the source of
the range of values of adiabatic heat flux on uncertainties in thermal expansion. All other
parameters at the CMB of these bodies (g, T, Cp) are known with sufficient accuracy to
be responsible for only a few percent variation in the calculated conducted heat flux. The
values of conducted heat flux for Ganymede and Mars are similar in range used in
thermal evolution studies. The two high value ranges of conducted heat flux for
Ganymede (Bland et al., 2008; Rückriemen et al., 2018) and the three highest values for
the Moon (Laneuville et al., 2014; Stegman et al., 2003; Zhang et al., 2013) are caused
almost entirely by the high values of thermal expansion (0.9-1.0 × 10⁻⁴
K-1
) used in those
studies. However, the range of values for the Moon, which also includes high thermal
expansion, is lower than most previous studies of lunar thermal evolution. In part, this is
due to the lower thermal conductivity value that we have determined in this study. The
comparison for Mercury highlights that the values of conducted heat flow found in our
study generally are higher than three previous studies (except for one study (Deng et al.,
2013), wherein specific details on parameters used in their calculation of conducted heat
flow were not provided). Two thermal evolution models (Knibbe and van Westrenen,
2018; Tosi et al., 2013) used adiabatic heat flux values that fall within our range of
values. Most thermal evolution models show the heat flux through Mercury’s CMB to be
only a few mW/m2 and this is achieved within the first 1 Gyr (Grott et al., 2011; Hauck et
al., 2004; Tosi et al., 2013) or even within the first few million years (Knibbe and van
Westrenen, 2018). This means that the heat flow through the CMB is sub-adiabatic which
suggests that the outer parts of Mercury’s liquid core are thermally stratified (Dumberry
and Rivoldini, 2015). The highest values of adiabatic heat flux for Mercury, using the
highest values of thermal expansion, would provide a stabilizing effect to the thermally
stratified layer owing to the greater departure of the sub-adiabatic temperature profile
from the adiabat. This would require greater secular cooling (over longer time period) for
the sub-adiabat to intersect the core liquidus. In addition to a stabilizing effect, the high
values of core adiabatic heat flux would lead to an increase in thickness of the thermally
stratified layer. Both of these effects would slow the growth rate and increase the depth,
respectively, of the core region in which Fe snow could develop.
80
The cores of small planetary bodies are often postulated to include some amount of light
alloying elements (Collins and Johnson, 2014; Murchie et al., 2014; Sohl and Schubert,
2015; Van Hoolst and Rivoldini, 2014; Weber et al., 2011) such as S, Si, O or C. While it
has been shown that S, Si, and C in Fe increases ρ for the solid phase at high pressures
(Gomi et al., 2016; Kiarasi and Secco, 2015; Suehiro et al., 2017; Zhang et al., 2018),
their effects on ρ of the liquid phase, and therefore on κ, has not been reported.
Experimental measurements at 1 atm on Fe-Si compositions with 14-75 wt%Si show that
at high Si concentrations, ρ in the liquid state is lower than for pure Fe and the
temperature dependence of ρ in the liquid is negative (Baum et al., 1967). This unusual
behavior needs to be investigated at high pressure before speculating on the effects on
core thermophysical properties and dynamics. Since the results demonstrate an important
effect of solid structure on the electrical resistivity of liquid Fe, a direct evaluation of ke
in the Earth’s outer core awaits measurement of ρ (or more difficult κ) for liquid Fe
melting from the parent ε-phase.
References
Baum, B., P. Gel'd, and G. Tyagunov (1967), Resistivity of ferrosilicon alloys in the
temperature range 800–1700 C, The Physics of Metals and Metallography, 24,
181.
Bland, M. T., A. P. Showman, and G. Tobie (2008), The production of Ganymede's
magnetic field, Icarus, 198(2), 384-399, doi:10.1016/j.icarus.2008.07.011.
Collins, G., and T. V. Johnson (2014), Chapter 37 - Ganymede and Callisto, in
Encyclopedia of the Solar System (Third Edition), edited, pp. 813-829, Elsevier,
Boston, doi:10.1016/B978-0-12-415845-0.00037-2.
Davies, C. J., and A. Pommier (2018), Iron snow in the Martian core?, Earth and
Planetary Science Letters, 481, 189-200, doi:10.1016/j.epsl.2017.10.026.
de Koker, N., G. Steinle-Neumann, and V. Vlček (2012), Electrical resistivity and
thermal conductivity of liquid Fe alloys at high P and T, and heat flux in Earth’s
core, Proceedings of the National Academy of Sciences, 109(11), 4070-4073,
doi:10.1073/pnas.1111841109.

81
Deng, L., C. Seagle, Y. Fei, and A. Shahar (2013), High pressure and temperature
electrical resistivity of iron and implications for planetary cores, Geophysical
Research Letters, 40(1), 33-37, doi:10.1029/2012GL054347.
Drchal, V., J. Kudrnovský, D. Wagenknecht, I. Turek, and S. Khmelevskyi (2017),
Transport properties of iron at Earth's core conditions: The effect of spin disorder,
Physical Review B, 96(2), 024432, doi:10.1103/PhysRevB.96.024432
Dumberry, M., and A. Rivoldini (2015), Mercury’s inner core size and core-
crystallization regime, Icarus, 248(Supplement C), 254-268,
doi:10.1016/j.icarus.2014.10.038.
Ezenwa, I. C., and R. A. Secco (2017), Invariant electrical resistivity of Co along the
melting boundary, Earth and Planetary Science Letters, 474(Supplement C), 120-
127, doi:10.1016/j.epsl.2017.06.032.
Gomi, H., K. Hirose, H. Akai, and Y. Fei (2016), Electrical resistivity of substitutionally
disordered hcp Fe–Si and Fe–Ni alloys: Chemically-induced resistivity saturation
in the Earth's core, Earth and Planetary Science Letters, 451, 51-61,
doi:10.1016/j.epsl.2016.07.011.
Gomi, H., K. Ohta, K. Hirose, S. Labrosse, R. Caracas, M. J. Verstraete, and J. W.
Hernlund (2013), The high conductivity of iron and thermal evolution of the
Earth’s core, Physics of the Earth and Planetary Interiors, 224, 88-103,
doi:10.1016/j.pepi.2013.07.010.
Goncharov, A. F., S. S. Lobanov, X. Tan, G. T. Hohensee, D. G. Cahill, J.-F. Lin, S.-M.
Thomas, T. Okuchi, and N. Tomioka (2015), Experimental study of thermal
conductivity at high pressures: Implications for the deep Earth’s interior, Physics
of the Earth and Planetary Interiors, 247, 11-16, doi:10.1016/j.pepi.2015.02.004.
Grott, M., D. Breuer, and M. Laneuville (2011), Thermo-chemical evolution and global
contraction of mercury, Earth and Planetary Science Letters, 307(1), 135-146,
doi:10.1016/j.epsl.2011.04.040.
Gubbins, D., D. Alfè, C. Davies, and M. Pozzo (2015), On core convection and the
geodynamo: Effects of high electrical and thermal conductivity, Physics of the
Earth and Planetary Interiors, 247, 56-64, doi:10.1016/j.pepi.2015.04.002.
Hauck, S. A., A. J. Dombard, R. J. Phillips, and S. C. Solomon (2004), Internal and
tectonic evolution of Mercury, Earth and Planetary Science Letters, 222(3), 713-
728, doi:10.1016/j.epsl.2004.03.037.
Hauck, S. A., et al. (2013), The curious case of Mercury's internal structure, Journal of
Geophysical Research: Planets, 118(6), 1204-1220, doi:10.1002/jgre.20091.

82
Hsieh, W. P., F. Deschamps, T. Okuchi, and J. F. Lin (2017), Reduced lattice thermal
conductivity of Fe‐bearing bridgmanite in Earth's deep mantle, Journal of
Geophysical Research: Solid Earth, doi:10.1002/2017JB014339.
Jacko, A. C., J. O. Fjaerestad, and B. J. Powell (2009), A unified explanation of the
Kadowaki-Woods ratio in strongly correlated metals, Nat Phys, 5(6), 422-425,
doi:10.1038/nphys1249.
Kadowaki, K., and S. B. Woods (1986), Universal relationship of the resistivity and
specific heat in heavy-Fermion compounds, Solid State Communications, 58(8),
507-509, doi:10.1016/0038-1098(86)90785-4.
Kiarasi, S., and R. A. Secco (2015), Pressure‐induced electrical resistivity saturation of
Fe17Si, physica status solidi (b), 252(9), 2034-2042, doi:10.1002/pssb.201552029
Knibbe, J. S., and W. van Westrenen (2018), The thermal evolution of Mercury's Fe–Si
core, Earth and Planetary Science Letters, 482, 147-159,
doi:10.1016/j.epsl.2017.11.006.
Konôpková, Z., R. S. McWilliams, N. Gómez-Pérez, and A. F. Goncharov (2016), Direct
measurement of thermal conductivity in solid iron at planetary core conditions,
Nature, 534(7605), 99-101, doi:10.1038/nature18009.
Landrum, G. A., and R. Dronskowski (2000), The Orbital Origins of Magnetism: From
Atoms to Molecules to Ferromagnetic Alloys, Angewandte Chemie International
Edition, 39(9), 1560-1585, doi:10.1002/(SICI)1521-
3773(20000502)39:9<1560::AID-ANIE1560>3.0.CO;2-T.
Laneuville, M., M. A. Wieczorek, D. Breuer, J. Aubert, G. Morard, and T. Rückriemen
(2014), A long-lived lunar dynamo powered by core crystallization, Earth and
Planetary Science Letters, 401, 251-260, doi:10.1016/j.epsl.2014.05.057.
Lee, B., and G. W. Lee (2016), A liquid-liquid transition can exist in monatomic
transition metals with a positive melting slope, Scientific Reports, 6, 35564,
doi:10.1038/srep35564.
Leger, J. M., C. Loriers-Susse, and B. Vodar (1972), Pressure Effect on the Curie
Temperatures of Transition Metals and Alloys, Physical Review B, 6(11), 4250-
4261, doi:10.1103/PhysRevB.6.4250.
Liu, L.-G., and W. A. Bassett (1975), The melting of iron up to 200 kbar, Journal of
Geophysical Research, 80(26), 3777-3782, doi:10.1029/JB080i026p03777.
Murchie, S. L., R. J. Vervack Jr, C. M. Ernst, and R. G. Strom (2014), Chapter 13 -
Mercury A2 - Spohn, Tilman, in Encyclopedia of the Solar System (Third
Edition), edited by D. Breuer and T. V. Johnson, pp. 283-304, Elsevier, Boston,
doi:10.1016/B978-0-12-415845-0.00013-X.

83
O’Rourke, J. G., and D. J. Stevenson (2016), Powering Earth’s dynamo with magnesium
precipitation from the core, Nature, 529(7586), 387-389,
doi:10.1038/nature16495.
Ohta, K., Y. Kuwayama, K. Hirose, K. Shimizu, and Y. Ohishi (2016), Experimental
determination of the electrical resistivity of iron at Earth’s core conditions,
Nature, 534(7605), 95-98, doi:10.1038/nature17957.
Ohta, K., T. Yagi, K. Hirose, and Y. Ohishi (2017), Thermal conductivity of
ferropericlase in the Earth's lower mantle, Earth and Planetary Science Letters,
465, 29-37, doi:10.1016/j.epsl.2017.02.030.
Okuda, Y., K. Ohta, T. Yagi, R. Sinmyo, T. Wakamatsu, K. Hirose, and Y. Ohishi
(2017), The effect of iron and aluminum incorporation on lattice thermal
conductivity of bridgmanite at the Earth's lower mantle, Earth and Planetary
Science Letters, 474, 25-31, doi:10.1016/j.epsl.2017.06.022.
Pourovskii, L. V., J. Mravlje, A. Georges, S. I. Simak, and I. A. Abrikosov (2017),
Electron–electron scattering and thermal conductivity of ϵ -iron at Earth’s core
conditions, New Journal of Physics, 19(7), 073022, doi:10.1088/1367-
2630/aa76c9.
Pozzo, M., C. Davies, D. Gubbins, and D. Alfe (2012), Thermal and electrical
conductivity of iron at Earth/'s core conditions, Nature, 485(7398), 355-358,
doi:10.1038/nature11031.
Pozzo, M., C. Davies, D. Gubbins, and D. Alfè (2013), Transport properties for liquid
silicon-oxygen-iron mixtures at Earth's core conditions, Physical Review B, 87(1),
014110, doi:10.1103/PhysRevB.87.014110.
Ross, M., R. Boehler, and D. Errandonea (2007), Melting of transition metals at high
pressure and the influence of liquid frustration: The late metals Cu, Ni, and Fe,
Physical Review B, 76(18), 184117, doi:10.1103/PhysRevB.76.184117.
Rückriemen, T., D. Breuer, and T. Spohn (2015), The Fe snow regime in Ganymede's
core: A deep-seated dynamo below a stable snow zone, Journal of Geophysical
Research: Planets, 120(6), 1095-1118, doi:10.1002/2014JE004781.
Rückriemen, T., D. Breuer, and T. Spohn (2018), Top-down freezing in a Fe–FeS core
and Ganymede’s present-day magnetic field, Icarus, 307, 172-196,
doi:10.1016/j.icarus.2018.02.021.
Sanloup, C., F. Guyot, P. Gillet, G. Fiquet, R. J. Hemley, M. Mezouar, and I. Martinez
(2000), Structural changes in liquid Fe at high pressures and high temperatures
from Synchrotron X-ray Diffraction, EPL (Europhysics Letters), 52(2), 151-157,
doi:10.1209/epl/i2000-00417-3.
84
Scheinberg, A., K. M. Soderlund, and G. Schubert (2015), Magnetic field generation in
the lunar core: The role of inner core growth, Icarus, 254, 62-71,
doi:10.1016/j.icarus.2015.03.013.
Secco, R. A. (2017), Thermal Conductivity and Seebeck Coefficient of Fe and Fe-Si
Alloys: Implications for Variable Lorenz Number, Physics of the Earth and
Planetary Interiors, doi:10.1016/j.pepi.2017.01.005.
Secco, R. A., and H. H. Schloessin (1989), The electrical resistivity of solid and liquid Fe
at pressures up to 7 GPa, Journal of Geophysical Research: Solid Earth, 94(B5),
5887-5894, doi:10.1029/JB094iB05p05887.
Shen, G., V. B. Prakapenka, M. L. Rivers, and S. R. Sutton (2004), Structure of Liquid
Iron at Pressures up to 58 GPa, Physical Review Letters, 92(18), 185701,
doi:10.1103/PhysRevLett.92.185701.
Silber, R. E., R. A. Secco, and W. Yong (2017), Constant electrical resistivity of Ni along
the melting boundary up to 9 GPa, Journal of Geophysical Research: Solid Earth,
122(7), 5064-5081, doi:10.1002/2017JB014259.
Sohl, F., and G. Schubert (2015), Interior Structure, Composition, and Mineralogy of the
Terrestrial Planets, in Physics of Terrestrial Planets and Moons, edited by T.
Spohn, pp. 23-64, Elsevier.
Stacey, F. D., and D. E. Loper (2007), A revised estimate of the conductivity of iron alloy
at high pressure and implications for the core energy balance, Physics of the Earth
and Planetary Interiors, 161(1–2), 13-18, doi:10.1016/j.pepi.2006.12.001.
Stegman, D. R., A. M. Jellinek, S. A. Zatman, J. R. Baumgardner, and M. A. Richards
(2003), An early lunar core dynamo driven by thermochemical mantle convection,
Nature, 421, 143-146, doi:10.1038/nature01267.
Strong, H. M. (1959), The Experimental Fusion Curve of Iron to 96,000 Atmospheres,
Journal of Geophysical Research, 64(6), 653-659, doi:10.1029/JZ064i006p00653
Strong, H. M., R. E. Tuft, and R. E. Hanneman (1973), The iron fusion curve and γ-δ-l
triple point, Metallurgical Transactions, 4(11), 2657-2661,
doi:10.1007/BF02644272.
Suehiro, S., K. Ohta, K. Hirose, G. Morard, and Y. Ohishi (2017), The influence of sulfur
on the electrical resistivity of hcp iron: Implications for the core conductivity of
Mars and Earth, Geophysical Research Letters, 44(16), 8254-8259,
doi:10.1002/2017GL074021.
Tarduno, J. A., R. D. Cottrell, W. J. Davis, F. Nimmo, and R. K. Bono (2015), A Hadean
to Paleoarchean geodynamo recorded by single zircon crystals, Science,
349(6247), 521-524, doi:10.1126/science.aaa9114.

85
Terasaki, H., T. Kato, S. Urakawa, K. Funakoshi, K. Sato, A. Suzuki, and T. Okada
(2002), Viscosity change and structural transition of Molten Fe at 5 GPa,
Geophysical Research Letters, 29(8), 68-61-68-63, doi:10.1029/2001GL014321.
Tosi, N., M. Grott, A. C. Plesa, and D. Breuer (2013), Thermochemical evolution of
Mercury's interior, Journal of Geophysical Research: Planets, 118(12), 2474-
2487, doi:10.1002/jgre.20168.
Van Hoolst, T., and A. Rivoldini (2014), Chapter 18 - Interior Structure and Evolution of
Mars A2 - Spohn, Tilman, in Encyclopedia of the Solar System (Third Edition),
edited by D. Breuer and T. V. Johnson, pp. 379-396, Elsevier, Boston,
doi:10.1016/B978-0-12-415845-0.00018-9.
Waseda, Y., and K. Suzuki (1970), Atomic Distribution and Magnetic Moment in Liquid
Iron by Neutron Diffraction, physica status solidi (b), 39(2), 669-678,
doi:10.1002/pssb.19700390235.
Wasserman, E., L. Stixrude, and R. E. Cohen (1996), Thermal properties of iron at high
pressures and temperatures, Physical Review B, 53(13), 8296-8309,
doi:10.1103/PhysRevB.53.8296.
Weber, R. C., P.-Y. Lin, E. J. Garnero, Q. Williams, and P. Lognonné (2011), Seismic
Detection of the Lunar Core, Science, 331(6015), 309,
doi:10.1126/science.1199375.
Zhang, C., J. F. Lin, Y. Liu, S. Feng, C. Jin, M. Hou, and T. Yoshino (2018), Electrical
resistivity of Fe‐C alloy at high pressure: effects of carbon as a light element on
the thermal conductivity of the Earth's core, Journal of Geophysical Research:
Solid Earth, 123, doi:10.1029/2017JB015260.
Zhang, N., E. M. Parmentier, and Y. Liang (2013), A 3-D numerical study of the thermal
evolution of the Moon after cumulate mantle overturn: The importance of
rheology and core solidification, Journal of Geophysical Research: Planets,
118(9), 1789-1804, doi:10.1002/jgre.20121.

86
Chapter 4
4. Heat Flow in Terrestrial Cores from Invariant Electrical
Resistivity of Fe-Si on the Melting Boundary to 9 GPa
Let the future tell the truth, and evaluate each one according to his work and
accomplishments.
The present is theirs; the future, for which I have really worked, is mine.
- Nikola Tesla
A version of this chapter is being adapted for submission to a peer-reviewed journal:
Silber, R. E., Secco, R. A., Yong, W. and Littleton, J. (2018) Heat flow in terrestrial cores
from invariant electrical resistivity of Fe-Si on the melting boundary.
4.1. Introduction
Much of what makes life sustainable on Earth, from the strong magnetic field (e.g.,
Nimmo, 2015a; b), to mantle convection and subsequent plate tectonics (e.g., Olson et al.,
2015; Olson, 2016), depends critically on the thermal conductivity and rate of heat
transport in the Earth’s core and across the core-mantle boundary (CMB) (Vocadlo,
2015). However, thermal conductivity (κ) and related electrical resistivity (ρ) of Earth’s
outer core (OC), composed of liquid iron (Fe) alloyed with lighter elements, still remain
two of least constrained geophysical parameters (Williams, 2018). Thermal conductivity
is inversely proportional to electrical resistivity via the Wiedemann–Franz law (e.g.,
Secco, 2017), and it controls the energy budget of the core (Gubbins et al., 2015; Davies,
2015). Therefore, better characterization of both of these parameters in the Earth’s liquid
OC is of great importance. For example, thermal conductivity modulates thermal
convection in the OC, which is very sensitive to the rate of electron dominated heat
conduction from the inner core boundary (ICB) to the CMB and the rate at which heat is

87
extracted by the mantle (Davies, 2015; Gubbins et al., 2015). Thus, the stability and a
type of convection (thermal vs. compositional) depend closely on thermal conductivity
(and related electrical resistivity), as well as viscosity of liquid Fe alloyed with yet
unresolved combination of light elements (Davies et al., 2015). Additionally, the energy
budget of the core and the rate at which that energy is extracted across the CMB imposes
constraints on the nature of the geomagnetic field (Olson et al., 2015; Olson, 2016). The
magnetic field is generated through the conversion of kinetic energy produced by the
convecting molten alloy flows (e.g., Labrosse, 2015; Davies, 2015; Gubbins et al., 2015)
into electrical energy. Moreover, the interpretation of the nature of the geomagnetic field
which has existed for 3.5 - 4.2 Gyr (Tarduno et al., 2010; Biggin et al., 2015; Biggin et
al., 2009; Tarduno et al., 2015), and the age of the solid inner core (IC) closely depend on
the transport properties of the liquid Fe alloy (e.g., Gomi et al., 2013). This is because the
thermal conductivity of the core controls the amount of heat conducted down the adiabat,
and the higher its value, the faster is the growth rate of the IC (Davies et al., 2015).
However, the challenge of better constraining the transport properties of the liquid Fe
alloy in the core is multi-faceted. The uncertainty in precise evaluation of both thermal
conductivity and electrical resistivity of the Fe alloy in the OC is caused by and has
effects on: i) The unresolved compositional makeup and proportions of light elements in
the liquid OC (e.g., Litasov and Shatskiy, 2016); ii) The exact effects of light element
alloying on the transport properties of the liquid Fe (e.g., Zhang et al., 2016a; Shibazaki
and Kono, 2018); iii) The amount of heat flow across the CMB (e.g., Ammann et al.,
2014; Nimmo, 2015a); iv) A large spread of estimated temperatures at the CMB and ICB
(e.g., Andrault et al., 2011; Anzellini et al., 2013; Sakairi et al., 2017; Zhang et al.,
2018a). Lastly, from the experimental perspective, reaching and maintaining the core
temperatures (T) and pressures (P) for sufficiently long time, while maintaining liquid
sample geometry and purity to collect resistivity data, are still not experimentally
achievable (e.g., Williams, 2018).
Here I present results of electrical resistivity measurements on solid and liquid Fe-4.5
wt%Si (henceforth referred to as Fe-4.5Si) from 3 GPa to 9 GPa, and up to ~ 2200 K, to
evaluate the effect of low Si content on the resistivity and thermal conductivity of the

88
liquid Fe-alloy. Toward that end, it is important to first probe the behavior of liquid
binary alloys such as Fe-Si to characterize their behavior and determine what conclusions
can be made before attempting studies on ternary Fe alloys or even more complex liquid
Fe systems at similar or even much higher pressures. This work is also a sensible step
toward direct experimental efforts to resolve and understand the properties of liquid Fe-
alloys at the core conditions.
This study is motivated by recent reports which show that the electrical resistivity of
transition metals Co and Ni is invariant along the melting boundary (Ezenwa and Secco,
2017; Silber et al., 2017). The same trend is observed in Fe beyond the triple point of
~5.2 GPa (Silber et al., 2018). Thus, it is sensible to ask if the liquid Fe-alloys (with low
content of light elements) could exhibit the same behavior as the pure Fe liquid, and
whether Matthiessen’s rule holds along the melting boundary. Matthiessen’s rule states
that the ρ is additive, such that the total electrical resistivity is the sum of ρ resulting from
imperfections in the crystal and ρ due to thermal motion of the metal ions in the lattice.
Despite the fact that this study is conducted at low pressures relative to Earth’s core, the
results are crucial in identifying the nature of the phenomenon that exerts much stronger
controls on the electrical resistivity of pure 3d transition metals and their alloys at much
higher pressures. Based on the experimental results and the supporting evidence from
recent developments in understanding of dynamics of liquid metals, I demonstrate that
pressure dependent icosahedral short range order (ISRO) controls the mean free path of
electrons in liquid Fe-alloys and governs the electrical resistivity in the outer core. To my
knowledge, the effect of ISRO on electrical resistivity has not been considered before.
Consequently, I postulate that this phenomenon enables prediction of electrical resistivity
of liquid Fe-alloy at the ICB as the critical anchor solid-liquid point, which in turn
enables a significantly better constrained interpretation of thermal conductivity at ICB
and CMB and eliminates some of the uncertainties noted above.
However, it is necessary to first give a condensed background of the relevant aspects
which introduce the uncertainty in the determination of electrical resistivity and thermal
conductivity of the Earth’s OC.

89
This chapter is organized as follows: in Section 4.2, I discuss the uncertainties imposed
by incomplete understanding of compositional and alloying effects on thermal
conductivity of the OC. The uncertainty in temperature profiles at the CMB is also
discussed along with a brief review of electrical resistivity measurements. Sections 4.3
and 4.4 are dedicated to methods and results, respectively. The detailed interpretation and
implications of the findings in the context of the results and the postulated phenomenon
for the determination of thermal conductivity in the OC are discussed in Section 4.5. The
conclusions are presented in Section 4.6.
4.2. Additional Challenges and Uncertainties in Constraining the
Transport Properties of the Liquid Fe Alloys
4.2.1 The Composition of the Outer Core
In terms of composition, while it is well understood that the OC is composed of liquid Fe
and ~5-10% Ni (almost indistinguishable from pure Fe), alloyed with a small fraction of
lighter elements (Poirier, 1994), the exact combination and overall proportion of lighter
elements remains unresolved (e.g., Vocadlo, 2015). The knowledge of the makeup and
exact fraction of light elements in the OC, are required to satisfy the seismological (e.g.,
Badro et al., 2014; Zhang et al., 2016a), cosmochemical (e.g., McDonough and Sun,
1995) and geophysical (e.g., McDonough, 2003; Morard et al., 2013) constraints.
Consequently, there is only a limited number of light elements whose combination (or
even a singular presence) may satisfy those constraints: silicon (Si), sulfur (S), carbon
(C), hydrogen (H), oxygen (O) and recently proposed magnesium (Mg). Numerous
earlier studies aiming to characterize the light-element composition in the core presented
a wide range of compositional estimates (e.g., Allègre et al., 1995; McDonough and Sun,
1995; Alfè et al., 2002; Badro et al., 2007; Sakai et al., 2006; Takafuji et al., 2005; Alfè et
al., 1999; Huang et al., 2011; Badro et al., 2014; Zhang et al., 2016a).

90
Evidently, the debate on the core composition is still ongoing (e.g., Litasov and Shatskiy,
2016; Tateno et al., 2018). However, the consensus tilts toward Si as the major light
element in the OC (e.g., Zhang et al., 2016a; Suer et al., 2017). This, of course, adds the
geophysical interest in Fe-Si alloys in addition to and beyond traditional industrial
applications (e.g., Numakura et al., 1972; Narita and Enokizono, 1979; Kita et al., 1994;
Waseda et al., 1995; Gu et al., 2004; Qin et al., 2004; Shin et al., 2005; Cui and Jung,
2017). Cosmochemical abundance of Si in meteorites (Poirier, 1994; McDonough and
Sun, 1995; Karato and Murthy, 1997; Murthy and Karato, 1997; Georg et al., 2007),
mantle abundance and isotopic ratio in terrestrial rocks (e.g., Fitoussi et al., 2009; Georg
et al., 2007; Shahar et al., 2009), higher sound velocity and higher bulk modulus in the
core (Lin et al., 2003; Sanloup et al., 2004; Antonangeli et al., 2010; Mao et al., 2012;
Badro et al., 2007; Tsuchiya and Fujibuchi, 2009), chemical affinity with the metallic
phase and solubility in Fe at high pressures (e.g., Kuwayama and Hirose, 2004; Takafuji
et al., 2005; Tateno et al., 2015), along with reduced density of the liquid Fe-Si alloy
comparing to pure Fe (~8% in OC) (e.g., Zhang et al., 2016a), all make Si the likely
dominant light element in the core (Hirose et al., 2013; Fischer et al., 2014; Litasov and
Shatskiy, 2016; Zhang et al., 2016a). The estimates of the core Si content range from ~4
– 12% (Litasov and Shatskiy, 2016; Zhang et al., 2016a). However, plausible arguments
presented to the contrary (e.g., Williams et al., 2015) show that the consensus on which
minor element is dominant in the core has not been reached yet.
Si can stabilize the body centered cubic (bcc) phase of Fe (Cote et al., 2008). Si also has a
stabilizing effect on the face centered cubic (fcc) and hexagonal close packed (hcp)
phases of an Fe-Si alloy (Asanuma et al., 2008; Kuwayama et al., 2008; 2009; Tateno et
al., 2010; Tateno et al., 2015) and its presence in amounts likely to be in the core does not
significantly modify the melting curve of pure Fe (Asanuma et al., 2010; Fischer et al.,
2013; Zhang et al., 2016a, 2018a). In addition, the solubility of Si in liquid Fe increases
with pressure (Tateno et al., 2015).
On the other hand, the singular presence of Si in the Fe-Ni alloy in the OC is not
plausible due to the same cosmochemical, geophysical and seismologic considerations
discussed above that dictate the presence, albeit limited, of other light elements (Tateno

91
et al., 2018). For example, S is expected to play a dominant light element role in the cores
of small planetary bodies such as Mercury, Mars, Ganymede and the Moon (see Sanloup
et al., 2002; Pommier, 2018). Conversely, the experimental evidence shows that S cannot
be a single light element in the core (Sata et al., 2010; Huang et al., 2013; Badro et al.,
2014; Umemoto et al., 2014). Moreover, S is not expected to be present beyond 2 wt% in
the Earth’s core (McDonough, 2003; Suer et al., 2017). Similarly, C is suggested to be
below 1wt% (Zhang and Yin, 2012; Dasgupta et al., 2013; Morard et al., 2014) because
higher content of C in the core would, for example, require unrealistic C content in the
Earth’s mantle. However, the simplistic picture of the OC composition cannot address
some most recent results (e.g., Deng et al., 2013; Tateno et al., 2018). Using the results
from melting experiments in the Fe–S–C ternary and Fe–S–Si–C quaternary systems up
to 20 GPa which show that S preferentially partitions into a molten core, Deng et al.
(2013) concluded that the liquid OC will be S rich and Si poor, with only a moderate
amount of C in both OC and IC. High pressure experimental results on Fe-C liquid alloys
(Morard et al., 2017) further demonstrate that C is only a very minor constituent of the
OC.
On the other hand, the results obtained by Mori et al. (2017) show that while the
crystallization from the eutectic liquid with ~6 wt% S at 254 GPa can account for the
core density deficit. These studies are in a reasonable agreement with the study by Suer et
al. (2017), who conducted metal-silicate partitioning experiments at pressures 46-91 GPa
and temperatures 3100 - 4100 K. The authors showed that S partition coefficients are an
order of magnitude less than that from earlier studies and demonstrate that S is not a
highly siderophile element at high pressures and temperatures. Additionally, oxygen may
be present in the OC in quantities below ~2 wt%, while H, due to its volatility, is
expected to be only a very minor component in the liquid Fe-alloy (Zhang et al., 2016a).
Further uncertainties of Si content within the makeup of the core light elements were
recently introduced by Tateno et al. (2018), who considered the eutectic behaviour of
ternary Fe-alloys near ICB. Their experimental melting study on Fe-Si-S (2.2-2.7wt% Si
and 2.0-2.1wt%S) at OC pressures indicated that the liquid evolves toward a Si poor and
S rich composition upon crystallization (Tateno et al., 2018). This suggests that the solid

92
alloy, crystallized from the liquid with such composition at the ICB, is more enriched in
Si/S and consequently cannot satisfy the seismically required jump in density which is
observed at the ICB (Tateno et al., 2018). Tsuno et al. (2018) showed that the C solubility
in a molten alloy decreases with increasing presence of S. Similarly, it was demonstrated
that recently proposed Mg (O'Rourke and Stevenson, 2016; O'Rourke et al., 2017) is
present in the OC in likely negligible quantities (Du et al., 2017).
Clearly the debate is not settled yet over the exact light element composition in the outer
core. This is indeed one of the factors responsible for the significant uncertainty in the
evaluation of ρ and κ of potential liquid alloys in the OC. More fundamentally, the
individual or combined effect of light elements on the transport properties of liquid Fe at
low to moderate pressures and temperatures is not resolved. The major factor is the
general absence of electrical resistivity measurements on liquid Fe-alloys (binary, ternary
or higher order) at high pressures, which is primarily attributed to the associated
experimental challenges (Williams, 2018).
4.2.2. Electrical Resistivity and Thermal Conductivity of Fe and its Alloys
The first reliable experimental ρ results on the effect of Si content in a solid Fe-alloy
were reported by Yensen (1915). These results are still the benchmark for most of the
studies at ambient pressure and temperature. Baum et al. (1967) measured electrical
resistivity of Fe alloys at the ambient pressure and in the temperature range 800-1700° C.
While some reported results on electrical resistivity at melting of Fe-Si are inconsistent
with increasing Si content (e.g., Baum et al., 1967), the same authors also observed a
negative temperature coefficient of electrical resistivity before melting. An anomalous
temperature dependence of the electrical resistivity in Fe-7wt%Si was also reported by
Nishino et al. (1993).
In contrast to the number of studies of ρ of Fe-Si alloys at ambient pressure, only a very
limited number of high pressure experimental measurements of ρ and κ of liquid Fe and
its alloys are reported in literature to date (e.g., Secco and Schloessin, 1989; Ohta et al.,
2016; Silber et al., 2018), although a recent study using a multi-anvil press, following the

93
experimental design of Silber et al. (2017), is a step in the right direction (Pommier and
Leinenweber, 2018).
The electrical resistivity on solid samples at pressures approaching that of the IC can be
measured in a diamond anvil cell (DAC). Currently, a common approach of measuring ρ
in DAC involves measuring the voltage drop on decompression and using the van der
Pauw method to evaluate ρ at ambient temperature (Gomi et al., 2013,2016; Seagle et al.,
2013; Zhang et al., 2018b). Such Values of ρ are then used in the Bloch-Grüneisen
relation to account for the temperature effect on electrical resistivity (e.g., Seagle et al.,
2013). In principle, while those authors measured ρ generally up to ~100 GPa, the
flattening of the resistivity curve allows extrapolation to much higher pressures. Most
recently, the electrical resistivity of Fe alloy with 3 wt% S and 3 wt% Si was measured
using the DAC method and the results indicate smaller contribution of S to ρ relative to
Si (Suehiro et al., 2017). The contribution of C to electrical resistivity of Fe-alloy was
reported to be stronger than S or Si (Zhang et al., 2018b). The overall results among
different DAC-based experimental investigations are in a reasonable agreement for both
pure Fe and Fe-alloys (e.g., Zhang et al., 2018b).
The values of ρ and estimated for pure Fe at the CMB range from ~60 – 130 μΩcm and
~67 – 145 W/mK, respectively, while the addition of 9 wt% Si reduces thermal
conductivity to ~41 – 60 W/mK at the same pressure (Seagle et al., 2013). Gomi et al.
(2013) reported the values of κ of Fe-4wt%Si to be 90 W/mK and 148 W/mK at CMB
and ICB, respectively. The same authors also found the heat flow across CMB to be ~11
TW. Moreover, Gomi et al. (2013) were the first to consider the contribution of the
resistivity saturation at high pressure which suggests that the ρ at high pressure cannot
exceed ~150 μΩcm (Gomi et al., 2016). An extensive review of the phenomena of
saturation resistivity in metals at atmospheric pressure is given by Gunnarsson et al.
(2003). Similar results were obtained from experiments on Fe-Si and Fe-Ni, where ρ and
κ at the top of the core were evaluated at 112 μΩ∙cm and 87 W/mK, respectively, taking
into account the chemically-induced resistivity saturation in the Earth’s core (Gomi et al.,
2016). Recently, resistivity saturation was modeled numerically for Fe-Si, Fe-S and Fe-O

94
alloys (Wagle et al., 2018) and shown that the Ioffe-Regel criterion of electron mean free
path equal to the interatomic distance was reached at very high temperatures.
A common thread among all these experimental studies is that ρ of pure Fe and its alloys
(at room temperature) increases significantly at P ≥ 12 GPa (corresponding to the bcc-
hcp transition) and starts to decrease after about 20 GPa, generally tapering off toward a
more stable value after 60 GPa. Furthermore, for most alloys, Matthiessen’s rule is
obeyed at high pressures and an ambient temperature. However, the validity of
Matthiessen’s rule at high temperatures is not well defined, although when the electrical
resistivity approaches the saturation value, Matthiessen’s rule breaks down (Gomi et al.,
2016).
The corresponding theoretical studies have been somewhat more consistent with each
other in estimating the ρ and κ of the OC. In ground-breaking work, Elsasser (1946)
theoretically estimated electrical resistivity of the OC at 100 μΩcm. Ever since then, the
values of electrical resistivity of the OC have been continuously revised upward and
downward (see Gomi and Hirose, 2015 for a review). Relatively recent high values of the
resistivity at the CMB for Fe alloyed with Ni and Si (212 μΩcm), were initially
calculated by Stacey and Anderson (2001) on the basis of shock wave experiments
(Matassov, 1977) and developed from the theoretical foundation formulated by Gilvarry
(1956). These values for the electrical resistivity of the OC have been dramatically
revised to about 90 - 100 μΩcm as a result of the density-functional-theory-based s
molecular dynamics (DFT-MD) simulations (de Koker et al., 2012; Pozzo et al., 2012,
2013) for the considered Fe-alloy at the CMB. An even lower value of 73.5 μΩcm was
calculated for the pure Fe liquid at the CMB conditions (Pozzo et al., 2012). Similarly
low values for ρ of liquid Fe at the CMB conditions were computed recently by Wagle
and Steinle-Neumann (2018).
These recently revised theoretical and experimental values of ρ and derived κ are up to
five times greater than the earlier values (e.g., Stacey and Anderson, 2001; Stacey and
Loper, 2007) and impose much greater uncertainty in the type of convection in the OC
needed to power the geodynamo (e.g., Gomi et al., 2013; Nimmo, 2015b; Davies, 2015;

95
Gubbins et al., 2015). The reason for the greater uncertainty is straightforward. Increasing
the thermal conductivity means increasing the conductive heat loss from the core through
the CMB, which in turn reduces the available energy to power the geodynamo (Davies et
al., 2015). Moreover, higher thermal conductivity predicates a much younger inner core
as it implies much faster growth (e.g., Gomi et al., 2013, 2016) relative to earlier
estimates. This also has the effect of reducing the power available to the geodynamo
throughout its existence via chemical convection as a result of IC growth over a limited
lifespan.
However, a recent experimental study (Konôpková et al., 2016) reported convincing
results that are contrary to the recent theoretical and experimental estimates of thermal
conductivity of Fe (e.g., Pozzo et al., 2012; de Koker et al., 2012; Ohta et al., 2016; Gomi
et al., 2013; Seagle et al., 2013). In direct measurement of , Konôpková et al. (2016)
employed a heat pulse propagation through a solid Fe sample after heating with a
nanosecond laser pulse and demonstrated that the κ for pure Fe at the CMB conditions
(33 ± 7 W/mK) is closer to the values discussed by Stacey and Anderson (2001) (46
W/mK) than to the recently revised and theoretically calculated values. In another study,
Silber et al. (2018) demonstrated that the electrical resistivity of liquid Fe is likely to
remain constant along the melting boundary up to the γ-ε-liquid transition at about 80
GPa. These results indeed show a renewed need for a rigorous evaluation of the electrical
and thermal transport properties of liquid Fe-alloys at high pressure.
Finally, I address the uncertainties in a wide range of the values of the heat flow across
the CMB imposed by estimates of thermal conductivity (Ammann et al., 2014; Olson et
al., 2015) and the melting temperature of Fe-alloy in the same region (e.g., Andrault et
al., 2011; Anzellini et al., 2013; Davies et al., 2015; Olson, 2016). An upper and lower
limit on the melting temperature of Fe-alloys in the OC may be inferred with respect to
the lower mantle solidus. However, the estimates of the lower mantle solidus range from
3570±200 K (Nomura et al., 2014) to ~4150±150 K (Fiquet et al., 2010; Andrault et al.,
2011). The presence of light elements in Fe is expected to depress the melting curve
relative to pure Fe as illustrated by Zhang et al. (2018a). On the other hand, some

96
experimental results at high pressure suggest that addition of 9wt%Si causes the melting
of Fe-Si alloy at higher temperatures relative to pure Fe (e.g., Fischer et al., 2013).
The rate at which the top of the OC releases thermal energy into the overlying base of the
mantle is controlled by the temperature difference between the core and the interior of the
mantle and depends on the thermal conductivity of the mantle mineral phases, perovskite
post-perovskite and ferro-periclase (Ammann et al., 2014). As noted earlier, the rate of
such cooling affects the type of convection in the core and potential stratification at the
top of the core (e.g., Gubbins et al., 2015). In the lower mantle, perovskite has relatively
low thermal conductivity in comparison to the post-perovskite phase, which is found in
the D” region (Hirose et al., 2015). The heat flux across the CMB is thought to be
enhanced across the D” region. However, there are still appreciable uncertainties in the
values of thermal conductivity of the lower mantle minerals (Ammann et al., 2014; Ohta
et al., 2017; Hsieh et al., 2017). Additionally, thermal conductivity of ferropericlase in
the lower mantle can be reduced by Fe substitution and spin crossover (Ohta et al., 2017;
Hsieh et al., 2017).
Thus, an indirect reliance on these parameters, because of the inherent uncertainties, may
skew the estimated values of thermal conductivity of liquid Fe-alloy in the core, and
illustrates the need for direct experimental measurements of ρ and κ of liquid Fe-alloys at
high pressures.
4.3. Methods
4.3.1. Experiments
A 0.1 m length of high purity Fe-Si wire with 4.5 ± 0.1wt%Si (or 8.6 at% Si) was
supplied by special order from ChemPur Corporation (https://chempur.de). The starting
sample wire exhibited a high degree of brittleness and hardness as is common in an alloy
with similar Si content (Mohri et al., 2017). The detailed description of the experimental

97
procedure of the high pressure-temperature runs is given elsewhere (Silber et al., 2017,
2018), therefore only a brief discussion is given here.
Prior to emplacing the Fe-Si cylindrical sample into a high density, thick walled ceramic
tube, the sample was carefully polished in such way that the diameter matched the inner
diameter of the ceramic tube. Separately, the samples and the hosting ceramic tubes were
also meticulously cleaned in ethyl alcohol ultrasonic bath to remove any contaminants.
The ceramic tube was used to constrain the radial geometry of the molten sample, while
W-discs on each end were used to contain the melt, preserve axial geometry and ensure
contact with thermocouple wires/current leads during the experiments. Prior to being
loaded into the 3000 ton large volume multi-anvil press, the assembled octahedra cells
were heated in a vacuum furnace at about 420 K for 12 hours. The description of the
octahedron cell, internal component details and setup are given in Silber et al. (2017,
2018). The average sample length was 1.5·10-3
m. Upon compression, a 4-wire method of
recording the temperature and voltage decrease separately across the sample was used,
while maintaining a constant current of 0.5 A. The DC power source was a Keysight
B2961A, and DC voltages were recorded using a Keysight 34470A digital multimeter,
and the associated BenchVue software. A manual polarity switch was used in all
experiments to account for any contribution to the voltage due to potential temperature
differences between the two thermocouple junctions. Before conducting resistivity
measurements, each sample was preheated at the run pressure to 1000 K and cooled
slowly to ensure full contact between the W26%Re/W5%Re thermocouple wires, W-disc
and a sample situated in the middle. Preheating to higher or lower temperatures did not
affect the starting value of ρ. The electrical resistivity values were obtained through
Ohm’s and Pouillet’s laws. The melting curve boundary was identified based on the onset
of the discontinuity in the resistivity curve typically associated with melting. Multiple
runs at each pressure were conducted to ensure repeatability of the phenomena and
overall repeatability of data, especially for pressures 3-5 GPa, where the electrical
resistivity does not exhibit any significant jump at the melt.
The uncertainties were calculated using the well-established method (Bevington and
Robinson, 2003), as described in detail in Silber et al. (2017, 2018). The uncertainties

98
reflect the standard deviation between the absolute value of positive and negative polarity
voltage readings and account for the length changes during the compression and heating.
Pressure- and temperature-related uncertainties, while very small, were also included in
calculation.
4.3.2 EMP Analyses
The EMP analysis was done at the Centre of Planetary Science & Exploration, Western
University, London, Ontario, Canada. A starting sample wire was probed by JEOL JXA-
8530F Electron Microprobe (EMP) to evaluate the purity and homogeneity. For all the
analyses, an accelerating voltage of 20 kV, a probe current of 50 nA, and a spot size
(∼100 nm) beam were used. To test for diffusion and contamination from a W-disc, the
post-experimentally recovered samples, initially compressed to the same pressure and
heated to the melting point and significantly above the melting point (1950 K and 2100
K), were subsequently probed by EMP. In any measurement of ρ, it is important to
mitigate the contamination. Thus, the main concern in this study was potential
contamination from W disc and from the sample container. However, one of the simple
ways to mitigate the contamination of the liquid sample due to diffusion is to conduct
rapid data collection in the liquid. In principle, throughout this study, the duration of a
sample in the liquid state was generally on the order of seconds.
4.4. Results
4.4.1. Electrical Resistivity of Solid Fe-4.5Si Alloy
The electrical resistivity of Fe-4.5Si in the pressure range 3 – 9 GPa is shown in Figure
4.1. The initial starting values of ρ at room temperature closely agree with Yensen
(1915), Baum et al. (1967), Numakura et al. (1972) and Nishino et al. (1993) for the
similar Si content, and are in line with values for 4 wt% Si (Gomi et al., 2013) all at 1
atm. The comparison with Fe shows that the starting resistivity of Fe-4.5Si alloy at 3-9
GPa is by a factor of ~6 greater than that of pure Fe.

99
Figure 4.1: Electrical resistivity of solid and liquid Fe-4.5Si from 3 to 9 GPa, and
compared with pure Fe at each P. The dashed line indicates the ρ of 120 μΩcm
which corresponds to the ρ of Fe-4.5Si at melting boundary for all P. For
comparison purposes, the values of ρ at room temperature and 1 atm by other
authors are also included (Yensen, 1915; Numakura et al., 1972; Nishino et al.,
1993; Gomi et al., 2016).

100
From the Fe-Si phase diagram (Kubaschewski, 1982; Cui and Jung, 2017), Fe-4.5Si has
body centered cubic structure (bcc) which is generally referred to as the A2 phase. At
ambient temperature, ρ of the Fe-4.5Si A2 phase exhibits a small and steady decrease
between 3 – 9 GPa which is consistent with early studies (e.g., Balchan and Drickamer,
1961), but diverges from the recent trend observed in DAC measurements (e.g., Seagle et
al., 2013; Gomi et al., 2013).
Fe-4.5Si is a ferromagnetic alloy prior to reaching the Curie temperature (TC), where
magnetism, like in other transition metal alloys, originates from a partially filled spin
polarized 3d band. Before the onset of the Curie temperature, ρ of the A2 phase in the
experimental pressure range 3-9 GPa exhibits the influence of strong spin scattering of
conduction electrons similar to the behavior of pure Fe, Ni and Co (Secco and Schloessin,
1989; Silber et al., 2017, 2018; Ezenwa and Secco, 2017) (Figure 4.1). TC marks the
temperature at which the Fe-alloy loses its long range magnetic spin moments. This
transition is generally associated with the marked change in resistivity as evidenced in
this study and earlier studies (e.g., Secco and Schloessin, 1989; Silber et al., 2017, 2018).
Consequently, the effects of pressure on ρ are more pronounced in the region of TC
(Figure 4.1) where the peak in the resistivity curve is significantly depressed by pressure.
The value of TC evidently decreases with increasing pressure. However, above TC,
electrical resistivity of the paramagnetic A2 phase of Fe-4.5Si starts to strongly diverge
from the typical resistivity trend of Fe. Instead of tapering off and continuing a slow but
steady increase following the peak value just above TC, the electrical resistivity of Fe-
4.5Si starts to decrease, exhibiting a negative temperature coefficient of ρ. The decrease
in ρ is both T and P dependent (Figure 4.1). This agrees well with earlier studies which
reported the same anomalous behaviour of electrical resistivity of Fe-Si alloys (Baum et
al., 1967; Nishino et al., 1993).
The negative slope of ρ in the paramagnetic A2 phase changes at the temperature point
which exhibits a strong pressure dependence. The temperature, which corresponds to the
change of resistivity slope, decreases steadily with P as shown by the black arrows in
Figure 4.2. Remarkably, that temperature coincides with the melting temperature of Si

101
(e.g., Kubo et al., 2008), which would imply a structural change in the solid Fe-Si alloy at
corresponding temperature and pressure. It is relevant to note that upon melting, the
coordination number in pure Si increases from 4 (diamond structure) to 6 in the liquid
state. While this does not imply partial melting of Si within the alloy but rather implies an
important structural change associated with the Si component that can be interpreted
based on its pure form which assumes metallic character upon melting.
Figure 4.2: P and T dependent behaviour of ρ which changes at the onset of
different phases. The transition from disordered bcc to the mixed phase (3-5 GPa),
and to the fcc phase (6-9 GPa), is marked by the black arrows pointing up. This
transition closely matches the melting of pure Si which is characterized by the
coordination number change from 4 to 6. A change from the fcc phase to another
mixed phase is marked by the blue arrow pointing up. The melting points are
marked by down-pointing red arrows.

102
An interesting feature of the electrical resistivity of Fe-4.5Si is observed following the
transition to a positive slope. In that temperature region (Figure 4.1 and 4.2), the
electrical resistivity of Fe-4.5Si almost lines up with ρ of pure fcc-Fe at the same
pressure. It should be noted that in the pressure range 3 - 5 GPa, the slope of resistivity
changes gradually, while at pressures 6-9 GPa, the change is discontinuous. At pressures
3-5 GPa, the temperature range where the resistivity of Fe-Si matches that of pure Fe is
relatively small and matches ρ of pure Fe almost perfectly. On the other hand, at higher
pressures, that transitional region starts to broaden significantly and is sharply delineated
by the discontinuous trends in the resistivity curve (Figure 4.2). Additionally, at pressures
6 - 9 GPa in the aforementioned temperature range, the resistivity of Fe-4.5Si mirrors the
trend of pure Fe almost perfectly, although it exhibits a slightly increased value relative
to pure Fe.
It is widely accepted that the scattering of an electron wave from a lattice irregularity
impacts the electrical resistivity. Consequently, ρ strongly reflects the level of ordering in
the solid (e.g., Numakura et al., 1972; Narita and Enokizono, 1979). It should be noted
that the P- and T-dependent region where ρ of Fe-4.5Si matches the behaviour of Fe
corresponds to the Fe fcc phase. Thus, it is reasonable to conclude that the Fe-4.5Si
sample also has the fcc structure. This is especially true above 5 GPa. For the pressure
range 3-5 GPa, such interpretation is slightly more difficult and cannot be made with
certainty.
On the other hand, the appearance of the fcc phase at P > 5 GPa is not surprising, as it has
been observed in an Fe-alloy with a much higher Si content and at pressures beyond 80
GPa (Fischer et al., 2013). This implies that at high pressures, the fcc A1 phase of an Fe-
Si alloy which is generally present only up to ~3.8wt% Si at 1 atm (Cui and Jung, 2017),
starts to broaden and becomes prominent in the region below the melting curve and at
high P. However, it should be emphasized that the P-T phase space for the considered Fe-
Si alloy is still poorly defined and there is no adequate analogue in literature, especially
below 20 GPa.

103
4.4.2. Melting Points and Phase Diagram of Fe-4.5Si for Pressures 3-9 GPa
Based on the behaviour of the electrical resistivity of Fe-4.5Si (Figures 4.1 and 4.2), a
rather simplistic P-T phase diagram of Fe-4.5Si (Figure 4.3) has been constructed. The
transition from the disordered bcc paramagnetic phase into the mixed phase (below 5
GPa) and the fcc phase (6-9 GPa) is clearly observed. However, in the pressure range 3-5
GPa, the exact structural nature of the region above the transition from the disordered A2
phase (which coincides with the Si melting curve) cannot be resolved further in this
study. From the analysis of the Fe-Si phase diagram (Cui and Jung, 2017), it can be
reasonably expected that this region below 5 GPa is a mixture of the bcc and fcc phases.
The same can be said for the region above the fcc phase that can be clearly identified
(Figure 4.2) at pressure range 6 - 9 GPa.
At P > 6 GPa, electrical resistivity jumps again at the end of interpreted fcc phase and
starts again to exhibit a trend similar to that of pure Fe (Figure 4.1), where the mixed
phase at T > 1700 K resumes the same slope of the electrical resistivity. This jump in
resistivity is identified as melting. In this pressure range, the melting is characterized by
the presence of an initially small jump in ρ, which eventually approaches the magnitude
of the jump of a pure Fe at 9 GPa. The subsequent slope of ρ in the liquid matches that of
pure Fe.
However, at pressures 3-5 GPa, determination of the melting point is not as trivial. While
the resistivity of Fe-4.5Si at 3 GPa exhibits a very small decrease (Figure 4.2), after
which it resumes the same slope as pure Fe, at pressures of 4 and 5 GPa the transition to
liquid is almost indistinguishable. The behaviour of ρ at melting at 4 GPa is detected by a
small, yet distinct discontinuity in the slope. That change in slope is barely detectable at 5
GPa, where the trend in ρ is almost linear during melting. It is important to emphasize
that this anomalous behaviour has been validated in multiple experiments for each
pressure point, and the same trend was replicated in all runs.
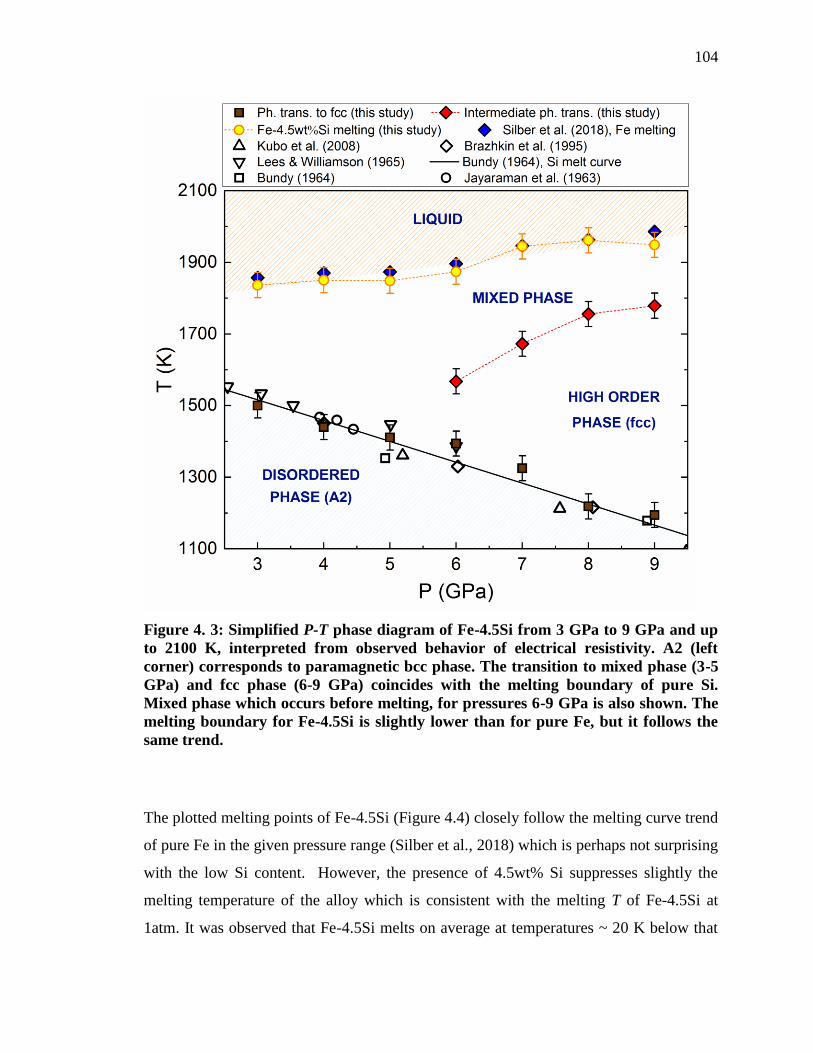
104
Figure 4. 3: Simplified P-T phase diagram of Fe-4.5Si from 3 GPa to 9 GPa and up
to 2100 K, interpreted from observed behavior of electrical resistivity. A2 (left
corner) corresponds to paramagnetic bcc phase. The transition to mixed phase (3-5
GPa) and fcc phase (6-9 GPa) coincides with the melting boundary of pure Si.
Mixed phase which occurs before melting, for pressures 6-9 GPa is also shown. The
melting boundary for Fe-4.5Si is slightly lower than for pure Fe, but it follows the
same trend.
The plotted melting points of Fe-4.5Si (Figure 4.4) closely follow the melting curve trend
of pure Fe in the given pressure range (Silber et al., 2018) which is perhaps not surprising
with the low Si content. However, the presence of 4.5wt% Si suppresses slightly the
melting temperature of the alloy which is consistent with the melting T of Fe-4.5Si at
1atm. It was observed that Fe-4.5Si melts on average at temperatures ~ 20 K below that

105
of pure Fe. At the moment, I am not aware of any reported melting curve for this
particular alloy and at pressures below 20 GPa. However, the comparison of these results
with an extrapolated melting curve from a range of values reported in literature for
different Fe-Si alloys and much higher pressures, yields a reasonable agreement (e.g.,
Kuwayama and Hirose, 2004; Kuwayama et al., 2009; Asanuma et al., 2010; Morard et
al., 2011; Fischer et al., 2013).
A change in the melting curve at a pressure above approximately 5 GPa (Figure 4.4) was
observed. This behaviour is well known in Fe and Fe-alloys, and it is attributed to the
structural change associated with the presence of the triple point (δ-γ-liquid) at 5.2 GP
(Sanloup et al., 2000a, 2011; Terasaki et al., 2010; Shimoyama et al., 2013; Shibazaki et
al., 2015; Silber et al., 2018).
Figure 4. 4: The melting curve of Fe-4.5Si compared with that of pure Fe (Silber et
al., 2018). The change in slope of melting line is clearly seen in both Fe-4.5Si and
pure Fe at ~5 GPa indicating the presence of triple point. The presence of this
observed phase transition in Fe-4.5Si is analogous to δ-γ-liquid in pure Fe.

106
4.4.3. The Electrical Resistivity of liquid Fe-Si Along the Melting Boundary
The most remarkable observation in this work is that ρ of Fe-4.5Si remains invariant at
~120 μΩcm from 3-9 GPa along the melting line (Figure 4.5). This value of ρ is almost
identical to that of pure liquid Fe (within uncertainties) above 6 GPa (Figure 4.5). This
behaviour is unexpected as it violates Matthiessen’s rule. That is, the additional resistivity
arising from the impurity (Si solute) component that Matthiessen’s rule predicts is not
observed.
Figure 4.5: Electrical resistivity of Fe-4.5Si along the melting boundary (3-9 GPa)
compared with that of a pure Fe. For Fe-4.5Si, ρ remains constant (within
experimental uncertainties) at the onset of melt and in specified P range. Electrical
resistivity of Fe-4.5Si diverges from pure Fe from 3-5 GPa and matches ρ of liquid
Fe at P ≥ 6 GPa.

107
Figure 4.5 shows that ρ of pure Fe along the melting boundary starts at a higher value at 3
GPa and decreases steadily toward the δ-γ-l triple point at ~ 5.2 GPa, after which it
remains constant at ~120 μΩcm. On the other hand, the ρ of liquid Fe-4.5Si remains
constant (~120 μΩcm) throughout the full experimental pressure range along the melting
boundary. The divergence between the electrical resistivity of liquid Fe and Fe-4.5Si
along the melting boundary prior to ~5.2 GPa can be, in part, attributed to the effect of
the parent solid phase on the initial structure of liquid (Silber et al., 2018). Prior to
reaching the triple point, Fe melts from the bcc phase, while after the phase transition, it
melts from the more energetically preferred fcc phase.
However, this explanation is not sufficient to account for the ρ behaviour of Fe-Si along
the melting boundary as it is assumed that it melts from the mixed phase. It is well
understood that solid Fe undergoes the phase transition near melting from bcc to fcc
phase at 5.2 GPa. Despite the fact that the presence of Si stabilizes the bcc structure of Fe
(Cote et al., 2008) and subsequently affects the behaviour of liquid, it does not explain
the observed ρ along the melting line since Fe melting from a bcc structure shows
decreasing resistivity along the melting boundary. This suggests the existence of a more
subtle mechanism that acts on the atomic scale and modulates the behaviour of charge
carriers as discussed later.
For illustrative purposes, the calculated κ of Fe-4.5Si is shown in Figure 4.6a, and
contrasted with the κ of pure Fe in Figure 4.6b (Silber et al., 2018).

108
Figure 4.6: (a) Thermal conductivity of solid and liquid Fe-4.5Si at pressures 3-9
GPa. For comparison, κ of pure solid and liquid Fe (b), plotted against values of κ
obtained at atmospheric P (Ho et al., 1972; Nishi et al., 2003).

109
4.4.4. EMP and Sectioned Samples
The EMP results are shown in Figure 4.7. The most relevant observation was that there
was negligible contamination due to diffusion at melting (Figure 4.7b). This is important
since the main goal was to measure ρ of Fe-Si along the melting boundary. The presence
of only very limited surface diffusion of W (Figure 4.7b) in the samples at the melting
point adds confidence in our ρ measurements along the melting boundary. No appreciable
diffusion from the container into our samples was detected at the melting points. It should
be also noted that no W diffusion is detected throughout the full temperature range in
solid Fe-4.5Si due to very short exposure times to high temperatures. This is completely
consistent with the earlier observations made in pure Fe (Silber et al., 2018).
However, higher temperatures and longer exposure times promote a higher rate of W
diffusion into liquid Fe-Si samples. This is shown in Figures 4.7c and 4.7d, where the
gradual progress of diffusion can be seen with rising temperature which also requires
long duration in the liquid state. While this reduces confidence in our ρ data measured at
temperatures far above the melting line, lack of diffusion ensured that ρ data close to the
melting boundary was on pure Fe-4.5Si.
Figure 4.8 illustrates the preserved geometry of the Fe-4.5Si samples used in this study.
These were compressed to pressures 3-9 GPa and heated to temperatures significantly
above the melting point. The recovered geometries were examined and compared with
the dimensions of the initially prepared sample. Indeed, the recovered geometries were
used to calculate the ρ via Pouillet’s law. It is important that the recovered sample
dimensions exhibit only negligible divergence from the original pre-compressed
dimensions. However, these limited and almost negligible differences (within the
uncertainty in the measured length) were accounted for in the final error calculation.

110
Figure 4.7: The results of EMP-WDS analysis on (a) the starting sample of Fe-4.5Si,
and at 3 GPa at (b) the melting point, (c) 1950 K, and (d) 2100 K.

111
Figure 4.8: The preserved geometry of the Fe-4.5Si samples used in this study.

112
4.5. Discussion
4.5.1. The Effect of Si on Electrical Resistivity of Fe-4.5Si
The anomalous behaviour of ρ of solid Fe-4.5Si has been observed for different Si
contents in early studies (Yensen, 1915; Baum et al., 1967; Numakura et al., 1972;
Nishino et al., 1993) and has been considered in terms of electron scattering of ordered-
disordered phases. I confirmed earlier observations of initial peak and followed by
decreasing electrical resistivity in the lower temperature range just above Curie
temperature. However, above TC, a strong temperature dependence and variability of ρ of
solid Fe-4.5Si is observed, which leads to the question the validity of Matthiessen’s rule
at high temperatures. This conclusion is further corroborated when considering a
dramatic change in ρ at the inferred phase changes (Figures 4.2 and 4.3). The limited
validity of Matthiessen’s rule was also recognized in recent studies (Gomi et al., 2013,
2016; Gomi and Hirose, 2015; Ohta et al., 2016; Zhang et al., 2018b). This is not
unexpected, as there is an appreciable deviation from Matthiessen’s rule of the electrical
resistivity of Fe-Si solid solutions even at low temperatures above 30 K (Schwerer et al.,
1969). Additionally, it was recognized in recent studies that Si impurity in Fe alloy at
very high temperatures has only a very limited effect on ρ (e.g., Gomi et al., 2016; Ohta
et al., 2016; Zhang et al., 2018b and references therein). For example, Gomi et al. (2013)
reported that increasing the experimentally measured resistivity at ambient temperature
by factor of 2 reduces the predicted CMB thermal conductivity value by only 5%.
Furthermore, the observed variability of ρ of solid Fe-4.5Si as a function of temperature
and phase transitions, places a significant uncertainty in electrical resistivity of Fe-alloys
at high temperatures that may be sought using the linear Bloch–Grüneisen formula.
In terms of the onset of the first solid-solid phase change which takes place at
temperature corresponding to the melting line of Si, and consequently decreases with
increasing pressure (Figures 4.2 and 4.3), it is useful to take a look at some fundamental
properties of liquid Si. Moreover, these properties of Si are also important in
understanding the behavior of ρ of liquid Fe-4.5Si.

113
Pure liquid Si has entirely different properties from the solid crystal, such as coordination
number that changes from 4 in solid (with the diamond structure) to ~6 in the liquid state
(Waseda and Suzuki, 1975; Gaspard et al., 1984). At the onset of melting, Si becomes
denser as indicated by the negative dTmelt/dP slope (Hu and Spain, 1984; Kimura and
Terashima, 1997) and assumes a metallic character, with resistivity 13 orders of
magnitude less than at its peak in the solid. From the 1 atm melting point at about 1689 K
(Glazov and Shchelikov, 2000), ρ (~72 μΩcm) has a negative temperature coefficient of
resistivity, where ρ slightly decreases up to about 1823 K, after which it changes slope
and begins to increase slowly. This decrease in ρ in the initial Si melt also coincides with
a reduction in viscosity (Sasaki et al., 1995). This behavior is considered to be an effect
of changing structure in the liquid. In principle, molten Si has properties analogous to
those of molten metals. Thermal expansion of molten Si near its 1 atm melting T is on
order of most molten metals (~1·10-4
K-1
) (Sato et al., 2000), while in the solid state Si
shows small thermal expansion coefficient, in comparison with metals.
In the pressure region 11.2-12.5 GPa, Si is meta-stable where both simple cubic and body
centered tetragonal (bct) β-Sn II structures coexist. At 12.5 GPa, Si enters a phase region
with only a bct β-Sn II structure, which is also coincidently metallic with similar
electrical resistivity as the liquid and having strong d-orbital character (Biswas and
Kertesz, 1984; Hu and Spain, 1984). The coordination number of solid bct β-Sn II
structure is similar to the liquid and the addition of 2 more neighbors compared to the
simple cubic structure is responsible for different energy level ordering that exists in that
structure. Higher pressure brings the onset of metastable phases followed by stable
phases after 16 GPa (e.g., Funamori and Tsuji, 2002). Interestingly, the pressure of 12.5
GPa is relatively close to the pressure at which Fe transforms from the bcc to hcp
structure at room temperature.
In the same context, it is important to emphasize that S and C (as potential light element
candidates in the Earth’s core) have negative temperature coefficients of resistivity at
melting at 1 atm, and C becomes completely metallic with ρ around 30 μΩcm (e.g.,
Vezzoli, 1972; Heremans et al., 1988). The implication of this will become clear in the
next section.

114
Counterintuitively, the melting temperature of Si decreases with pressure up to the
transition to β-Sn II, after which it starts to increase (Bundy, 1964). Moreover, after the
onset of melting, liquid Si is characterized by the presence of local structures in the melt
(e.g., Waseda et al., 1995). Finally it should be emphasized that liquid Si also undergoes
pressure induced structural changes (Funamori and Tsuji, 2002; Kubo et al., 2008). The
noteworthy property of liquid Si is that Wiedemann-Franz law holds reasonably well
(Magomedov and Gadjiev, 2008).
We can now try to understand the nature of the observed phase transition in Fe-4.5Si
from disordered to ordered phase (Figure 4.2) and examine the effect of Si on the
structural changes in solid Fe-4.5Si and corresponding effect on electrical resistivity. The
fact that the Si melting curve coincides with the first phase change after TC does not
imply the presence of partial melt in the Fe-4.5Si alloy. However, at that transition
temperature, Si attains metallic character and also increases its coordination number,
which results in further modification and hybridization of the bonding arrangements with
Fe (e.g., Gu et al., 2004). As a result, a transition to a more ordered phase takes place (fcc
from 6-9 GPa and mixed phase from 3-5 GPa). Consequently, ρ dramatically decreases
and Fe-4.5Si almost assumes the same character as fcc-Fe as shown by its approach to
and eventual overlap with the resistivity of fcc Fe, which can be seen in Figures 4.1 and
4.2. Nevertheless, this explanation is not complete and requires full theoretical treatment
which is beyond the scope of this study.
In terms of the phase transition observed just before melting at pressures 6-9 GPa, it is
interpreted as a mixed phase. In-situ X-ray diffraction data are needed to resolve fully
this structure.
Moreover, the unusual behaviour of Si, both at melting and in the liquid state, is likely
responsible for the peculiar absence of larger discontinuity in ρ of Fe-4.5Si upon melting.
It can be reasoned that the thermal expansion of Fe-4.5Si is significantly suppressed on
melting (likely due to the fact that presence of Si in Fe-alloys reduces nearest neighbor
distances in liquid), thus reducing the typical ρ signature associated with the first order
phase transition. Interestingly, at 3 GPa, ρ of Fe-4.5Si at melting exhibits a slight dip. For

115
4 and 5 GPa, there is only a slight discontinuity in otherwise continuous trend in ρ. The
surprising aspect of this behaviour is that it has been generally attributed to Fe-Si alloys
with a significantly higher Si content (Baum et al., 1967). While this observation was
verified through multiple experiments, more theoretical and experimental work is
required to fully understand the melting dynamics of a Fe-alloy with low Si content.
Finally, discussion is needed on the phase transition associated with Fe and its alloys at
~5.2 GPa (e.g. well known in Fe-Si and Fe-C alloys) which is also detectable in the liquid
state (e.g., Sanloup et al., 2011; Shimoyama et al., 2013). The analogous structural
change in Fe-4.5 Si at ~5.2 GPa is easily observed in the behavior of the melting line.
This is likely a result of the structural transition in solid. This transition, well recognized
in solid and liquid pure Fe on the basis of behavior of the temperature coefficient of
resistivity (Secco and Schloessin, 1989) and Fe alloys, affects physical properties such as
density, viscosity, compressibility and sound velocity (Sanloup et al., 2000b, 2002, 2004,
2011; Terasaki et al., 2010; Shimoyama et al., 2013; Shibazaki et al., 2015; Lai et al.,
2017). On the other hand, it should be noted that the evidence for such a transition is not
observed in ρ along the melting boundary, which remains constant. It was noted earlier
that addition of even a small amount of Si stabilizes the bcc structure and reduces the
nearest and second neighbor distances in liquid (e.g., Shibazaki and Kono, 2018).
However, this fact alone is insufficient to address this observed behavior of the liquid.
This suggests that liquid Fe-4.5Si just above the melting boundary does not change
structurally around 5.2 GPa in a way to affect the electrical resistivity of the melt. Indeed,
this is expected considering that the additional phase change (in the liquid) at the already
existing triple point is thermodynamically forbidden. That is, of course, if one assumes
that Fe-4.5Si behaves similarly to pure Fe or even Fe-C alloy which indeed exhibit
structural changes around 5.2 GPa. Conversely, invariant ρ of liquid Fe-4.5Si implies the
existence of short and perhaps medium range order liquid structures along the melting
boundary, which impose a control mechanism on the behaviour of ρ. This conclusion
agrees well with the earlier studies which used X-ray diffraction and numerical
simulations to demonstrate the existence of a local structure in liquid Fe-Si, generally
detected by the appearance of the shoulder in the first peak in the experimentally

116
measured total structure factor S(Q) (e.g., Roik et al., 2014 and references therein). Thus,
in order to understand the electrical resistivity of liquid Fe-4.5Si along the melting
boundary, and potential implications of such behavior on the dynamics of the Earth’s OC,
it is important to understand the nature of those local structures in the liquid.
Understanding the dynamics of the local structures with short and medium order in liquid
alloy is an important step toward resolving their impact on electrical resistivity and by
extension, thermal conductivity of the Fe-alloys at core conditions.
Alternatively, one might seek an explanation for invariant ρ along the melting boundary
of Fe-4.5Si in terms of electrical resistivity saturation (thermal, chemical or pressure
induced) (e.g., Gomi et al., 2013, 2016; Gomi and Hirose, 2015). The saturation effect
does not hold for the results in this study, as there is a steady increase of the electrical
resistivity in the liquid alloy with increasing temperature and at all experimental
pressures. Thus, it is important to examine the role of local structures in liquid. Before
that, we need to reflect on some fundamental properties of liquid transition metals. The
familiarity with those properties will be helpful later in understanding the prevalence and
dynamics of short and medium range order in molten transition metals.
4.5.2. Electronic Structure of Liquid Transition Metals and Alloys
Despite a long history of scientific inquiry, the structure and dynamics of liquid metals
were relatively poorly understood until the turn of the 21st century, when the availability
of computational power and improved theoretical methods significantly improved our
understanding of these systems (e.g., Li et al., 2017). The classical view of liquid metals
suggests that the electrons may be characterized as if they are free particles and their
quantum states are not dominated by coherent diffraction from a typical highly ordered
lattice structure that exists in solid metals (Ziman, 1970; Mott, 1972). In simple terms,
liquid metals possess no long range order, which strongly affects the behavior of ρ. The
scattering of charge carriers in liquid transition metals is still somewhat of a mystery, and
no current theoretical and numerical tools can account for the invariant electrical
resistivity of liquid Fe, Ni, and Co along the melting boundary (e.g., Silber et al., 2017,
2018; Ezenwa and Secco, 2017). It is generally accepted that the mean free path of an

117
electron in a liquid metal depends on scattering by the “ions” (Ziman, 1961). Another
scattering mechanism involves density fluctuations of the liquid (Ziman, 1961; Faber and
Ziman, 1965). Furthermore, Mott (1972) suggested different mean free paths for the
faster and lower effective mass and the slower and higher effective mass d conduction
electrons in liquid transition metals where s electrons are considered to undergo s-d
transitions.
Early experimental and theoretical investigations demonstrated that the electron density
of states (DOS) of liquid transition metals Fe, Ni and Co, while losing the presence of
sharp peaks, exhibits a remarkable similarity to the electronic structures of the crystalline
metals (Jank et al., 1991). The electronic DOS of liquid transition metals clearly shows
characteristic bonding- antibonding splitting in the d-band. This bonding-antibonding
splitting is larger for the metals with a partially filled d-band, such as Fe, and the same
behavior is evident in both solid and liquid (Jank et al., 1991). In 3d liquid transition
metals, the d-electrons are also responsible for such low compressibility and internal
pressure anomalies (e.g., Steinemann and Keita, 1988), as well as strong cohesion and
high melting points in 3d transition metals (Janak and Williams, 1976).
There are strong parallels between pure liquid Fe and liquid Fe-alloys, especially those
with low solute concentrations. For example, Gu et al. (2004) calculated electronic
structures of molten Fe-Si alloys and showed that the interaction of Fe-Si atoms
originated from the hybridization of the Fe 3d and Si 3p bands. The calculated bond
strength in Fe-Si alloys demonstrates that the Fe-Si bond is stronger than the bond
between Fe atoms (Gu et al., 2004). Calculations by the same authors also confirm that
the Si atoms form bonding and anti-bonding states with neighboring Fe atoms. This is
one of the key points to understand the formation and dynamics of the local structures in
the liquid Fe-Si alloy with short or medium range order, which will be discussed in the
next section.
Additionally, liquid metals have spherical Fermi surfaces because the medium is isotropic
(Mott, 1972). Pressure application causes a reduced interatomic distance which is
inversely proportional to the parameters in inverse space such as Fermi wave vector (kF).

118
Consequently, compression results an increase in area of the spherical Fermi surface
(Venttsel et al., 1974; Vinokurova et al., 1979; Gapotchenko et al., 1988). This is one of
the mechanisms responsible for a decrease in ρ in solid metal with increasing pressure. A
characteristic feature of 3d liquid transition metals is the hybridized s-d valence electron
states. While it is well understood that the electrical resistivity of molten 3d transition
metals is strongly modulated by charge carrier scattering and s-d hybridization (Mott,
1972; Ballentine et al., 1984), there is currently no established theoretical framework that
could account for the behavior of ρ of liquid Fe-4.5Si (or even pure Co, Ni and Fe) along
the melting boundary.
Next, I discuss short and medium range ordering in liquid transition metals and alloys
that is responsible for the invariant electrical resistivity of liquid Fe-Si as well Fe, Ni and
Co along the melting boundary. To the best of my knowledge, this approach has not been
considered previously in the context of electrical resistivity of liquid transition metals and
alloys at high pressure.
4.5.3. Short and Medium Range Ordering In Liquid Transition Metals and Alloys
The presence of an icosahedral short-range order (ISRO) (with the fivefold symmetry) in
melts was first postulated by Frank (1952) to explain the observed large undercooling of
pure metals. Typically, ISRO clusters consist of 12 atoms with fivefold symmetry on the
outside, surrounding the additional atom in the center of the structure. These structures
have the same coordination number as the fcc or hcp close packed structures in transition
metals, and interact via Lennard-Jones potential. Considering that natural systems adopt a
structure with the lowest energy state, it is not surprising that these structures have energy
that is 8.4% lower than that of the close-packed arrangements in solid (fcc or hcp) and
thus lower the overall energy of the liquid. This was indeed predicted by Frank (1952).
However, these structures were not observed experimentally and numerically in liquid
transition metals (e.g., Fe, Ni, Zr) until much later (e.g., Schenk et al., 2002; Lee et al.,
2004). Typically, ISROs are identified from analysis of liquid structure factor. The
presence of a shoulder on the right-hand (high wavenumber) side of the second

119
oscillation is indicative of the presence of a fivefold structure (Schenk et al., 2002). These
short range clusters may also take different combinatorial geometries, based on the
composition of the material from which melt originates (Schenk et al., 2002; Lee et al.,
2004). Schenk et al. (2002) noticed that more complex and more densely packed
geometry (e.g., a dodecahedron which consists of 33 atoms and can be constructed from
aggregates of icosahedral clusters) appears at increasing pressure.
An icosahedral topological short-range order is an ubiquitous component in all liquid 3d
transition metals (e.g., Schenk et al., 2002; Zigo et al., 2018). The main reason for such a
behavior is that the presence of short and medium range order and distinct atomic clusters
with fivefold symmetry in transition metals is considered to be a result of strong
directional bonding from incomplete d bands and these form local structures in the liquid
(e.g., Burdett, 1995). The phenomenon may be interpreted in terms of a Peierls-Jahn-
Teller distortion in which a system is stabilized by removing the degeneracy of levels,
forming localized bonds, and lowering the energy (Jahn and Teller, 1937; Ross et al.,
2007). Thus, it is evident that the formation of those structures in the melt favours 3d
transition metals and alloys with similar electronic structures (Schenk et al., 2002; Lee et
al., 2004). The underlying mechanism is the hybridization of the p-like valence and d-like
conduction states associated with the formation of ISRO clusters (Boehler and Ross,
2007). This is consistent with other studies which showed that a close relation between
atomic and electron structure of liquid metals and alloys exists (e.g., Il'inskii et al., 2002)
and that it depends on the electron structure of the substance. The specific properties of
the atomic structure of the Fe–Si alloys in the liquid state (formation of the clusters, their
composition, atomic packing and range of the existence) is considered to be a function of
their electron structure (Il'inskii et al., 2002).
For an alloy which consists of the majority of atoms with a larger atomic radius (e.g., Fe)
and smaller concentration of alloyed atoms with the smaller radius (e.g., Si), an ISRO
topological SRO different from ISRO may be present for geometric reasons (Holland-
Moritz et al., 2006). However, the presence of ISROs is preferred in liquid transition
metals or alloys, regardless of whether or not the radii of atoms are similar or appreciably
different. As indicated by Holland-Moritz et al. (2006), a small concentration of smaller

120
atoms in a system of larger atoms is likely to stabilize icosahedral clusters. This is
because for a typical icosahedron, the interatomic distance between the atoms on the
surface is approximately 5% larger than the distance between the surface atoms and the
central atom. Consequently, an icosahedron structure with a smaller atom in the center is
energetically favorable. This very strongly suggests that presence of not only Si, but also
that of C, O, and S may be favored in ISRO structures in the liquid Fe alloy, especially at
high pressure. Therefore it is reasonable to predict that liquid Fe, alloyed with small
contents of C, S or O, and perhaps any combination thereof, will exhibit the same
behavior as Fe-4.5 Si. Correspondingly, ISRO structures were observed in binary and
ternary alloys such as Fe78Si9B13 (e.g., Qin et al., 2004; Li et al., 2017).
The presence of local structures in liquid Fe-Si alloys with short and medium range order
has been observed with different interpretation (e.g., Il'inskii et al., 2002; Gu et al., 2004;
Qin et al., 2004; Mizuno et al., 2013). Coincidently, the existence of local structures in
the melt is well established in liquid Si (e.g., Roik et al., 2014 and references therein).
Roik et al. (2014) examined the atomic structure of the Fe-Si melts by X-ray diffraction
and Reverse Monte Carlo simulations. They reported the presence of both short-range
order (i.e., ISROs) as well as medium range order (MRO) in the liquid Fe-Si alloys. The
high Si content in the liquid alloy promotes the presence of MRO structures. That was
also shown by Mizuno et al. (2013) who reported that MRO increases with increasing Si
content. MRO structures in liquid Fe-Si alloys, attributed to the presence of a Fe-centered
clusters, are typically inferred from the presence of the pre-peak in structure factor
(asymmetry or at best a shoulder rather than clear splitting in the first peak) (Roik et al.,
2014; Mizuno et al., 2013). Indeed, the authors demonstrated the existence of poly-
tetrahedral aggregates with a pentagonal symmetry (i.e., icosahedron), analogous to
ISROs in liquid 3d transition metals (Roik et al., 2014). It is also important to note that
liquid Fe-Si alloys retains an overall Fe-like structure if the Si content is below ~38wt%
(Roik et al., 2014).
The liquid Fe-Si alloy is characterized by strong interaction between Fe and Si atoms (Gu
et al., 2004). That interaction between Fe and Si is indeed stronger than the interactions
between Fe-Fe or Si-Si (Roik et al., 2014). Correspondingly, the calculated electronic

121
structures of molten Fe-Si alloys indicate that the interaction of Fe-Si atoms originates
from the hybridization of Fe 3d and Si 3p bands (e.g., Roik et al., 2009, 2014). The Si
atoms form bonding and anti-bonding states with the neighboring Fe atoms, and the Fe-Si
bond is stronger than the bond between Fe atoms. The increase in Si content and
structural modification of Fe-Si alloy affects the distribution of Fe 3d, Si 3s and 3p
orbitals. Roik et al. (2014) also demonstrated that the local atomic order in Fe-Si melts
exhibits similarity to that in the parent crystalline phase which is characterized by a
strong preference for hetero-atomic nearest-neighbor bonds. This agrees with the
argument presented in Silber et al. (2018) which suggests that the structure of solid parent
phase has a strong influence on the behavior (and structure) of metallic liquid at high
pressures in the vicinity of the melting point. Indeed, earlier research (e.g., Hafner and
Kahl, 1984 and references therein) show that the structures of the elements in the liquid
state follow characteristic trends which closely resemble the trends of the crystal
structures of elements.
The presence of ISRO persists to temperatures significantly above the melting boundary.
This was demonstrated recently when ISRO were observed in liquid Ni, 100 K above the
melting temperature (Lee et al., 2004). The five-fold symmetry is incompatible with the
long-range periodicity, so the poly-tetrahedral short-range order favors the disordered
structures such as in the liquid transition metals (Li et al., 2017)
There are two important aspects of ISRO which are related to this study. First, the
presence of ISRO increases the viscosity of the melt, because those structures act toward
dynamical slowing down of atomic motion within the liquid required for momentum
transfer (Lü et al., 2017; Hu et al., 2015). This was again demonstrated recently by Hu et
al. (2017) who examined the effects of pressure on the ISROs. They showed that
isothermal compression of the melt with ISROs slows down the dynamics of metallic
liquid which implies an increase in viscosity. This has been seen in both DAC and shock
experiments at pressures corresponding to the OC conditions (e.g., Boehler and Ross,
2015). Depending on the P and T, the connected clusters of ISROs of varying sizes and
number density may evolve throughout the liquid (Jónsson and Andersen, 1988). In terms
of viscosity of the OC, this interpretation agrees well with earlier studies which suggested

122
high viscosity of the OC alloy (Anderson, 1980; Stevenson et al., 1983; Palmer and
Smylie, 2005; Smylie, 1999).
Second, the application of pressure increases the ISRO concentration as well as viscosity
(Boehler and Ross, 2007, 2015). ISRO formation is favoured by application of pressure
in the liquid because compression squeezes out “free volume,” which leads to denser
packing of ISRO local structures (Hu et al., 2017). The concentration of ISRO structures
increases with pressure as a result of the pressure- induced modification of s-d bands and
s-d electron transfer (Boehler and Ross, 2015). Notably, ISRO structures with the five-
fold symmetry are significantly denser than the surrounding liquid consequently
introducing local density anomalies throughout the melt. As noted earlier, this affects the
electrical resistivity of the liquid because it decreases the mean free path of electrons and
consequently increases their scattering rate. This is discussed in the next section.
The presence of ISROs is also considered to be responsible for the lowering the transition
metal melting slopes as demonstrated by Ross et al. (2007). Not surprisingly, the
underlying mechanism is the hybridization of the p-like valence and d-like conduction
states associated with the formation of ISRO clusters (Boehler and Ross, 2007).
4.5.4. Implications of ISROs for Electrical Resistivity
I now examine the effect of ISROs on the invariant ρ of Ni, Fe along the melting
boundary observed by Silber et al. (2017, 2018), and Fe-4.5 Si in this study. The
implications for other Fe-alloys are also discussed. It should be noted that this is the first
time that the effect of ISRO structures has been examined in the context of electrical
resistivity of liquid transition metals and alloys at high pressure. Of course, it is essential
to emphasize again that currently there is no theoretical framework that would account
for the impact of ISRO structures on the ρ of a molten metal or alloy, especially at
increasing pressure. Thus, I offer a qualitative explanation as more theoretical and
experimental work is needed to quantitatively and fully resolve the contribution of ISROs
scattering mechanisms and exact dynamics of their interaction with the charge carriers in
liquid transition metals.

123
The effect of these structures in liquid transition metals and alloys on the observed
behavior of ρ along the melting curve can be best described in conceptual terms as
follows. ISROs act as the scattering centers throughout the melt. Thus, the presence of
ISRO in the liquid reduces the mean free path and increases electron scattering. This
implies that a higher concentration of ISROs promotes increase in ρ of the liquid
transition metal. Consequently, the application of pressure increases the concentration of
ISROs, which in turn would be expected to increases ρ.
This qualitative interpretation would lead to continuous increase in electrical resistivity
with pressure (as pressure promotes the growth of ISRO) and that is not observed. That is
primarily because the increase in pressure reduces the amplitude of ionic motion,
modifies bonding arrangements, increases the overall state of order and by extension
reduces the electron scattering. Moreover, the application of pressure increases the area
of the spherical Fermi surface in liquid metals which means that charge carriers
experience reduced scattering due to smaller density of states above Fermi level. This in
turn promotes the antagonistic reduction of electrical resistivity with respect to ISROs
effect. Our experimental results show that these competing effects appear to offset each
other on the P- and T-dependent melting boundary. This mechanism is illustrated using
the simple equation for electrical conductivity (inverse electrical resistivity) from Mott
(1972, 1980):
𝜎 = 𝑆𝐹𝑒2𝐿/12𝜋3ћ (4.1)
Here, SF is the area of the Fermi surface, e is electron charge, L is electron mean free
path, and ћ is the Planck constant divided by 2π. It is evident that electrical conductivity
depends on the size of the Fermi surface (a sphere in the case of liquid metals) and the
mean free path. Thus, if the electrical resistivity is to remain constant along the melting
boundary, it is required that the product of the length of electron mean free path and the
area of the Fermi spherical surface remains constant.
As discussed above, considering the effect of pressure, this can be done if the pressure
dependent ISRO structures reduce electron mean free path and increase scattering. This is
in addition to the effects of temperature (increases the kinetic energy of the system and

124
causing thermal expansion) along melting boundary which increase ρ. Equation (4.1)
implies that the pressure induced increase of the area of Fermi sphere surface has to
match proportionally the decrease in electron mean free path. Of course, an increase in
the Fermi surface area is accompanied by a transition of the system to a dynamically
“more orderly” state which counters the effects of ISROs and reduces the ρ. The net
result of these antagonistic effects modulating ρ is the invariant electrical resistivity along
the melting boundary as observed in our experiments.
Although only a crude approach to a far more complex phenomenon, Equation (4.1)
shows the opposite effects of pressure on electron mean free path and Fermi surface area.
A comprehensive theoretical interpretation of the interplay between ISRO and
temperature induced higher rate of electron scattering, as well as the suppressed
amplitude of ionic motion, and decreased scattering of electrons above increased Fermi
level, and quantitative assessment of their relative contributions, is beyond the scope of
this work.
However, the constant resistivity of Ni, Fe and Co observed along their melting
boundaries (Silber et al., 2017, 2018; Ezenwa and Secco, 2017) is clearly consistent with
this postulate. Further support for this reasoning comes from consideration of the
behavior of electrical resistivity of liquid Cu, Ag and Au on their melting boundaries.
These noble metals all have a filled 3d-band and consequently, in contrast to liquid Fe,
Co and Ni, the local ISRO structures are almost absent in these liquids (Ganesh and
Widom, 2006, 2008). This indeed explains the decrease of ρ along the melting boundaries
of these three metals, as observed experimentally by Ezenwa et al. (2017), Littleton et al.
(2018) and Berrada et al. (2018), respectively. In the context of Eq (4.1), the increasing
size of the Fermi surface, tending to decrease resistivity, is not offset by a corresponding
decrease in electron mean free path because of the lack of ISRO scattering centers.
The reasonable question now is: can the invariant electrical resistivity of Fe and Fe-alloys
along the melting boundary remain unchanged beyond the γ-ε-liquid triple point at about
100 GPa?

125
Several factors strongly support this supposition. The first is the energy consideration.
The energy of fcc (γ) and hcp (ε) structures is almost identical. This implies that the
liquid originating from both fcc and hcp parent phase will experience almost the same
decrease in energy associated with the formation of ISRO structures in the liquid state
and hence have the same structural and dynamical properties. This suggests an
uninterrupted and steady growth in ISRO concentration in the liquid with increasing
pressure across the γ-ε-l triple point. Such trend will persist uninterrupted beyond the γ-ε-
liquid triple point as a result of energy consideration between solid parent phase and the
liquid along the melt boundary. Higher concentration of ISROs suppresses the decrease
in electrical resisitvity (ordinarily attributed to pressure application) by increased charge
carrier scattering. Consequently, this favours invariant electrical resistivity across triple
point and along the melting boundary of Fe and Fe-alloys. However, it should be
emphasized for the purpose of clarity, that the γ-ε-liquid triple point Fe alloyed with light
elements may not have the same P-T coordinates as for pure Fe.
I also note that the coordination number for fcc and hcp structures is identical at 12. This
fact also indicates that the ISRO structures in the liquid originating from either phase will
be structurally the same (as 12 coordinated ISROs in the liquid seek the densest packing
resembling the packing in the solid parent phase). Next, the electronic density of states is
considered. For fcc and hcp solid phase (e.g., Lizárraga et al., 2017), density of states is
almost identical, which implies that such strong similarity is carried into the liquid.
Moreover, such resemblance ensures the very close scattering properties in liquids
originating from both structures. This consequently implies identical electrical resistivity
in the liquid originating from both solid parent phases.
4.5.5. Thermal Conductivity of the Outer Core
I take the ICB as an anchoring point where Fe/Fe-alloy freezes out onto the IC and
propose that ρ of liquid Fe-alloyed with light elements remains unchanged from the value
(~120 μΩcm) obtained in this study and earlier studies (Silber et al., 2018). At the CMB,
the situation is certainly more complicated considering the uncertainty in temperature
related to the deviation of the temperature gradient from the adiabat (e.g., Davies, 2015).

126
That uncertainty in temperature may be mitigated by considering resistivity saturation
(Gomi et al., 2013, 2016; Gomi and Hirose, 2015). Taking into account the uncertainty in
temperature at the CMB, I agree with these authors that the electrical resistivity of liquid
Fe-alloy (whatever the combination may be) may not exceed ~150 μΩcm.
Assuming that the Wiedemann–Franz law (κ = LT/ρ) holds at the CMB and ICB
conditions, which is predicated on minimal role of the inelastic electron scattering is
negligible at the core conditions (e.g., Williams, 2018), I can then evaluate κ at the ICB
and at CMB using the Sommerfeld value (2.445x10⁻⁸
W2/K
2) of the Lorenz number. On
the outer core side of the ICB, κ is estimated to be 112 – 122 Wm-1
K-1
relying on the
current uncertainties in ICB temperatures (5500-6000 K) (e.g., Anzellini et al., 2013). On
the core side of the CMB, κ is estimated to be between 65 and 73 Wm-1
K-1
assuming the
temperature at the CMB is in the range 4000-4500 K (e.g., Badro et al., 2014; Zhang et
al., 2016b) and ρ of ~150 μΩcm. These estimates are in a reasonable agreement with the
lower end of the recent theoretical and experimentally obtained values (e.g., Pozzo et al.,
2012, 2013; de Koker et al., 2012; Seagle et al., 2013; Gomi et al., 2013,2016; Gomi and
Hirose, 2015).
Comparatively, the κ values derived here are also in a reasonable agreement with
estimates of thermal conductivity at the CMB based on models of heat flow through the
CMB (e.g., Olson, 2016; Davies, 2015; Davies et al., 2015; Gubbins et al., 2015).
It should be emphasized again that the calculated values of thermal conductivity are
based on the assumption that the value of the Lorenz number is valid up to core pressures
and temperatures. However, that may not be the case, as discussed by Williams (2018)
and Pourovskii et al. (2017). At the core conditions, Pourovskii et al. (2017) calculated
that the Lorenz number would be appreciably lower (up to ~0.65L0), thus lowering the
value of thermal conductivity calculated from the resistivity values.
As indicated earlier, ISROs, similar to impurities, will act as independent scattering
centres for the conduction electrons. Nevertheless, the question is: can the presence of
ISROs affect the value of the Lorenz number at core pressure and temperature in Fe-
alloys? The answer is likely yes! The scattering by ISROs and their clusters (a system of
127
connected ISROs) may behave analogously to the scattering by impurities in metals as
they are likely to disrupt the phase of electron wave, and also disrupt the electrons
coherent propagation (Giuliani and Vignale, 2005).
That analogy however has serious implications, as it is known that impurities in some
cases cause inelastic electron scattering that preserves charge but not the energy (Taylor,
1962; Koshino, 1963; Giuliani and Vignale, 2005). In a liquid Fe-alloy containing ISRO
structures at the core conditions, inelastic scattering from ISROs could result from the
presence of local magnetic moments and spin scattering within those structures, which is
in line with the discussion by Drchal et al. (2017). The ISRO structures in the melt, due to
their densely packed order relative to the rest of the liquid, will affect the magnitude and
the consideration of potential experienced by the electrons (e.g., Faber, 1972). In
principle, the ISRO-induced localized potential experienced by a conduction electron is
significantly greater than the averaged potential by thermally oscillating ions in liquid.
Moreover, the concentration and distribution of ISROs and the size of ISRO clusters will
affect the screening consideration similar to impurities in solid metals (e.g., Abrikosov,
2017).
If inelastic electron-electron scattering is appreciable as a result of presence of ISROs in
Fe alloys at the core conditions, it can then decouple heat transport from charge transport
(Williams 2018). Thus, ISRO-caused inelastic electron scattering would render the
currently used Wiedemann-Franz scaling law between electrical and thermal conductivity
very inaccurate (e.g., Williams, 2018). Indeed, that effect will be likely amplified by not
only isolated ISRO structures, but also by connected clusters at a high pressure.
While inelastic scattering does not affect the overall electrical resistivity (e.g., Taylor,
1962,), it affects the value of thermal conductivity (Williams, 2018). This indeed is likely
to explain a recent directly observed low value of thermal conductivity of Fe at near the
core conditions (e.g., Konôpková et al., 2016) as their measurements were taken in the P-
T space that corresponds to the deeply undercooled state of Fe with the maximum
concentration of ISROs and potentially highest rate of inelastic electron scattering.
Admittedly, more experimental and theoretical work is needed to resolve this uncertainty.

128
4.5.6. General Implications for Core Evolution and Heat Flow
The adiabatic conductive heat flow (qcond) at the outer core-CMB interface was calculated
using the classical expression (e.g., Davies et al., 2015):
𝑞𝑐𝑜𝑛𝑑 = −4𝜋𝑟2𝑘𝑒 [𝜕𝑇
𝜕𝑟]𝑟=𝑟0
= −4𝜋𝑟2𝑘𝑒𝑔𝛾𝑇
𝜙
(4.2)
Here, κ is thermal conductivity obtained in this study and r is radius of the Earth’s outer
core (roc = 3480 km). The value for the Grüneisen parameter is taken to be γ = 1.5
(Davies et al., 2015) while the considered temperature range was specified above.
Gravity acceleration g and seismic parameter ϕ were taken from the preliminary reference
Earth model or PREM (Dziewonski and Anderson, 1981). A calculated adiabatic heat
flow of 9.4 – 12 TW at the outer core-CMB interface is not that different than estimates
derived from mantle circulation models (Olson et al., 2015; Olson, 2016) and suggest that
thermal convection may still be possible in the core. The range of values for the adiabatic
heat flow at the outer core-CMB interface stems from the uncertainty in temperature and
the value of thermal conductivity (κcmb = 65 -73 Wm-1
K-1
).
Although this calculated heat flow is lower in comparison with the highest estimates in
literature, high values of thermal conductivity demand perhaps an unrealistic power
budget for the geodynamo, and also complicate the interpretation of the spatio-temporal
evolution of the core.
The adiabatic heat flow reported in this work is high enough to require buoyancy driven
core convection from the exsolution of light elements during the IC growth. However, if
the energy budget of the core is higher as per some recent estimates (e.g., Gubbins et al.,
2015; Davies et al., 2015) then the role of thermal convection cannot be dismissed.
Therefore the actual convection in the core may have contribution from both buoyancy
and thermally induced flows. Mantle circulation plays an important role in maintaining
the convective mechanism in the OC, as it extracts the heat and contributes to the full
convection of the core. Indeed, seismic data indicate that the core is well mixed (Davies
et al., 2015; Nimmo, 2015a; Labrosse, 2015). However, compositional convection is still
129
not fully resolved, not only because of the unknown age of the IC, but also because there
is significant uncertainty in terms of light element composition in the core (Ozawa et al.,
2016; Morard et al., 2017; Mori et al., 2017; Suer et al., 2017; Suehiro et al., 2017;
Tateno et al., 2018; Shibazaki and Kono, 2018). For example, it was recently proposed
that the exsolution of Mg at the CMB is sufficient to drive compositional convection
(O'Rourke and Stevenson, 2016; O'Rourke et al., 2017) from the top down. However, a
recent study showed that such a mechanism has insufficient energy to drive the
geodynamo because Mg partitioning depends strongly on the O content in the Fe-rich
liquid alloy (Du et al., 2017) and its content in the outer core is very small.
Potential stratification at the top of the OC may develop if the heat flow at the core-CMB
interface is near adiabatic or subadiabatic. This stratified region is unstable due to the
CMB heterogeneities (such as the D” region), with a higher rate of heat flow. These
thermal heterogeneities in the lower mantle would promote lateral instability and
thermally-induced movement of fluid, thus disintegrating the stratified layer (Gubbins et
al., 2015; Olson et al., 2015). This is supported by a low secular variation of heat flow
below the Pacific region, where the lowermost mantle is hot and stabilizing (Gubbins et
al., 2015). Moreover, the highest heat flux is observed in the coldest sections of the CMB,
such as the region below Indonesia. The subduction zones have been active beneath
Indonesia for long enough to have cooled the mantle all the way down to the core (e.g.,
Gubbins et al., 2015; Olson et al., 2015). In principle, the energy transfer between
processes driving the plate tectonics and the geodynamo is controlled by thermal
conduction in the lowermost mantle, through the D” region (Ammann et al., 2014).
Paleomagnetic evidence suggests the presence of the magnetic field as early as 4.2 Gyr
(Tarduno et al., 2015). Nevertheless, the age of the IC nucleation may be much less
certain than suggested in recent studies which incorporate the effect of the high thermal
conductivity (e.g., Davies et al., 2015; Davies, 2015; Nimmo, 2015b; Olson, 2016). A
new study shows that the nucleation of the IC is uncertain because of the energy barrier
to the formation of the first stable crystals nucleus (Huguet et al., 2018). Using the
constraints from the simulations, theory and experiments, the authors show that a
spontaneous crystallization in a homogenous liquid Fe alloy at the Earth’s core pressures

130
requires critical supercooling of the order of 1000 K which is too large to be a plausible
mechanism for the origin of Earth’s inner core (Huguet et al., 2018). Their results
indicate that the nucleation of the IC could have been initiated much earlier than currently
considered in models with high κ. This finding supports the postulate about the presence
of ISROs in the OC alloy and their effect on electrical resistivity and viscosity. This is
corroborated in recent computer simulations which showed that the fivefold symmetric
ISRO polyhedron tends to increase the interfacial energy between liquid and crystal,
leading to the suppression of nucleation in liquids (Taffs and Patrick Royall, 2016). An
alternative explanation should perhaps be sought in the hypothesis suggested by Huguet
et al. (2018) that involves the role of a giant impact in the IC nucleation.
In terms of dynamical properties of the liquid alloy in the OC, a high viscosity in the OC
is expected, because of the increased presence of ISRO discussed in the previous section.
This assertion is supported by the assumed high values of viscosity in numerical models
(e.g., Gubbins et al., 2015). Indeed, the ISRO induced high viscosity would reconcile the
high value of Ekman number, used in current numerical models to maintain the laminar
flow. This is reinforced by recent experimental measurements of viscosity of Fe and Fe-
alloys. The observed steady increase of viscosity with increasing pressure confirms that
the corresponding increase in ISRO concentration, has a direct effect on a suppression of
dynamical motion within the liquid and subsequently increases viscosity (Dobson et al.,
2000; Rutter et al., 2002a; 2002b; Terasaki et al., 2002, 2006; Funakoshi, 2010;
Shimoyama et al., 2013; Kono et al., 2015).
A variety of light elements, such as S, C, and O, are expected to be in the liquid OC in
relatively small quantities (e.g., McDonough, 2003; Zhang et al., 2016a; Morard et al.,
2017; Tateno et al., 2018). It was established recently that no single light element can be
present in OC. Furthermore it has been demonstrated that no singular light element can
satisfy the combined compositional, cosmochemical and geophysical constraints in the
OC near ICB (Ozawa et al., 2016; Morard et al., 2017; Mori et al., 2017; Suer et al.,
2017; Suehiro et al., 2017; Tateno et al., 2018; Shibazaki and Kono, 2018). Indeed, the
exact compositional makeup of the light elements in the core is still unresolved.
However, this work leads to the conclusion that the transport properties of liquid Fe-alloy

131
will remain the same at ICB and likely at CMB, regardless of the light element
compositional content and proportion in the OC. All light elements, when alloyed with Fe
at high pressure have a stabilizing effect on the solid and form closely packed parent
structures before melting at high pressures (e.g., Shibazaki and Kono, 2018). Thus, it is
reasonable to expect that other combinations of light elements alloyed with liquid Fe,
exhibit the same transport properties in liquid as Fe-4.5Si investigated here. Most
importantly, in this work, the significant compositionally derived uncertainty in
determining the κ in the OC was resolved. Still, the uncertainties that may impact the
value of κ, such as exact temperatures at the CMB and ICB (Davies Davies, 2015 et al.,
2015) and the role of inelastic electron scattering, remain presently unresolved. Finally,
the findings in this study may play an important role in evaluating transport properties in
super-Earth type exoplanets (Wicks et al., 2018).
4.6. Summary and Conclusions
The electrical resistivity of solid and liquid Fe-4.5Si was measured experimentally up to
9GPa in a large volume press. The results demonstrate that the electrical resistivity of the
solid decreases with pressure and is highly sensitive to the degree of ordering induced by
the temperature dependent phase transitions. The presence of Si is also observed to
suppress the magnitude of resistivity jump on melting.
Remarkably, the electrical resistivity of liquid Fe-4.5Si along the melting boundary
remains invariant and has the same value as the electrical resistivity of pure liquid Fe of
120 cm. These results are interpreted in the context of icosahedral short range (ISRO)
structures in the melt whose concentration is proportional to increasing pressure. To the
best of my knowledge, this is the first time that the effect of pressure dependent ISRO
structures concentration has been used to explain the electrical resistivity of a liquid alloy
under compression in the context of the core transport properties. It is postulated that the
electrical resistivity of Fe-4.5Si remains constant along the melting boundary to the ICB,
which is used as an anchoring point. Based on the recent developments in understanding

132
the dynamics and structure of liquid transition metals and alloys, we extend our results to
pure liquid Fe and Fe-alloys with variable content of light elements in the Earth’s outer
core. I presented the evidence that pure liquid Fe and molten Fe-alloys (with C, S and O)
have the same behavior at ICB as interpreted from this study and from experiments on
pure Fe (Silber et al., 2018).
The calculated values of thermal conductivity and heat flow across CMB are consistent
with recent theoretical and experimental results. However, the main point of the findings
in this work is they eliminate the uncertainty of the identity of the light element(s) by
removing a compositional dependence of electrical resistivity of liquid Fe-alloy in the
core and place a more firm constraint on the transport properties of the outer core.
Furthermore, the implication of the results was discussed with the respect to the outer
core viscosity and renewed uncertainty in the inner core nucleation age.
The development of theoretical framework to account for our results is needed along with
additional experimental studies to validate our findings and conclusions.
References
Abrikosov, A. A. (2017), Fundamentals of the Theory of Metals, Courier Dover
Publications, Mineola, NY, USA.
Alfè, D., G. D. Price, and M. J. Gillan (1999), Oxygen in the Earth's core: a first-
principles study, Physics of the Earth and Planetary Interiors, 110(3), 191-210,
doi:10.1016/S0031-9201(98)00134-4.
Alfè, D., M. J. Gillan, and G. D. Price (2002), Composition and temperature of the
Earth’s core constrained by combining ab initio calculations and seismic data,
Earth and Planetary Science Letters, 195(1), 91-98, doi:10.1016/S0012-
821X(01)00568-4.

133
Allègre, C. J., J.-P. Poirier, E. Humler, and A. W. Hofmann (1995), The chemical
composition of the Earth, Earth and Planetary Science Letters, 134(3), 515-526,
doi:10.1016/0012-821X(95)00123-T.
Ammann, M. W., A. M. Walker, S. Stackhouse, J. Wookey, A. M. Forte, J. P. Brodholt,
and D. P. Dobson (2014), Variation of thermal conductivity and heat flux at the
Earth's core mantle boundary, Earth and Planetary Science Letters, 390, 175-185,
doi:10.1016/j.epsl.2014.01.009.
Anderson, D. L. (1980), Bulk attenuation in the Earth and viscosity of the core, Nature,
285, 204, doi:10.1038/285204a0.
Andrault, D., N. Bolfan-Casanova, G. L. Nigro, M. A. Bouhifd, G. Garbarino, and M.
Mezouar (2011), Solidus and liquidus profiles of chondritic mantle: Implication
for melting of the Earth across its history, Earth and Planetary Science Letters,
304(1), 251-259, doi:10.1016/j.epsl.2011.02.006.
Antonangeli, D., J. Siebert, J. Badro, D. L. Farber, G. Fiquet, G. Morard, and F. J.
Ryerson (2010), Composition of the Earth's inner core from high-pressure sound
velocity measurements in Fe–Ni–Si alloys, Earth and Planetary Science Letters,
295(1), 292-296, doi:10.1016/j.epsl.2010.04.018.
Anzellini, S., A. Dewaele, M. Mezouar, P. Loubeyre, and G. Morard (2013), Melting of
Iron at Earth’s Inner Core Boundary Based on Fast X-ray Diffraction, Science,
340(6131), 464.
Asanuma, H., E. Ohtani, T. Sakai, H. Terasaki, S. Kamada, N. Hirao, N. Sata, and Y.
Ohishi (2008), Phase relations of Fe‐Si alloy up to core conditions: Implications
for the Earth inner core, Geophysical Research Letters, 35(12),
doi:10.1029/2008GL033863.
Asanuma, H., E. Ohtani, T. Sakai, H. Terasaki, S. Kamada, T. Kondo, and T. Kikegawa
(2010), Melting of iron–silicon alloy up to the core–mantle boundary pressure:
implications to the thermal structure of the Earth’s core, Physics and Chemistry of
Minerals, 37(6), 353-359, doi:10.1007/s00269-009-0338-7.
Badro, J., A. S. Côté, and J. P. Brodholt (2014), A seismologically consistent
compositional model of Earth’s core, Proceedings of the National Academy of
Sciences, 201316708, doi:10.1073/pnas.1316708111.

134
Badro, J., G. Fiquet, F. Guyot, E. Gregoryanz, F. Occelli, D. Antonangeli, and M.
d'Astuto (2007), Effect of light elements on the sound velocities in solid iron:
Implications for the composition of Earth's core, Earth and Planetary Science
Letters, 254(1), 233-238, doi:10.1016/j.epsl.2006.11.025.
Balchan, A., and H. Drickamer (1961), High pressure electrical resistance cell, and
calibration points above 100 kilobars, Review of Scientific Instruments, 32(3),
308-313, doi:10.1063/1.1717350.
Ballentine, L., S. Bose, and J. Hammerberg (1984), Electronic conduction in sd band
liquid metals, Journal of non-crystalline solids, 61, 1195-1199, doi:10.1016/0022-
3093(84)90704-X.
Baum, B., P. Gel'd, and G. Tyagunov (1967), Resistivity of ferrosilicon alloys in the
temperature range 800–1700 C, The Physics of Metals and Metallography, 24,
181.
Berrada, M., R. A. Secco, and W. Yong (2018), Decreasing electrical resistivity of gold
along the melting boundary up to 5 GPa, High Pressure Research, 1-10,
doi:10.1080/08957959.2018.1493476.
Bevington, P. R., and D. K. Robinson (2003), Data reduction and error analysis,
McGraw-Hill.
Biggin, A. J., E. J. Piispa, L. J. Pesonen, R. Holme, G. A. Paterson, T. Veikkolainen, and
L. Tauxe (2015), Palaeomagnetic field intensity variations suggest
Mesoproterozoic inner-core nucleation, Nature, 526, 245,
doi:10.1038/nature15523
Biggin, A. J., G. H. M. A. Strik, and C. G. Langereis (2009), The intensity of the
geomagnetic field in the late-Archaean: new measurements and an analysis of the
updated IAGA palaeointensity database, Earth, Planets and Space, 61(1), 9-22,
doi:10.1186/BF03352881.
Biswas, R., and M. Kertesz (1984), Electronic structure and metallization of silicon,
Physical Review B, 29(4), 1791-1797, doi:10.1103/PhysRevB.29.1791.
Boehler, R., and M. Ross (2007), Properties of rocks and minerals–High-pressure
melting, in Treatise in Geophysics, Volume 2, Mineral Physics, edited, pp. 527-
541, Elsevier BV.

135
Boehler, R., and M. Ross (2015), Properties of rocks and minerals, high-pressure melting.
Bundy, F. P. (1964), Phase Diagrams of Silicon and Germanium to 200 kbar, 1000°C,
The Journal of Chemical Physics, 41(12), 3809-3814, doi:10.1063/1.1725818.
Burdett, J. K. (1995), Chemical bonding in solids, Oxford University Press,
doi:10.1016/j.jpcs.2008.03.031.
Cui, S., and I.-H. Jung (2017), Critical reassessment of the Fe-Si system, Calphad, 56,
108-125, doi:10.1016/j.calphad.2016.11.003.
Dasgupta, R., H. Chi, N. Shimizu, A. S. Buono, and D. Walker (2013), Carbon solution
and partitioning between metallic and silicate melts in a shallow magma ocean:
Implications for the origin and distribution of terrestrial carbon, Geochimica et
Cosmochimica Acta, 102, 191-212, doi:10.1016/j.gca.2012.10.011.
Davies, C. J. (2015), Cooling history of Earth’s core with high thermal conductivity,
Physics of the Earth and Planetary Interiors, 247, 65-79,
doi:10.1016/j.pepi.2015.03.007.
Davies, C., M. Pozzo, D. Gubbins, and D. Alfè (2015), Constraints from material
properties on the dynamics and evolution of Earth’s core, Nature Geoscience, 8,
678, doi:10.1038/ngeo2492
de Koker, N., G. Steinle-Neumann, and V. Vlček (2012), Electrical resistivity and
thermal conductivity of liquid Fe alloys at high P and T, and heat flux in Earth’s
core, Proceedings of the National Academy of Sciences, 109(11), 4070-4073,
doi:10.1073/pnas.1111841109.
Deng, L., C. Seagle, Y. Fei, and A. Shahar (2013), High pressure and temperature
electrical resistivity of iron and implications for planetary cores, Geophysical
Research Letters, 40(1), 33-37, doi:10.1029/2012GL054347.
Dobson, D. P., W. A. Crichton, L. Vocadlo, A. P. Jones, Y. Wang, T. Uchida, M. Rivers,
S. Sutton, and J. P. Brodholt (2000), In situ measurement of viscosity of liquids in
the Fe-FeS system at high pressures and temperatures, American Mineralogist,
85(11-12), 1838-1842, doi:10.2138/am-2000-11-1231.
Drchal, V., J. Kudrnovský, D. Wagenknecht, I. Turek, and S. Khmelevskyi (2017),
Transport properties of iron at Earth's core conditions: The effect of spin disorder,
Physical Review B, 96(2), 024432, doi:10.1103/PhysRevB.96.024432

136
Du, Z., C. Jackson, N. Bennett, P. Driscoll, J. Deng, K. K. Lee, E. Greenberg, V. B.
Prakapenka, and Y. Fei (2017), Insufficient energy from MgO exsolution to
power early geodynamo, Geophysical Research Letters, 44(22),
doi:10.1002/2017GL075283.
Dziewonski, A. M., and D. L. Anderson (1981), Preliminary reference Earth model,
Physics of the Earth and Planetary Interiors, 25(4), 297-356, doi:10.1016/0031-
9201(81)90046-7.
Elsasser, W. M. (1946), Induction effects in terrestrial magnetism part II. The secular
variation, Physical Review, 70(3-4), 202.
Ezenwa, I. C., and R. A. Secco (2017), Invariant electrical resistivity of Co along the
melting boundary, Earth and Planetary Science Letters, 474(Supplement C), 120-
127, doi:10.1016/j.epsl.2017.06.032.
Ezenwa, I. C., R. A. Secco, W. Yong, and M. Pozzo (2017), Electrical Resistivity of
Solid and Liquid Cu to 5 GPa: Decrease along the Melting Boundary, Journal of
Physics: Condensed Matter.
Faber, T. E. (1972), Introduction to the theory of liquid metals, Cambridge University
Press, Cambridge.
Faber, T. E., and J. M. Ziman (1965), A theory of the electrical properties of liquid
metals, The Philosophical Magazine: A Journal of Theoretical Experimental and
Applied Physics, 11(109), 153-173, doi:10.1080/14786436508211931.
Fiquet, G., A. L. Auzende, J. Siebert, A. Corgne, H. Bureau, H. Ozawa, and G. Garbarino
(2010), Melting of Peridotite to 140 Gigapascals, Science, 329(5998), 1516,
doi:10.1126/science.1192448.
Fischer, R. A., A. J. Campbell, D. M. Reaman, N. A. Miller, D. L. Heinz, P. Dera, and V.
B. Prakapenka (2013), Phase relations in the Fe–FeSi system at high pressures
and temperatures, Earth and Planetary Science Letters, 373, 54-64,
doi:10.1016/j.epsl.2013.04.035.
Fischer, R. A., A. J. Campbell, R. Caracas, D. M. Reaman, D. L. Heinz, P. Dera, and V.
B. Prakapenka (2014), Equations of state in the Fe‐FeSi system at high pressures
and temperatures, Journal of Geophysical Research: Solid Earth, 119(4), 2810-
2827, doi:10.1002/2013JB010898.
137
Fitoussi, C., B. Bourdon, T. Kleine, F. Oberli, and B. C. Reynolds (2009), Si isotope
systematics of meteorites and terrestrial peridotites: implications for Mg/Si
fractionation in the solar nebula and for Si in the Earth's core, Earth and
Planetary Science Letters, 287(1), 77-85, doi:10.1016/j.epsl.2009.07.038.
Frank, F. C. (1952), Supercooling of liquids, Proceedings of the Royal Society of London.
Series A. Mathematical and Physical Sciences, 215(1120), 43-46,
doi:10.1098/rspa.1952.0194.
Funakoshi, K.-I. (2010), In situ viscosity measurements of liquid Fe–S alloys at high
pressures, High Pressure Research, 30(1), 60-64,
doi:10.1080/08957951003616356.
Funamori, N., and K. Tsuji (2002), Pressure-induced structural change of liquid silicon,
Physical review letters, 88(25), 255508, doi:10.1103/PhysRevLett.88.255508.
Ganesh, P., and M. Widom (2006), Signature of nearly icosahedral structures in liquid
and supercooled liquid copper, Physical Review B, 74(13), 134205,
doi:10.1103/PhysRevB.74.134205.
Ganesh, P., and M. Widom (2008), Ab initio simulations of geometrical frustration in
supercooled liquid Fe and Fe-based metallic glass, Physical Review B, 77(1),
014205, doi:10.1103/PhysRevB.77.014205.
Gapotchenko, A., E. Itskevich, and E. Kulatov (1988), Fermi Surface of Magnetic
Transition Metals Under Pressure, in The Magnetic and Electron Structures of
Transition Metals and Alloys, edited by V. G. Veselago and L. I. Vinokurova, pp.
137-163, Nova Publishers.
Gaspard, J., P. Lambin, C. Mouttet, and J. Vigneron (1984), On the electronic structure of
molten Si, Philosophical Magazine B, 50(1), 103-112,
doi:10.1080/13642818408238830.
Georg, R. B., A. N. Halliday, E. A. Schauble, and B. C. Reynolds (2007), Silicon in the
Earth’s core, Nature, 447(7148), 1102.
Gilvarry, J. J. (1956), The Lindemann and Grüneisen laws, Physical Review, 102(2), 308,
doi:10.1103/PhysRev.102.308.
Giuliani, G., and G. Vignale (2005), Quantum theory of the electron liquid, Cambridge
university press, Cambridge, UK.

138
Glazov, V. M., and O. D. Shchelikov (2000), Volume changes during melting and
heating of silicon and germanium melts, High Temperature, 38(3), 405-412,
doi:10.1007/BF02756000.
Gomi, H., and K. Hirose (2015), Electrical resistivity and thermal conductivity of hcp
Fe–Ni alloys under high pressure: Implications for thermal convection in the
Earth’s core, Physics of the Earth and Planetary Interiors, 247, 2-10,
doi:10.1016/j.pepi.2015.04.003.
Gomi, H., K. Hirose, H. Akai, and Y. Fei (2016), Electrical resistivity of substitutionally
disordered hcp Fe–Si and Fe–Ni alloys: Chemically-induced resistivity saturation
in the Earth's core, Earth and Planetary Science Letters, 451, 51-61,
doi:10.1016/j.epsl.2016.07.011.
Gomi, H., K. Ohta, K. Hirose, S. Labrosse, R. Caracas, M. J. Verstraete, and J. W.
Hernlund (2013), The high conductivity of iron and thermal evolution of the
Earth’s core, Physics of the Earth and Planetary Interiors, 224, 88-103,
doi:10.1016/j.pepi.2013.07.010.
Gu, T., J. Qin, C. Xu, and X. Bian (2004), Structural, bonding, and dynamical properties
of liquid Fe-Si alloys: An ab initio molecular-dynamics simulation, Physical
Review B, 70(14), 144204, doi:10.1103/PhysRevB.70.144204.
Gubbins, D., D. Alfè, C. Davies, and M. Pozzo (2015), On core convection and the
geodynamo: Effects of high electrical and thermal conductivity, Physics of the
Earth and Planetary Interiors, 247, 56-64, doi:10.1016/j.pepi.2015.04.002.
Gunnarsson, O., M. Calandra, and J. E. Han (2003), Colloquium: Saturation of electrical
resistivity, Reviews of Modern Physics, 75(4), 1085-1099,
doi:10.1103/RevModPhys.75.1085.
Hafner, J., and G. Kahl (1984), The structure of the elements in the liquid state, Journal
of Physics F: Metal Physics, 14(10), 2259, doi:10.1088/0305-4608/14/10/006.
Heremans, J., C. Olk, G. Eesley, J. Steinbeck, and G. Dresselhaus (1988), Observation of
metallic conductivity in liquid carbon, Physical review letters, 60(5), 452,
doi:10.1103/PhysRevLett.60.452.
Hirose, K., R. Wentzcovitch, D. Yuen, and T. Lay (2015), 2.05—Mineralogy of the deep
mantle—The post‐perovskite phase and its geophysical significance, in Treatise
on Geophysics, edited by G. Schubert, pp. 85-115, Elsevier, Oxford.

139
Hirose, K., S. Labrosse, and J. Hernlund (2013), Composition and state of the core,
Annual Review of Earth and Planetary Sciences, 41, 657-691,
doi:10.1146/annurev-earth-050212-124007.
Holland-Moritz, D., T. Schenk, V. Simonet, and R. Bellissent (2006), Short-range order
in undercooled and stable melts forming quasicrystals and approximants and its
influence on nucleation, Philosophical Magazine, 86(3-5), 255-262,
doi:10.1080/14786430500253992.
Hsieh, W. P., F. Deschamps, T. Okuchi, and J. F. Lin (2017), Reduced lattice thermal
conductivity of Fe‐bearing bridgmanite in Earth's deep mantle, Journal of
Geophysical Research: Solid Earth, doi:10.1002/2017JB014339.
Hu, J. Z., and I. L. Spain (1984), Phases of silicon at high pressure, Solid State
Communications, 51(5), 263-266, doi:10.1016/0038-1098(84)90683-5.
Hu, Y., F. Li, M. Li, H. Bai, and W. Wang (2015), Five-fold symmetry as indicator of
dynamic arrest in metallic glass-forming liquids, Nature communications, 6,
8310.
Hu, Y.-C., P.-F. Guan, Q. Wang, Y. Yang, H.-Y. Bai, and W.-H. Wang (2017), Pressure
effects on structure and dynamics of metallic glass-forming liquid, The Journal of
chemical physics, 146(2), 024507, doi:10.1063/1.4973919.
Huang, H., Y. Fei, L. Cai, F. Jing, X. Hu, H. Xie, L. Zhang, and Z. Gong (2011),
Evidence for an oxygen-depleted liquid outer core of the Earth, Nature,
479(7374), 513.
Huang, Y., V. Chubakov, F. Mantovani, R. L. Rudnick, and W. F. McDonough (2013), A
reference Earth model for the heat‐producing elements and associated geoneutrino
flux, Geochemistry, Geophysics, Geosystems, 14(6), 2003-2029,
doi:10.1002/ggge.20129
Huguet, L., J. A. Van Orman, S. A. Hauck, and M. A. Willard (2018), Earth's inner core
nucleation paradox, Earth and Planetary Science Letters, 487, 9-20,
doi:10.1016/j.epsl.2018.01.018.
Il'inskii, A., S. Slyusarenko, O. Slukhovskii, I. Kaban, and W. Hoyer (2002), Structural
properties of liquid Fe–Si alloys, Journal of Non-Crystalline Solids, 306(1), 90-
98, doi:10.1016/S0022-3093(02)01051-7.

140
Jahn, H. A., and E. Teller (1937), Stability of polyatomic molecules in degenerate
electronic states - I—Orbital degeneracy, Proceedings of the Royal Society of
London. Series A - Mathematical and Physical Sciences, 161(905), 220-235,
doi:10.1098/rspa.1937.0142.
Janak, J., and A. Williams (1976), Giant internal magnetic pressure and compressibility
anomalies, Physical Review B, 14(9), 4199, doi:10.1103/PhysRevB.14.4199.
Jank, W., C. Hausleitner, and J. Hafner (1991), Electronic structure of the liquid 3d and
4d transition metals, Journal of Physics: Condensed Matter, 3(24), 4477,
doi:10.1088/0953-8984/3/24/016.
Jónsson, H., and H. C. Andersen (1988), Icosahedral Ordering in the Lennard-Jones
Liquid and Glass, Physical Review Letters, 60(22), 2295-2298,
doi:10.1103/PhysRevLett.60.2295.
Karato, S.-i., and R. V. Murthy (1997), Core formation and chemical equilibrium in the
Earth—I. Physical considerations, Physics of the Earth and Planetary Interiors,
100(1), 61-79, doi:10.1016/S0031-9201(96)03232-3.
Kimura, S., and K. Terashima (1997), A review of measurement of thermophysical
properties of silicon melt, Journal of Crystal Growth, 180(3), 323-333,
doi:10.1016/S0022-0248(97)00263-7.
Kita, Y., J. Van Zytveld, Z. Morita, and T. Iida (1994), Covalency in liquid Si and liquid
transition-metal-Si alloys: X-ray diffraction studies, Journal of Physics:
Condensed Matter, 6(4), 811, doi:10.1088/0953-8984/6/4/002.
Kono, Y., C. Kenney-Benson, Y. Shibazaki, C. Park, G. Shen, and Y. Wang (2015),
High-pressure viscosity of liquid Fe and FeS revisited by falling sphere
viscometry using ultrafast X-ray imaging, Physics of the Earth and Planetary
Interiors, 241, 57-64, doi:10.1016/j.pepi.2015.02.006.
Konôpková, Z., R. S. McWilliams, N. Gómez-Pérez, and A. F. Goncharov (2016), Direct
measurement of thermal conductivity in solid iron at planetary core conditions,
Nature, 534(7605), 99-101, doi:10.1038/nature18009.
Koshino, S. (1963), On the Inelastic Scattering of Electrons by Impurities, Progress of
Theoretical Physics, 30(4), 415-420, doi:10.1143/PTP.30.415.

141
Kubaschewski, O. (1982), Phase Diagrams of Binary Fe Based Systems, edited, Springer,
Berlin.
Kubo, A., Y. Wang, C. E. Runge, T. Uchida, B. Kiefer, N. Nishiyama, and T. S. Duffy
(2008), Melting curve of silicon to 15GPa determined by two-dimensional angle-
dispersive diffraction using a Kawai-type apparatus with X-ray transparent
sintered diamond anvils, Journal of Physics and Chemistry of Solids, 69(9), 2255-
2260, doi:10.1016/j.jpcs.2008.04.025.
Kuwayama, Y., and K. Hirose (2004), Phase relations in the system Fe-FeSi at 21 GPa,
American Mineralogist, 89(2-3), 273-276, doi:10.2138/am-2004-2-303.
Kuwayama, Y., K. Hirose, N. Sata, and Y. Ohishi (2008), Phase relations of iron and
iron–nickel alloys up to 300 GPa: Implications for composition and structure of
the Earth's inner core, Earth and Planetary Science Letters, 273(3), 379-385,
doi:10.1016/j.epsl.2008.07.001.
Kuwayama, Y., T. Sawai, K. Hirose, N. Sata, and Y. Ohishi (2009), Phase relations of
iron–silicon alloys at high pressure and high temperature, Physics and Chemistry
of Minerals, 36(9), 511-518, doi:10.1007/s00269-009-0296-0.
Labrosse, S. (2015), Thermal evolution of the core with a high thermal conductivity,
Physics of the Earth and Planetary Interiors, 247, 36-55,
doi:10.1016/j.pepi.2015.02.002.
Lai, X., B. Chen, J. Wang, Y. Kono, and F. Zhu (2017), Polyamorphic Transformations
in Fe‐Ni‐C Liquids: Implications for Chemical Evolution of Terrestrial Planets,
Journal of Geophysical Research: Solid Earth, 122(12), 9745-9754,
doi:10.1002/2017JB014835.
Lee, G. W., A. K. Gangopadhyay, K. F. Kelton, R. W. Hyers, T. J. Rathz, J. R. Rogers,
and D. S. Robinson (2004), Difference in Icosahedral Short-Range Order in Early
and Late Transition Metal Liquids, Physical Review Letters, 93(3), 037802,
doi:10.1103/PhysRevLett.93.037802.
Li, M., H. Peng, Y. Hu, F. Li, H. Zhang, and W. Wang (2017), Five-fold local symmetry
in metallic liquids and glasses, Chinese Physics B, 26(1), 016104,
doi:10.1088/1674-1056/26/1/016104.
Lin, J. F., V. V. Struzhkin, W. Sturhahn, E. Huang, J. Zhao, M. Y. Hu, E. E. Alp, H. k.
Mao, N. Boctor, and R. J. Hemley (2003), Sound velocities of iron‐nickel and

142
iron‐silicon alloys at high pressures, Geophysical Research Letters, 30(21),
doi:10.1029/2003GL018405.
Litasov, K. D., and A. F. Shatskiy (2016), Composition of the Earth’s core: A review,
Russian Geology and Geophysics, 57(1), 22-46, doi:10.1016/j.rgg.2016.01.003.
Littleton, J. A., R. A. Secco, and W. Yong (2018), Decreasing electrical resistivity of
silver along the melting boundary up to 5 GPa, High Pressure Research, 38(2),
99-106, doi:10.1080/08957959.2018.1435786.
Lizárraga, R., F. Pan, L. Bergqvist, E. Holmström, Z. Gercsi, and L. Vitos (2017), First
principles theory of the hcp-fcc phase transition in cobalt, Scientific Reports, 7(1),
3778, doi:10.1038/s41598-017-03877-5.
Lü, Y., Q. Bi, H. Huang, and H. Pang (2017), Role of fivefold symmetry in the
dynamical slowing down of metallic glass-forming liquids, Physical Review B,
96(6), 064301, doi:10.1103/PhysRevB.96.064301.
Magomedov, Y. B., and G. Gadjiev (2008), High-temperature thermal conductivity of
silicon in the solid and liquid states, High Temperature, 46(3), 422-424.
Mao, Z., J.-F. Lin, J. Liu, A. Alatas, L. Gao, J. Zhao, and H.-K. Mao (2012), Sound
velocities of Fe and Fe-Si alloy in the Earth’s core, Proceedings of the National
Academy of Sciences, 109(26), 10239-10244, doi:10.1073/pnas.1207086109.
Matassov, G. (1977), The electrical conductivity or iron alloys at high pressure and the
Earth’s core, PhD thesis, Lawrence Livermore Natl. Lab., Univ. of Calif.,
Livermore.
McDonough, W. F. (2003), 2.15 - Compositional Model for the Earth's Core, in Treatise
on Geochemistry, edited by H. D. Holland and K. K. Turekian, pp. 547-568,
Pergamon, Oxford, doi:10.1016/B0-08-043751-6/02015-6.
McDonough, W. F., and S. s. Sun (1995), The composition of the Earth, Chemical
Geology, 120(3), 223-253, doi:10.1016/0009-2541(94)00140-4.
Mizuno, A., K. Murai, H. Kawauchi, M. Tannno, S. Kohara, and M. Watanabe (2013),
Density and Structure of Liquid Si-M (M=Fe, Ni, and Ge) Alloys, MRS
Proceedings, 1528, mrsf12-1528-vv1510-1505, doi:10.1557/opl.2013.366.
143
Mohri, T., Y. Chen, M. Kohyama, S. Ogata, A. Saengdeejing, S. K. Bhattacharya, M.
Wakeda, S. Shinzato, and H. Kimizuka (2017), Mechanical properties of Fe-rich
Si alloy from Hamiltonian, npj Computational Materials, 3(1), 10,
doi:10.1038/s41524-017-0012-4.
Morard, G., D. Andrault, D. Antonangeli, and J. Bouchet (2014), Properties of iron alloys
under the Earth's core conditions, Comptes Rendus Geoscience, 346(5), 130-139,
doi:10.1016/j.crte.2014.04.007.
Morard, G., D. Andrault, N. Guignot, J. Siebert, G. Garbarino, and D. Antonangeli
(2011), Melting of Fe–Ni–Si and Fe–Ni–S alloys at megabar pressures:
implications for the core–mantle boundary temperature, Physics and Chemistry of
Minerals, 38(10), 767-776, doi:10.1007/s00269-011-0449-9.
Morard, G., J. Siebert, D. Andrault, N. Guignot, G. Garbarino, F. Guyot, and D.
Antonangeli (2013), The Earth's core composition from high pressure density
measurements of liquid iron alloys, Earth and Planetary Science Letters, 373,
169-178, doi:10.1016/j.epsl.2013.04.040.
Morard, G., Y. Nakajima, D. Andrault, D. Antonangeli, A. Auzende, E. Boulard, S.
Cervera, A. Clark, O. Lord, and J. Siebert (2017), Structure and Density of Fe‐C
Liquid Alloys Under High Pressure, Journal of Geophysical Research: Solid
Earth, 122(10), 7813-7823, doi:10.1002/2017JB014779
Mori, Y., H. Ozawa, K. Hirose, R. Sinmyo, S. Tateno, G. Morard, and Y. Ohishi (2017),
Melting experiments on Fe–Fe3S system to 254 GPa, Earth and Planetary
Science Letters, 464, 135-141, doi:10.1016/j.epsl.2017.02.021.
Mott, N. F. (1972), The electrical resistivity of liquid transition metals, Philosophical
Magazine, 26(6), 1249-1261, doi:10.1080/14786437208220339.
Mott, N., F. (1980), Liquid and Amorphous Metals, J. Phys. Colloques, 41(C8), C8-1-
C8-7.
Murthy, R. V., and S.-i. Karato (1997), Core formation and chemical equilibrium in the
Earth—II: Chemical consequences for the mantle and core, Physics of the Earth
and Planetary Interiors, 100(1), 81-95, doi:10.1016/S0031-9201(96)03233-5.
Narita, K., and M. Enokizono (1979), Effect of ordering on magnetic properties of 6.5-
percent silicon-iron alloy, IEEE Transactions on Magnetics, 15(1), 911-915,
doi:10.1109/TMAG.1979.1060174.

144
Nimmo, F. (2015a), Energetics of the core, in Treatise on Geophysics, edited by G.
Schubert, pp. 27-55.
Nimmo, F. (2015b), Thermal and compositional evolution of the core, in Core Dynamics,
Treatise on Geophysics, edited by G. Schubert, pp. 201-219, Elsevier, UK.
Nishino, Y., S.-y. Inoue, S. Asano, and N. Kawamiya (1993), Anomalous temperature
dependence of the electrical resistivity in binary and pseudobinary alloys based on
Fe 3 Si, Physical Review B, 48(18), 13607, doi:10.1103/PhysRevB.48.13607.
Nomura, R., K. Hirose, K. Uesugi, Y. Ohishi, A. Tsuchiyama, A. Miyake, and Y. Ueno
(2014), Low Core-Mantle Boundary Temperature Inferred from the Solidus of
Pyrolite, Science, doi:10.1126/science.1248186.
Numakura, K. i., A. Tsugawa, M. Sugano, and Y. Sato (1972), Magnetic and electric
properties of iron-silicon alloys, Science reports of the Research Institutes,
Tohoku University. Ser. A, Physics, chemistry and metallurgy, 24, 48-60.
Ohta, K., T. Yagi, K. Hirose, and Y. Ohishi (2017), Thermal conductivity of
ferropericlase in the Earth's lower mantle, Earth and Planetary Science Letters,
465, 29-37, doi:10.1016/j.epsl.2017.02.030.
Ohta, K., Y. Kuwayama, K. Hirose, K. Shimizu, and Y. Ohishi (2016), Experimental
determination of the electrical resistivity of iron at Earth’s core conditions,
Nature, 534(7605), 95-98, doi:10.1038/nature17957.
Olson, P. (2016), Mantle control of the geodynamo: Consequences of top-down
regulation, Geochemistry, Geophysics, Geosystems, 17(5), 1935-1956,
doi:10.1002/2016GC006334.
Olson, P., R. Deguen, M. L. Rudolph, and S. Zhong (2015), Core evolution driven by
mantle global circulation, Physics of the Earth and Planetary Interiors, 243, 44-
55, doi:10.1016/j.pepi.2015.03.002.
O'Rourke, J. G., and D. J. Stevenson (2016), Powering Earth’s dynamo with magnesium
precipitation from the core, Nature, 529(7586), 387-389,
doi:10.1038/nature16495.
O'Rourke, J. G., J. Korenaga, and D. J. Stevenson (2017), Thermal evolution of Earth
with magnesium precipitation in the core, Earth and Planetary Science Letters,
458, 263-272, doi:10.1016/j.epsl.2016.10.057.

145
Ozawa, H., K. Hirose, K. Yonemitsu, and Y. Ohishi (2016), High-pressure melting
experiments on Fe–Si alloys and implications for silicon as a light element in the
core, Earth and Planetary Science Letters, 456, 47-54,
doi:10.1016/j.epsl.2016.08.042.
Palmer, A., and D. E. Smylie (2005), VLBI observations of free core nutations and
viscosity at the top of the core, Physics of the Earth and Planetary Interiors,
148(2), 285-301, doi:10.1016/j.pepi.2004.09.003.
Poirier, J.-P. (1994), Light elements in the Earth's outer core: A critical review, Physics of
the Earth and Planetary Interiors, 85(3), 319-337, doi:10.1016/0031-
9201(94)90120-1.
Pommier, A. (2018), Influence of sulfur on the electrical resistivity of a crystallizing core
in small terrestrial bodies, Earth and Planetary Science Letters, 496, 37-46,
doi:10.1016/j.epsl.2018.05.032.
Pommier, A., and K. D. Leinenweber (2018), Electrical cell assembly for reproducible
conductivity experiments in the multi-anvil, American Mineralogist, 103(8),
1298-1305, doi:10.2138/am-2018-6448.
Pourovskii, L. V., J. Mravlje, A. Georges, S. I. Simak, and I. A. Abrikosov (2017),
Electron–electron scattering and thermal conductivity of ϵ -iron at Earth’s core
conditions, New Journal of Physics, 19(7), 073022, doi:10.1088/1367-
2630/aa76c9.
Pozzo, M., C. Davies, D. Gubbins, and D. Alfe (2012), Thermal and electrical
conductivity of iron at Earth/'s core conditions, Nature, 485(7398), 355-358,
doi:10.1038/nature11031.
Pozzo, M., C. Davies, D. Gubbins, and D. Alfè (2013), Transport properties for liquid
silicon-oxygen-iron mixtures at Earth's core conditions, Physical Review B, 87(1),
014110, doi:10.1103/PhysRevB.87.014110.
Qin, J., T. Gu, and X. Bian (2004), A study on the medium range order in molten Fe3Si
and FeSi alloys, Journal of Physics: Condensed Matter, 16(28), 4753,
doi:10.1088/0953-8984/16/28/001.
Roik, O. S., O. S. Muratov, O. M. Yakovenko, V. P. Kazimirov, N. V. Golovataya, and
V. E. Sokolskii (2014), X-ray diffraction studies and Reverse Monte Carlo

146
simulations of the liquid binary Fe–Si and Fe–Al alloys, Journal of Molecular
Liquids, 197, 215-222, doi:10.1016/j.molliq.2014.05.009.
Roik, O. S., O. V. Samsonnikov, V. P. Kazimirov, and V. E. Sokolskii (2009), Short and
medium-range order in liquid binary Al–Ni and Al–Co alloys, Journal of
Molecular Liquids, 145(3), 129-134, doi:10.1016/j.molliq.2008.06.002.
Ross, M., R. Boehler, and D. Errandonea (2007), Melting of transition metals at high
pressure and the influence of liquid frustration: The late metals Cu, Ni, and Fe,
Physical Review B, 76(18), 184117, doi:10.1103/PhysRevB.76.184117.
Rutter, M. D., R. A. Secco, T. Uchida, H. Liu, Y. Wang, M. L. Rivers, and S. R. Sutton
(2002a), Towards evaluating the viscosity of the Earth's outer core: An
experimental high pressure study of liquid Fe‐S (8.5 wt.% S), Geophysical
Research Letters, 29(8).
Rutter, M. D., R. A. Secco, H. Liu, T. Uchida, M. L. Rivers, S. R. Sutton, and Y. Wang
(2002b), Viscosity of liquid Fe at high pressure, Physical Review B, 66(6),
060102.
Sakai, T., T. Kondo, E. Ohtani, H. Terasaki, N. Endo, T. Kuba, T. Suzuki, and T.
Kikegawa (2006), Interaction between iron and post‐perovskite at core‐mantle
boundary and core signature in plume source region, Geophysical research
letters, 33(15), doi:10.1029/2006GL026868.
Sakairi, T., E. Ohtani, S. Kamada, T. Sakai, T. Sakamaki, and N. Hirao (2017), Melting
relations in the Fe–S–Si system at high pressure and temperature: implications for
the planetary core, Progress in Earth and Planetary Science, 4(1), 10,
doi:10.1186/s40645-017-0125-x.
Sanloup, C., F. Guyot, P. Gillet, and Y. Fei (2002), Physical properties of liquid Fe alloys
at high pressure and their bearings on the nature of metallic planetary cores,
Journal of Geophysical Research: Solid Earth, 107(B11), ECV 4-1-ECV 4-9,
doi:10.1029/2001JB000808.
Sanloup, C., F. Guyot, P. Gillet, G. Fiquet, M. Mezouar, and I. Martinez (2000b), Density
measurements of liquid Fe‐S alloys at high‐pressure, Geophysical Research
Letters, 27(6), 811-814, doi:10.1029/1999GL008431.
Sanloup, C., F. Guyot, P. Gillet, G. Fiquet, R. J. Hemley, M. Mezouar, and I. Martinez
(2000a), Structural changes in liquid Fe at high pressures and high temperatures

147
from Synchrotron X-ray Diffraction, EPL (Europhysics Letters), 52(2), 151-157,
doi:10.1209/epl/i2000-00417-3.
Sanloup, C., G. Fiquet, E. Gregoryanz, G. Morard, and M. Mezouar (2004), Effect of Si
on liquid Fe compressibility: Implications for sound velocity in core materials,
Geophysical Research Letters, 31(7), doi:10.1029/2004GL019526.
Sanloup, C., W. van Westrenen, R. Dasgupta, H. Maynard-Casely, and J. P. Perrillat
(2011), Compressibility change in iron-rich melt and implications for core
formation models, Earth and Planetary Science Letters, 306(1), 118-122,
doi:10.1016/j.epsl.2011.03.039.
Sasaki, H., E. Tokizaki, X. M. Huang, K. Terashima, and S. Kimura (1995), Temperature
dependence of the viscosity of molten silicon measured by the oscillating cup
method, Japanese journal of applied physics, 34(7R), 3432,
doi:10.1143/JJAP.34.3432.
Sata, N., K. Hirose, G. Shen, Y. Nakajima, Y. Ohishi, and N. Hirao (2010), Compression
of FeSi, Fe3C, Fe0. 95O, and FeS under the core pressures and implication for
light element in the Earth's core, Journal of Geophysical Research: Solid Earth,
115(B9), doi:10.1029/2009JB006975
Sato, Y., T. Nishizuka, K. Hara, T. Yamamura, and Y. Waseda (2000), Density
Measurement of Molten Silicon by a Pycnometric Method, International Journal
of Thermophysics, 21(6), 1463-1471, doi:10.1023/A:1006661511770.
Schenk, T., D. Holland-Moritz, V. Simonet, R. Bellissent, and D. M. Herlach (2002),
Icosahedral Short-Range Order in Deeply Undercooled Metallic Melts, Physical
Review Letters, 89(7), 075507, doi:10.1103/PhysRevLett.89.075507.
Schwerer, F. C., J. W. Conroy, and S. Arajs (1969), Matthiessen's rule and the electrical
resistivity of iron-silicon solid solutions, Journal of Physics and Chemistry of
Solids, 30(6), 1513-1525, doi:10.1016/0022-3697(69)90213-3.
Seagle, C. T., E. Cottrell, Y. Fei, D. R. Hummer, and V. B. Prakapenka (2013), Electrical
and thermal transport properties of iron and iron‐silicon alloy at high pressure,
Geophysical Research Letters, 40(20), 5377-5381, doi:10.1002/2013GL057930.
Secco, R. A. (2017), Thermal Conductivity and Seebeck Coefficient of Fe and Fe-Si
Alloys: Implications for Variable Lorenz Number, Physics of the Earth and
Planetary Interiors, doi:10.1016/j.pepi.2017.01.005.

148
Secco, R. A., and H. H. Schloessin (1989), The electrical resistivity of solid and liquid Fe
at pressures up to 7 GPa, Journal of Geophysical Research: Solid Earth, 94(B5),
5887-5894, doi:10.1029/JB094iB05p05887.
Shahar, A., K. Ziegler, E. D. Young, A. Ricolleau, E. A. Schauble, and Y. Fei (2009),
Experimentally determined Si isotope fractionation between silicate and Fe metal
and implications for Earth's core formation, Earth and Planetary Science Letters,
288(1), 228-234, doi:10.1016/j.epsl.2009.09.025.
Shibazaki, Y., and Y. Kono (2018), Effect of silicon, carbon, and sulfur on structure of
liquid iron and implications for structure‐property relations in liquid iron‐light
element alloys, Journal of Geophysical Research: Solid Earth, 123,
doi:10.1029/2018JB015456.
Shibazaki, Y., Y. Kono, and Y. Fei (2015), Microscopic structural change in a liquid Fe‐
C alloy of~ 5 GPa, Geophysical Research Letters, 42(13), 5236-5242,
doi:10.1002/2015GL064271.
Shimoyama, Y., H. Terasaki, E. Ohtani, S. Urakawa, Y. Takubo, K. Nishida, A. Suzuki,
and Y. Katayama (2013), Density of Fe-3.5wt% C liquid at high pressure and
temperature and the effect of carbon on the density of the molten iron, Physics of
the Earth and Planetary Interiors, 224(Supplement C), 77-82,
doi:10.1016/j.pepi.2013.08.003.
Shin, J. S., J. S. Bae, H. J. Kim, H. M. Lee, T. D. Lee, E. J. Lavernia, and Z. H. Lee
(2005), Ordering–disordering phenomena and micro-hardness characteristics of
B2 phase in Fe–(5–6.5%)Si alloys, Materials Science and Engineering: A, 407(1),
282-290, doi:10.1016/j.msea.2005.07.012.
Silber, R. E., R. A. Secco, and W. Yong (2017), Constant electrical resistivity of Ni along
the melting boundary up to 9 GPa, Journal of Geophysical Research: Solid Earth,
122(7), 5064-5081, doi:10.1002/2017JB014259.
Silber, R. E., R. A. Secco, W. Yong, and J. A. H. Littleton (2018), Electrical resistivity of
liquid Fe to 12 GPa: Implications for heat flow in cores of terrestrial bodies,
Scientific Reports, 8(1), 10758, doi:10.1038/s41598-018-28921-w.
Smylie, D. E. (1999), Viscosity Near Earth's Solid Inner Core, Science, 284(5413), 461-
463, doi:10.1126/science.284.5413.461.

149
Stacey, F. D., and D. E. Loper (2007), A revised estimate of the conductivity of iron alloy
at high pressure and implications for the core energy balance, Physics of the Earth
and Planetary Interiors, 161(1–2), 13-18, doi:10.1016/j.pepi.2006.12.001.
Stacey, F. D., and O. L. Anderson (2001), Electrical and thermal conductivities of Fe–
Ni–Si alloy under core conditions, Physics of the Earth and Planetary Interiors,
124(3–4), 153-162, doi:10.1016/S0031-9201(01)00186-8.
Steinemann, S., and N. Keita (1988), Compressibility and internal pressure anomalies of
liquid 3d transition metals, Helvetica Physica Acta, 61(4), 557-565,
doi:10.5169/seals-115960.
Stevenson, D. J., T. Spohn, and G. Schubert (1983), Magnetism and thermal evolution of
the terrestrial planets, Icarus, 54(3), 466-489, doi:10.1016/0019-1035(83)90241-
5.
Suehiro, S., K. Ohta, K. Hirose, G. Morard, and Y. Ohishi (2017), The influence of sulfur
on the electrical resistivity of hcp iron: Implications for the core conductivity of
Mars and Earth, Geophysical Research Letters, 44(16), 8254-8259,
doi:10.1002/2017GL074021.
Suer, T.-A., J. Siebert, L. Remusat, N. Menguy, and G. Fiquet (2017), A sulfur-poor
terrestrial core inferred from metal–silicate partitioning experiments, Earth and
Planetary Science Letters, 469, 84-97, doi:10.1016/j.epsl.2017.04.016.
Taffs, J., and C. Patrick Royall (2016), The role of fivefold symmetry in suppressing
crystallization, Nature Communications, 7, 13225, doi:10.1038/ncomms13225.
Takafuji, N., K. Hirose, M. Mitome, and Y. Bando (2005), Solubilities of O and Si in
liquid iron in equilibrium with (Mg, Fe) SiO3 perovskite and the light elements in
the core, Geophysical Research Letters, 32(6), doi:10.1029/2005GL022773.
Tarduno, J. A., R. D. Cottrell, M. K. Watkeys, A. Hofmann, P. V. Doubrovine, E. E.
Mamajek, D. Liu, D. G. Sibeck, L. P. Neukirch, and Y. Usui (2010), Geodynamo,
Solar Wind, and Magnetopause 3.4 to 3.45 Billion Years Ago, Science,
327(5970), 1238-1240, doi:10.1126/science.1183445.
Tarduno, J. A., R. D. Cottrell, W. J. Davis, F. Nimmo, and R. K. Bono (2015), A Hadean
to Paleoarchean geodynamo recorded by single zircon crystals, Science,
349(6247), 521-524, doi:10.1126/science.aaa9114.

150
Tateno, S., K. Hirose, R. Sinmyo, G. Morard, N. Hirao, and Y. Ohishi (2018), Melting
experiments on Fe–Si–S alloys to core pressures: Silicon in the core?, American
Mineralogist, 103(5), 742-748, doi:10.2138/am-2018-6299.
Tateno, S., K. Hirose, Y. Ohishi, and Y. Tatsumi (2010), The structure of iron in Earth’s
inner core, Science, 330(6002), 359-361, doi:10.1126/science.1194662.
Tateno, S., Y. Kuwayama, K. Hirose, and Y. Ohishi (2015), The structure of Fe–Si alloy
in Earth's inner core, Earth and Planetary Science Letters, 418, 11-19,
doi:10.1016/j.epsl.2015.02.008.
Taylor, P. L. (1962), The Inelastic Scattering of Electrons at Impurities in Metals,
Proceedings of the Physical Society, 80(3), 755, doi:10.1088/0370-1328/80/3/319.
Terasaki, H., A. Suzuki, E. Ohtani, K. Nishida, T. Sakamaki, and K.-i. Funakoshi (2006),
Effect of pressure on the viscosity of Fe‐S and Fe‐C liquids up to 16 GPa,
Geophysical research letters, 33(22), doi:10.1029/2006GL027147.
Terasaki, H., K. Nishida, Y. Shibazaki, T. Sakamaki, A. Suzuki, E. Ohtani, and T.
Kikegawa (2010), Density measurement of Fe3C liquid using X‐ray absorption
image up to 10 GPa and effect of light elements on compressibility of liquid iron,
Journal of Geophysical Research: Solid Earth, 115(B6),
doi:10.1029/2009JB006905.
Terasaki, H., T. Kato, S. Urakawa, K. Funakoshi, K. Sato, A. Suzuki, and T. Okada
(2002), Viscosity change and structural transition of Molten Fe at 5 GPa,
Geophysical Research Letters, 29(8), 68-61-68-63, doi:10.1029/2001GL014321.
Tsuchiya, T., and M. Fujibuchi (2009), Effects of Si on the elastic property of Fe at
Earth's inner core pressures: First principles study, Physics of the Earth and
Planetary Interiors, 174(1), 212-219, doi:10.1016/j.pepi.2009.01.007.
Tsuno, K., D. S. Grewal, and R. Dasgupta (2018), Core-mantle fractionation of carbon in
Earth and Mars: The effects of sulfur, Geochimica et Cosmochimica Acta, 238,
477-495, doi:10.1016/j.gca.2018.07.010.
Umemoto, K., K. Hirose, S. Imada, Y. Nakajima, T. Komabayashi, S. Tsutsui, and A. Q.
Baron (2014), Liquid iron‐sulfur alloys at outer core conditions by first‐principles
calculations, Geophysical Research Letters, 41(19), 6712-6717,
doi:10.1002/2014GL061233.

151
Venttsel, V., C. Voronov, A. Likhter, and A. Rudnev (1974), Effect of pressure on the
Fermi surface of zinc, Zhurnal Eksperimentalnoi i Teoreticheskoi Fiziki, 65(6),
2445-2454.
Vezzoli, G. C. (1972), Electrical Resistance of Liquid Sulfur to 420 C and of Liquid
Selenium to 700 C, Journal of the American Ceramic Society, 55(2), 65-67,
doi:10.1111/j.1151-2916.1972.tb11210.x.
Vinokurova, L., A. Gapotchenko, E. Itskevich, E. Kulatov, and N. Kulikov (1979), Effect
of pressure on the electron-structure of ferromagnetic nickel and iron, Zhurnal
Eksperimentalnoi i Teoreticheskoi Fiziki, 76(5), 1644-1654.
Vocadlo, L. (2015), Earth's core: Iron and iron alloys, in Treatise on Geophysics edited
by G. Schubert, pp. 117-147, Elsevier.
Wagle, F., and G. Steinle-Neumann (2018), Electrical resistivity discontinuity of iron
along the melting curve, Geophysical Journal International, 213(1), 237-243,
doi:10.1093/gji/ggx526.
Wagle, F., G. Steinle-Neumann, and N. de Koker (2018), Resistivity saturation in liquid
iron–light-element alloys at conditions of planetary cores from first principles
computations, Comptes Rendus Geoscience, doi:10.1016/j.crte.2018.05.002.
Waseda, Y., and K. Suzuki (1975), Structure of molten silicon and germanium by X-ray
diffraction, Zeitschrift für Physik B Condensed Matter, 20(4), 339-343,
doi:10.1007/BF01313204.
Waseda, Y., K. Shinoda, K. Sugiyama, S. Takeda, K. Terashima, and J. M. Toguri
(1995), High temperature X-ray diffraction study of melt structure of silicon,
Japanese journal of applied physics, 34(8R), 4124, doi:10.1143/JJAP.34.4124.
Wicks, J. K., R. F. Smith, D. E. Fratanduono, F. Coppari, R. G. Kraus, M. G. Newman, J.
R. Rygg, J. H. Eggert, and T. S. Duffy (2018), Crystal structure and equation of
state of Fe-Si alloys at super-Earth core conditions, Science Advances, 4(4),
doi:10.1126/sciadv.aao5864.
Williams, Q. (2018), The Thermal Conductivity of Earth's Core: A Key Geophysical
Parameter's Constraints and Uncertainties, Annual Review of Earth and Planetary
Sciences, 46(1), 47-66, doi:10.1146/annurev-earth-082517-010154.

152
Williams, Q., M. H. Manghnani, R. A. Secco, and S. Fu (2015), Limitations on silicon in
the outer core: Ultrasonic measurements at high temperatures and high dK/dP
values of Fe‐Ni‐Si liquids at high pressures, Journal of Geophysical Research:
Solid Earth, 120(10), 6846-6855, doi:10.1002/2015JB012270.
Yensen, T. D. (1915), Magnetic and other properties of iron-silicon alloys, melted in
vacuoRep., University of Illinois at Urbana Champaign, College of Engineering.
Engineering Experiment Station.
Zhang, C., J. F. Lin, Y. Liu, S. Feng, C. Jin, M. Hou, and T. Yoshino (2018b), Electrical
resistivity of Fe‐C alloy at high pressure: effects of carbon as a light element on
the thermal conductivity of the Earth's core, Journal of Geophysical Research:
Solid Earth, 123, doi:10.1029/2017JB015260.
Zhang, D., J. M. Jackson, J. Zhao, W. Sturhahn, E. E. Alp, M. Y. Hu, T. S. Toellner, C.
A. Murphy, and V. B. Prakapenka (2016b), Temperature of Earth's core
constrained from melting of Fe and Fe0.9Ni0.1 at high pressures, Earth and
Planetary Science Letters, 447, 72-83, doi:10.1016/j.epsl.2016.04.026.
Zhang, Y., and Q.-Z. Yin (2012), Carbon and other light element contents in the Earth’s
core based on first-principles molecular dynamics, Proceedings of the National
Academy of Sciences, 109(48), 19579-19583, doi:10.1073/pnas.1203826109.
Zhang, Y., T. Sekine, H. He, Y. Yu, F. Liu, and M. Zhang (2016a), Experimental
constraints on light elements in the Earth’s outer core, Scientific Reports, 6,
22473, doi:10.1038/srep22473.
Zhang, Y., T. Sekine, J. F. Lin, H. He, F. Liu, M. Zhang, T. Sato, W. Zhu, and Y. Yu
(2018a), Shock Compression and Melting of an Fe‐Ni‐Si Alloy: Implications for
the Temperature Profile of the Earth's Core and the Heat Flux Across the Core‐
Mantle Boundary, Journal of Geophysical Research: Solid Earth, 123(2), 1314-
1327, doi:10.1002/2017JB014723.
Zigo, J., O. Roik, P. Švec, M. Mihalkovic, P. Švec, and I. Maťko (2018), Study of the Al-
T-Si (T=Fe, Co, Ni) alloys in the solid, liquid and as-quenched states, Materials
Characterization, 138, 315-324, doi:10.1016/j.matchar.2017.11.044.
Ziman, J. M. (1961), A theory of the electrical properties of liquid metals. I: The
monovalent metals, Philosophical Magazine, 6(68), 1013-1034,
doi:10.1080/14786436108243361.

153
Ziman, J. M. (1970), Review Lecture - Electrons in liquid metals and other disordered
systems, Proceedings of the Royal Society of London. A. Mathematical and
Physical Sciences, 318(1535), 401-420, doi:10.1098/rspa.1970.0151.
Ho, C. Y., R. W. Powell, and P. E. Liley (1972), Thermal Conductivity of the Elements,
Journal of Physical and Chemical Reference Data, 1(2), 279-421,
doi:10.1063/1.3253100.
Nishi, T., H. Shibata, Y. Waseda, and H. Ohta (2003), Thermal conductivities of molten
iron, cobalt, and nickel by laser flash method, Metallurgical and Materials
Transactions A, 34(12), 2801-2807, doi:10.1007/s11661-003-0181-2.

154
Chapter 5
5. Conclusions and Outlook
You cannot teach a man anything;
you can only help him to find it within himself.
– Galileo
The primary aim of this thesis was to measure the electrical resistivity of Ni, Fe and Fe-
4.5wt% along their melting boundary as a sensible way toward better constraining the
transport properties of the Earth’s outer core. It was shown that the electrical resistivity of
Ni and Fe, as well as Fe-4.5Si, alloy remains invariant at the onset of melting throughout
the experimental pressure range in this work. Remarkably, the electrical resistivity (ρ) of
Fe and Fe-4.5Si along the melting boundary has the same value of ~120 μΩcm, which
invalidates Matthissen’s rule in the liquid. However, these results also contradict the
prediction by Stacey and Loper (2007) who predicted such behaviour only in simple
liquid metals along their melting curve.
Based on the structural similarities between solid fcc phase and the melt in both Fe and
Ni, the prediction was made that the melt from fcc Fe phase will exhibit the constant
electrical resistivity along the melting boundary up to γ-ε-liquid triple point. The same
trend is predicted to persist for liquid Ni to much higher pressures due to absence of
known triple points. This behaviour was first considered through the contribution of the
strong electron-electron scattering to electrical resistivity of Ni and Fe, typical of
correlated systems. Similar to heavy fermions, both Ni and Fe follow the Kadowaki-
Woods ratio. However the electron-electron scattering along the melting boundary it is
not sufficient to account for the invariant electrical resistivity at the onset of melt.
The recent developments in understanding the structure and dynamics of liquid 3d
transition metals and alloys were instrumental in interpreting the invariant electrical

155
resistivity of Fe, Ni and Fe-4.5Si along the melting line in the context of local short range
order in liquid with icosahedral symmetry. ISROs favour 3d liquid metals and alloys. In
the melt, they are responsible for lowering the energy of the system by about 8.4% and
share the coordination number with fcc and hcp structures. Moreover, the concentration
of these structures increases with the application of pressure.
ISROs act as scattering centres for electrons and are responsible for the increase in
electrical resistivity by decreasing the mean free path of electron in the liquid. The
presence of these structures counters the effects of pressure which would typically reduce
electrical resistivity of the system. The net effect is the invariant electrical resistivity of
Ni, Fe, and Fe-4.5Si along melting boundary as observed in the experiments performed in
this work.
Consequently it is postulated here that the electrical resistivity of Fe and Fe-4.5Si will
remain invariant along the melting line to inner core P and T conditions because the
typical change of ρ between fcc and hcp will not be observed in melt. The primary reason
is very similar energy of both solid parent phases and the resulting ISROs concentration
in liquid. This behaviour allows the inner core boundary to be used as the anchoring point
to calculate thermal conductivity of liquid Fe-alloy using Wiedemann–Franz law.
Moreover, based on the supporting evidence from recent literature, the prediction was
made that the liquid Fe, alloyed with the small content of light elements in the outer core,
will retain the same electrical resistivity along melting boundary as pure Fe and Fe-4.5 Si,
up to ICB conditions.
The temperature uncertainty of the Fe-alloy at the core mantle boundary (CMB) dictates
that the electrical resistivity of the core-side Fe alloy is bound between 120 μΩcm (this
study) and 150 μΩcm as an upper limit due to the resistivity saturation (Gomi et al.,
2013). However, considering that the temperature at the top-most OC exceeds the melting
temperature of pure Fe, the ρ in that region is assumed to be 150 μΩcm. This value of ρ is
used for calculation of thermal conductivity (κ) at CMB.
The calculated κ values in the outer core are predicated on the negligible role of inelastic
electron scattering which would otherwise invalidate the Wiedemann–Franz law.

156
Thermal conductivity at the CMB and ICB calculated in this work is in agreement with
recent lower estimates from literature. In comparison with the recent high estimates, the
calculated adiabatic heat flow across the CMB points to the possibility that both
thermally and compositionally driven convection may act simultaneously to generate the
geodynamo.
Currently, there is no theoretical framework to precisely quantify the effects of ISROs on
the electrons scattering in liquid metals. Consequently, there is need for a theoretical
treatment of ISRO effects on transport properties in liquid metals, especially at high
pressure. The key unknown is the possibility of strong inelastic scattering at the core
conditions, which may potentially reduce the value of the Lorenz number (L0) by up to
0.65L0. This would consequently reduce the current high estimates of the OC thermal
conductivity calculated from the Wiedemann–Franz law to be roughly in line with most
recent values of κ obtained in direct measurements on Fe (Konôpková et al., 2016). In
such case, κ would likely correspond to earlier theoretical estimates by Stacey and
Anderson (2001).
The postulates and predictions made in this work must also be also validated
experimentally. The easiest experimental approach would be to measure the electrical
resistivity of Fe-alloy with low C content and follow it up by a reasonable combination of
ternary Fe-alloys (e.g., Zhang et al., 2016). If such experiment yields constant electrical
resistivity of those alloys matching the results obtained in this study that would prove the
main hypothesis of this work and would eliminate the compositional uncertainty
considered in previous studies of ρ and κ in the outer core. Synchrotron-based
measurements of evolution of the ISRO structures and clusters at increasing pressure
would be beneficial to the development of theoretical framework for treatment of ISRO
effects in planetary interiors.

157
References
Stacey, F. D., and D. E. Loper (2007), A revised estimate of the conductivity of iron alloy
at high pressure and implications for the core energy balance, Physics of the Earth
and Planetary Interiors, 161(1–2), 13-18, doi:10.1016/j.pepi.2006.12.001.
Gomi, H., K. Ohta, K. Hirose, S. Labrosse, R. Caracas, M. J. Verstraete, and J. W.
Hernlund (2013), The high conductivity of iron and thermal evolution of the
Earth’s core, Physics of the Earth and Planetary Interiors, 224, 88-103,
doi:10.1016/j.pepi.2013.07.010.
Konôpková, Z., R. S. McWilliams, N. Gómez-Pérez, and A. F. Goncharov (2016), Direct
measurement of thermal conductivity in solid iron at planetary core conditions,
Nature, 534(7605), 99-101, doi:10.1038/nature18009.
Stacey, F. D., and O. L. Anderson (2001), Electrical and thermal conductivities of Fe–
Ni–Si alloy under core conditions, Physics of the Earth and Planetary Interiors,
124(3–4), 153-162, doi:10.1016/S0031-9201(01)00186-8.
Zhang, Y., T. Sekine, H. He, Y. Yu, F. Liu, and M. Zhang (2016), Experimental
constraints on light elements in the Earth’s outer core, Scientific Reports, 6,
22473, doi:10.1038/srep22473.

158
Appendix
Figure A. 1: 3000 ton high volume multi anvil press in the Department of Earth
Sciences at Western University, London, Ontario, Canada.

159
Figure A.2: The image in (a) shows the MgO octahedron, with the emplaced Re
furnace, ZrO2-thermal insulator and boron nitride sleeve, which is seen clearly in
panel (b). The sleeve hosts a thick walled ceramic tube with the emplaced sample (c).
The 4-hole ceramic tube with the thermocouple wire is depicted in (f) during the
assembly (e) and emplaced in octahedron cell during final assembly (d). A
measuring tape is placed against the MgO pressure cell for the size comparison.
The strip image in (f) shows 4-hole ceramic tubes during the fabrication. For the
scale purpose, the diameter of each thick ceramic tube (c) with the emplaced sample
is ~1 mm (as shown by the yellow scale bar).

160
Figure A.3: The thick walled ceramic tube is shown during the fabrication process
and the sample emplacement (top panel). The finished ceramic tube with the
emplaced sample is shown from top down perspective (middle panel) and side view
(bottom panel). The entire process of fabrication was done manually, with the
tolerances approaching 0.01 mm.

161
Figure A.4: The images in panels (a-c) depict the step in fabricating 4-hole ceramic
tubes. Ceramic tubes with the emplaced thermocouple wires are shown in (d-e). This
particular phase of fabrication requires that the precision must be maintained
within 0.05 mm. The images also illustrate the experimental challenges of manually
fabricating these parts to the same reproducible consistency.

162
Figure A.5: Depicted is the assembly process (a-g), which includes cleaning and
sterilizing WC cubes (a), and gasket emplacement (d), followed by the sample
pressure cell emplacement (f) and the final assembly (e). Note that the panels are
labeled in order of appearance, and not the order of assembly process. The 4-hole
ceramic tubes with emplaced thermocouple wires (b), and their position in the MgO
pressure cell and BN sleeve (c). Note that the thermocouple wire junction (b) is
always oriented toward the sample in the middle of the octahedron (f). Final
assembled and cemented cell is shown in (f) and the sample emplaced in the thick
walled ceramic tube is shown in (g).

163
Figure A.6: For illustrative purpose, the assembly process is shown again (a-b), this
time also displaying the recovered pressure MgO cell (c-d). The preserved geometry
of the recovered sample obtained by sectioning the MgO cell is shown in (e). The
length of the sample in (e) is 1.5 mm.

164
Figure A.7: The aim of this figure is to contrast the size reduction before (a) and
after compression (b-d) to 7 GPa and to demonstrate good survivability of the post-
experimentally recovered experimental cell (b-c).

165
Figure A.8: For illustrative purpose, figures (a-d) show several representative
examples of recovered sample geometry and survivability of the samples
compressed and heated from low (a,b,d) to high temperatures (c) during the method
testing and technical development.

166
Copyright Permissions
This Agreement between Western University -- Reynold Silber ("You") and John Wiley
and Sons ("John Wiley and Sons") consists of your license details and the terms and
conditions provided by John Wiley and Sons and Copyright Clearance Center.
License Number 4455721191659
License date Oct 25, 2018
Licensed Content Publisher John Wiley and Sons
Licensed Content Publication Journal of Geophysical Research: Solid Earth
Licensed Content Title Constant electrical resistivity of Ni along the melting boundary up to 9 GPa
Licensed Content Author Reynold E. Silber, Richard A. Secco, Wenjun Yong
Licensed Content Date Jul 26, 2017
Licensed Content Volume 122
Licensed Content Issue 7
Licensed Content Pages 18
Type of use Dissertation/Thesis
Requestor type Author of this Wiley article
Format Print and electronic
Portion Full article
Will you be translating? No
Title of your thesis / dissertation Electrical Resistivity of Nickel, Iron and Iron-Silicate Alloy Melts at High Pressure with Implications for the Thermal Conductivity of the Earth’s Core
Expected completion date Dec 2018
Expected size (number of pages) 200
Requestor Location Western University 1151 Richmond Sy. London, ON N6A3K7 Canada
Attn: Western University
Publisher Tax ID EU826007151
Total 0.00 USD
Terms and Conditions
TERMS AND CONDITIONS This copyrighted material is owned by or exclusively licensed to John Wiley & Sons, Inc. or one of
its group companies (each a"Wiley Company") or handled on behalf of a society with which a

167
Wiley Company has exclusive publishing rights in relation to a particular work (collectively
"WILEY"). By clicking "accept" in connection with completing this licensing transaction, you
agree that the following terms and conditions apply to this transaction (along with the billing and
payment terms and conditions established by the Copyright Clearance Center Inc., ("CCC's Billing
and Payment terms and conditions"), at the time that you opened your RightsLink account (these
are available at any time at http://myaccount.copyright.com).
Terms and Conditions
The materials you have requested permission to reproduce or reuse (the "Wiley Materials")
are protected by copyright.
You are hereby granted a personal, non-exclusive, non-sub licensable (on a stand-alone
basis), non-transferable, worldwide, limited license to reproduce the Wiley Materials for
the purpose specified in the licensing process. This license, and any CONTENT (PDF or
image file) purchased as part of your order, is for a one-time use only and limited to any
maximum distribution number specified in the license. The first instance of republication or
reuse granted by this license must be completed within two years of the date of the grant of
this license (although copies prepared before the end date may be distributed thereafter).
The Wiley Materials shall not be used in any other manner or for any other purpose,
beyond what is granted in the license. Permission is granted subject to an appropriate
acknowledgement given to the author, title of the material/book/journal and the publisher.
You shall also duplicate the copyright notice that appears in the Wiley publication in your
use of the Wiley Material. Permission is also granted on the understanding that nowhere in
the text is a previously published source acknowledged for all or part of this Wiley
Material. Any third party content is expressly excluded from this permission.
With respect to the Wiley Materials, all rights are reserved. Except as expressly granted by
the terms of the license, no part of the Wiley Materials may be copied, modified, adapted
(except for minor reformatting required by the new Publication), translated, reproduced,
transferred or distributed, in any form or by any means, and no derivative works may be
made based on the Wiley Materials without the prior permission of the respective copyright
owner.For STM Signatory Publishers clearing permission under the terms of the STM
Permissions Guidelines only, the terms of the license are extended to include
subsequent editions and for editions in other languages, provided such editions are for
the work as a whole in situ and does not involve the separate exploitation of the
permitted figures or extracts,You may not alter, remove or suppress in any manner any
copyright, trademark or other notices displayed by the Wiley Materials. You may not
license, rent, sell, loan, lease, pledge, offer as security, transfer or assign the Wiley
Materials on a stand-alone basis, or any of the rights granted to you hereunder to any other
person.
The Wiley Materials and all of the intellectual property rights therein shall at all times
remain the exclusive property of John Wiley & Sons Inc, the Wiley Companies, or their
respective licensors, and your interest therein is only that of having possession of and the
right to reproduce the Wiley Materials pursuant to Section 2 herein during the continuance
of this Agreement. You agree that you own no right, title or interest in or to the Wiley
Materials or any of the intellectual property rights therein. You shall have no rights
hereunder other than the license as provided for above in Section 2. No right, license or
interest to any trademark, trade name, service mark or other branding ("Marks") of WILEY

168
or its licensors is granted hereunder, and you agree that you shall not assert any such right,
license or interest with respect thereto
NEITHER WILEY NOR ITS LICENSORS MAKES ANY WARRANTY OR
REPRESENTATION OF ANY KIND TO YOU OR ANY THIRD PARTY, EXPRESS,
IMPLIED OR STATUTORY, WITH RESPECT TO THE MATERIALS OR THE
ACCURACY OF ANY INFORMATION CONTAINED IN THE MATERIALS,
INCLUDING, WITHOUT LIMITATION, ANY IMPLIED WARRANTY OF
MERCHANTABILITY, ACCURACY, SATISFACTORY QUALITY, FITNESS FOR A
PARTICULAR PURPOSE, USABILITY, INTEGRATION OR NON-INFRINGEMENT
AND ALL SUCH WARRANTIES ARE HEREBY EXCLUDED BY WILEY AND ITS
LICENSORS AND WAIVED BY YOU.
WILEY shall have the right to terminate this Agreement immediately upon breach of this
Agreement by you.
You shall indemnify, defend and hold harmless WILEY, its Licensors and their respective
directors, officers, agents and employees, from and against any actual or threatened claims,
demands, causes of action or proceedings arising from any breach of this Agreement by
you.
IN NO EVENT SHALL WILEY OR ITS LICENSORS BE LIABLE TO YOU OR ANY
OTHER PARTY OR ANY OTHER PERSON OR ENTITY FOR ANY SPECIAL,
CONSEQUENTIAL, INCIDENTAL, INDIRECT, EXEMPLARY OR PUNITIVE
DAMAGES, HOWEVER CAUSED, ARISING OUT OF OR IN CONNECTION WITH
THE DOWNLOADING, PROVISIONING, VIEWING OR USE OF THE MATERIALS
REGARDLESS OF THE FORM OF ACTION, WHETHER FOR BREACH OF
CONTRACT, BREACH OF WARRANTY, TORT, NEGLIGENCE, INFRINGEMENT
OR OTHERWISE (INCLUDING, WITHOUT LIMITATION, DAMAGES BASED ON
LOSS OF PROFITS, DATA, FILES, USE, BUSINESS OPPORTUNITY OR CLAIMS OF
THIRD PARTIES), AND WHETHER OR NOT THE PARTY HAS BEEN ADVISED OF
THE POSSIBILITY OF SUCH DAMAGES. THIS LIMITATION SHALL APPLY
NOTWITHSTANDING ANY FAILURE OF ESSENTIAL PURPOSE OF ANY LIMITED
REMEDY PROVIDED HEREIN.
Should any provision of this Agreement be held by a court of competent jurisdiction to be
illegal, invalid, or unenforceable, that provision shall be deemed amended to achieve as
nearly as possible the same economic effect as the original provision, and the legality,
validity and enforceability of the remaining provisions of this Agreement shall not be
affected or impaired thereby.
The failure of either party to enforce any term or condition of this Agreement shall not
constitute a waiver of either party's right to enforce each and every term and condition of
this Agreement. No breach under this agreement shall be deemed waived or excused by
either party unless such waiver or consent is in writing signed by the party granting such
waiver or consent. The waiver by or consent of a party to a breach of any provision of this
Agreement shall not operate or be construed as a waiver of or consent to any other or
subsequent breach by such other party.
This Agreement may not be assigned (including by operation of law or otherwise) by you
169
without WILEY's prior written consent.
Any fee required for this permission shall be non-refundable after thirty (30) days from
receipt by the CCC.
These terms and conditions together with CCC's Billing and Payment terms and conditions
(which are incorporated herein) form the entire agreement between you and WILEY
concerning this licensing transaction and (in the absence of fraud) supersedes all prior
agreements and representations of the parties, oral or written. This Agreement may not be
amended except in writing signed by both parties. This Agreement shall be binding upon
and inure to the benefit of the parties' successors, legal representatives, and authorized
assigns.
In the event of any conflict between your obligations established by these terms and
conditions and those established by CCC's Billing and Payment terms and conditions, these
terms and conditions shall prevail.
WILEY expressly reserves all rights not specifically granted in the combination of (i) the
license details provided by you and accepted in the course of this licensing transaction, (ii)
these terms and conditions and (iii) CCC's Billing and Payment terms and conditions.
This Agreement will be void if the Type of Use, Format, Circulation, or Requestor Type
was misrepresented during the licensing process.
This Agreement shall be governed by and construed in accordance with the laws of the
State of New York, USA, without regards to such state's conflict of law rules. Any legal
action, suit or proceeding arising out of or relating to these Terms and Conditions or the
breach thereof shall be instituted in a court of competent jurisdiction in New York County
in the State of New York in the United States of America and each party hereby consents
and submits to the personal jurisdiction of such court, waives any objection to venue in
such court and consents to service of process by registered or certified mail, return receipt
requested, at the last known address of such party.
WILEY OPEN ACCESS TERMS AND CONDITIONS Wiley Publishes Open Access Articles in fully Open Access Journals and in Subscription journals
offering Online Open. Although most of the fully Open Access journals publish open access
articles under the terms of the Creative Commons Attribution (CC BY) License only, the
subscription journals and a few of the Open Access Journals offer a choice of Creative Commons
Licenses. The license type is clearly identified on the article.
The Creative Commons Attribution License The Creative Commons Attribution License (CC-BY) allows users to copy, distribute and transmit
an article, adapt the article and make commercial use of the article. The CC-BY license permits
commercial and non-
Creative Commons Attribution Non-Commercial License The Creative Commons Attribution Non-Commercial (CC-BY-NC)License permits use,
distribution and reproduction in any medium, provided the original work is properly cited and is not
used for commercial purposes.(see below)
Creative Commons Attribution-Non-Commercial-NoDerivs License The Creative Commons Attribution Non-Commercial-NoDerivs License (CC-BY-NC-ND) permits

170
use, distribution and reproduction in any medium, provided the original work is properly cited, is
not used for commercial purposes and no modifications or adaptations are made. (see below)
Use by commercial "for-profit" organizations Use of Wiley Open Access articles for commercial, promotional, or marketing purposes requires
further explicit permission from Wiley and will be subject to a fee.
Further details can be found on Wiley Online
Library http://olabout.wiley.com/WileyCDA/Section/id-410895.html
Silber, R. E., Secco, R. A., Yong, W. and Littleton, J. (2018) Electrical resistivity of
liquid Fe to 12 GPa: Implications for heat flow in cores of terrestrial bodies, Nature
Scientific Reports, 8, 10758, doi: 10.1038/s41598-018-28921-w
This article is licensed under a Creative Commons Attribution 4.0 International License,
which permits use, sharing, adaptation, distribution and reproduction in any medium or
format, as long as you give appropriate credit to the original author(s) and the source,
provide a link to the Creative Commons license, and indicate if changes were made. The
images or other third party material in this article are included in the article’s Creative
Commons license, unless indicated otherwise in a credit line to the material. If material is
not included in the article’s Creative Commons license and your intended use is not
permitted by statutory regulation or exceeds the permitted use, you will need to obtain
permission directly from the copyright holder. To view a copy of this license, visit
http://creativecommons.org/licenses/by/4.0/.

171
Curriculum Vitae
Name
Reynold E. Silber
Education
PhD. Geophysics, 2014-2018
University of Western Ontario
London, Ontario
MSc. Physics, 2011-2013
University of Western Ontario
London, Ontario
MSc. Geophysics, 2009-2011
University of Western Ontario
London, Ontario
Hon. BSc. Geology, 2005-2009
The University of Western Ontario
London, Ontario
Honours and
Awards
The Geophysics Travel Scholarship
Robert and Ruth Lumsden Graduate Awards in Science
Western Graduate Research Scholarship
Western Graduate Thesis Research Award
Northern Scientific Training Program Award, Indian and Northern
Affairs Canada
Integrating Atmospheric Chemistry and Physics from Earth to Space
(IACPES) NSERC CREATE Scholarship
Faculty of Science Teaching Assistant Award of Excellence
Faculty of Science Entrance Scholarship
Related Work
Experience
Graduate Research Assistant, 2009-2018
The University of Western Ontario
London, Ontario
Teaching Assistant, 2009-2018
The University of Western Ontario
London, Ontario

172
Refereed Journal Articles
Silber, R. E., Secco, R. A., Yong, W. and Littleton, J. (2018) Electrical resistivity of
liquid Fe to 12 GPa: Implications for heat flow in cores of terrestrial bodies, Nature
Scientific Reports, 8, 10758, doi: 10.1038/s41598-018-28921-w
Silber, E. A., Niculescu, M. L., Butka, P., Silber, R. E. (2018) Nitric oxide production by
centimetre sized meteoroids and the role of linear and nonlinear processes in the shock
bound flow fields, Atmosphere, Linear to Non-Linear Flows in Atmospheric Processes
Special Issue, 9(5), 202, 1-21, doi: 10.3390/atmos9050202
Silber, R. E., Secco, R. A. and Yong, W. (2017) Electrical Resistivity Measurements of
Solid and Liquid Ni up to 9 GPa, JGR-Solid Earth, 122, doi:10.1002/2017JB014259
Silber, E. A., Hocking, W. K., Niculescu, M. L., Gritsevich, M., Silber, R. E. (2017) On
Shock Waves and the Role of Hyperthermal Chemistry in the Early Diffusion of
Overdense Meteor Trains, MNRAS, 469(2), 1869-1882, doi: 10.1093/mnras/stx923
Hocking, W. K., Silber, R. E., Plane, J., Feng, W., Garbanzo-Salas, M. (2016) Decay
times of transitionally dense specularly reflecting meteor trails and potential chemical
impact on trail lifetimes, Annales Geophysicae, 34(12), 1119-1144, doi: 10.5194/angeo-
34-1119-2016
Secco, R., Silber, R. E. (2016) Indoor Micro-Gravity Survey, The Physics Teacher,
54(4), 213-215, doi: 10.1119/1.4944359
Silber, R. E., Secco, R. E. (2012) Viscosity of liquid sulfur at 4.5 GPa in the L and L’
regions, High Pressure Research: An International Journal, 32 (4), 451-456, doi:
10.1080/08957959.2012.742892
Non-Refereed Journal Articles
Silber, E. A., Hocking, W. K., Silber, R. E. (2018) Shock waves generated by overdense
meteors in the mesosphere lower thermosphere, International Meteor Conference
Proceedings, Petnica, Serbia, 21-24 September, 2017
Silber, R. E. (2016) Northwest Africa 10998 meteorite classification, Officially approved
and published by Meteoritical Bulletin Database, 105
Silber, R. E. (2013) Potential for Measurement of Mesospheric Ozone Density from
Overdense Meteor Trains with a Monostatic Meteor Radar, Electronic Thesis and
Dissertation Repository, Paper 1789, http://ir.lib.uwo.ca/etd/1789
Silber, R. E. (2011) Viscosity of Sulfur at 4.5 GPa and in the L and L’ Liquid Regions,
MSc Thesis, The School of Graduate and Postdoctoral Studies, Western University, pp.
144
173
Talks and Presentations
Nearly 40 presentations, only selected seven listed
Silber, R. E., Secco, R., Yong, W., Littleton, J. (2018) Electrical Resistivity of Solid and
Liquid Fe4.5wt%Si at 3-9 GPa, AGU Fall Meeting, Washington, DC, USA, 10-14
December, 2018, abstract # 218453
Yong, W., Littleton, J., Secco, R., Silber, R. E. (2018) Electrical Resistivity of Solid and
Liquid Fe at 14 - 24 GPa, AGU Fall Meeting, Washington, DC, USA, 10-14 December,
2018, abstract # 218453
Silber, E. A., Gritsevich, M., Silber, R. E., Butka, P. (2018) The production of nitric
oxide by centimetre-sized meteoroids in the upper atmosphere, European Planetary
Science Congress 2018, Berlin, Germany, September 16 – 21, 2018, abstract #582.
Silber, E. A., Gritsevich, M., Silber, R. E. (2018) Nitric oxide production by centimeter-
sized meteoroids impacting the Earth’s atmosphere, 81st Annual Meeting of The
Meteoritical Society, Moscow, Russia, July 22-27, 2018, abstract #6183.
Silber, R. E., Secco, R., Ezenwa, I., Yong, W., Littleton, J. (2017) Fe, Co, Ni: Electrical
Resistivity Along their Melting Boundaries, AGU Fall Meeting, New Orleans, Louisiana,
USA, 11-15 December, 2017, abstract # 218453
Silber, E. A., Silber, R. E., Hocking, W. K. (2017) Shock waves generated by overdense
meteors in the mesosphere lower thermosphere, International Meteor Conference,
Petnica, Serbia, 21-24 September, 2017
Secco, R., Silber, R. E., Ezenwa, I., Yong, W., Littleton, J. (2017) Electrical Resistivity
of Fe, Co and Ni along their melting boundaries, 55th EHPRG Meeting, Poznan, Poland,
3 – 8 September, 2017
Silber, R. E., Hocking, W. K., Silber, E. A., Gritsevich, M., Niculescu, M. L. (2017)
Detection and Characterization of Meteor Shockwaves Using Radar Observed Meteor
Head Echo/Height Correlation, 32nd URSI GASS, 19-26 August 2017, Montreal,
Quebec, Canada
Hocking, W. K., Silber, R. E. (2017) Radio-wave scattering by meteors and the
dependence on meteor trail structure, 32nd URSI GASS, 19-26 August 2017, Montreal,
Quebec, Canada (invited talk)
Silber, R. E., Silber, E. A., Gritsevich, M. (2017), On detection of shockwaves generated
by overdense meteors, The 80th Annual Meeting of the Meteoritical Society, 23-28 July,
2017, Santa Fe, New Mexico, USA, abstract #6256
Silber, R. E., Silber, E. A., Gritsevich, M., Niculescu, M. L., Hocking, W. K. (2017), On
the mechanism of early rapid removal of elecrons from postadiabatically expanding
overdense meteor trains, The 80th Annual Meeting of the Meteoritical Society, 23-28
July, 2017, Santa Fe, New Mexico, USA, abstract # 6317
Moreno-Ibáñez, M., Gritsevich, M., Lyytinen, E., Silber, E. A., Silber, R. E., Trigo-
Rodríguez, J. M. (2017) Revised masses for the Canadian meteor network fireballs, The

174
80th Annual Meeting of the Meteoritical Society, 23-28 July, 2017, Santa Fe, New
Mexico, USA, abstract # 6318
Hocking, W.K., Silber, R. E., Silber, E. A. (2017) Impact of Ozone and Oxygen on Early
Stage Decay of Transitionally- and Over-dense Meteor Trails, The 15th International
Workshop on Technical and Scientific Aspects of MST Radar and the 18th EISCAT
International Symposium (MST15/iMST2/EISCAT18), held in The National Istitute of
Polar Research (NIPR), May 26-31, 2017, Tachikawa, Tokyo, Japan, paper M7-8
Silber, R. E., Secco, R. A. and Yong, W. (2017) Electrical Resistivity of Molten Ni at
High Pressures and Comparison with Preliminary Results on Liquid Fe, CAP Congress,
May 28 - June 2, 2017, Kingston, ON, Canada, abstract #1591
Silber, R. E., Hocking, W. K., Silber, E. A., Gritsevich, M. (2017) On the Possibility of
Constraining Bright Meteor Shock Wave Forming Altitudes – Theoretical Consideration
of Relationship to Radar Observed Meteor Head Echo Termination Heights in MLT,
CAP Congress, May 28 - June 2, 2017, Kingston, ON, Canada, abstract #1578
Silber, R. E., Secco, R. A. and Yong, W. (2017) Electrical Resistivity of Molten Ni at
High Pressures, Fallona Interdisciplinary Showcase, Western University, January 16,
2017
Gritsevich, M., Silber, E. A., Lyytinen, E., Moreno-Ibáñez, M., Trigo-Rodríguez, J. M.,
Muinonen, K., Penttila, A., Silber, R. E. (2017) A New Approach to Estimate Meteoroid
Impact Hazard Based on Atmospheric Trajectory Analysis, LPSC 48, held March 20–24,
2017, The Woodlands, TX, USA, abstract 2471
Silber, R. E., Secco, R. A. and Yong, W. (2016) Electrical Resistivity of Molten Ni at
High Pressures, AGU Fall Meeting, 12-16 December 2016, San Francisco, USA
Secco, R. A., Ezenwa, I. C., Silber, R. E., Littleton, J. A. H. and Yong W. (2016) Is
Electrical Resistivity Constant on the Pressure Dependent Melting Boundary?, The 54th
European High Pressure Research Group (EHPRG) International Meeting on High
Pressure Science and Technology, 4 – 9 September 2016, Bayreuth, Germany
Secco, R. A., Ezenwa, I. C., Silber, R. E., Littleton, J. A. H. and Yong W. (2016)
Resistivity of Liquid Transition Metals on the Pressure-Dependent Melting Boundary,
2016 COMPRES Annual Meeting, 19 – 23 June 2016, New Mexico, USA
Hocking, W. K., Silber, R. E. (2015) Measurement of Mesospheric Ozone Using Meteor
Decay Times, CAP Congress, Edmonton, AB, June 15-19, 2015 (invited talk)
Silber, R. E. and Hocking, W. K. (2014) The Hyperthermal Chemistry Regime in
overdense meteors and relation to ozone density, MST14 Workshop, INPE-São José dos
Campos/SP, Brazil, May 25-31, 2014 (talk)
Silber, R. E. and Hocking, W. K. (2014) Measurements of mesospheric ozone density
using overdense meteor data, MST14 Workshop, INPE-São José dos Campos/SP, Brazil,
May 25-31, 2014
Silber, R. E. and Hocking, W. K. (2013) Mesospheric Ozone Determination from the
Radar Meteor Echo Duration, IACPES Symposium, York University, Toronto, Jun 10-
14, 2013

175
Silber, R. E. and Hocking, W. K. (2013) Mesospheric Ozone Determination from the
Radar Meteor Echo Duration, DASP Conference, Kingston, Feb 17-20, 2013
Secco, R. A., Silber, R. E. (2012) Viscosity of liquid sulfur at 4.5 GPa in the L and L’
regions, 50th EHPRG Meeting, Sep 16-21, 2012, Thessaloniki, Greece
Silber, R. E. (2012) Study of Overdense Meteors and the Secondary Ozone Layer Using
VHF Meteor Radars, IACPES Symposium, York University, Toronto, Aug 10, 2012
Osinski, G.R., Silber, R. E., Grieve, R.A.F. (2010) "Suevites" of the Popigai Impact
Structure, Russia: (Mis)understood?, 41st LPSC, Mar 1-5, 2010, The Woodlands, Texas,
1533, p.2171
Silber R. E. and Osinski G. R. (2009) Origin of suevites at the Popigai impact structure,
Russia (abstract #GA32B-03), Eos, Transactions, AGU, 90(22), Joint Assembly
Supplement, Toronto, On, May 27, 2009
Silber, R. E. (2008) Reflection on the formation of the Moon – Is the consensus reached
too early?, Western University
Silber, R. E. (2008) Lunar Mining Prospects, Western University
Silber, R. E., J. Fars and A. Durbano (2008) Acid Mine Drainage: Theory, Impacts and
Solutions, Western University
Silber, R. E. (2007) The influence of politics on the science in the United States of
America: Observations from the Great Canyon, The Undergraduate Physics Conference,
Western University