ELECTRICAL POWER DISPATCH ANALYTICS: A CASE...
55
UNIVERSITY OF NAIROBI FACULTY OF ENGINEERING DEPARTMENT OF ELECTRICAL AND INFORMATION ENGINEERING ELECTRICAL POWER DISPATCH ANALYTICS: A CASE STUDY OF KENYA NATIONAL POWER GRID. CREATE A WEB INTERFACE AND DATABASE THAT ALLOWS A USER TO BUILD A DYNAMIC DISPLAY OF THE KENYA POWER TRANSMISSION ANALYTICS. PROJECT INDEX: PRJ 033 SUBMITTED BY: MOGENI PETER ORINA F17/1415/2011 SUPERVISOR: PROF. MWANGI MBUTHIA EXAMINER: MR. S. OGABA PROJECT REPORT SUBMITTED IN PARTIAL FULFILLMENT OF THE REQUIREMENT FOR THE AWARD OF THE DEGREE OF BACHELOR OF SCIENCE IN ELECTRICAL AND ELECTRONICS ENGINEERING OF THE UNIVERSITY OF NAIROBI 2015. SUBMITTED ON: 17TH MAY 2016
Transcript of ELECTRICAL POWER DISPATCH ANALYTICS: A CASE...

UNIVERSITY OF NAIROBI
FACULTY OF ENGINEERING DEPARTMENT OF ELECTRICAL AND INFORMATION
ENGINEERING
ELECTRICAL POWER DISPATCH ANALYTICS: A CASE STUDY OF KENYA NATIONAL POWER GRID.
CREATE A WEB INTERFACE AND DATABASE THAT ALLOWS A USER TO BUILD A DYNAMIC DISPLAY OF THE
KENYA POWER TRANSMISSION ANALYTICS.
PROJECT INDEX: PRJ 033
SUBMITTED BY:
MOGENI PETER ORINA
F17/1415/2011
SUPERVISOR: PROF. MWANGI MBUTHIA
EXAMINER: MR. S. OGABA
PROJECT REPORT SUBMITTED IN PARTIAL FULFILLMENT OF THE REQUIREMENT FOR THE AWARD OF THE DEGREE OF BACHELOR OF SCIENCE
IN ELECTRICAL AND ELECTRONICS ENGINEERING OF THE UNIVERSITY OF NAIROBI 2015.
SUBMITTED ON: 17TH MAY 2016

DECLARATION OF ORIGINALITY
NAME OF STUDENT: Mogeni Peter Orina
REGISTRATION NUMBER: F17/1415/2011
COLLEGE: Architecture and Engineering
FACULTY/SCHOOL/INSTITUTE: Engineering
DEPARTMENT: Electrical and Information Engineering
COURSE NAME: Bachelor of Science in Electrical and Electronic Engineering.
TITLE OF WORK: Electrical Power Dispatch Analytics: A case study of Kenya National Power Grid: Create a Web Interface and Database that allows a user to build a Dynamic Display of the Kenya Power Transmission Analytics
1. I understand what plagiarism is, and I am aware of the university policy in this regard. 2. I declare that this final year project report is my original work and has not been submitted
elsewhere for examination, award of a degree or publication. Other people's work used in this project is properly acknowledged and referenced in agreement with the University of Nairobi's requirements.
3. I have not sought or used the services of any professional agencies to produce this work. 4. I have not allowed, and shall not allow anyone to copy my work with the intention of
passing it off as his/her work. 5. I understand that any false claim in respect of this project shall result in disciplinary
action, per University anti-plagiarism policy. 6.
Signature: ………………………………………… Date …………………………………….

CERTIFICATION This report has been submitted to the Department of Electrical and Information Engineering of
the University of Nairobi with my approval as supervisor:
Prof. Mwangi Mbuthia
Signature:………………………………………….
Date:……………………………………………..

DEDICATION I dedicate this project to my dear family for their love, support, and encouragement throughout
my academic journey.

ACKNOWLEDGEMENT Second, I wish to thank my colleagues and friends. I would like to acknowledge OnesmusOsero
for his help in both technical and personal aspects. I would also like to appreciate Khaemba
Samuel, Karugu James, Noreen Mogaka and Diana Mcligeyo for their contribution towards the
accomplishment of this project. Finally, my particular thanks go to my parents and siblings,
without their love, support and encouragement, I could not finish my undergraduate study.

TABLE OF CONTENTS
DECLARATION OF ORIGINALITY ........................................................................................2
CERTIFICATION ......................................................................................................................3
DEDICATION ............................................................................................................................4
ACKNOWLEDGEMENT ...........................................................................................................5
LIST OF FIGURES ....................................................................................................................8
LIST OF TABLES ......................................................................................................................9
LIST OF ABBREVIATIONS.................................................................................................... 10
ABSTRACT ............................................................................................................................. 11
CHAPTER ONE ....................................................................................................................... 12
1 INTRODUCTION .............................................................................................................. 12
1.1.1 Kenya Electricity Generation Capacity ...................................................................... 13
1.1.2 Electrical Power Dispatch .......................................................................................... 13
1.1.3 Transmission Analytics ............................................................................................. 14
1.1.4 Power Dispatch Analytics.......................................................................................... 14
1.1.5 Economic Dispatch.................................................................................................... 14
1.1.6 Solution to Economic Dispatch.................................................................................. 14
1.1.7Conventional optimization methods ............................................................................ 15
1.2 Project Statement ............................................................................................................. 16
1.3 Project Objective ............................................................................................................. 16
1.5 Project Justification.......................................................................................................... 17
1.6 Project Organization ........................................................................................................ 18
CHAPTER TWO ...................................................................................................................... 19
2 LITERATURE REVIEW ................................................................................................... 19
2.1 BACKGROUND ............................................................................................................. 19
2.1.1 The evolution of the Power Grid. ............................................................................... 19
2.1.2 Benefits of grid interconnections ............................................................................... 19
2.1.3 The Kenya Power Transmission System .................................................................... 20
2.2 Benefits of High Voltage Transmission ............................................................................ 23
2.3 Comparison and Evaluation of Similar Projects In The Past ............................................. 24
2.4 Project requirements in fulfilling the specific and overall objectives ................................ 25

CHAPTER THREE ................................................................................................................... 27
3 METHODOLOGY AND DESIGN ........................................................................................ 27
3.1 PROBLEM FORMULATION. ........................................................................................ 27
3.1.1 Newton-Raphson method .......................................................................................... 27
3.2 Project implementation Newton-Raphson ........................................................................ 31
3.2.1 Line Loading Algorithm ............................................................................................ 32
3.2.2 Pypower .................................................................................................................... 33
3.3 The Web Interface Design ............................................................................................... 36
3.4 Overall Project flows Chart .............................................................................................. 41
CHAPTER 4 ............................................................................................................................. 42
4 RESULTS AND ANALYSIS ................................................................................................. 42
4.1 Power flow results ........................................................................................................... 47
4.2 Analysis ........................................................................................................................... 47
CHAPTER 5 ............................................................................................................................. 48
5.0 CONCLUSION ................................................................................................................... 48
5.1 Recommendation and future study ................................................................................... 48
REFERENCES ......................................................................................................................... 49
APPENDIX .............................................................................................................................. 51

LIST OF FIGURES
Figure 1. block diagram of a typical AC Electrical power supply system ................................. 22
Figure 2. Web application called GTCView. ........................................................................... 25
Figure 3. Approach for modeling a system using Python ......................................................... 32
Figure 4. Home Form .............................................................................................................. 37
Figure 5. Asset web interface. ................................................................................................. 37
Figure 6. Add new Transmission line interface ........................................................................ 38
Figure 7. Delete transmission line interface ............................................................................. 39
Figure 8. Update transmission line interface ............................................................................ 39
Figure 9. Transmission Analytics ............................................................................................ 40
Figure 10. Program flow-chart.................................................................................................. 41
Figure 11. Buses Records interface........................................................................................... 43
Figure 12. Generators Records interface ................................................................................... 44
Figure 13. Transmission lines Records interface ....................................................................... 46

LIST OF TABLES
Table 1. Bus Records Table ...................................................................................................... 42
Table 2. Generators Records table ............................................................................................ 43
Table 3 Transmission lines Records table ................................................................................ 45
LIST OF ABBREVIATIONS
OPF Optimal Power Flow
MW Megawatts
IEEE Institute of Electrical and Electronics Engineering
GIS Geographic Information System
ArcIMS Arc Internet Map Server
SCADA Supervisory Control And Data Acquisition
NR Newton-Raphson Power Flow

ABSTRACT Power Systems are established in order to facilitate transfer of power to the respective load
centers with reliability, security and economy using sound technical and commercial principles.
The nature of electrical energy is such that it is produced and consumed on a real-time basis
whereby production and consumption should have an ideally instantaneous balance. In order to
arrive at this balance, all network parameters need to be determined so as to achieve effective
power transfer. This is achieved through carrying out load flow studies in the power system.
With the increased use of internet and digitation of many organizational processes. The
traditional methods of calculation of load on a standalone computer has thus become impractical
and thus the need to come up with a web-based application that can calculate power flow for any
grid network provided the parameters are input through a web interface form. The web
application can be made accessible world-wide by the use of the internet and therefore
empowering power generating and transmission facilities to use it from whichever location they
might be.In addition to provide them with crucial analytics that are key to decision making
regarding electrical power dispatch.

CHAPTER ONE
1 INTRODUCTION
In Kenya, the energy sector is dominated by imported petroleum used mainly in the modern
sector, wood fuel, which is widely used by rural communities, the urban middle class and in the
informal sector. Regarding energy supply, wood fuel provides about 68% of the total energy
requirements, petroleum energy 20%, electricity 9%, and other sources account for the remaining
3%. Commercial energy consumption is dominated by oil followed by electrical power and coal
accounting for the remaining 30%.
The key bodies involved in the energy industry in Kenya are as follows:-
I. The Ministry of Energy and Petroleum which is in charge of making and articulating
energy policies to create an enabling environment for efficient operation and growth of
the sector. It sets the strategic direction for the growth of the industry and provides a
long-term vision for all area players.[1]
II. The Energy Regulatory Commission (ERC) is responsible for regulation of the energy
sector.[2] Its functions include licensing, retail and bulk tariff setting and oversight,
coordination of the development of Indicative Energy Plans, monitoring, and
enforcement of industry regulations
III. The Kenya Electricity Generating Company (KenGen) is the leading player in
electricity generation, with a current installed capacity of 1,580MW as per March 2015.
The Company accounts for about 71.3% of the installed capacity from various power
generation sources that include hydropower, thermal, geothermal and wind.
IV. Independent Power Producers (IPPs) are private investors in the power sector involved
in generation either on a large scale or for the development of renewable energy under
the Feed-in -Tariff Policy.[2] Some of the current players comprise IberAfrica, Tsavo,
Or-power, Rabai, menti, Gikira and Mumias. Collectively, they account for about 29%
of the country’s installed capacity.
V. The Kenya Power and Lighting Company (KPLC) is the sole off-taker in the power
market in the country and is governed by the State Corporations Act. It is currently the
only retailer as well as the system operator in addition to running the bulk of the
transmission system as well as the entire distribution network

VI. Kenya Electricity Transmission Company (KETRACO) is a state Corporation 100%
owned by the Government of Kenya. With a mandate to plan, design, construct, own,
operate and maintain the new high voltage (132kV and above) electricity transmission
infrastructure that will form the backbone of the National Transmission Grid & regional
grid connections. [2]
1.1.1 Kenya Electricity Generation Capacity
The interconnected grid power system in Kenya had a total installed and operating a capacity of
2,177 MW as at March 2015; made up of 820.6 MW of hydro, 717MW of thermal, 588 MW of
geothermal, 25.5 MW of the wind, 26MW from cogeneration. There was also 26.0MW in
isolated mini-grids. The total productive capacity was 2,127 MW during normal hydrology of
which 2,106MW was from the interconnected system. Hydro accounts for around 37.7% of the
total energy supply. Registered interconnected national sustained peak demand was 1,512MW
recorded in February 2015.
1.1.2 Electrical Power Dispatch
The provision of electrical power from the generating sources to the consumer through the
national grid while making serious considerations between supply and demand. In a centralized
power system, a balance is made to ensure that flashovers or surges are not experienced. The
balance between supply and demand powers is called power balance. Typically fluctuation
between supply and consumption is indicated by power frequency. When the load demand is
higher than supplied power, the frequency drops from the nominal value 50 hertz, and when
supply is greater than load demand, the frequency increase above the nominal value 50 hertz.
In making power dispatch considerations, a number of factors are surveyed, such as: -
• The generating cost
• Transmission losses since they have both energy and capacity cost components.
• Power consumer
Over the past decades, power demand has increased tremendously leading to inefficiencies of the
existing grid due to wear and tear and overloading of the grid. This has resulted in KETRACO to
invest in new transmission lines and associated substations, both in Nairobi and in other parts of
the country. These new Bulk supply points will relieve loading on existing overloaded assets.

1.1.3 Transmission Analytics
Analytics stands for systematic computation of data using written algorithms and statistical
operations that decipher a complex phenomenon to convey meaningful information, with the aim
of the quantifying performance of a given parameter.
1.1.4 Power Dispatch Analytics
This is the manipulation or raw data acquired from the transmission grid to assist network
operators to come up with critical decisions concerning balance between the power supply and
demand. This is a necessary tool for generating and transmitting companies to:-
• Monitor load flows
• Maintain power stability
• Minimize transmission losses
• Ensure power quality
• Plan for future dispatch
Power dispatch brings about economic consideration and thus the creation of economic dispatch.
1.1.5 Economic Dispatch
“This is the operation of generation facilities to produce energy at the lowest cost to reliably
serve consumers, recognizing any operation limits of generation and transmission facilities.”
1.1.6 Solution to Economic Dispatch
Optimization of power systems solves the problem of economic dispatch. Optimization is the art
of achieving the best possible solution to a problem with a variety of competing and conflicting
parameters. Optimization is the tendency to search for the best solution under defined
circumstances. In mathematical terms, optimization is seeking the best option with imposed
constraints.
There are a variety of methods used for optimization to solve power systems operational
challenges.
The methods can be classified into the following groups:
i. Conventional Optimization methods
ii. Intelligence searches methods

1.1.7Conventional optimization methods
The traditional optimization methods include:
• Lagrange multiplier method
• Newton-Raphson
• Trust region optimization
• Line search
• Quadratic Programming
• Gradient method
• Quasi-Newton method
• Nonlinear Programming
• Newton Method
• Generalized Reduced Gradient Method
• Mixed Integer Programming (MIP)
• Network Flow Programming(NFP)
Intelligent Search Methods
This include:
• Ant Colony
• Evolutionary Algorithms
• Tabu Search
• Simulated Annealing
• Neural Network (NN)
• Particle Swam Optimization (PSO)

Web interface
A graphical frontend that a user interacts with software running on a web server using a
computer. The user interface is the web browser and the web page it downloaded from the
server. [3]
Dynamic Display
A web interface that can display different web content with changes rendered from the server
side to the end user viewing the updated information.
Database
An organized collection of data, arranged in such a manner to allow easy access, management,
and updating. A database is composed of schemas, tables, queries, reports and other functions.
1.2 Project Statement Create a web interface and database that allows a user to build a dynamic display of the Kenya
power transmission analytics.
1.3 Project Objective This project requires extensive knowledge of the transmission line parameters and analytics. It
demands extensive knowledge of the Kenya national electricity grid.
The overall objective of the project will be:-
I. To create a fully functional web interface. The web interface should be dynamic and have
the capability to compute and display analytics.
II. To create an organized relational database to store transmission data and analytics
The specific objectives of the project will be:-
I. To develop an algorithm to solve power flow in transmission
II. To develop an algorithm to solve transmission line loading

1.5 Project Justification The concept of this project is to come up with a system that will break down the complexities of
the Kenyan electrical power grid. Currently, information concerning the transmission of power is
documented in line schematics stored in archives minimizing efficient management of these
assets in the following ways;-
i. Updating the one-line schematic maps after adjustments to the transmission line is
cumbersome
ii. Locating of these assets can be overwhelming considering the many maps available
for the large power system grid.
This project is informed of the shortcoming experienced by the national network. This project
proposes a plan to visualize the Kenyan national power grid to solve the problem. The dynamic
web interface should display the electricity grid. It should contain all parameters pertaining each
power transmission asset. The project intends to achieve the following:-
i. Better asset management, the system will store the vast data of each particular
transmission line on the grid. To keep track of the numerous power lines and their
health.
ii. Better planning of future power dispatch, the location of new transmission lines and
power substations.
iii. Easy access to information by network operators, planners, dispatch persons and
network analytics personnel.
iv. Operational visibility of the transmission line will be improved.

1.6 Project Organization The project report is organized into five chapters as follows;
In Chapter1, a brief introduction to Electrical power dispatch, methods of optimizations, Project
Objectives and Project statement and justification outlined.
In Chapter 2, a literature review on transmission analytics in particular power flow studies,
solution methods used in solving non-linear algebraic equations that bring about complexities in
an interconnected network
In Chapter 3, identification of data necessary for the formulation of transmission analytics.
Methodologies proposed for use in developing a dynamic display of the Kenya power
transmission network on the web interface.
In Chapter 4, the results of the dynamic web interface display of the transmission grid analysis
and discussions.
In Chapter 5, the conclusion and recommendations for further research.

CHAPTER TWO 2 LITERATURE REVIEW 2.1 BACKGROUND 2.1.1 The evolution of the Power Grid. Electricity grid interconnections have played a vital role in the history of electric power systems.
Most national and regional power systems that exist today began many decades ago as isolated
systems, often as a single generator in a large city. As power systems expanded out from their
urban cores, interconnections among neighboring systems became increasingly common. [4]
Groups of utilities began to form power pools, allowing them to trade electricity and share
capacity reserves.
One of the great electrical engineering achievements of the 20th century has been the evolution of
large synchronous alternating current (AC) power grids, in which all the interconnected systems
maintain the same precise electrical frequency.[4] Synchronous interconnections among
countries are expanding in Central and South America, North and Sub-Saharan Africa, and the
Middle East.[4]
As the synchronous AC networks have reached continental scale, the use of high-voltage direct
current (HVDC) interconnections is also rapidly expanding as a result of technical progress over
the last two decades. HVDC permits the asynchronous interconnection of networks that operate
at different frequencies or are otherwise incompatible, allowing them to exchange power without
requiring the tight coordination of a synchronous system.[4] HVDC has other advantages as
well, especially for transmitting large amounts of power over very long distances.
2.1.2 Benefits of grid interconnections • Improving reliability and pooling reserves: The amount of reserve capacity that must be
built by individual networks to ensure reliable operation when supplies are short can be
reduced by sharing reserves within an interconnected network.[4]
• Reduced investment in generating capacity: Individual systems can reduce their
generating capacity requirement, or postpone the need to add new capacity if they can
share the generating resources of an interconnected system.[4]
• Improving load factor and increasing load diversity: Systems operate most economically
when the level of power demand is steady over time, as opposed to having high peaks.

Reduced load factors (the ratio of average to peak power demand) mean that utilities
must construct generation capacity to meet peak requirements, but that this capacity sits
idle much of the time. Systems can improve poor load factors by interconnecting to other
systems with different types of loads, or loads with different daily or seasonal patterns
that complement their own.
• Economies of scale in new construction: Unit costs of new generation and transmission
capacity decline with increasing level, up to a point. Sharing resources in an
interconnected power system can allow the construction of larger facilities with lower
unit costs
• The diversity of generation mix and supply security: Interconnections between systems
that use different technologies and fuels to generate electricity provide greater protection
if one kind of production becomes limited (e.g., hydroelectricity in a year with little
rainfall). Historically, this complementarity has been a strong incentive for
interconnection between hydro-dominated systems and thermal-dominated systems. A
larger and more diverse generation mix also implies more diversity in the types of forced
outages that occur, improving reliability.
• Economic exchange: Interconnection allows the dispatch of the least expensive
generating units within the interconnected area, providing overall cost savings that can be
divided among the component systems. Alternatively, it allows inexpensive power from
one system to be sold to systems with more expensive power.
• Environmental dispatch and new plant siting: Interconnections can allow generating units
with lower environmental impacts to be used more, and units with higher results to be
used less.
• Coordination of maintenance schedules: Interconnections permit planned outages of
generating and transmission facilities for maintenance to be coordinated so that overall
cost and reliability for the interconnected network is optimized.[5]
2.1.3 The Kenya Power Transmission System An electrical power system consists of a generation system, a transmission system, a sub-
transmission system, and a distribution system. The generation and transmission systems make
up the bulk power supply, and the sub-transmission and distribution systems are considered to be
the last means to transfer the electrical energy to the ultimate customer.

Bulk power transmission is made up of a high-voltage network, generally 132kV and above a
voltage, designed to interconnect power plants and electric utility systems and to transmit power
from the plants to major load centers. In the Kenya, 132 and 220 kV are the most common
transmission grid voltages. However, ongoing projects are upgrading high energy transmission to
400kV. One such project includes the Mariakani – Isinya double circuit transmission line. The
482km line is currently fitted with 400kV capacity transmission line but operated at 220kV.
Kenya's electricity supply industry structure is the single buyer model where all generators sell
power in bulk to KPLC for dispatch and onward transmission and distribution to consumers.[6]
Currently, the transmission network is shared between KPLC and KETRACO. The total
transmission network (220kV and 132kV) for KPLC stood at 3,947kms by June 2014.
KETRACO transmission system (220kV and 132kV) held at 756.5kms by December 2014.
The generation voltage is usually 11kv. For economic reasons and losses reduction, it is stepped
up to 132kV and 220kV for transmission with the aid of 3-phase transformers. The primary
transmission lines transmit electrical power from generating stations to high load centers,
hundreds of kilometers away. At primary substations, the voltage is stepped down to 66kV and
33kV, after that transmitted to a secondary substation where it is further stepped down to 11kV
before being supplied to distribution substations.

DIST SUB “B” DIST SUB “G” DIST SUB “E” DIST SUB “A”
DIST SUB “C”
Transmission substation C 220kV
220kV
33 kV
11 kV DIST. CIRCUIT NO. 101
DIST. CIRCUIT NO. 102 11 kV
11 kV DIST. CIRCUIT NO. 103
415V
POLE MOUNTED TRANSFORMERS
SERVICE LINES, WATT-HOUR METER
33 kV
Gen Sta 3.
11kV
Transmission substation B
DIST SUB “D” 220kV
33 kV
Transmission substation A
DIST SUB “H”
Gen Sta 2.
11kV
Gen Sta 1.
11kV
DIST SUB “F”
220kV
Figure 1. block diagram of a typical AC Electrical power supply system

2.2 Benefits of High Voltage Transmission The primary purpose of transmission is to transmit bulk electricity energy from the generation
centers to high load centers hundreds or thousands of kilometers away. There are some main
advantages of high voltage transmission which are as follows:-
1. Control against generation outages. The transmission system should typically permit
access to alternative economic energy sources to replace lost sources.
2. Efficient bulk power markets. Bulk power needs should be met by the lowest-cost
generation, instead of by higher-cost electricity purchases to prevent violation of
transmission loading constraints. (The difference between the actual price of electricity at
the point of usage and the lowest price on the grid is called the congestion cost.)
3. Operational flexibility. The transmission system should permit for the economic
scheduling of maintenance outages and for the economic reconfiguration of the grid when
unforeseen events take place.
4. Hedge against fuel price changes. The transmission system should permit purchases to
access generation economically from diversified fuel resources as a hedge against fuel
disruptions due to various causes.
5. Low-cost access to renewable energy. The transmission system should usually permit
developers to build renewable energy sources without the need for expensive
transmission upgrades.
The amount of power on any electric line at any given moment depends on generation
production and dispatch, customer use, the status of other transmission lines and their associated
equipment, and weather.[7]
Information is a fundamental element in power transmission along the grid. Correct information
and analytics will aid in proper decision making by the network operators, power dispatch team
and the fault isolation team. The first objective of the project, designing a web interface that can
display transmission analytics. This purpose of this web interface should be adequately
informative.

2.3 Comparison and Evaluation of Similar Projects In The Past Intelligently building a transmission line network requires precise planning, costing, scheduling,
and so forth. Use of GIS for selecting suitable areas, finding the optimum path, creating the
profile analysis, engineering design of towers and wires, surveying support, and estimating costs.
Research in relaying transmission line analytics through a web page has previously been studied,
and this has led to the emergence of different approaches to solving the issue of providing such
information over the internet. Below is a discussion of the various approaches made in the past.
Georgia Transmission Corporation
At Georgia Transmission Corporation (GTC), using GIS-based Web applications is part of the
daily routine of employees throughout the company. GTC is a not-for-profit cooperative owned
by and serving 39 electric membership corporations in Georgia. [8]
The company uses Web-based applications that enable it to make this data more readily
accessible to a greater number of company employees.
The primary GIS contractor for GTC, to develop this Web application that provides browser-
based user access to information. Integration of GTC's GIS and the existing corporate database
into a standard application interface increases the practical use of information across the
organization.
One of the goals in designing GTCView was to take information and characteristics about the
location of facilities and integrate them with other attribute databases. GTCView links four rela-
tional databases for GIS use. Its primary feature is an interactive map from which the user can
make textual queries and access relational databases, allowing for map design.
For example, the planning department is asked to supply energy to a target area by building a
new facility and routing electricity to it. Obviously, it is more cost-effective to build a facility
that is near the target area. If the planning department wants to determine the load need for a new
field, it can access databases through GTCView. The user enters the location of the new area and
performs a distance query such as the site of all 115-kilovolt transmission lines within 50 miles
of the site. GIS produces both a map and a list of those transmission lines.

The Web-based application allows the user to create custom maps without being a cartographer.
The symbology is available and easy to use, a map template sets the stage, and the employee
creates the map. More than 100 employees are using GTCView. The tool makes users self-
sufficient in producing maps and GIS-empowered to do more with them. With a geographic
perspective, employees put GIS to work from fulfilling a request order to getting a budget
approved.
Figure 2. Web application called GTCView.
2.4 Project requirements in fulfilling the specific and overall objectives
I. Interactive web page interface
This will make the system beuser-friendly and be more informative. A user-friendly
interface will make easy usage of the system by network operators.

II. Secure web interface
A secure web interface to maintain the data integrity of the system. The system is such that
there should be no external invasion of data stored in the system database. A high integrity
system increases reliability to the network and makes it robust. The case of Ukraine Electric
Grid SCADA Hack is a perfect lesson on the necessity of a secure system
The project aims at accomplishing the following:-
ü Reducing transmission losses
ü Improving power quality Ferranti Effect Overvoltage etc
ü Improving reliability of the grid Stability
ü Improving data management, evaluating risks faced by the grid Voltage
Collapse
ü Improving the planning and analysis when setting up new transmission
lines
ü Improving asset management
ü Improving network analysis
ü Spatial analysis of the powerline network congestion Power flow

CHAPTER THREE
3 METHODOLOGY AND DESIGN 3.1 PROBLEM FORMULATION. This section gives the details of the formulation of the problem and provides a detailed proposal
for the solution of the project objectives. The specific problem issues addressed is the
transmission analytics, dynamic web interface and database creation.
Transmission analytics
For successful operations of any power systems requires transmission analytics. This data is vital
in critical decision making. To run reliable electrical systems, it requires that:
ü generation must supply the demand (load) plus the losses,
ü bus voltage magnitudes must remain close to rated values,
ü generators must operate within specified real and reactive power limits,
ü Transmission lines and transformers should not be overloaded for long periods.[9]
Therefore, it is important that voltages and power flow in an electrical system can be determined
for a given set of loading and operating conditions. This is known as the power flow problem.
Power flow analysis is used extensively in the planning, design and operation of electrical
systems. [9]
One of the objectives of the project is developing an algorithm to solve power flow problem in
transmission; Newton-Raphson method is the proposed solution to address the transmission
analytics problem. The power flow solution will thereby provide the required data for solving of
another project objective of calculating line loading.
3.1.1 Newton-Raphson method The fundamental idea behind Newton-Raphson is to use sequential linearization. General form of
problem:
Find an x such that:
����= 0
where � is a vector of functions �1 ··· �� in the variables �1 ··· ��.
The steps for solving a problem using NR are as follows:

I. For each guess of ��,�(�) define
∆���� = �� -�(�)
II. Represent �(��) by a Taylor series about �(�)
�����= �������+��(����)
�� ∆������+ 12
������ �������
+ ℎ��ℎ����������� �
III. Approximate ����� by neglecting all terms except the first two
�����= 0 ≅ �������+ +��(����)
�� ∆����
IV. Use this linear approximation to solve for:∆����
∆���� = − ���(����)
���
��
�������
V. solve for a new estimate of ��
������ = ����+ ∆����
VI. The error decreases quite quickly When close to the solution the -- method has quadratic
convergence
VII. The Stopping criteria are when ���������< �
VIII. All Results are dependent upon the initial guess.
NR Application to Power Flow;
We first need to rewrite complex power equations as equations with real coefficients:
�� = �� + ��� = ����∗ where,
�� = Net apparent power entering a bus
�� = Net real power entering a bus
�� = Net reactive power entering a bus
�� = Voltage at a typical bus
�� = ����∗ = ���� �����
��
���
�∗
= ��� ���∗��
∗�
���

These can be derived by defining
��� = ��� + ����
The Newton-Raphson algorithm can only handle real equations and variables, so the complex
equations are split into their real and imaginary parts, and the voltage variables are taken as V
and θ. This gives
�� = |��|���� = |��|∠��
��� = ��− ��
�� = �� + ��� = ��� ���∗��
∗�
���
= ��
���
|��||��|�����(��� + ����)
= ��
���
|��||��|�cos ��� + �sin ����(��� + ����)
Resolving into the real and imaginary parts
�� = ��
���
|��||��|���� cos ��� + ��� sin ����= ���− ���
�� = ��
���
|��||��|���� sin ��� − ��� cos ����= ���− ���
These two equations are called the power flow equations, and they form the fundamental
building block from the power flow problem is solved.
Thereafter:
��,��� = ���− ���
��,��� = ���− ���
��,��������,��� are the net scheduled reactive, and real power injected at any particular bus
respectively. Therefore denoting the calculated value of �� by ��,���� leads to the definition of
mismatch, ∆��.

∆�� = ��,��� − ��,����
Likewise for reactive power
∆�� = ��,��� − ��,����
A mismatch occurs the course of solving power flow problem where calculated values of
������� do not coincide with the scheduled values. If the calculated values of
��,���������,���� perfectly match then the mismatches ∆�����∆�� are zero at that particular
bus, and we write the power balance equations.
In the Newton-Raphson power flow, Newton's method is used to determine the voltage
magnitude and angle at each bus in the electrical system. We need to solve the power balance
equations. The slack bus is assumed to be the first bus (with a fixed voltage angle/magnitude).
We then need to determine the voltage angle/magnitude at the other buses. [10] Writing the
power flow equation in one form of equation will give
�∆�∆��
�= − �
�����
���|�|
�����
���|�|
��
�
. �∆�∆|�||�|
��
Where the Jacobian is �� ��
����
�|�|�
����
���|�|
��
�
∆�� = ��(���) − ��
(�)
∆�� = ��(���) − ��
(�)
The Jacobian, and forms the derivative (tangent, gradient) of the power flow equations. Voltages
and angles (� + 1) are updated after each iteration and used for the following step.
Equations ���|�|
���� ���|�|
� Simplify the equations and results in fewer computations. There are
� − 1 equations for ∆� and � − #�� − 1 equations for∆�. The Jacobian is a square sparse
matrix.Iterative process continues until mismatch is below threshold, that is, (max�∆��, ∆���=
�< ���� ��)

3.2 Project implementation Newton-Raphson In the identification of NR as the method of solving power flow solution, the NR method has to
be implemented by a computer software by developing a software algorithm to compute input
data. In addressing this problem, python was identified as the preferred programming language.
Python is a widely used high-level, general-purpose, interpreted, dynamic programming
language. Its design philosophy emphasizes code readability, and its syntax allows programmers
to express concepts in fewer lines of code than would be possible in languages such as C++ or
Java.[11] The language provides constructs intended to enable clear programs on both a small
and large scale.
Python supports multiple programming paradigms, including object-oriented, imperative and
functional programming or procedural styles. It features a dynamic type system and automatic
memory management and has a vast and comprehensive standard library. Because of its
extensive libraries, individual open source libraries were identified that could be instrumental in
the problem formulations. This include:-
• NumPy
• SciPy
• Matplotlib
• PyPower
In general, Power System design, analysis and control involve complex mathematical
computations exhibiting exhaustive nature. Because of its comprehensive nature, it became a
hardball for scientists and engineers to solve power system problems, even using a computer.
The reason that most of the power system engineers and researchers use a commercial software
package like MATLAB, which is a closed software package.
Python is a safely, dynamically and strongly typed open source language which can be
competitive with MATLAB and Octave.To get functionalities of MATLAB and Octave in
Python, the NumPy, SciPy and Matplotlib packages should be used. Scipy is a package that has
the goal of providing all the other functionality of MATLAB, including those in the MATLAB
toolboxes. There is also a handful of IDE's available for Python, most of which are for free.
Open source software package
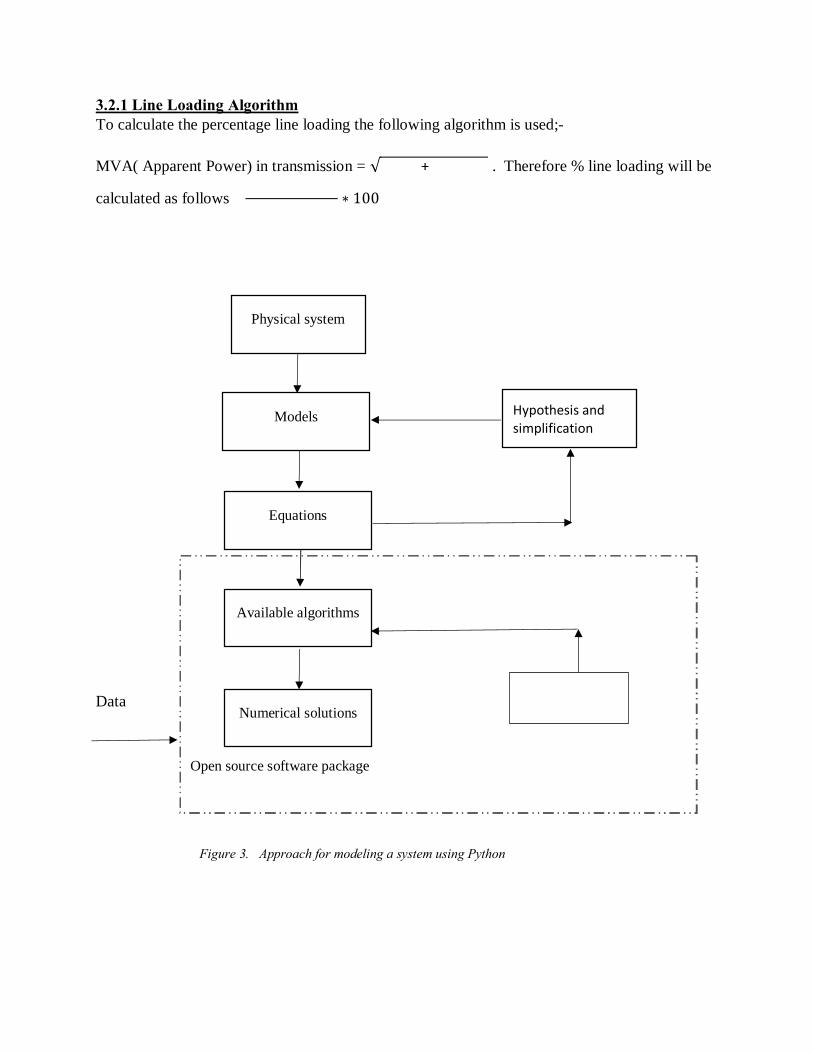
3.2.1 Line Loading Algorithm To calculate the percentage line loading the following algorithm is used;-
MVA( Apparent Power) in transmission = √� � � + � ���� . Therefore % line loading will be
calculated as follows � ���������� ������������
∗ 100
Data
Physical system
Hypothesis and simplification
Models
Equations
Numerical solutions
Available algorithms
Adjustments
Figure 3. Approach for modeling a system using Python

3.2.2 Pypower The Pypower was developed by the Power Systems Engineering Research Center PSERC, which
is a port of MATPOWER to the Python programming language. Pypowerprovides a simple yet
powerful tool for Power Engineering that is not tied to proprietary software and can be used and
extended with ease.[12] Pypower library forms the core of the backend code that will solve the
NR problem.
Data input by the user is packaged and saved. After that is it converted to a format file that can
be read by pypower module. The software calculates for analytics; after that, a link is established
between the backend and the frontend to display the results.
Database Design
A database management system (DBMS) is a computer software application that interacts with
the user, other applications, and the database itself to capture and analyze data. A general-
purpose DBMS is designed to allow the definition, creation, querying, update, and
administration of databases.[13]
One of the-the primary objectives of this project is to create a database that can store
transmission data analytics. A database is an organized collection of data. It is the collection of
schemas, tables, queries, reports, views and other objects.There are several types of database
management systems available on the internet for use.
For this project, Sqlite3 DBMS will provide the database for storing the transmission data
analytics. SQLite is an in-process library that implements a self-contained, serverless, zero-
configuration, transactional SQL database engine. The code for SQLite is in the public domain
and is thus free for use for any purpose, commercial or private. SQLite is the most widely
deployed database in the world with more applications than we can count, including several
high-profile projects.[14]
Most SQL database engines are implemented as a separate server process. Programs that want to
access the database communicate with the server using some inter-process communication
(typically TCP/IP) to send requests to the server and to receive back results. SQLite does not
work this way. With SQLite, the process that wants to access the database reads and writes
directly from the database files on disk. There is no intermediary server process.[15]

There are advantages and disadvantages to being server-less. The main advantage is that there is
no separate server process to install, setup, configure, initialize, manage, and troubleshoot. One
reason why SQLite is a "zero-configuration" database engine. Programs that use SQLite require
no administrative support for setting up the database engine before they are run. Any program
that can access the disk can use an SQLite database.
Data Identification and Collection
The following data has been identified as the required data for development of the database. The
database shall consist of the following tables:-
1. Generators Table
2. Buses Table
3. Transmission lines Table
Each table is made up of many fields. The Generators Table shall bear the following fields and
data types:-
FIELDS Data Type Data Length
Generator ID (genID) Integer 16-bit
Bus connection (busconn) Integer 16-bit
Real Power Gen (genPG) Integer 16-bit
Reactive Power Gen (genQG) Integer 16-bit
Max reactive power
(genQmax)
Integer 16-bit
Min reactive power
(genQmin)
Integer 16-bit
Max Real power (genPmax) Integer 16-bit
Min Real power (genPmin) Integer 16-bit
voltage mag. setpoint
(genVg)
Real 16-bit
Base MVA (mbase) Integer 16-bit
Generator status (genstatus) Integer 16-bit

The Buses Table contain the following fields
FIELDS Data Type Data Length
Bus ID (busID) Integer 16-bit
Bus type (bustype) Varchar 12-bit
Bus Location (busloc) Text 16-bit
Bus Coordinates (buschoord) Varchar 16-bit
Base KV (baseKV) Integer 16-bit
Real Power Demand (busPd) integer 16-bit
Reactive Power
Demand(busPd)
Integer 16-BIT
Voltage magnitude (busVm) Float 32-bit
Status (busStatus) Bit 1-bit
The Transmission line Table consists of the following fields
FIELDS Data type Data Length
Line ID Integer 16-bit
Bus connection from
(connFR)
Integer 16-bit
Bus connection to (ConnTo) Integer 16-bit
Line Resistance (lineRes) Float 32-bit
Line Reactance (lineReac) Float 32-bit
line charging susceptance Float 32-bit
Line Mva Rating Integer 16-bit
Line Length Float 16-bit
Line status Integer 16-bit
The generator, bus and transmission status field indicate whether the asset is operational or off.
1 indicating the asset is in service and 0 to indicate the device is out of service.

3.3 The Web Interface Design In web design, the following considerations were made;-
The web interface should be dynamic, i.e., A web interface that contains data that keeps
changing. The data can input by the user or by the website administrator. There exist two types
of dynamic web pages which are:-
1. Client-side dynamic web page
2. Server-side dynamic web page
A client-side dynamic web page processes the web page using HTML scripting running in the
browser as it loads while the server-side dynamic web page is a web page whose construction is
controlled by an application server processing server-side scripts.[16]
In this project, server-side scripting is used to change the supplied page source between pages,
adjusting the sequence or reload of the web pages or web content provided to the browser. Server
responses are determined by conditions such as data posted in a HTML form, parameters in the
URL, the type of browser being used, the passage of time, or a database or server state.
In executing server-side scripting, CGI method is implemented. Common Gateway Interface
(CGI) is a standard way for web servers to interface with executable programs installed on the
server that generates web pages dynamically. Such programs are known as CGI scripts or only
CGIs; they are usually written in a scripting language, but can be written in any programming
language.[17]
The following forms were created to fulfill the objective of the project.

The Home Form
Figure 4. Home Form
This is the first page that pops up when the web interface is up and running it contains links to
access other web interface resources. The mapping tab has been integrated for future use.
Asset form
Figure 5. Asset web interface.

This Asset page interface allows the user to input bus, generator and transmission lines data as
specified in the database fields. The Web interface will initialize the save button once add button
has been pressed. The user selects which field he/she would like to input the data from the buses
generators and transmission line tabs indicated in fig 5.
The buses, generators, and the transmission lines forms include functionalities such as update
and delete of records. This is imperative for data modification that had previous inputs. This
makes the program robust and flexible. It brings out the real aspect of dynamism.
Add New Transmission Line Form
Figure 6. Add new Transmission line interface
This form is responsible for creating a platform for a user to input a new transmission line data.
The data is thereby saved in a database after submission. The buses and generators web page
have the same form too, to aid the user in data entry.

Delete Transmission Line data
Figure 7. Delete transmission line interface
This form's role is to give the user a platform to delete stored transmission line data. The buses
and generators' field have equally the same form to remove any data from the database.
Update Form
Figure 8. Update transmission line interface
For any real database management system, there should exist a function to create, delete and
update of existing data. This form provides the services of updating existing transmission lines
data. The buses and generators form equally have the same form in their functions.
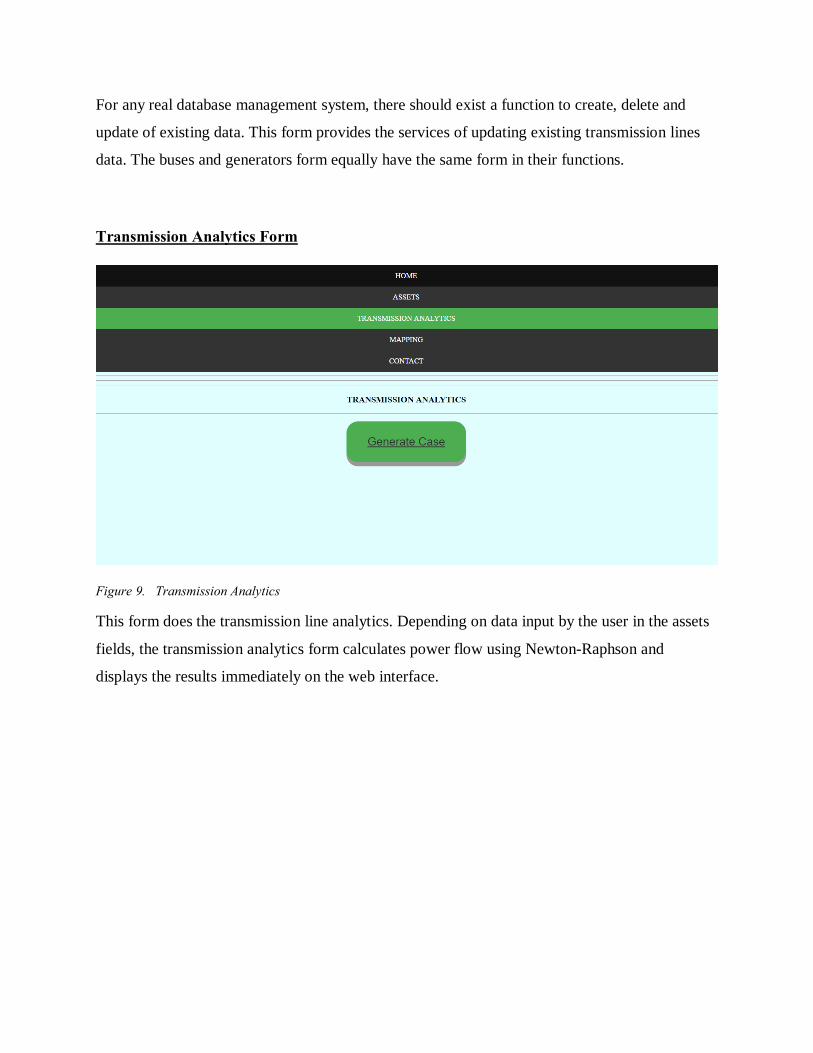
Transmission Analytics Form
Figure 9. Transmission Analytics
This form does the transmission line analytics. Depending on data input by the user in the assets
fields, the transmission analytics form calculates power flow using Newton-Raphson and
displays the results immediately on the web interface.

3.4 Overall Project flows Chart
Fig 3.6 Overall Project flow chart
YES
Solve power flows using Newton-Raphson method
Results converged?
Max iteration?
Calculate line loading Print pf solution and line % loading
End
Start
Load web interface
Data input, i.e., gen, bus, and tx line
Store data in database
Generate Case data for calculations
ITER= ITER+1
YES
Figure 10. Program flow-chart
CHAPTER 4
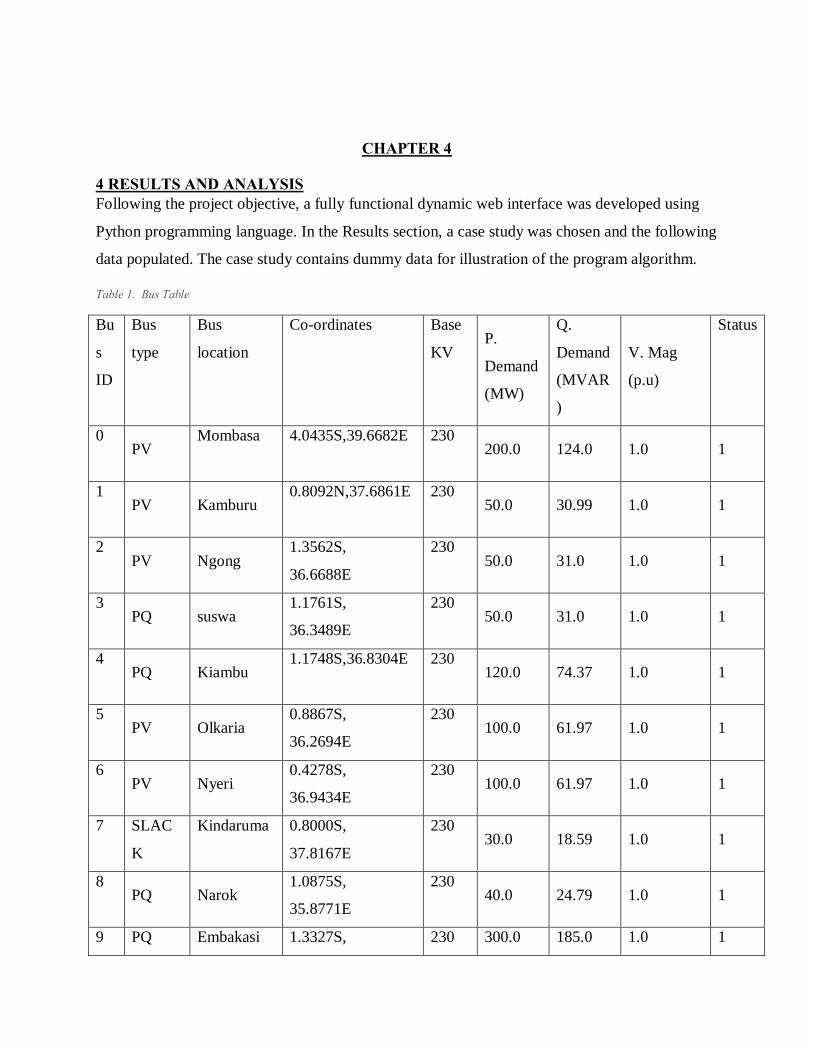
4 RESULTS AND ANALYSIS Following the project objective, a fully functional dynamic web interface was developed using
Python programming language. In the Results section, a case study was chosen and the following
data populated. The case study contains dummy data for illustration of the program algorithm.
Table 1. Bus Table
Bu
s
ID
Bus
type
Bus
location
Co-ordinates Base
KV P.
Demand
(MW)
Q.
Demand
(MVAR
)
V. Mag
(p.u)
Status
0
PV
Mombasa
4.0435S,39.6682E
230
200.0 124.0 1.0 1
1
PV Kamburu
0.8092N,37.6861E
230
50.0 30.99 1.0 1
2
PV Ngong
1.3562S,
36.6688E
230
50.0 31.0 1.0 1
3
PQ suswa
1.1761S,
36.3489E
230
50.0 31.0 1.0 1
4
PQ Kiambu
1.1748S,36.8304E
230
120.0 74.37 1.0 1
5
PV Olkaria
0.8867S,
36.2694E
230
100.0 61.97 1.0 1
6
PV Nyeri
0.4278S,
36.9434E
230
100.0 61.97 1.0 1
7
SLAC
K
Kindaruma
0.8000S,
37.8167E
230
30.0 18.59 1.0 1
8
PQ Narok
1.0875S,
35.8771E
230
40.0 24.79 1.0 1
9 PQ Embakasi 1.3327S, 230 300.0 185.0 1.0 1

36.9004E
The buses data was entered into the web interface as shown in Table 4.0. The data was stored
and displayed as shown in fig 11
Figure 11. Buses Records interface
After that the generators data was input as shown in Table 2.
Table 2. Generators Records table
Gen
ID
Bus
No.
Pg Og Max
Qg
Min
Qg
Voltag
e M
Max
Pg
Min
Pg
Base
MVA
Status
0 0 193 100 200 -200 1.02
193 100 100 1
1 1 94 94 100 -100 1.02
94 40 100 1

2 2 20 5 10 -10 1.02
25 5 100 1
4 7 200 150 250 -250 1.0 200 100 100 1
5 6 165 100 200 -200 1.02
200 100 100 1
3 5 500 300 500 -500 1.02
600 400 100 1
Table 2.0
The data was displayed on the web interface as shown in fig 12
Figure 12. Generators Records interface

Thereafter the transmission lines data was input as shown in table 3
Table 3 Transmission lines table
Tx ID From
(bus)
To
(bus)
Resistanc
e (p.u)
Reactanc
e (p.u)
Susceptan
ce.(p.u)
MVA
limits
Length
(km)
Status
0 0 1
0.015
0.125
0.125 250 100.0 1
1 0 9
0.014
0.123
0.245 250 180.0 1
2 4 5
0.014
0.214
0.236 250 400.0 1
3 5 3
0.014
0.236
0.236 250 100.0 1
4 6 7
0.011
0.211
0.2 250 300.0 1
5 7 9
0.015
0.236
0.011 250 200.0 1
6 3 8
0.015
0.221
0.244 250 200.0 1
7 2 4
0.011
0.215
0.152 250 111.0 1
8 5 9
0.014
0.236
0.236 250 500.0 1
9 5 6
0.014
0.222
0.222 250 156.0 1
10
2 5
0.014
0.234
0.249 250 180.0 1
The data was then displayed on the website interface as shown in fig 13

Figure 13. Transmission lines Records interface

4.1 Power flow results Following the input of the generators, buses and transmission lines’ data in the web interface.
The program algorithm was invoked to calculate power flow solution for the tabulated data. The
following comprehensive results were displayed as shown in fig 4.4
4.2 Analysis From the results posted on fig 4.5, several references can be made out of it. The data clearly
shows analytics necessary to make informative decisions by network operators. For example.
The line between the bus(5) Olkaria and Embakasi bus(9) is experiencing severe reactive power
losses. Therefore, investigations can be launched to find out the reason. The equally line from
bus (5) olkaria to the bus (6) Nyeri is underloaded at 1.61%. This shows that transmission line is
underutilized thus it’s a poor capital investment on the line.

CHAPTER 5
5.0 CONCLUSION NR was used to generate values of real and reactive power flow in the entire network and losses
incurred by the transmission lines. The data obtained was further used to calculate percentage
line loading. This is crucial in helping power network operators make informed decisions. The
method showed network constraints and pointed on areas that need reinforcement or
improvement. NR power flow solution is found to be reliable as it yields results that converge to
a global optimum.
The use of Python programming language software allowed the incorporation of power flow
analysis using already developed mathematical libraries, which the project is built upon, such as
pypower. This reduced the complexity of coding a new power flow algorithm in python. The
web interface developed is robust, efficient and relatively easy to use. It has the capability to
solve and power flow problem irrespective of the number of buses, generators, and transmission
lines. This capability was tested using the IEEE bus system in particular case300; therefore, this
program is suitable for real and practical applications for systems that require transmission
analytics.
5.1 Recommendation and future study
Further study in this area could try the implementation of a GIS-based system using the data
stored in the database of each asset. The use of map coordinates to map the transmission assets
on the Kenyan thereby bring visualization of the entire Kenyan power grid with each line
displaying the analytics already solved by this website. Also, take the advantage of the power
flow solutions obtained to solve the economic dispatch problem using the optimal power flow
technique. All this can be visualized on a map.

REFERENCES
[1]"Afrigen Energy Limited | Power Projects Firm."
http://afrigenenergy.com/energy-sector.php. Accessed on Web. 17 May. 2016.
[2] "POWER TO TRANSFORM KENYA - The i Guides."
http://admin.theiguides.org/Media/Documents/Kenya_Energy_Prospectus.pdf. Accessed on
Web. 17 May. 2016.
[3]"Web interface Definition from PC Magazine Encyclopedia."
http://www.pcmag.com/encyclopedia/term/60249/web-interface. Accessed on Web. 17 May.
2016.
[4] "Technical Aspects of Grid Interconnection - energypedia.info."
https://energypedia.info/wiki/Technical_Aspects_of_Grid_Interconnection. Accessed on Web. 17
May. 2016.
[5] "Cross-Border Interconnections on Every Continent - GENI."
http://www.geni.org/globalenergy/research/cross-border-interconnections/Cross-Bo. Accessed
on Web. 17 May. 2016.
[6] "Ministry of Energy Consultancy Services for Development of ..."
http://www.sasakenya.com/ministry-of-energy-consultancy-services-for-development. Accessed
on Web. 17 May. 2016.
[7]"Electric Transmission ..." https://psc.wi.gov/thelibrary/publications/electric/electric09.pdf.
Accessed on Web. 17 May. 2016.
[8]"B1100-07401 GTC Upgrades Its Communications and Reduces ..."
https://psc.wi.gov/thelibrary/publications/electric/electric09.pdfAccessed on Web. 17 May.
2016.
[9]"Power Flow Analysis - CiteSeerX."
http://citeseerx.ist.psu.edu/viewdoc/download?doi=10.1.1.128.239&rep=rep1&am. Accessed on
Web. 17 May. 2016.

[10]"ECE530 Fall 2014 Lecture Slides 4 - ECE 530 - Analysis ..."
<https://www.coursehero.com/file/11164571/ECE530-Fall-2014-Lecture-Slides-4/. Accessed on
Web. 17 May. 2016 >.
[11] "Python (programming language) - Wikipedia, the free ..."
https://en.wikipedia.org/wiki/Python_%28programming_language%29. Accessed on Web. 17
May. 2016.
[12] "Welcome — Pylon Home." http://pythonhosted.org/Pylon/. Accessed on Web. 17 May.
2016.
[13] "Database - Wikipedia, the free encyclopedia."
https://en.wikipedia.org/wiki/Database_management_system. Accessed on Web. 17 May. 2016.
[14]"SQLite: About SQLite." http://www.sqlite.org/about.html. Accessed on Web. 17 May.
2016.
[15]"Distinctive Features Of SQLite." https://www.sqlite.org/different.html. Accessed on Web.
17 May. 2016.
[16]"Dynamic web page - Wikipedia, the free encyclopedia."
https://en.wikipedia.org/wiki/Dynamic_web_page. Accessed on Web. 17 May. 2016.
[17] “Common Gateway Interface - Wikipedia, the free encyclopedia."
https://en.wikipedia.org/wiki/Common_Gateway_Interface. Accessed on Web. 17 May. 2016.

APPENDIX The following python code was used for generation of power flow solution and calculation of line loading.
print("Content-Type:text/html\n\n")
#change directory to [/Anaconda2]
#----------------------------------------------
# case file path/case4gs.py
#----------------------------------------------
# output file path/pfOut.txt
#----------------------------------------------
# path: /xampp/htdocs/powerSystems/
#----------------------------------------------
print "<html>"
print "<head>"
print "<title>Power Systems</title>"
print "<meta name='viewport' content=width=device-width,initial-scale=1'>"
print "<link rel='stylesheet' type='text/css' href='css/navBar.css'/>"
print "<link rel='stylesheet' type='text/css' href='css/table.css'/>"
print "</head>"
print "<body style='background-color:#E0FFFF;'>"
print "<ul>"
print "<li><a href='index.py'>HOME</a></li>"
print "<li><a href='assets.py'>ASSETS</a></li>"
print "<li><a class='active' href='transmissionAnalytics.py'>TRANSMISSION ANALYTICS</a></li>"
print "<li><a href='mapping.py'>MAPPING</a></li>"
print "<li><a href='contact.py'>CONTACT</a></li>"
print "</ul><hr>"
print "<hr>"
print "<p style='font-size:120%'>"
import os
from pypower.api import *
outfName = '/xampp/htdocs/powerSystems/pfOut.txt'
#save current dir
initDir = os.getcwd()
#change dir
os.chdir("/Anaconda2")
#load case
ppc = loadcase('/xampp/htdocs/powerSystems/case4gs.py')
#runpf
rPf = runpf(casedata=ppc , fname=outfName)
#return to init dir
os.chdir(initDir)
print "</p>"
print "<hr>"
#-------------------------------------------#
# DISPLAY RESULTS #
#-------------------------------------------#
#open pfOut.txt and fetch its contents
fileLines = []
def printData(fLines):
print "<p ><table style='margin-left:1px;'>"
for eachRec in fLines:

print "<tr>"
if eachRec:
print "<td><pre>"
print eachRec
print "</pre>"
print "</table></p><hr>"
def printHeader(header):
if header == 'system':
print "<pre style='font-size:120%;'><BR>"
print "How many? How much? P (MW) Q (MVAr) "
print "--------------------- ------------------- ------------- -----------------"
print "</pre>"
elif header == 'systemMin':
print "<pre style='font-size:120%;'><BR>"
print " Minimum Maximum "
print " ------------------------- -------------------------------- "
print "</pre>"
elif header == 'bus':
print "<pre style='font-size:120%;'><BR>"
print "=============================================================================================="
print "| Bus Data |"
print "=============================================================================================="
print "</pre>"
else:
print "<pre style='font-size:120%;'><BR>"
print "=================================================================================================="
print "| Transmission Analytics "
print "=================================================================================================="
print "</pre>"
def establishDel(fData , startTag , endTag):
startDel = None
endDel = None
for eachRecData in fData:
if eachRecData.find(startTag) != -1:
startDel = fData.index(eachRecData)
if eachRecData.find(endTag) != -1:
endDel = fData.index(eachRecData)
if startDel and endDel:
break
return (startDel , endDel)
#--------------------------------------#
with open("pfOut.txt",'r') as fr:
fdata = [line.strip('\n') for line in fr.readlines()]
resultsPf = fdata
for eachLine in resultsPf:
if eachLine:
fileLines.append(eachLine)
#--------------------------------------#
# DISP SYSTEM SUMMARY #
#--------------------------------------#
printHeader('system')

startIdx , endIdx = establishDel(fileLines , "many?" , "Minimum")
printData(fileLines[startIdx+2:endIdx])
#--------------------------------------#
# DISP SYSTEM [MIN] #
#--------------------------------------#
printHeader('systemMin')
startIdx , endIdx = establishDel(fileLines , "Minimum" , "Q Losses")
printData(fileLines[startIdx+2:endIdx+1])
#--------------------------------------#
# DISP BUS #
#--------------------------------------#
printHeader('bus')
startIdx , endIdx = establishDel(fileLines , "Bus Data" , "Branch Data")
printData(fileLines[startIdx+2:endIdx-1])
#--------------------------------------#
# DISP BRANCH #
#--------------------------------------#
startIdx = endIdx
printHeader('branch')
printData(fileLines[startIdx+2:])
#-------------------------------------------#
print "</p>"
print "<p style='font-size:110%;'>"
print "Go Back To <a href='transmissionAnalytics.py' style='color :#4CAF50;'>Analytics</a></p>"
print "</body>"
print "</html>"