ELECTRICAL BREAKDOWN OF GASES IN …
50
ELECTRICAL BREAKDOWN OF GASES IN SUBATOMOSPHERIC PRESSURE by Yuxuan Chen A thesis submitted to the Graduate Faculty of Auburn University in partial fulfillment of the requirements for the Degree of Master of Science Auburn, Alabama August 6, 2016 Copyright 2016 by Yuxuan Chen Approved by Hulya Kirkici, Chair, Professor of Electrical and Computer Engineering Thaddeus Roppel, Member, Associate Professor of Electrical and Computer Engineering Shiwen Mao, Member, Professor of Electrical and Computer Engineering
Transcript of ELECTRICAL BREAKDOWN OF GASES IN …

ELECTRICAL BREAKDOWN OF GASES IN SUBATOMOSPHERIC PRESSURE
by
Yuxuan Chen
A thesis submitted to the Graduate Faculty of
Auburn University
in partial fulfillment of the
requirements for the Degree of
Master of Science
Auburn, Alabama
August 6, 2016
Copyright 2016 by Yuxuan Chen
Approved by
Hulya Kirkici, Chair, Professor of Electrical and Computer Engineering
Thaddeus Roppel, Member, Associate Professor of Electrical and Computer Engineering
Shiwen Mao, Member, Professor of Electrical and Computer Engineering

ii
Abstract
In this study, I present my research on the breakdown phenomenon and discharge
characteristics of gaseous dielectrics under DC voltages with different pressures. All of the
experiments conducted utilized a point-to-point stainless steel electrode pair separated at 1cm
gap distance. The theoretical and experimental breakdown voltage results of different gases are
compared. It is observed that different gases has different breakdown voltage under the same
experimental conditions and electrode geometry. Besides, the breakdown voltage versus
pressure curves of gaseous dielectrics follows the classic Paschen’s Law as well. In conclusion,
it is shown that the theoretical calculation values are correct. The air and nitrogen have the
better insulating properties at selected 1 Torr to 2 Torr range, compared to other gases used in
this study.

iii
Acknowledgement
I am grateful to my advisor Dr. Hulya Kirkici for her patience and guidance. The door to
Prof. Kirkici’s office was always open whenever I ran into a trouble spot or had a question
about my research. I would like to thank Dr. Mao and Dr. Roppel for serving as the committee
members.
The graduate peers I would like to thank are Dr. Alper Kara, Mike Moley, and Baha
Yakupoglu, for their help during the months of research dedicated to troubleshooting with the
experiment setup over and over again.
I am truly grateful for the enormous support from my parents. With their encouragement
and help, I eventually finished my thesis and degree.

iv
Table of Contents
Abstract . . . . . . . . . . . . . . . . . . . . . . . . . . . . . . . . . . . . . . . . . . . . . . . . . . . . . . . . . . . . . . . . . . . .ii
Acknowledgments . . . . . . . . . . . . . . . . . . . . . . . . . . . . . . . . . . . . . . . . . . . . . . . . . . . . . . . . . . .iii
List of Tables . . . . . . . . . . . . . . . . . . . . . . . . . . . . . . . . . . . . . . . . . . . . . . . . . . . . . . . . . . . . . . ⅵ
List of Figures . . . . . . . . . . . . . . . . . . . . . . . . . . . . . . . . . . . . . . . . . . . . . . . . . . . . . . . . . . . . . ⅶ
Chapter 1 INTRODUCTION . . . . . . . . . . . . . . . . . . . . . . . . . . . . . . . . . . . . . . . . . . . . . . . . . . .1
Chapter 2 BACKGROUND AND LITERATURE . . . . . . . . . . . . . . . . . . . . . . . . . . . . . . . . . . .6
2.1 Basic concepts . . . . . . . . . . . . . . . . . . . . . . . . . . . . . . . . . . . . . . . . . . . . . . . . . . . . .6
2.2 Gas Breakdown mechanisms . . . . . . . . . . . . . . . . . . . . . . . . . . . . . . . . . . . . . . . . . .6
2.2.1 Townsend discharge theory . . . . . . . . . . . . . . . . . . . . . . . . . . . . . . . . . . . . . .6
2.2.2 Paschen’s law . . . . . . . . . . . . . . . . . . . . . . . . . . . . . . . . . . . . . . . . . . . . . . . . .8
2.2.3 Streamer Theory of Breakdown . . . . . . . . . . . . . . . . . . . . . . . . . . . . . . . . . .11
2.3 High Frequency Breakdown . . . . . . . . . . . . . . . . . . . . . . . . . . . . . . . . . . . . . . . . .12
2.4 Air and Gas dielectrics Insulation . . . . . . . . . . . . . . . . . . . . . . . . . . . . . . . . . . . . .14
2.4.1 Air Insulation Application . . . . . . . . . . . . . . . . . . . . . . . . . . . . . . . . . . . . . .14
2.4.2 Gas Dielectrics . . . . . . . . . . . . . . . . . . . . . . . . . . . . . . . . . . . . . . . . . . . . . . .15
2.4.3 Vacuum Surface Flashover . . . . . . . . . . . . . . . . . . . . . . . . . . . . . . . . . . . . . .16
2.5 Space System Insulation . . . . . . . . . . . . . . . . . . . . . . . . . . . . . . . . . . . . . . . . . . . .18
Chapter 3 EXPERIMENTAL SETUP AND PROCEDURE . . . . . . . . . . . . . . . . . . . . . . . . . . .19
3.1 Experimental Setup . . . . . . . . . . . . . . . . . . . . . . . . . . . . . . . . . . . . . . . . . . . . . . . .19
3.2 Experimental Procedure . . . . . . . . . . . . . . . . . . . . . . . . . . . . . . . . . . . . . . . . . . . . .23
Chapter 4 RESULTS AND DISCUSSION. . . . . . . . . . . . . . . . . . . . . . . . . . . . . . . . . . . . . . . . .24

v
4.1 Theoretical Calculation . . . . . . . . . . . . . . . . . . . . . . . . . . . . . . . . . . . . . . . . . . . . . .24
4.2 DC Breakdown Experiments . . . . . . . . . . . . . . . . . . . . . . . . . . . . . . . . . . . . . . . . . . . .30
4.3 Comparison between Theoretical and Experimental Curves . . . . . . . . . . . . . . . . .34
4.4 Conclusions . . . . . . . . . . . . . . . . . . . . . . . . . . . . . . . . . . . . . . . . . . . . . . . . . . . . . .38
Chapter 5 RESULTS AND DISCUSSION. . . . . . . . . . . . . . . . . . . . . . . . . . .. . . . . . . . . . . . . . . 39
References . . . . . . . . . . . . . . . . . . . . . . . . . . . . . . . . . . . . . . . . . . . . . . . . . . . . . . . . . . . . . . . . . . . . . . .41

vi
List of Tables
Table 2.1 Minimum breakdown voltages . . . . . . . . . . . . . . . . . . . . . . . . . . . . . . . . . . . . . . . . . 9
Table 2.2 Five kinds of models for investigation of different power networks . . . . . . . . . . . 15
Table 4.1 Numerical Parameters A and B of Townsend Coefficient α . . . . . . . . . . . . . . . . . .24
Table 4.2 Calculation Process of Air Breakdown Voltage (A=15 1/cm Torr,
B=365 V/cm Torr) . . . . . . . . . . . . . . . . . . . . . . . . . . . . . . . . . . . . . . . . . . . . . . . . . . . . .26
Table 4.3 Calculation Process of Nitrogen Breakdown Voltage (A=10 1/cm Torr,
B=310 V/cm Torr) . . . . . . . . . . . . . . . . . . . . . . . . . . . . . . . . . . . . . . . . . . . . . . . . . . 27
Table 4.4 Calculation Process of Helium Breakdown Voltage (A=3 1/cm Torr,
B=34 V/cm Torr) . . . . . . . . . . . . . . . . . . . . . . . . . . . . . . . . . . . . . . . . . . . . . . . . . . . . . 28
Table 4.5 Calculation Process of Argon Breakdown Voltage (A=12 1/cm Torr,
B=180 V/cm Torr) . . . . . . . . . . . . . . . . . . . . . . . . . . . . . . . . . . . . . . . . . . . . . . . . . . . . . ..29

vii
List of Figures
Figure 2.1 Schematics of gas discharge process . . . . . . . . . . . . . . . . . . . . . . . . . . . . . . . . . . . . . .7
Figure 2.2 Curve of current versus applied voltage . . . . . . . . . . . . . . . . . . . . . . . . . . . . . . . . . . .7
Figure 2.3 Paschen’s law for breakdown voltages of H2, Air and CO2 . . . . . . . . . . . . . . . . . . . . .10
Figure 2.4 Paschen’s curves of different gases under 400 Hz at room temperature . . . . . . . . . . 11
Figure 2.5 The development of avalanche to a streamer in a uniform field (+= positive ions,
-=electrons, ph= photons emitted from the avalanche . . . . . . . . . . . . . . . . . . . . . . . . .12
Figure 2.6 Ratio of high-frequency breakdown voltage to static breakdown
voltage as a function of frequency for a uniform air gap . . . . . . . . . . . . . . . . . . . . . . .14
Figure 2.7 The main processes responsible for the production of the charged
particles in a gas discharge . . . . . . . . . . . . . . . . . . . . . . . . . . . . . . . . . . . . . . . . . . . . . .16
Figure 2.8 Schematic of triple junction in vacuum . . . . . . . . . . . . . . . . . . . . . . . . . . . . . . . . . . . .17
Figure 2.9 The mechanism of gas molecules are desorbed from the surface . . . . . . . . . . . . . . . .17
Figure 2.10 The needs for high power level space system . . . . . . . . . . . . . . . . . . . . . . . . . . . . . .18
Figure 3.1 Vacuum Chamber . . . . . . . . . . . . . . . . . . . . . . . . . . . . . . . . . . . . . . . . . . . . . . . . . . . .20
Figure 3.2 The schematic of the experiment setup . . . . . . . . . . . . . . . . . . . . . . . . . . . . . . . . . . . .21
Figure 3.3 Point-to-point electrode configuration . . . . . . . . . . . . . . . . . . . . . . . . . . . . . . . . . . . . .22
Figure 4.1 Air Breakdown Voltage as a Function of Pressure with Theoretical Data . . . . . . . . 26
Figure 4.2 Nitrogen Breakdown Voltage as a Function of Pressure with Theoretical Data . . . 27
Figure 4.3 Helium Breakdown Voltage as a Function of Pressure with Theoretical Data . . . . .28
Figure 4.4 Argon Breakdown Voltage as a Function of Pressure with Theoretical Data . . . . . 29
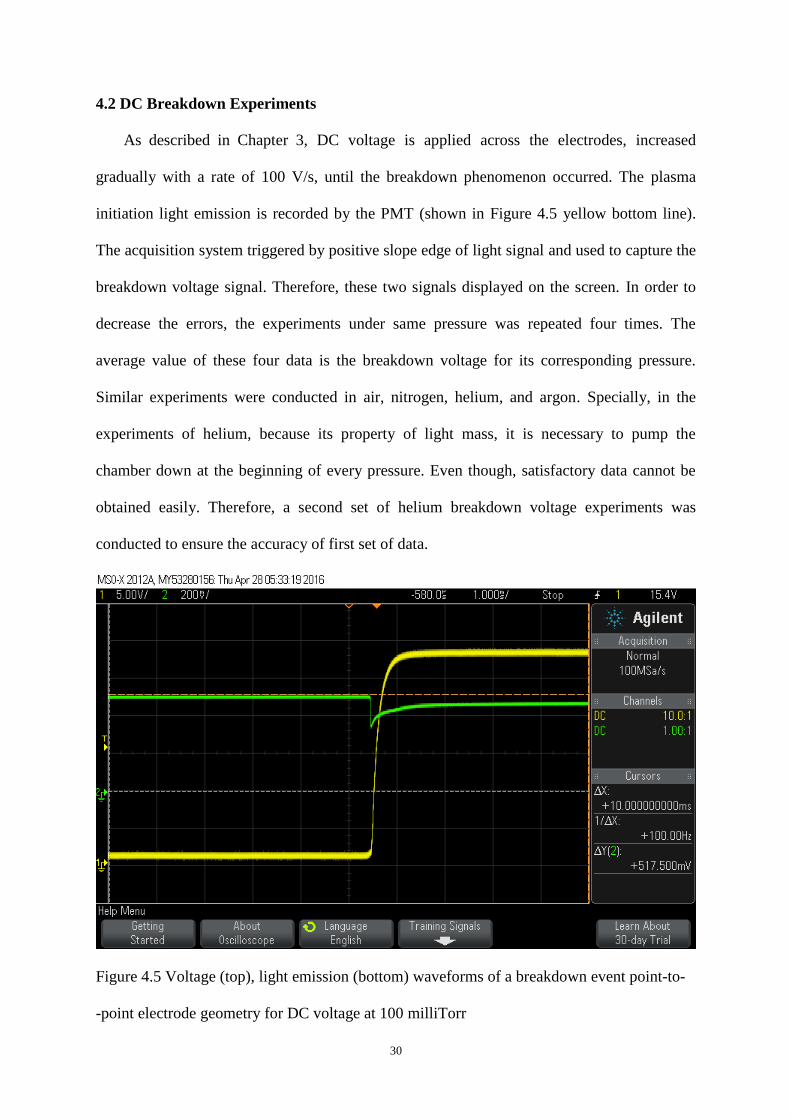
Figure 4.5 Voltage (top), light emission (bottom) waveforms of a breakdown
event point-to-point electrode geometry for DC voltage at 100 milliTorr . . . . . . . . 30

viii
Figure 4.6 Voltage (top), light emission (bottom) waveforms of a breakdown event
point-to-point electrode geometry for DC voltage at 6 Torr . . . . . . . . . . . . . . . . . . . .31
Figure 4.7 Air Breakdown Voltage as a Function of Pressure with Experimental Data . . . . .32
Figure 4.8 Nitrogen Breakdown Voltage as a Function of Pressure with
Experimental Data . . . . . . . . . . . . . . . . . . . . . . . . . . . . . . . . . . . . . . . . . . . . . . . . . . . . . . .32
Figure 4.9 Helium Breakdown Voltage as a Function of Pressure with
Experimental Data (a) . . . . . . . . . . . . . . . . . . . . . . . . . . . . . . . . . . . . . . . . . . . . . . . . . . . .33
Figure 4.10 Helium Breakdown Voltage as a Function of Pressure with
Experimental Data (b) . . . . . . . . . . . . . . . . . . . . . . . . . . . . . . . . . . . . . . . . . . . . . . . . . .33
Figure 4.11 Argon Breakdown Voltage as a Function of Pressure with
Experimental Data . . . . . . . . . . . . . . . . . . . . . . . . . . . . . . . . . . . . . . . . . . . . . . . . . . . . . .34
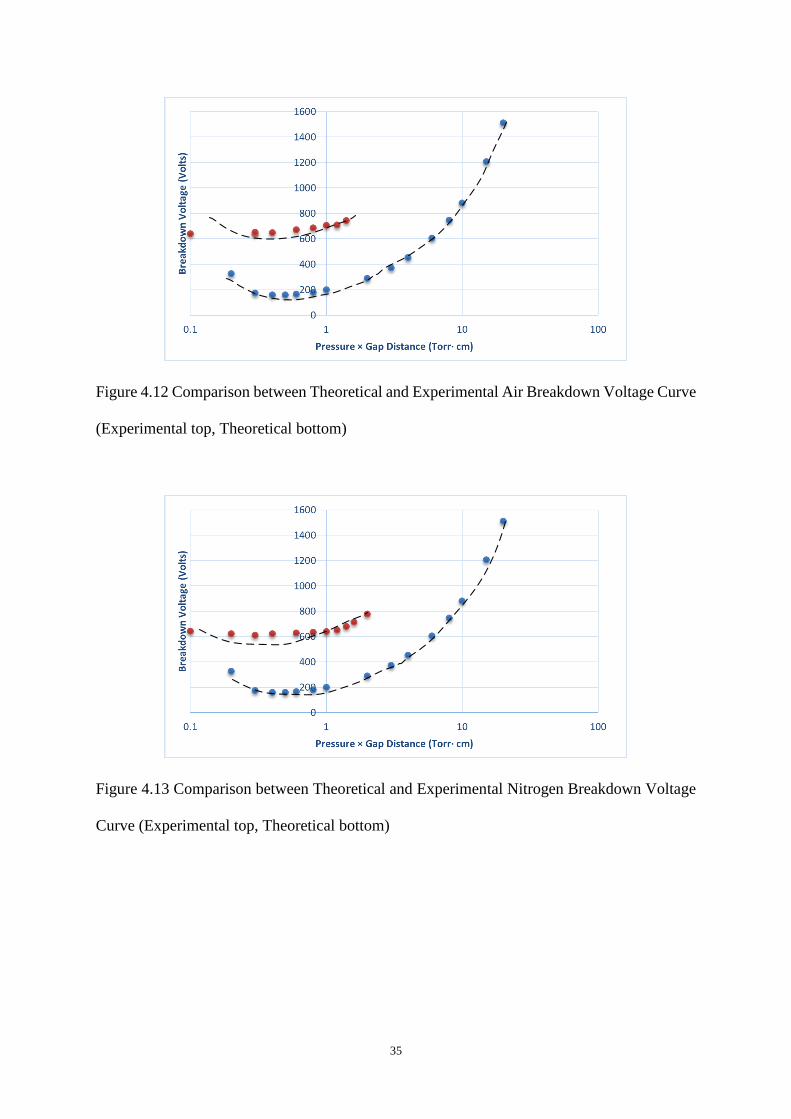
Figure 4.12 Comparison between Theoretical and Experimental Air Breakdown
Voltage Curve (Experimental top, Theoretical bottom) . . . . . . . . . . . . . . . . . . . . . . 35
Figure 4.13 Comparison between Theoretical and Experimental Nitrogen Breakdown
Voltage Curve (Experimental top, Theoretical bottom) . . . . . . . . . . . . . . . . . . . . . . 35
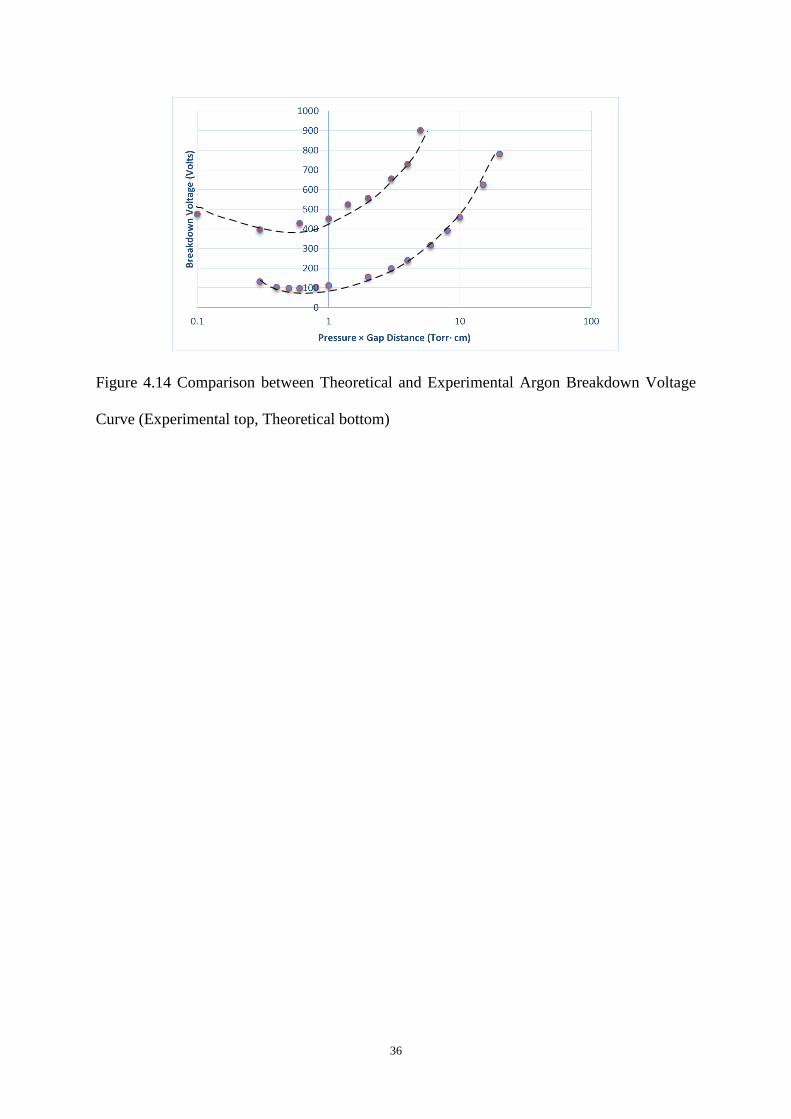
Figure 4.14 Comparison between Theoretical and Experimental Argon Breakdown
Voltage Curve (Experimental top, Theoretical bottom) . . . . . . . . . . . . . . . . . . . . . . 36
Figure 4.15 Comparison between Theoretical and Experimental Helium Breakdown
Voltage Curve (a) first time (b) second time . . . . . . . . . . . . . . . . . . . . . . . . . . . . . . . .37

1
CHAPTER 1
INTRODUCTION
Modern electrical industry with high voltage levels, needs the investigation of breakdown
characteristics of dielectrics. Aerospace industry, such as aircraft and space station applications,
is also requiring much higher power levels nowadays. Switched-mode power supplies offer
solution to overcome these challenges. Meanwhile, understandings of the effects of higher
voltage levels on insulator breakdown under sub-atmospheric vacuum condition are essential.
The high voltage insulation becomes more and more important in power systems. In order
to reduce the losses on transmission lines, higher voltage levels are utilized in many countries.
Therefore, the development of high voltage insulation technologies determines the reliability
of power supply. Gaseous dielectrics, especially the air, have wide range of applications in
power system. Basic requirements for an ideal gaseous insulator are to be cheap, stable, and not
produce flammable or toxic materials under prolonged electrical stresses. It should also have
high uniform and non-uniform field dielectrics strengths under AC, DC and pulsed power [1].
Air, used as an insulator, is applied in most high-voltage transmission lines and open air
circuit-breakers. Under normal circumstances, the air is not conductive and known as an
insulator. On the other hand due to the cosmic rays, it normally contains a small amount of
charged particles, but the number is extremely low, unable to form a conductive path. However,
if the air gap is applied a critical voltage, the current in the air gap will suddenly surge, with
apparent light and heat phenomenon at the same time. Then it will suddenly lose insulating
properties and a conductive path will be formed. This phenomenon is called the gas discharge.
There are two forms of gas discharge, namely breakdown and flashover. The former refers to
2
the pure air gap discharge, and the latter refers to the gas discharge along a solid surface.
Breakdown and flashover are collectively referred as discharge. The gas discharge will only
cause a temporary loss of the insulation. Once the discharge is extinguished, it can recover
insulation performance, so the gas insulation has a kind of self-recovery insulation property.
Air is the cheapest and inexhaustible insulation material. Usually air is used in engineering as
the outer insulation of electric equipment and insulation of overhead transmission line, whose
breakdown strength is 30kV/cm. In the gas dielectric, in addition to air, large amounts of sulfur
hexafluoride are used as insulating medium; sulfur hexafluoride gas is often an internal
insulation for electrical equipment.
Compared with other dielectric materials, vacuum theoretically has the strongest dielectric
breakdown strength, because there is no residual gas and electron collision in the interelectrode
gap. According to Paschen’s Law, the sub-atmospheric pressure means much lower breakdown
voltage level than atmospheric environment. On the other hand, in vacuum, breakdown voltage
can be higher than the atmospheric pressures. In practice, there are absorbed gas and other
contaminants exist on the surface of metallic electrodes in vacuum environment. Generally, the
residual gas pressure of 10-9-10-12 bar exist in what is considered to be the vacuum environment,
and it is called “partial vacuum” environment. When certain threshold electric field intensity is
reached, electric field will stimulate charge carriers, and breakdown or flashover will occur
finally. However, with a suitable design, the vacuum breakdown strength is still better than
most of the dielectric materials. This is why vacuum insulation could be used widely in space
power systems. It’s also the necessity why we study the breakdown characteristics of materials
under vacuum condition.
With the advanced developments in aerospace technologies, higher power levels are
utilized to satisfy the increasing requirements. The International Space Station (ISS) is using a
160V operation voltage compared to a previous 28V standard voltage, and up to 100kW power

3
level. But more power means heavier power supply system. Generally, researchers use higher
frequency level and more compact components to match the requirements. But this, more
compact design brings some insulation failures due to the overstress, incompatible
coordination. Therefore, switch mode power supply (SMPS) becomes more favored because of
its advantages in compactness and effectiveness. The working frequency of high voltage SMPS
in space system is increased from a low range of 60 Hz ~ 400 Hz to radio frequency range of 10
kHz ~ 1 MHz. Thus, SMPS needs a high switching frequency during work. In space systems,
high frequency levels enhance the partial discharges and corona, resulting in power loss and
degradation, aging or even thermal breakdown of the bulk insulation and components. High
frequency also generates electromagnetic interference which disturbs the signal transmissions
in space power systems [11]. The dielectric surface composition and the surface charging are
affected by the low earth orbit (LEO) plasma and UV irradiation. Also, LEO plasma and UV
irradiation generate seed electrons for the breakdown process [2]. The insulation in ground
based systems already experience short circuiting, power losses, and impose spurious signals
onto communication systems and sensitive sensors due to arcing discharges. In space systems,
other environmental factors, in addition to the above failures, such as electrical degradation and
flashover at lower voltages might occur due to the molecular and particulate contaminants and
outgassing [11]. It is important to clarify the breakdown characteristics when the power supply
working with contaminations under such a high frequency operation.
Significantly, vacuum insulation is a well-known technology for space power systems.
But it is significantly important in pulsed power systems and has already been researched for
decades. The recent advances of large pulsed power devices enhance the necessity for
developing vacuum insulation technologies [3].
Also, the flashover voltage value of insulation is much lower than that of breakdown
voltage in vacuum. This is a significant constraint on development of more powerful and

4
compact pulsed power devices [10], because the power density transferred through
high-voltage systems is limited by the surface flashover across insulators [2]. This is the
starting point of continual surface flashover research in high voltage system insulation under
vacuum conditions [10].
Several unpredictable processes, such as partial discharges, corona and volume discharges
are detrimental to power systems and devices as they are the constant source of
electro-magnetic interference and energy loss. These processes could result in big problems as
insulation deterioration and component failure leading to bulk electrical breakdown.
Considering the components of power system, the most significant conditions are the geometry
of electrode gap (homogeneous, inhomogeneous), type of the field (polar, and unipolar fields),
the type of medium (electronegative, atomic, molecular, etc.), the amplitude of applied voltage,
and the operation pressure. The breakdown behavior in vacuum is still not clear completely,
even it has been extensively studied for decades. Systemic results about the breakdown
characteristics of some different gases are needed when DC voltage is applied [6]. Therefore,
this study focuses on the breakdown characteristics of gases under DC fields in partial vacuum
conditions.
The insulating materials influence the breakdown characteristics of total power system.
The most common and popular dielectrics are gases. These dielectrics play an important role in
many special high voltage areas. It is valuable to study electrical properties of gases, especially
under different conditions, such as the ionization, corona and breakdown process [1].
In recent decades, many researches focus on improving surface insulation strength through
doping other metal oxides such as alumina into epoxy. Therefore, high performance composite
insulation materials are produced to match more rigorous requirements [5]. The materials made
by adding nano-scale particulates into polymer based bulk are called nano-dielctrics. It has
been observed that these nano-scale particulates bring significant improvements on the thermal,

5
electrical and mechanical performances of polymeric materials. Besides, initial findings show
that the nano-composite materials have lower electrical conductivity and higher electrical
breakdown strength compared to the non-filler added polyamides, These properties make
nano-dielectric materials prime candidates for electrical insulation for multi-stress and high
repetition rate (high frequency operation) for compact and/or high voltage/power electrical
systems.
Insulating materials can be used for both insulation purposes and for charge storage, in
addition to other purposes like heat conduction (as in liquids) and mechanical support (as in
solids), which make them play a significant role in the design and performance of high voltage
power systems [4].

6
CHAPTER 2
BACKGROUND AND LITERATURE
2.1 Basic concepts
Breakdown processes have been studied over many decades. There are several important
concepts contribute to the formation of breakdown in air. Primary electrons are usually trapped
in air, but they will be released by cosmic rays, and background radiation, to collide with
neutral molecules after accelerating by strong electrical field. This ionization process is
cumulative and promotes the formation of avalanche of electrons, when electrons get enough
energy to cause ionization of the background gas. More details about this process will be
introduced in next section [17].
2.2 Gas Breakdown mechanisms
2.2.1 Townsend discharge theory
The Townsend theory is the earliest theory to explain the breakdown and the gas discharge
mechanism. As shown in the Fig. 2.1, two parallel-plate electrodes connected with the positive
and negative polarities of DC voltage source respectively, forms a uniform electrical field
between them. The free electrons within the gap can be accelerated by the electrical field.
They can also be released from the cathode, and collide with the gas molecules to generate
more electrons. These electrons are also collide with gas molecules and generate more
electrons. Finally, avalanche phenomenon is formed and an electrical conducting pathway
through the gas is established. But the electrical field strength and mean free path are important
for this discharge process. The electrons must acquire sufficient energy from the applied field.
If the electrical field is too small, the electron will not acquire enough velocity to collide with
other gas molecule. If the mean free path is too long, the electron will reach anode without

7
colliding with other gas molecules. On the other hand, if the mean free path is too short, the
electrons will lose their accelerated energy in a series non-ionizing collisions.
Figure 2.1 Schematics of gas discharge process
The relationship between the current and the applied voltage is shown in Figure 2.2. At the
beginning, the current is proportional to the applied voltage closely. After that, there is a
saturation stage, the current will reach I0 for a while. After passing this saturation stage, the
current will increase exponentially.
Figure 2.2 Curve of current versus applied voltage

8
The average number of electrons released by a positive ion is given by
0
e
1 e 1)
d
d
I
I
(2.1)
Where I is current flowing in the circuit, I0 is saturation current, ɑ is first Townsend coefficient,
γ is Townsend secondary ionization coefficient, d is distance between electrodes. Neglecting
the power supply internal resistance, the current becomes infinite if
1( )1de (2.2)
Normally, eαd >> 1, and Equation (2.2) is simply expressed as
1de (2.3)
2.2.2 Paschen’s law
The Paschen’s law essentially describes the breakdown characteristic of a gas in a gap is a
nonlinear function of the product of the gas pressure, p, and the gap distance, d, and usually
written as V= f (pd). Actually, the pressure should probably be replaced by the gas density. It
has been shown that the gas breakdown criterion is given as γ (eαd-1) =1. The coefficients of α
and γ can be determined as functions of the gas pressure p and the electric field E.
For parallel plate electrodes E = V/d, γ = f1 (E/p) and α = pf 2(E/p). Thus, rewriting
Equation (2.2) we have
1 /
1
( )/ 1 1pd f V pdf V pd e (2.4)
With understanding the nature of functions f1 and f2, the Equation (2.2) shows a
relationship between breakdown voltage and product pd, and can be rewrite as,
V F pd (2.5)

9
This equation is very important for high voltage engineering. It is known as the Paschen’s
law, and has been experimentally measured for many gas. At low pd values the breakdown
voltage is inversely proportional to the pd value, and at high pd values it is directly proportional
to the pd parameter. There is a range where breakdown voltage reaches a minimum and it is
called the Paschen minimum. These minimum breakdown voltages for different gases are
showed in Table 2.1.
Table 2.1 Minimum breakdown voltages
Gas Vs min (V) Pd at Vs min (Torr-cm)
Air 327 0.567
Argon 137 0.9
H2 273 1.15
Helium 156 4.0
CO2 420 0.51
N2 251 0.67
N2O 418 0.5
O2 450 0.7
SO2 457 0.33
H2S 414 0.6
Paschen’s curves for three gases, H2, Air and CO2 are shown in Figure 2.3. These curves
states that the relationship between breakdown voltages and product pd are not linear and all
have a minimum value breakdown voltage corresponding to a (pd)min value. The approximate
pd value for air equals to 5 Torr-cm. If the pd< (pd)min, electrons crossing the gap made only
few collisions and higher voltage are needed to supply sufficient energy to the electrons to
cause breakdown. When pd>(pd)min, there are more frequent collisions between electrons and
gas molecule than at (pd)min, but electrons gain lower energy between collision, and the
breakdown voltage for these conditions becomes higher than that of at (pd)min values.
10
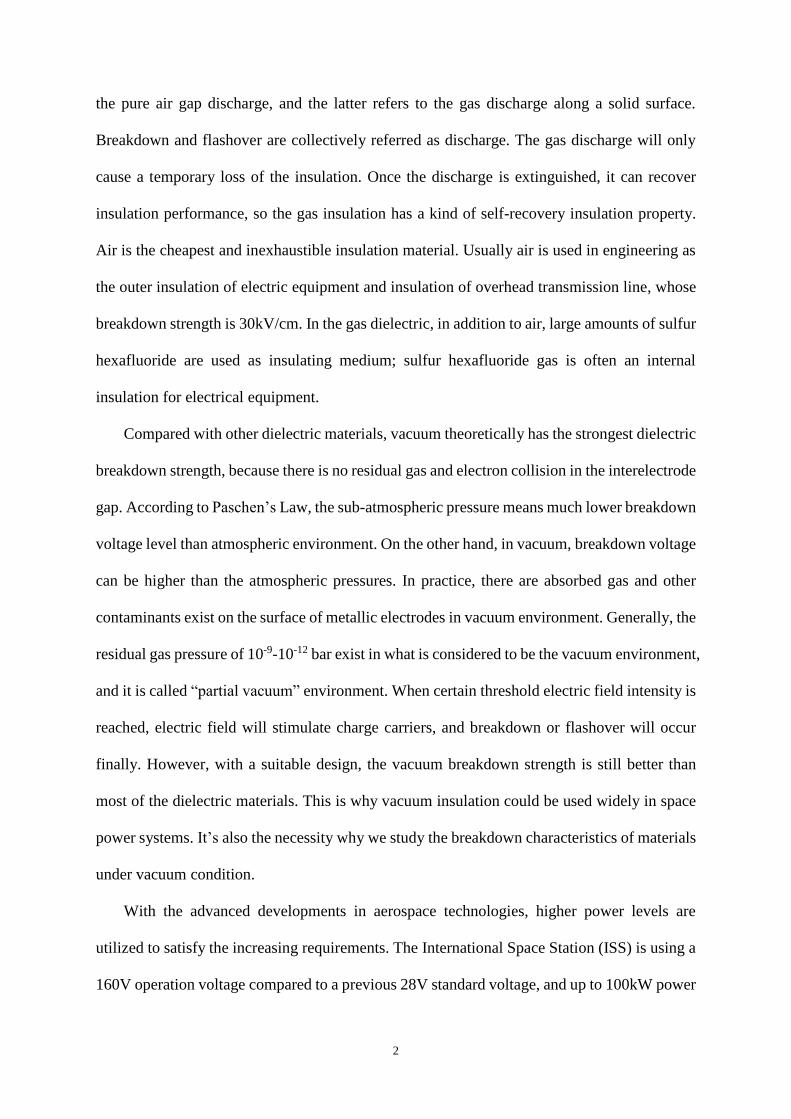
Figure 2.3 Paschen’s law for breakdown voltages of H2, Air and CO2
Traditional aerospace system employ 400Hz frequency because the low frequency of
switched frequency. Figure 2.4 shows the Paschen’s curve at 400 Hz. Currently, the frequency
in space systems is much higher than before, and Paschen’s law still can be observed in kHz
frequency system.

11
Figure 2.4 Paschen’s curves of different gases under 400 Hz at room temperature [18]
2.2.3 Streamer Theory of Breakdown
Paschen’s law has introduced the importance of pd in the breakdown process. The
branched path and zigzag channel cannot be explained by Townsend theory under large pd
values. In this case, streamer theory is presented to interpret these questions. The streamer
process is shown in Figure 2.5.
Slow moving positive ions and fast moving electrons are generated when the electron
avalanche happens. Positive ions are left behind; meanwhile electrons accumulate at the anode
area. Atoms are excited by this primary avalanche and release photons in the gap. These
photons are absorbed by the gas atoms at different places. This process produces ionization and
photoelectrons (See Figure 2.5 a) and therefore generates the auxiliary avalanche.
The auxiliary avalanche, as the second avalanche, repeats above process and generates
more photons and photoelectrons within the gap (See Figure 2.5 b). This stimulates more

12
auxiliary avalanches in coming period. But the space charge formed during this process distort
the electrical field and simultaneous auxiliary avalanches form a zigzag patters from tip to tail
(See Figure 2.5 c). With the developing of the avalanches, the spark channels are formed that
connect the anode and cathode.
Figure 2.5 The development of avalanche to a streamer in a uniform field (+= positive ions, - =
electrons, ph= photons emitted from the avalanche [1]
2.3 High Frequency Breakdown
The discharge behavior becomes different as the frequency of the applied field reaches a
relative high level. The maximum distance Lmax lets all positive ions travel during a half-cycle
of the applied is expressed as,
1/2
max0
sin 2f k VV
L k ftdtd fd
(2.6)

13
Where V is the maximum amplitude of the applied voltage, d is the gap distance, and V/d sin
(2πft) is the field strength. In this case, when d > Lmax, no positive ion cannot reach the opposite
electrode during the half-cycle of the field. Then the Equation (2.6) can be revised to get a
critical frequency fc,
2c
kf V
d
(2.7)
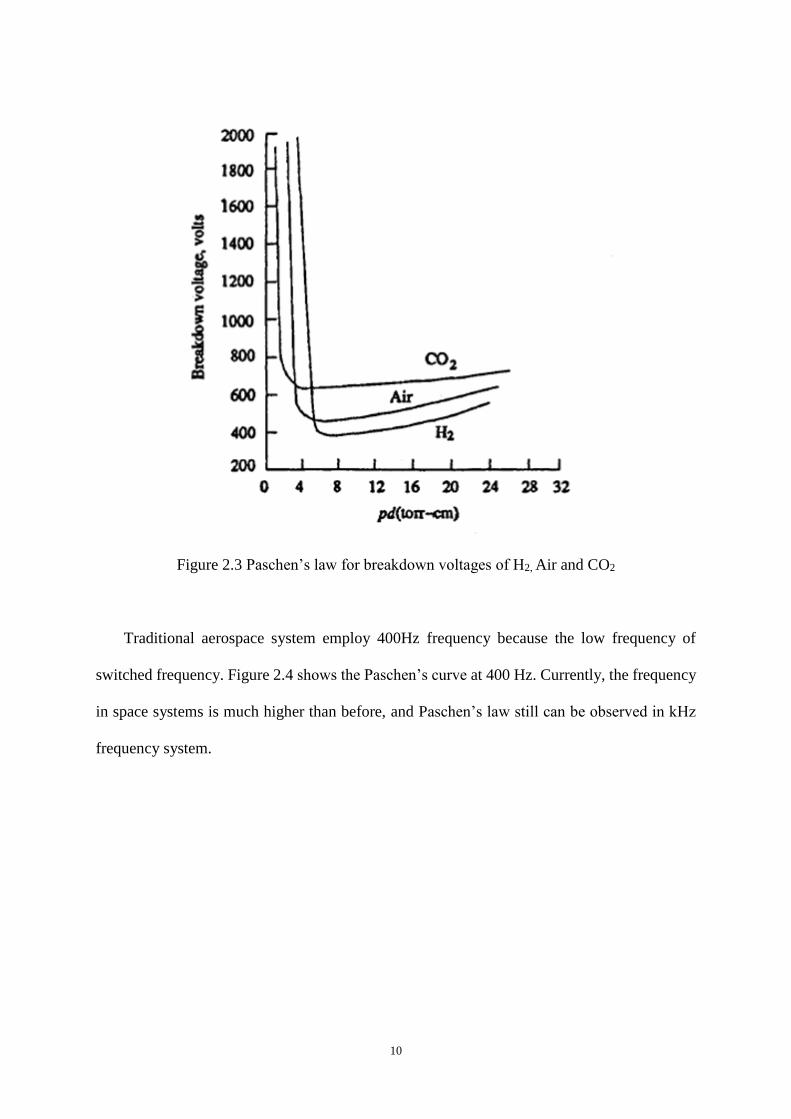
When f < fc, the breakdown characteristics is similar to statics field. When f > fc, the
positive ions will have no time to reach the cathode and oscillate in the gap. This accumulative
charge will distort the field, increase the density of ions until avalanches happen. Due to the
different mechanism, the breakdown under high frequency AC will occur at lower field
strength than that under DC. This phenomenon are shown in Figure 2.6. Before positive ion
oscillation, high frequency breakdown voltage is the same as under statics field. After that, the
breakdown curve drops because of the field distortion until electron oscillation starts. Electrons
will also not reach the anode during the half-cycle just like positive ions will not be able to get
the cathode. Electrons oscillate between the electrodes to neutralize the positive ions and
electrical field. This feature of breakdown forms the parabolic shape with increasing frequency
[16].
14
Figure 2.6 Ratio of high-frequency breakdown voltage to static breakdown voltage as a
function of frequency for a uniform air gap [16]
2.4 Air and Gas dielectrics Insulation
2.4.1 Air Insulation Application
Due to the excellent insulating properties, air is mostly used as outdoor high voltage power
system applications as well as insulation for indoor power systems. According to the practical
applications in power system, air is often used to provide insulation protection for phase to
phase as well as phase to ground. Therefore, different models are designed to simulate these
different conditions. Table 2.2 summaries five kinds of commonly used models for power
system insulation [1].

15
Table 2.2 Five kinds of models for investigation of different power networks [1]
Network section Function Model used for simulation
Phase to phase insulation To provide insulation
between two phases of an
AC transmission line or
between opposite poles of a
bipolar DC line
Conductor- conductor, i.e.,
parallel cylinders or rod-
plane electrodes to
simulate the worst case of a
sharp point on one
conductor opposite to the
other conductor
Phase to tower or phase to
ground insulation
To provide insulation
between the phase
conductor and the
grounded tower or the
ground itself
Conductor- plane or rod-
plane electrodes.
Small diameter conductor
to grounded object
insulation
To provide insulation
between a sharp conductor
and a flat grounded objet in
front of it. This type of
geometry has the lowest air
breakdown strength
Point- plane or rod- plane
electrodes
Sphere-sphere gaps High voltage
measurements and high
voltage switches in impulse
generators
Sphere-sphere electrodes
High voltage protective or
measuring gaps
To bypass high voltage
surges to ground by a spark
discharge. Also used for
impulse chopping and for
high direct voltage
measurements
Rod-rod electrodes
2.4.2 Gas Dielectrics
Due to the excellent properties of compactness, restorability and light weight, gases are
widely utilized in space system and power system insulation. Each gas has a breakdown
voltage at a specific pressure, temperature, and other parameters. Breakdown voltage is defined
as the peak applied voltage across the electrodes when breakdown phenomenon occurs or spark
channel forms. When DC voltage is applied across the electrodes, charged particles may be
produced within the gap (see Figure 2.7). Such charged particles may include, electrons ( e- ),
positive ions ( A+ )and negative ion ( A- ).

16
Figure 2.7 The main processes responsible for the production of the charged particles in a gas
discharge
2.4.3 Vacuum Surface Flashover
Triple junction is an important mechanism for solid insulation surface flashover in vacuum.
As shown in Figure 2.8, the junction part, the cathode metal, vacuum and solid insulator, is the
most vulnerable part because of the different insulating properties of these materials, as well as
the field enhancement at the junction. Emission of a single electron from the cathode tip as the
initial electron, collides with the surface of the insulator to generate another electron. The
initial and the secondary electrons continue to hit the dielectric surface, leading to an electron
cascade and form an electron avalanche finally. This is the simple introduction to secondary
electron emission avalanche (SEEA). When the electron flow reach the anode, the surface
flashover will be completed.
Charged particles production in gas discharge
A- e- and A+ e-
In gas medium At cathode surface In gas medium
Attachment
Ion-pair production
Photoionization
Field emission
Electron impact
+ve ion bombardment
Thermal ionization
Photoionization
Impact ionization

17
Figure 2.8 Schematic of triple junction in vacuum
The classical interpretation assumes that the intermediate stage of surface flashover is an
electron cascade, and the final stage occurs in desorbed surface gas or in vaporized insulator
material. The electron cascade can strongly affect the future development of SEEA.
Figure 2.9 The mechanism of gas molecules are desorbed from the surface
Electron bombardment desorbs adsorbed gas which is ionized by the electrons (See Figure
2.9). Some positive ions drift toward the cathode. This process enhances the electrical field E.
The enhanced electrical field will increase electron emissions from the triple junction further

18
and increase the current along the insulator surface. In this model, desorption of adsorbed gas is
a key process leading to the surface flashover of an insulator.
2.5 Space System Insulation
Nowadays, space system needs high voltage and HV insulation (see Figure 2.10). In
practice, the space environment is highly variable and anything but empty. Therefore, we need
to consider many influences, such as residual gas, contamination, and etc. The most serious
factors influencing electrical phenomena are the local radiation environment, thermal cycling,
and local plasma density, neutral particle density, out gassing /effluents, and the meteoroid flux.
In this thesis, only the breakdown of several gases at subatmospheric pressure, where most
aerospace vehicles operate, is studied. Other space environmental effects are not studied.
Figure 2.10 The needs for high power level space system
Demand for higher
power level
Joule heating
increases
Current high
Keep safe voltage
More massive
electrical conductor
Less payload or more
cost

19
CHAPTER 3
EXPERIMENTAL SETUP AND PROCEDURE
3.1 Experimental Setup
The vacuum chamber is the main body of the experimental set-up (see Figure 3.1). The
High Voltage (HV) probe, the current probe and the Photomultiplier (PMT) are connected to
the experiment through different ports. HV probe is Tektronix p6015, to monitor the voltage
inside the chamber. A Pearson Coil is used as the current probe, and encircle the wire that is
connected to the anode in the chamber. The light emission from the plasma generated at
breakdown is monitored by a Hamamatsu PMT. The current from the PMT is converted to
voltage utilizing a Keithley 485 pico-ammeter. The light emission strength and voltage
waveforms are display on the screen of an Agilent DSOX2012A digital oscilloscope (see
Figure 3.2).
The light emission captured by PMT is used as the trigger signal to capture the breakdown
voltage for the experiments. This is more reliable than the discharge current or negative slope
of breakdown voltage. Therefore, shading the chamber form the outside light is necessary to
avoid the influence of external light source on the PMT signal.
As we known, the breakdown phenomenon occurs instantaneously. Once the breakdown
occurs, the oscilloscope will captured light emission strength and breakdown voltage data
simultaneously.

20
Figure 3.1 Vacuum Chamber
The point to point electrode geometry is one of the simplest configurations. As mentioned
before, it is used to simulate phase-to-phase breakdown condition. The experimental set us
consists of two needle-shape stainless steel electrodes that are placed 1 cm apart from each
other as seen in Figure 3.3.

21
Vacuum ChamberCurrent
Probe
Voltage Probe
PMT
ElectrometerOscilloscope
Anode
Cathode
Figure 3.2 The schematic of the experiment setup

22
Figure 3.3 Point-to-point electrode configuration

23
3.2 Experimental Procedure
The experiments focus on the gas breakdown phenomenon. The breakdown voltage
waveform data are recorded by the oscilloscope for each pressure then a set of data is generated
as the breakdown voltage versus pressure. The experiments are conducted under partial
vacuum environment, mainly at the range of 100 milliTorr to 10 Torr. Before every set of
experiments, it is necessary to bump the chamber until the chamber pressure is below 100
milliTorr, then fill in the corresponding gas to satisfy the pressure requirement. In the pressure
sweep experiments, at a constant pressure, the DC voltage is applied between the electrodes
and increased at a constant rate (about 100V/s) from 0 volts to until the breakdown occurs. The
pressure ranges are from minimum level of 100 milliTorr to different upper pressure level. Air
and Nitrogen are common gases, therefore their experimental pressure range will be 100
milliTorr to 2 Torr. The experiments with argon gas is under 100 milliTorr to 5 Torr. But
Helium being the second lightest element in nature, therefore, pumping the chamber down to
vacuum level and refilling at each fixed pressure value is necessary to record correct
breakdown data. Also, it is know that the Paschean minimum occurs at about 5 too-cm, the
upper pressure for helium breakdown experiments reaches 10 Torr. For every fixed pressure
value of each gas, four breakdown data points are acquired. The average value of these
repeated data reduces the error effectively.

24
CHAPTER 4
RESULTS AND DISCUSSION
4.1 Theoretical Calculation
The experiments are the primary stage of understanding the high-voltage insulation. It is
important to understand the meaning of Townsend theory and Paschen’s law. According to
these two significant theories, we can get the theoretical calculation results to plot the
breakdown voltage curve versus pressure of gases. Every curve should have its own Paschen
curve and (pd)min point. This theoretical curve will be the reference for the real experimental
result.
Reviewing the content mentioned in Chapter 2, the equations can be rewrite as:
/
BAexp
p E p
(4.1)
Where α is the Townsend coefficient, p is the pressure and E is the electrical field. A and B are
specific constants and given in Table 3.1 for each gas studied.
Table 4.1 Numerical Parameters A and B of Townsend Coefficient α
Gas A, 1/cm Torr B, V/cm Torr
Air 15 365
N2 10 310
He 3 34
Ar 12 180
The breakdown voltage as a function of the important parameter pd:
B pdV
C ln pd
(4.2)

25
B is provided by Table 31, and is given by C= ln A- ln ln (1+1/γ).
It is convenient to calculate the breakdown voltage if the Townsend secondary ionization
coefficient γ is known. Townsend secondary ionization coefficient γ depend on type of gas,
cathode material, and reduced electrical field E/p. This value of γ is measurable, but varies
for different materials and gases. Typical range of γ is 0.01~0.1 [19]. We select γ=0.1 for this
calculation. Thus, it is enough to calculate all the breakdown voltages as follows below and
shown in Figure 4.1. With the data of Figure 4.1, a Paschen curve can be plotted.
One important point needed to notice is that the values of A and B are empirical, based on
many stable previous studies. But they are valid only between 1-10 Torr approximately.
Because the Townsend breakdown theory is mainly focus on glow charge and is valid in this
pressure range. The theory breakdowns at pressure below 100 milliTorr. That is exactly the
reason for negative values in the charts (figure 4.1). These negative values will be neglected
during plotting the Paschen curves.
Figure 4.1, 4.2, 4.3, and 4.4 show the calculations of breakdown voltages of air, nitrogen,
helium, and argon respectively. In the valid pressure range, all figures show a good match
with well-known Paschen curve.

26
Table 4.2 Calculation Process of Air Breakdown Voltage (A=15 1/cm Torr, B=365 V/cm Torr)
pd(Torr cm) d(cm) γ C Air Breakdown Voltage (V)
0.13 1 0.1 1.833459 -229.491
0.15 1 0.1 1.833459 -860.022
0.2 1 0.1 1.833459 325.8624
0.3 1 0.1 1.833459 173.9514
0.4 1 0.1 1.833459 159.1857
0.5 1 0.1 1.833459 160.044
0.6 1 0.1 1.833459 165.5788
0.8 1 0.1 1.833459 181.331
1 1 0.1 1.833459 199.0773
2 1 0.1 1.833459 288.9251
3 1 0.1 1.833459 373.4562
4 1 0.1 1.833459 453.4509
6 1 0.1 1.833459 604.1016
8 1 0.1 1.833459 746.2495
10 1 0.1 1.833459 882.4858
15 1 0.1 1.833459 1205.546
20 1 0.1 1.833459 1511.64
Figure 4.1 Air Breakdown Voltage as a Function of Pressure with Theoretical Data
0
200
400
600
800
1000
1200
1400
1600
0.1 1 10 100
Bre
akd
ow
n V
olt
age
(V
olt
s)
Pressure × Gap Distance (Torr· cm)

27
Table 4.3 Calculation Process of Nitrogen Breakdown Voltage (A=10 1/cm Torr, B=310 V/cm
Torr)
pd(Torr cm) d(cm) γ C Nitrogen Breakdown Voltage (V)
0.01 1 0.1 1.427994 -0.97571
0.26 1 0.1 1.427994 996.0447
0.27 1 0.1 1.427994 705.3744
0.3 1 0.1 1.427994 415.1398
0.4 1 0.1 1.427994 242.3281
0.5 1 0.1 1.427994 210.9284
0.6 1 0.1 1.427994 202.7982
0.8 1 0.1 1.427994 205.8347
1 1 0.1 1.427994 217.0878
2 1 0.1 1.427994 292.2955
3 1 0.1 1.427994 368.0827
4 1 0.1 1.427994 440.6088
6 1 0.1 1.427994 577.684
8 1 0.1 1.427994 707.0694
10 1 0.1 1.427994 830.9702
15 1 0.1 1.427994 1124.263
20 1 0.1 1.427994 1401.533
Figure 4.2 Nitrogen Breakdown Voltage as a Function of Pressure with Theoretical Data
0
200
400
600
800
1000
1200
1400
1600
0.1 1 10 100
Bre
akd
ow
n V
olt
age
(V
olt
s)
Pressure × Gap Distance (Torr· cm)

28
Table 4.4 Calculation Process of Helium Breakdown Voltage (A=3 1/cm Torr, B=34 V/cm
Torr)
pd(Torr cm) d(cm) γ C Helium Breakdown Voltage (V)
0.01 1 0.1 0.224021 -0.06752
0.1 1 0.1 0.224021 -1.24391
0.2 1 0.1 0.224021 -3.33307
0.3 1 0.1 0.224021 -6.23968
0.4 1 0.1 0.224021 -10.0964
0.65 1 0.1 0.224021 -25.6527
0.7 1 0.1 0.224021 -30.226
0.8 1 0.1 0.224021 -41.5985
1 1 0.1 0.224021 -78.9365
2 1 0.1 0.224021 259.1251
3 1 0.1 0.224021 152.7205
4 1 0.1 0.224021 142.3236
6 1 0.1 0.224021 149.8861
8 1 0.1 0.224021 164.9769
10 1 0.1 0.224021 181.6376
15 1 0.1 0.224021 223.947
20 1 0.1 0.224021 265.1065
Figure 4.3Helium Breakdown Voltage as a Function of Pressure with Theoretical Data
0
50
100
150
200
250
0.1 1 10 100
Bre
akd
ow
n V
olt
age
(V
olt
s)
Pressure × Gap Distance (Torr· cm)

29
Table 4.5 Calculation Process of Argon Breakdown Voltage (A=12 1/cm Torr, B=180 V/cm
Torr)
pd(Torr cm) d(cm) γ C Argon Breakdown Voltage (V)
0.16 1 0.1 0.955569 -129.574
0.17 1 0.1 0.955569 -189.308
0.2 1 0.1 0.955569 41032.45
0.3 1 0.1 0.955569 132.8928
0.4 1 0.1 0.955569 103.7427
0.5 1 0.1 0.955569 98.12814
0.6 1 0.1 0.955569 98.22739
0.8 1 0.1 0.955569 103.8083
1 1 0.1 0.955569 111.7794
2 1 0.1 0.955569 156.2865
3 1 0.1 0.955569 199.3409
4 1 0.1 0.955569 240.2715
6 1 0.1 0.955569 317.4533
8 1 0.1 0.955569 390.2696
10 1 0.1 0.955569 460.0168
15 1 0.1 0.955569 625.2366
20 1 0.1 0.955569 781.5812
Figure 4.4 Argon Breakdown Voltage as a Function of Pressure with Theoretical Data
0
100
200
300
400
500
600
700
800
900
0.1 1 10 100
Bre
akd
ow
n V
olt
age
(V
olt
s)
Pressure × Gap Distance (Torr· cm)
30
4.2 DC Breakdown Experiments
As described in Chapter 3, DC voltage is applied across the electrodes, increased
gradually with a rate of 100 V/s, until the breakdown phenomenon occurred. The plasma
initiation light emission is recorded by the PMT (shown in Figure 4.5 yellow bottom line).
The acquisition system triggered by positive slope edge of light signal and used to capture the
breakdown voltage signal. Therefore, these two signals displayed on the screen. In order to
decrease the errors, the experiments under same pressure was repeated four times. The
average value of these four data is the breakdown voltage for its corresponding pressure.
Similar experiments were conducted in air, nitrogen, helium, and argon. Specially, in the
experiments of helium, because its property of light mass, it is necessary to pump the
chamber down at the beginning of every pressure. Even though, satisfactory data cannot be
obtained easily. Therefore, a second set of helium breakdown voltage experiments was
conducted to ensure the accuracy of first set of data.
Figure 4.5 Voltage (top), light emission (bottom) waveforms of a breakdown event point-to-
-point electrode geometry for DC voltage at 100 milliTorr

31
Figure 4.6 Voltage (top), light emission (bottom) waveforms of a breakdown event point-to-
-point electrode geometry for DC voltage at 6 Torr
Figure 4.7 shows the air breakdown voltage curve. This is a right hand side of the Paschen
curve with obvious rising up tendency. Its pdmin appears at 100~200 milliTorr. If extend the left
part of this curve to far less than 100 milliTorr, it should have a significant high breakdown
voltage value. Between the range of 100 miiliTorr to several Torr, air has an excellent
insulating property, its lowest breakdown voltage is still more than 640 V.
Figure 4.8 shows the nitrogen breakdown voltage curve. Its breakdown curve resembles the
Paschen curve with both positive and negative slope. Although the values at 400 and 600
Torr·cm distort the bottom part of this curve, it is still complete and a good curve to show the
insulating properties in this range.
Figure 4.9 (a) has two seems to be in error at 2.4 Torr and 3 Torr. Because of the special
properties of helium, the breakdown voltage values from 1 Torr to 8 Torr fluctuate at a stable

32
region. Only if the pd reach to more than 10 Torr, the breakdown voltage could have a rising up
tendency. Because of the limitation of pressure gauge, the voltage at more than 10 Torr was not
measured in this experiment. The curve of Figure 4.9 (b) is similar to Figure 4.9 (a). That
means no severe error occur in our experiments and the overall shape of curve is correct.
Figure 4.10 shows the argon breakdown voltage curve. It has a good configuration of curve.
Its pdmin is about 800 ~1000 miliiTorr, which is match the pdmin provided by Table 2.1.
Figure 4.7 Air Breakdown Voltage as a Function of Pressure with Experimental Data
Figure 4.8 Nitrogen Breakdown Voltage as a Function of Pressure with Experimental Data

33
Figure 4.9 Helium Breakdown Voltage as a Function of Pressure with Experimental Data (a)
Figure 4.10 Helium Breakdown Voltage as a Function of Pressure with Experimental Data (b)

34
Figure 4.11 Argon Breakdown Voltage as a Function of Pressure with Experimental Data
4.3 Comparison between Theoretical and Experimental Curves
Figures 4.12, 4.13, 4.14, and 4.15 show the comparison of theoretical and experimental
breakdown voltages of air, nitrogen, argon, and helium respectively. Compared to the
experimental curve with theoretical curve in the same coordinate system, these two curves
have same tendency at most pd point, but with a constant shift in voltage values. That is
because the theoretical curve are based on the uniform electrical field, the γ and value of A and
B are constant under the prediction of uniform electrical field. But the point-to-point electrodes
have only nonuniform electrical field. It seems like reasonable to have a constant difference
value. The detail reason for this phenomenon need future research in the future.
35
Figure 4.12 Comparison between Theoretical and Experimental Air Breakdown Voltage Curve
(Experimental top, Theoretical bottom)
Figure 4.13 Comparison between Theoretical and Experimental Nitrogen Breakdown Voltage
Curve (Experimental top, Theoretical bottom)
36
Figure 4.14 Comparison between Theoretical and Experimental Argon Breakdown Voltage
Curve (Experimental top, Theoretical bottom)

37
(a)
(b)
Figure 4.15 Comparison between Theoretical and Experimental Helium Breakdown Voltage
Curve (a) first time (b) second time

38
4.4 Summary
This study I introduced the method to calculate the breakdown voltages for four gases with
Paschen’s law and Townsend theory. Then the experimental study is conducted confirming the
correctness of our calculation under DC applied voltage.
Theoretical calculation is based on Townsend secondary ionization coefficient γ, which
depends on the type of gas, cathode material, and reduced electrical field E/p. This value of γ
is set at 0.1 in this calculations for all four different gases. The breakdown voltage is a
function of pressure under DC voltage. They also have a parabolic curve like Paschen curve
without the influence of error data.
Experiments confirms the existence Paschen curve between 100 milliTorr and several
Torr. It also shows the breakdown voltage is a function of pressure. Because the difference of
applied electrical field, uniform electrical field for theoretical and nonuniform one for
experimental, theoretical and experimental breakdown voltage curves have same tendency at
most pd point, but with a constant shifted voltage value. The experiments are successful to
confirm the consistency between theoretical and experimental breakdown voltage curves.

39
CHAPTER 5
CONCLUSIONS
This thesis is mainly consist of two parts, one is theoretical calculation, and the other one is
experimental confirmation. It clarifies the correlation between two different research methods
for gas breakdown phenomenon study. Gaseous dielectrics is the simplest insulation material
for power system. Study with gas dielectrics is also the initial stage and necessary way to
research on solid dielectrics. Familiar with the basic breakdown mechanism is benefit for
learning with plasma and micro- or nano- dielectrics. This experiment utilized point-to-point
electrode, to simulate conditions of high voltage protective or measuring gaps.
In the first part, this theoretical calculation is based on Townsend breakdown theory and
utilized the secondary ionization coefficient γ, which depends on type of gas, cathode material,
and reduced electrical field E/p. It is convenient to calculate the breakdown voltage if we know
the Townsend secondary ionization coefficient γ for the gases in our experiments. But for the
sake of calculating an acceptable set of data, we set γ equal to 0.1 for all four gases in this
experiment. With the data of calculation, a Paschen curve can be drawn out easily. The values
of A and B used for calculation are empirical, based on many stable previous studies and are
valid only between 1-10 Torr approximately (glow discharge region). Before plotting the
breakdown voltages versus pressure curve, negative voltage values were deleted and removed
from the calculations. Finally, from the figures of theoretical calculation, it can be realized that
the breakdown voltage is a function of pressure under DC voltage. These figures own a
parabolic curve like Paschen curve when neglect the influence of error data.
40
As the second part of this thesis is the experimental study of breakdown of gases to
confirm the existence Paschen curve between 100 milliTorr and several Torr. It also shows
the breakdown voltage is a function of pressure. Because the difference of applied electrical
field, uniform electrical field for theoretical and nonuniform one for experimental, theoretical
and experimental breakdown voltage curves have same tendency at most pd point, but with a
constant difference value. The experiments successfully confirm the consistency between
theoretical and experimental breakdown voltage curves. Besides, the nitrogen and argon have
perfect Paschen curve in this pressure range under DC applied voltage. Nitrogen and air have
the largest breakdown voltage value at their pdmin. It is worth mentioning that their pdmin appear
at what the supposed to be. Conduction and ground are important prospects for this experiment.
Without stable wire conduction, flashover phenomenon occurred between two wires rather
than at the gap of two electrodes. We have tried copper wire, stainless steel wire until Teflon
wire is utilized in this experiment. Also, bad connection to absolute ground will lead to the
reference potential inaccuracy.

41
REFERENCES
[1] Malik, N., Al-Arainy, A. and Qureshi, M. (1998). Electrical insulation in power systems.
New York: Marcel Dekker.
[2] F. Hegeler, H. Krompholz, L. Hatfield and M. Kristiansen, "Dielectric surface flashover
in a simulated low Earth orbit environment", IEEE Trans. Plasma Sci., vol. 25, no. 2, pp.
300-305, 1997.
[3] Meng Wang, "Investigations of surface flashover of insulators in vacuum and
applications of vacuum insulators in pulsed power system", XXIst International
Symposium on Discharges and Electrical Insulation in Vacuum, 2004. Proceedings.
ISDEIV.
[4] M. Serkan, H. Kirkici and K. Koppisetty, "Surface Flashover Characteristics of Nano
Particle Cast EPOXY Resin", 2005 IEEE Pulsed Power Conference, 2005.
[5] W. Zhao, G. Zhang, Y. Yang and Z. Yan, "Correlation between trapping parameters and
surface insulation strength of solid dielectric under pulse voltage in vacuum", IEEE
Transactions on Dielectrics and Electrical Insulation, vol. 14, no. 1, pp. 170-178, 2007.
[6] P. Yan, T. Shao, J. Wang, W. Gao, W. Yuan, R. Pan, S. Zhang and G. Sun,
"Experimental investigation of surface flashover in vacuum using nanosecond
pulses", IEEE Transactions on Dielectrics and Electrical Insulation, vol. 14, no. 3, pp.
634-642, 2007.
[7] Y. Chen, Y. Cheng, J. Tang, K. Wu, Y. Sun, L. Shao, Q. Chen, W. Yin, Z. Wang and J.
Zhou, "Experiments and Simulations on Influencing Factors of Pulsed Surface Flashover
in Vacuum",2007 IEEE International Conference on Solid Dielectrics, 2007.
[8] Y. Cheng, Y. Chen, P. Tang, K. Wu, L. Shao, Q. Chen, Y. Sun, W. Yin, Z. Wang and J.
Zhou, "Study on the Vacuum Surface Flashover Characteristics of Epoxy Composites
with Different Fillers under Steep High-Voltage Impulse", 2007 IEEE International
Conference on Solid Dielectrics, 2007.
[9] Z.B. Wang, Y.H. Cheng, Y. Chen, M. Ding, J.B. Zhou, G.D. Meng and K. Wu, "Study
on the Vacuum Surface Flashover Characteristics of Epoxy Composites with MicroTiO2
Fillers under Steep High-Voltage Impulse", 2007 IEEE International Conference on
Solid Dielectrics, 2007.
[10] Yong-Hong. Cheng, Zeng-Bin. Wang and Kai. Wu, "Pulsed Vacuum Surface Flashover
Characteristics of TiO2/Epoxy Nano–Micro Composites", IEEE Transactions on
Plasma Science, vol. 40, no. 1, pp. 68-77, 2012.
[11] Zhenhong. Li and Hulya. Kirkici, "Surface flashover of nanodielectrics with varying
electrode architectures in partial vacuum under DC and kHz pulsed fields", 2012 IEEE
International Power Modulator and High Voltage Conference (IPMHVC), 2012.

42
[12] Mark. Lipham, Haitao. Zhao and Hulya. Kirkici, "Breakdown characteristics of Argon in
partial vacuum under high frequency pulsed voltage with varing duty cycle", 2009 IEEE
Pulsed Power Conference, 2009.
[13] A. Boudjella, H. Hadi, M. Yumoto, T. Sakai and T. Hosokawa, "Investigation on
discharge development phenomena on D.C. high voltage insulator of two grooves", 2000
Annual Report Conference on Electrical Insulation and Dielectric Phenomena, 2000.
[14] K. Koppisetty, H. Kirkici and D. Schweickart, "Partial vacuum breakdown
characteristics of helium at 20 kHz for inhomogeneous field gap", IEEE Transactions
on Dielectrics and Electrical Insulation, vol. 14, no. 3, pp. 553-559, 2007.
[15] Le. Xu, Meng. Wang, Feng. Li, Zun. Yang and Jianjun. Deng, "Spectroscopic Study of
Surface Flashover Under Pulsed Voltage in Vacuum", IEEE Trans. Plasma Sci., vol. 43,
no. 10, pp. 3546-3549, 2015.
[16] Abdel-Salam, M., Anis, H., El-Morshedy, A. and Radwan, R. (2000). High-voltage
engineering. New York, N.Y.: Marcel Dekker.
[17] Haddad, A. and Warne, D. (2004). Advances in high voltage engineering. London:
Institution of Electrical Engineers.
[18] E. Hastings, G. weyl, Guy and D. Kaufman, "Threshold voltage for arcing on negatively
biased solar arrays", Journal of Spacecraft and Rockets, vol. 27, pp. 539-544, 1990.
[19] Fridman, A. and Kennedy, L. (2004). Plasma physics and engineering. New York:
Taylor & Francis.

![FACULTY OF ENGINEERING SYLLABUS FOR S. E. (ELECTRICAL ... · Unit 02 B] : Dielectric Breakdown: (2 Hrs) Introduction, Concept of Primary and Secondary Ionization of Gases (descriptive](https://static.fdocuments.in/doc/165x107/60321e866fff4843e90946d4/faculty-of-engineering-syllabus-for-s-e-electrical-unit-02-b-dielectric.jpg)