Electrical and Optical Properties of Magnesium-filled ...web.usm.my/jps/23-1-12/23.1.4.pdf ·...
18
Journal of Physical Science, Vol. 23(1), 39–56, 2012 © Penerbit Universiti Sains Malaysia, 2012 Electrical and Optical Properties of Magnesium-filled Polystyrene (PS-Mg) Composites Ibrahim R. Agool * Al-Mustansiriyah University, College of Science, Baghdad, Iraq * Email: [email protected] Abstract: The effect of filler content on the electrical and optical properties of polystyrene filled with Mg powders has been investigated. For this purpose, PS samples with Mg additive were prepared with different percentages of Mg and with different thicknesses. The experimental results showed that the conductivity of such composites increased suddenly by several orders of magnitude at a critical weight concentration. The electrical conductivity changed with increasing temperature. Furthermore, the activation energy changed with increasing filler concentration. The dielectric constant, dielectric loss and electrical conductivity changed with the concentration of the filler and with the frequency of the applied electrical field. The absorption coefficient, extinction coefficient, and energy gap of the indirect allowed and forbidden transitions, the real and imaginary dielectric constants, and the optical conductivity were determined. Keywords: polystyrene, electrical conductivity, Mg, dielectric constant, optical properties 1. INTRODUCTION Composites made of polymers with a conducting filler phase allow the combination of the mechanical properties of polymers and their ease of processing with electrical applications that require significant conductivity. Polymer-based electrically conducting materials have several advantages over their pure-metal counterparts, including cost, flexibility, reduced weight, the ability to absorb mechanical shock, corrosion resistance, the ability to form complex parts and controlled conductivity. Filled conducting polymer composites are used for electromagnetic shielding of computers and other electronic equipment. In addition, they are used as conducting adhesives in electronics packaging flip-chips, cold solders, switching devices, static-charge-dissipating materials and devices for surge protection. 1 Since the synthesis of filled conducting polymer composites is an efficient and cost effective process for mass production, significant interest in the technological properties of particle-filled polymers currently exists. Filled polymer composites have a wide range of industrial applications. They are used
Transcript of Electrical and Optical Properties of Magnesium-filled ...web.usm.my/jps/23-1-12/23.1.4.pdf ·...

Journal of Physical Science, Vol. 23(1), 39–56, 2012
© Penerbit Universiti Sains Malaysia, 2012
Electrical and Optical Properties of Magnesium-filled Polystyrene (PS-Mg) Composites
Ibrahim R. Agool*
Al-Mustansiriyah University, College of Science, Baghdad, Iraq
*Email: [email protected]
Abstract: The effect of filler content on the electrical and optical properties of polystyrene filled with Mg powders has been investigated. For this purpose, PS samples with Mg additive were prepared with different percentages of Mg and with different thicknesses. The experimental results showed that the conductivity of such composites increased suddenly by several orders of magnitude at a critical weight concentration. The electrical conductivity changed with increasing temperature. Furthermore, the activation energy changed with increasing filler concentration. The dielectric constant, dielectric loss and electrical conductivity changed with the concentration of the filler and with the frequency of the applied electrical field. The absorption coefficient, extinction coefficient, and energy gap of the indirect allowed and forbidden transitions, the real and imaginary dielectric constants, and the optical conductivity were determined. Keywords: polystyrene, electrical conductivity, Mg, dielectric constant, optical properties 1. INTRODUCTION
Composites made of polymers with a conducting filler phase allow the
combination of the mechanical properties of polymers and their ease of processing with electrical applications that require significant conductivity. Polymer-based electrically conducting materials have several advantages over their pure-metal counterparts, including cost, flexibility, reduced weight, the ability to absorb mechanical shock, corrosion resistance, the ability to form complex parts and controlled conductivity.
Filled conducting polymer composites are used for electromagnetic
shielding of computers and other electronic equipment. In addition, they are used as conducting adhesives in electronics packaging flip-chips, cold solders, switching devices, static-charge-dissipating materials and devices for surge protection.1 Since the synthesis of filled conducting polymer composites is an efficient and cost effective process for mass production, significant interest in the technological properties of particle-filled polymers currently exists. Filled polymer composites have a wide range of industrial applications. They are used

Properties of PS-Mg Composites 40
in anti-static materials, self regulating heaters, over current and over temperature protection devices and materials for electromagnetic radiation shielding.2
The electrical insulating behaviour of most polymeric materials is well documented. However, conductive fillers can be incorporated as a second phase into these matrices, which leads to an increase in the conductivity of the resulting composites. The properties of these composites vary primarily with the filler content. Polymeric composites are traditionally used as electrically insulating materials and are, in general, known to have many structural applications. However, their use in electronics has been relatively limited. To make the polymeric materials electrically conductive, continuous pathways must be established by electrical fillers.3
The percolation theory is the most adequate for modelling the
conductivity of conducting polymer composite materials (CPCMs). It involves convergence of particles to distances at which the probability of transfer of current carriers between them becomes greater than zero. The so-called percolation threshold фc, i.e., the lowest concentration of conduction particles at which continuous conducting chains are formed, is easily determined from the experimental dependence of conductivity on the filler concentration. The percolation threshold is a useful parameter for probing the filler distribution within a polymer matrix.4 Polystyrene (CPS) is a preferred material in electronics technology due to its favourable dielectric and mechanical properties and its low cost. PS can be subjected to high temperature and pressure variations during the manufacture of electronic components.6
Liang10 has studied the electrical properties of PS-carbon nanofibre composites at the percolation threshold and found that both the electrical conductivity and the dielectric constant increased at an additive concentration of 1.7 vol %. It was also determined that the electrical conductivity is dependent on temperature at this additive concentration. The present work addresses the effect of Mg additive on the DC and AC electrical and optical properties of a PS composite. 2. EXPERIMENTAL
The materials used were polystyrene as the matrix and Mg as the filler. Electronic balances with an accuracy of 10–4 were used to weigh the Mg and polymer powders.
The Mg and polymer powders were mixed by hand, and the
homogenisation of the samples was verified by microscopic examination. The

Journal of Physical Science, Vol. 23(1), 39–56, 2012 41
weight percentages of Mg were 0, 20, 40, 50 and 60 wt%. The hot-press method was used to compact the powdered mixtures. The mixtures with different Mg percentages were compacted at a temperature of 145°C under a pressure 100 bar for 10 min, and the samples were subsequently allowed to cool to room temperature. The compacted samples were disc-shaped with a diameter of approximately 15 mm and a thickness that ranged between 1 and 1.43 mm. A coating unit (Edward Coating System E3C6A, Japan) was used to deposit thin-film aluminium electrodes on both sides of each sample. The resistivity was measured over the temperature range from 30 to 80 °C using a Keithley 616C electrometer. The volume electrical conductivity vσ is defined by:
RAL
v
==ρσν
1
(1) where: A = effective area of the guard electrode, R = volume resistance (Ohm), and L = average thickness of sample (cm).
In this model, the electrodes have a circular area A= D2π 4, where D = 0.6 cm2. The dielectric properties of the PS-Mg composites were measured using an Agilent 4294A impedance analyser in the frequency (f) range of 25 × 102 to 5 × 10⁶ Hz at room temperature. The measured capacitance C (w) was used to calculate the dielectric constant έ(w) using the following expression:
C(w) (w)o
d έAε
= (2)
where d is the sample thickness, and A is the surface area of the sample. Whereas, for dielectric loss ε"(w):
ε"(w) = έ (w) × tanδ (w) (3) where tanδ (w) is the dissipation factor.

Properties of PS-Mg Composites 42
The AC conductivity acσ can be calculated by the following equation:
( )ac w wσ ε ε°= ″ (4) where εo is the permittivity of free space and w is the angular frequency (w = 2πf). The transmission and absorption spectra of PS-Mg composites were recorded in the wavelength range of 190 to 850 nm using a double-beam spectrophotometer (Shimedza UV-210oA, Japan). 3. RESULTS AND DISCUSSION
Figure 1 shows the electrical conductivity enhancement of the composite when the concentration of the Mg filler was increased at T = 303 K. At lower concentrations of the filler (ф<45 wt%), the electrical conductivity of the composite increases slightly, whereas at higher concentrations (ф≥45 wt%), the conductivity increases sharply at the point where the composite becomes a good conductor.
Figure 1: Variation of DC electrical conductivity with Mg wt% concentration for PS-Mg composites.
The source of the conductivity enhancement is the electrical contacts
generated from the filler networks, as illustrated in the microscopic photographs in Figure 2, which were taken for samples with different concentrations. At high filler contents, the amount of the interconnecting networks increased, and the contact resistance between the filler decreased. Good electron conduction was
1.00E-16
1.00E-14
1.00E-12
1.00E-10
1.00E-08
1.00E-06
1.00E-04
1.00E-02
1.00E+00
0 10 20 30 40 50 60 70
Mg con. wt.%
con
du
ctiv
ity(
S/c
m)

Journal of Physical Science, Vol. 23(1), 39–56, 2012 43
consequently achieved, which resulted in the transformation of the polymer insulator to a good-conducting polymer composite.5
(a) (b)
(c) (d)
Figure 2: Photomicrographs for PS-Mg composite (a) for pure (×50), (b) for 40 wt% Mg (×50), (c) for 50 wt% Mg (×50), and (d) for 60 wt% Mg (×50).
Figure 3 shows the behaviour of the electrical volume conductivity of the
samples as a function of temperature. The electrical conductivity of samples with low concentrations (ф<фc) increased with increasing temperature, and all of these materials exhibit negative thermal coefficients of resistance. This result is attributed to the polymeric chains and Mg particles acting as traps for the charge carriers, which are transported by a hopping process. When the temperature is increased, segments of the polymer begin to move, which releases the trapped charges.
The release of trapped charges is intimately associated with molecular motion. The increase in current with increasing temperature is attributed to two main parameters: the presence of charge carriers and mobility of these charges.

Properties of PS-Mg Composites 44
Figure 3: Variation of the DC electrical conductivity as a function of temperature for
PS-Mg composites.
An increase in temperature will increase the number of charge carriers exponentially. The mobility of the carriers depends on the structure and the temperature. For high concentrations of Mg, the electrical conductivity decreases with increasing temperature because the composite becomes a good conductor.6,7 Figure 4 shows the relationship between the ln (conductivity) and the reciprocal absolute temperature of the PS-Mg composites. The activation energy was calculated based on the equation:
)/exp( kTEaoσσ = (5) The high activation energy values for the neat sample and the samples with low Mg concentrations are attributed to the thermal movement of the ions and molecules. The low activation energy values for the samples with higher Mg contents are attributed to the electronic conduction mechanism, which is related to the decreased distance between the Mg particles.8
An increase in the concentration of Mg diminishes the activation energy, as shown in Figure 5 for PS-Mg composites with low Mg concentrations. This result supports the previous discussion concerning the thermal movements of ions.10
1.00E-16
1.00E-14
1.00E-12
1.00E-10
1.00E-08
1.00E-06
1.00E-04
1.00E-02
1.00E+00
30 40 50 60 70 80
Temperature(C)
con
du
ctiv
ity(
S/c
m) σpure
σ20w t.%σ40w t.%σ50w t.%σ60w t.%

Journal of Physical Science, Vol. 23(1), 39–56, 2012 45
Figure 4: Variation of DC electrical conductivity with reciprocal absolute temperature for PS-Mg composites.
Figure 5: Variation of the activation energy for DC electrical conductivity as a function
of Mg wt% concentration in PS-Mg composites.
Figure 6 shows the variation of the dielectric constant of PS-Mg composites as a function of angular frequency. The figure shows that the dielectric constant values decreased when the applied field frequencies were increased. The increased frequencies result in a decrease in the space-charge
-40
-35
-30
-25
-20
-15
-10
-5
0
2.8 2.9 3 3.1 3.2 3.3 3.4
1000/T(K)-1
ln (
con
du
ctiv
ity)
pure20w t.%40w t.%50w t.%60w t.%
0.4
0.45
0.5
0.55
0.6
0.65
0.7
0.75
0.8
0 5 10 15 20 25 30 35 40
Mg.con.wt.%
E(eV
)

Properties of PS-Mg Composites 46
polarisation to the total polarisation. The space-charge polarisation becomes the dominant type of polarisation at low frequencies, whereas its contributions decrease with increasing frequency. This behaviour results in a decrease in the dielectric-constant values for all of the PS-Mg composites when the electric field frequency is increased.10
Figure 6: Variation of the dielectric constants as a function of angular frequency for PS-Mg composites.
The effect of Mg concentration on the dielectric constants of the PS-Mg
composites at 150 kHz is shown in Figure 7. The dielectric constant increases with weight fraction of Mg at 150 kHz
because the dielectric constant of Mg is greater than that of PS. The increase in dielectric constant with weight fraction of Mg at 150 kHz supports the hypothesis of the space-charge polarisation contribution. The sudden increase in the dielectric constant of the composite with ф = 45 wt% reflects the formation of a capacitance network of Mg. As the weight fraction of Mg increases, the capacitance network increases as well.11, 12
The variation of the dielectric loss with frequency for PS-Mg composites
at room temperature is depicted in Figure 8. The behaviour of dielectric loss is oscillatory, which is attributed to a combination of some relaxation processes that are common in heterogeneous systems. A broad relaxation peak was observed in each of the curves in Figure 8, and the height and broadness of the peaks increased with increasing filler content.
1.0E+00
1.0E+01
1.0E+02
1.0E+03
1.0E+04
1.0E+05
0.0E+00 1.0E+07 2.0E+07 3.0E+07 4.0E+07
W(Hz)
diel
ectr
ic c
onst
ant
έpέ20w t.%έ40w t.%έ50w t.%έ60w t.%

Journal of Physical Science, Vol. 23(1), 39–56, 2012 47
Figure 7: Variation of the dielectric constant as a function of Mg wt% for PS-Mg composites.
Figure 8: Variation of dielectric loss as a function of frequency for PS-Mg composites.
The increases in the peak heights that result from increased filler concentrations are attributed to the enhancement of the bulk conductivity, which implies increased dielectric losses. However, the increased broadness of the peaks may
1.0E+00
1.0E+01
1.0E+02
1.0E+03
1.0E+04
1.0E+05
0 10 20 30 40 50 60
Mg.con.wt.%
diel
ectr
ic c
onst
ant
1.0E-03
1.0E-02
1.0E-01
1.0E+00
1.0E+01
1.0E+02
1.0E+03
1.0E+04
1.0E+05
1.0E+06
0.0E+00 5.0E+06 1.0E+07 1.5E+07 2.0E+07 2.5E+07 3.0E+07 3.5E+07
W(Hz)
diel
ectr
ic lo
ss ε"pε"20w t.%ε"40w t.%ε"50w t.%ε"55w t.%

Properties of PS-Mg Composites 48
be related to the overlapping of the relaxation processes due to the structural changes that occur in the composite as a result of filler addition.14,15
Figure 9 shows the variation in the conductivity of the PS-Mg composites as a function of angular frequency. The figure shows that the AC conductivity increases considerably as the frequency was increased, which is attributed to the space-charge polarisation.14
Figure 9: Variation of the AC electrical conductivity frequency for PS-Mg composites.
Figure 10 shows the variation in the AC conductivity of the PS-Mg
composites as a function of the Mg concentration at 150 kHz and 303 K. The AC conductivity increased slightly at low concentrations of Mg. This increase is due to the effect of the space charge. The particles of Mg take the form of clusters or separated groups. The conductivity increased with increasing Mg concentration because of the increased number of charge carriers and because of the formation of a continuous network of Mg particles inside the composite. Consequently, the conductivity increased as the Mg concentration was increased in the PS-Mg composites.15
1.0E-10
1.0E-08
1.0E-06
1.0E-04
1.0E-02
1.0E+00
11.95 12.95 13.95 14.95 15.95 16.95 17.95
ln(w)
con
du
ctiv
ity(
S/c
m) σp
σ20w t.%σ40w t.%σ50w t.%σ55w t.%

Journal of Physical Science, Vol. 23(1), 39–56, 2012 49
Figure 10: Variation of the conductivity as a function of the Mg wt% in PS-Mg composites.
The absorption coefficient (α) was calculated in the fundamental absorption region from the following equation:16
2.303 Ad
α = (6)
where A is the absorbance and d is the thickness of the sample. The absorption coefficient α are shown in Figure 11 as a function of photon energy for the PS-Mg composites. As evident from the data in the figure, the change in the absorption coefficient is small at low energies, which indicates a low probability of electronic transitions.
1.00E-10
1.00E-08
1.00E-06
1.00E-04
1.00E-02
1.00E+00
0 10 20 30 40 50 60
Mg.con.wt.%
cond
uctiv
ity(S
/cm
)
Properties of PS-Mg Composites 50
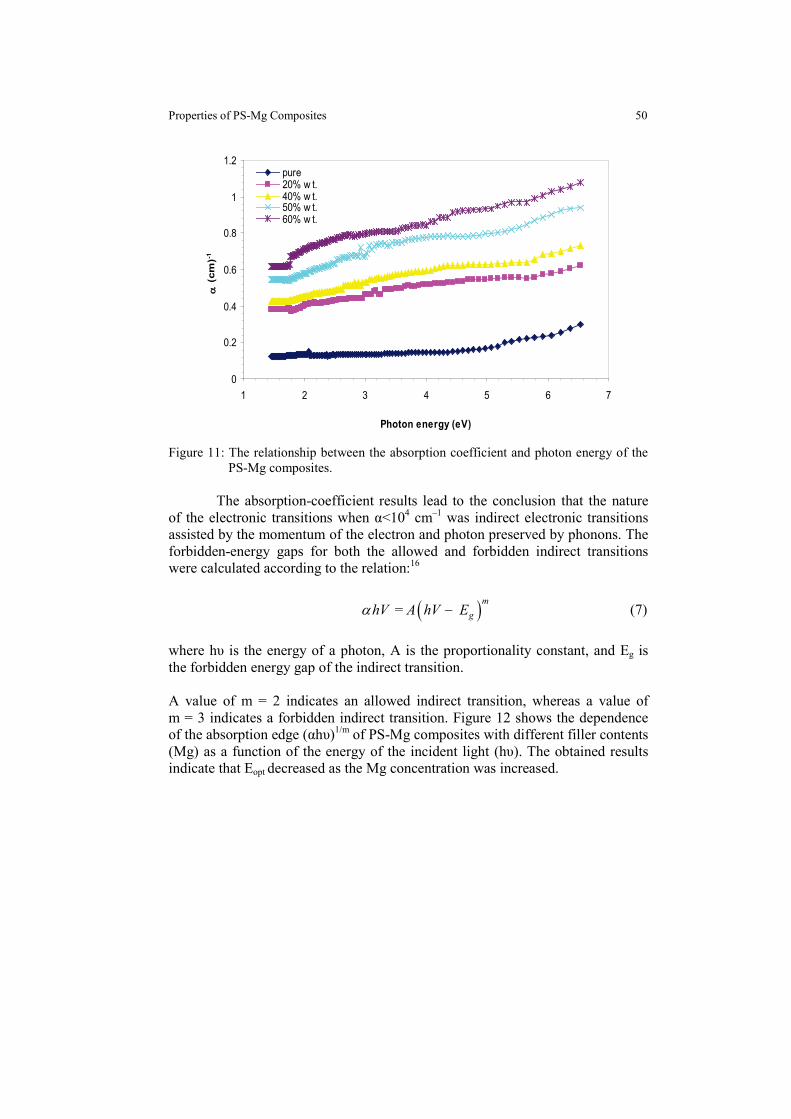
Figure 11: The relationship between the absorption coefficient and photon energy of the PS-Mg composites.
The absorption-coefficient results lead to the conclusion that the nature
of the electronic transitions when α<104 cm–1 was indirect electronic transitions assisted by the momentum of the electron and photon preserved by phonons. The forbidden-energy gaps for both the allowed and forbidden indirect transitions were calculated according to the relation:16
( ) = m
ghV A hV Eα − (7)
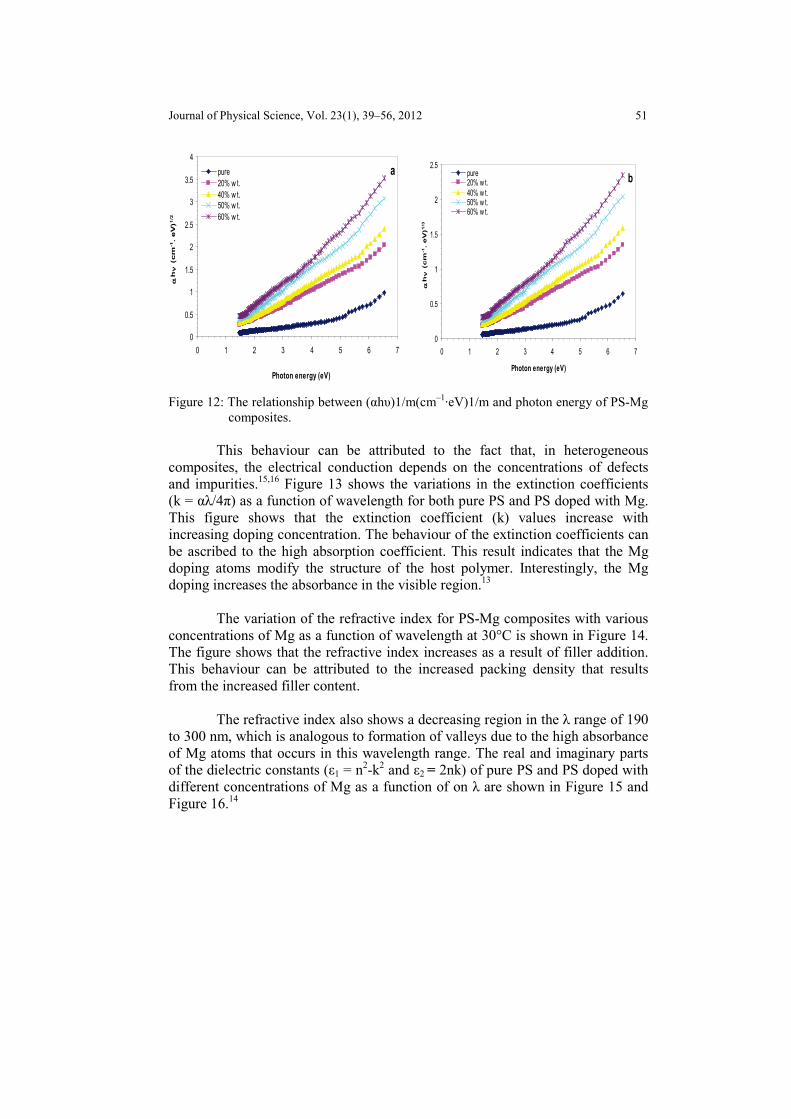
where hυ is the energy of a photon, A is the proportionality constant, and Eg is the forbidden energy gap of the indirect transition. A value of m = 2 indicates an allowed indirect transition, whereas a value of m = 3 indicates a forbidden indirect transition. Figure 12 shows the dependence of the absorption edge (αhυ)1/m of PS-Mg composites with different filler contents (Mg) as a function of the energy of the incident light (hυ). The obtained results indicate that Eopt decreased as the Mg concentration was increased.
0
0.2
0.4
0.6
0.8
1
1.2
1 2 3 4 5 6 7
Photon energy (eV)
α (
cm)-1
pure20% w t.40% w t.50% w t.60% w t.
Journal of Physical Science, Vol. 23(1), 39–56, 2012 51
Figure 12: The relationship between (αhυ)1/m(cm–1·eV)1/m and photon energy of PS-Mg
composites.
This behaviour can be attributed to the fact that, in heterogeneous composites, the electrical conduction depends on the concentrations of defects and impurities.15,16 Figure 13 shows the variations in the extinction coefficients (k = αλ/4π) as a function of wavelength for both pure PS and PS doped with Mg. This figure shows that the extinction coefficient (k) values increase with increasing doping concentration. The behaviour of the extinction coefficients can be ascribed to the high absorption coefficient. This result indicates that the Mg doping atoms modify the structure of the host polymer. Interestingly, the Mg doping increases the absorbance in the visible region.13
The variation of the refractive index for PS-Mg composites with various concentrations of Mg as a function of wavelength at 30°C is shown in Figure 14. The figure shows that the refractive index increases as a result of filler addition. This behaviour can be attributed to the increased packing density that results from the increased filler content.
The refractive index also shows a decreasing region in the λ range of 190 to 300 nm, which is analogous to formation of valleys due to the high absorbance of Mg atoms that occurs in this wavelength range. The real and imaginary parts of the dielectric constants (ε1 = n2-k2 and ε2 = 2nk) of pure PS and PS doped with different concentrations of Mg as a function of on λ are shown in Figure 15 and Figure 16.14
a
0
0.5
1
1.5
2
2.5
3
3.5
4
0 1 2 3 4 5 6 7
Photon energy (eV)
αhν
(cm
-1. eV
)1/2
pure20% w t.40% w t.50% w t.60% w t.
b
0
0.5
1
1.5
2
2.5
0 1 2 3 4 5 6 7
Photon energy (eV)
αhν
(cm
-1. eV
)1/3
pure20% w t.40% w t.50% w t.60% w t.

Properties of PS-Mg Composites 52
Figure 13: The relationship between the extinction coefficient (k) and wavelength for the PS-Mg composites.
Figure 14: The relationship between the refractive index (n) and wavelength (λ) of the PS-Mg composites.
0.00E+00
5.00E-07
1.00E-06
1.50E-06
2.00E-06
2.50E-06
3.00E-06
3.50E-06
4.00E-06
4.50E-06
100 200 300 400 500 600 700 800 900
Wavelength (nm)
Ext
inct
ion
co
effi
cien
t (k
)
pure20% w t.40% w t.50% w t.60% w t.
0
2
4
6
8
10
12
100 200 300 400 500 600 700 800 900
Wavelength (nm)
Ref
ract
ive
inde
x
pure20% w t.40% w t.50% w t.60% w t.

Journal of Physical Science, Vol. 23(1), 39–56, 2012 53
Figure 15: The relationship between the real dielectric constant and wavelength (λ) for the PS–Mg composites.
We conclude that the variation of ε1 mainly depends on n2 because of
small values of k2, whereas ε2 mainly depends on the k values, which are related to the variation of absorption coefficients.
Figure 17 shows the variation in the optical conductivity as a function of the incident photon energy. The optical conductivity was determined using the relationship σ = αnc/4π, where c is the speed of light. The optical conductivity depends directly on the absorption coefficient and was found to increase sharply at higher energy values due to the large absorption coefficient for these values.11, 14
0
20
40
60
80
100
120
100 300 500 700 900
Wavelength (nm)
Rea
l die
lect
ric c
onst
ant
pure20% w t.40% w t.50% w t.60% w t.

Properties of PS-Mg Composites 54
Figure 16: The relationship between the imaginary dielectric constant and wavelength (λ) for the PS-Mg composites.
Figure 17: The relationship between the conductivity and wavelength (λ) for the PS-Mg composites.
0.00E+00
1.00E-05
2.00E-05
3.00E-05
4.00E-05
5.00E-05
6.00E-05
100 200 300 400 500 600 700 800 900
Wavelength (nm)
Imag
inry
die
lect
ric
con
stan
t
pure20% w t.40% w t.50% w t.60% w t.
0
5E-13
1E-12
1.5E-12
2E-12
2.5E-12
3E-12
3.5E-12
4E-12
4.5E-12
5E-12
100 200 300 400 500 600 700 800 900
Wavelength (nm)
Opt
ical
con
duct
ivity
pure20% w t.40% w t.50% w t.60% w t.

Journal of Physical Science, Vol. 23(1), 39–56, 2012 55
4. CONCLUSION
The DC electrical conductivity of the polystyrene increased with increasing Mg concentration and with increasing temperature. The activation energy of the DC electrical conductivity decreased with increasing Mg concentration. The dielectric constant decreased with the increasing frequency and increased with increasing Mg wt%. The dielectric loss is oscillatory in the whole frequency region and increased with increasing Mg wt%. The AC electrical conductivity of the PS-Mg composites increased with increasing frequency of an applied electrical field and with increasing Mg wt%. The absorption coefficient increased with increasing of the filler wt%. The absorption coefficient was less than 104 cm–1, which indicated forbidden and allowed indirect electronic transitions. The nature of the electron transfers in PS samples did not change with the addition of Mg. The forbidden energy gap decreased with increasing filler wt%. The extinction coefficient increased with increasing filler wt%. The real and imaginary dielectric constants and optical conductivity increased with increasing concentration of Mg. 5. REFERENCES 1. Al-Ramadhan. Z. (2008). Effect of nickel salt on electrical properties of
polymethylmethacrylate. J. Col. Ed., 3. 2. Alvarez, M. P., Poblete, V. H., Pilleux, M. E. & Fuenzalida, V. M.
(2006). Submicron Copper-low-density polyethylene conducting composites: Structural, electrical and percolation threshold. J. Appl. Pol. Sci., 99(6), 3005–3008.
3. Ahmed, M. S. & Zihilif, A. M. (1992). The electrical conductivity ofpolypropylene and nickel-coated carbon fiber composite. J. Mater. Sci. Uni. of Jordan, 25 (706).
4. Al-Khayat, B. H. F. & Awni, F. A. (1985). J. Am. Ceram. Soc. Bull., 64(4), 598–601.
5. Bhattacharya S., Sachdev V. K., Tandon. (2008). Electrical properties of Graphite filled polymer composites, 2nd National Conference R. P. mathematical techniques: Emerging paradigms for electronics and IT Industries, 100–101.
6. Hamzah, M., Saion, E., Kassim, A., Mahmud, E. & Shahrim, I. (2009). J. Adv. Sci., 1(1), 9–14.
7. Hamzah, M., Saion, E., Kassim A. & Yousuf, M. (2008). Temperature dependence of AC Electrical conductivity of PVA-PPy-FeCl3 composites polymer Films, Malaysian Pol. J., 3(2), 24–31.

Properties of PS-Mg Composites 56
8. He, X., JDu, J. H. & Ying Z. (2005). Positive temperature coefficient effect in multwalled carbon nanotube high – density polyethylene composite. J. Appl. Phys. Lett., 86.
9. Kwan, S. H., Shin, F. G. & Tsul, W. L. (1984). J. Mater. Sc.,19, 4093–4098.
10. Liang, G. D. (2008). Electrical properties of percolative polystyrene – carbon nanofibir composites, dielectrics and electrical insulation, IEEE Trans. Dielectr. Insul., 15, 214–220.
11. Majdi, K. S & Fadhal, H. J. (1997). Electrical conduction of PMMA and the effect of graphite addition. Uni. Basrah Iraqi Polyms., 11(1), 15–20.
12. Revanasiddappa, M., Raghavendra, S. C., Khasim, S. & Vishnuvardhan, T. K. (2007). J. Bull. Korean Chem. Soc., 28(7), 1104–1108
13. Srivastava, N. K. & Mehra, R. M. (2009). Study of electrical properties of polystyrene foliated graphite composite. J. Mater. Sc. Poland, 27(1).
14. Wu, S-H., Masaharu, I., Natsuki, T. & Ni, Q-Q. (2006). Electric Conduction and percolation behavior of Carbon nanotubes/UPR nanocomposities. J. Reinf. Plastic Comp., 25(18), 1957–1966.
15. Shui, G., Hu, J., Qiu, M., Wei, M. & Xiao, D. (2004). J. Chinese Chem. Lett., 15(12), 1501–1504.
16. Vishnuvardhan, T. K., Kulkarni V. R., Basavaraja, C. & Raghavendra, S. C. (2006). J. Bull. Mater. Sci., 29(1), 77–83.
17. Khalaf, Y. (2008). The dielectric properties of polyvinylchloride-nickel composites. J. Phys., 3, 529–536.