Electrical Activity from the Sinus Node Region in Conscious...
18
SINUS ELECTROGRAMS IN CONSCIOUS DOGS/Hariman et al. 775 phragm maintained in organ culture. Nature 194: 981-982 Morrison DF (1976) Multivariate Statistical Methods, ed 2. New York, McGraw-Hill, p 33 Taylor DA, Westfall DP, DeMoraes S, Fleming WW (1976) The effect of pretreatment with reserpine on the diastolic potential of guinea-pig atrial cells. Naunyn Schmiedebergs Arch Phar- macol 293:81-87 Thoenen H, Stockel R (1975) Ortho- and retrograde axonal transport: importance for the function of adrenergic neurones. Clin Exp Pharmacol Physiol Suppl 2: 1-5 Electrical Activity from the Sinus Node Region in Conscious Dogs ROBERT J. HARIMAN, BRIAN F. HOFFMAN, AND ROBERT E. NAYLOR SUMMARY In an attempt to understand the way automatic cells in the sinus node (SN) control the cardiac rhythm, we studied extracellular electrograms recorded from the SN region in conscious dogs. A SN electrode, containing 48 silver terminals arranged 1.5 mm apart, was implanted over the node, and an indifferent electrode was implanted on the superior vena cava. Through terminals of the SN electrode paired with the vena caval electrode, "unipolar" electrograms were recorded at 100 /iV/cm and with a time constant of 0.1 second. Low amplitude and low frequency deflections (dV/dt s 20 mV/ sec) which resulted from electrical activity of the node could be differentiated from the more rapid deflections due to atrial electrical activity. Electrical activity due to the inherent automaticity of what appeared to be groups of automatic cells was recognized as a slow negative-going diastolic slope followed by a slow negative-going, or negative and then positive-going, SN potential. Impulse propa- gation toward the SN electrode terminal in groups of automatic cells appeared as a slow positive-going deflection interrupting the diastolic slope. Adjacent groups of automatic cells located near the sites of earliest atrial activation discharged asynchronously before the earliest atrial activity; this suggests that multiple groups of automatic cells might initiate atrial activation. In addition to changes in rate and in location of the pacemaking groups of automatic cells, significant beat-to-beat variation in the sinoatrial interval contributed to the changes in atrial rate in "sinus arrhythmia." These studies provide a better understanding of SN function in conscious animals. Circ Res 47: 775-791, 1980 IN 1910, Lewis used electrical methods to determine the location of the pacemaker in the heart. He was able to reproduce P waves identical to the sponta- neous ones by electrically stimulating an area in the superior vena caval-right atrial junction (Lewis, 1910), and concluded that the pacemaker of the heart was located in that area. He also used sur- face electrodes to determine the point of "primary negativity," which also was located in the area of the sinus node (SN) (Lewis et al., 1910). Erlanger (1912-1913), in his evaluation of Lewis's results (Lewis, 1910; Lewis et al., 1910), stated that these results indicated only the place where the sinus impulse passed from the SN into the atrium and not the location of the impulse origin. Subsequently From the Department of Pharmacology, College of Physicians and Surgeons, Columbia University, New York, New York. Supported by Program Project Grant HL 12738-12 and Grant HL 08508-10 from the National Heart, Lung and Blood Institute, National Institutes of Health. Dr. Hariman's current address is: Department of Cardiology, U.S. Public Health Service Hospital, Staten Island, New York 10304. Address for reprints: Brian F. Hoffman, M.D., Department of Phar- macology, College of Physicians and Surgeons, 630 West 168th Street, New York, New York 10032. Received February 13, 1980; accepted for publication May 21, 1980. West (1955) identified the pacemaker transmem- brane action potential in the rabbit SN and showed that this action potential preceded the earliest atrial activity. Recent studies using multiple microelec- trodes to study the rabbit SN preparation in vitro demonstrated that the sinus impulse spread pref- erentially toward the cranial end of the crista ter- minalis (Steinbeck et al., 1978). Several other stud- ies using extracellular electrodes placed in proxim- ity to the SN have reported the recording of what was believed to be electrical activity of the SN. These studies, carried out in both canines and hu- mans, showed various defections preceding the P wave of the ECG (Hecht, 1946; Battro and Bidoggia, 1947; van der Kooi et al., 1956; Warembourg et al., 1973; Ramlau, 1974; Thery et al., 1976; Fenoy et al., 1979). Recently, we developed and validated a method for recording rabbit and canine sinus elec- trograms (Cramer et al., 1977, 1978). This method led us to develop a conscious canine model in which we could study impulse initiation in the SN and its propagation to the atrium. The records obtained from this model may provide an understanding of the way groups of automatic cells within the SN activate the atrium. by guest on June 7, 2018 http://circres.ahajournals.org/ Downloaded from
Transcript of Electrical Activity from the Sinus Node Region in Conscious...

SINUS ELECTROGRAMS IN CONSCIOUS DOGS/Hariman et al. 775
phragm maintained in organ culture. Nature 194: 981-982Morrison DF (1976) Multivariate Statistical Methods, ed 2. New
York, McGraw-Hill, p 33Taylor DA, Westfall DP, DeMoraes S, Fleming WW (1976) The
effect of pretreatment with reserpine on the diastolic potential
of guinea-pig atrial cells. Naunyn Schmiedebergs Arch Phar-macol 293:81-87
Thoenen H, Stockel R (1975) Ortho- and retrograde axonaltransport: importance for the function of adrenergic neurones.Clin Exp Pharmacol Physiol Suppl 2: 1-5
Electrical Activity from the Sinus NodeRegion in Conscious Dogs
ROBERT J. HARIMAN, BRIAN F. HOFFMAN, AND ROBERT E. NAYLOR
SUMMARY In an attempt to understand the way automatic cells in the sinus node (SN) control thecardiac rhythm, we studied extracellular electrograms recorded from the SN region in conscious dogs.A SN electrode, containing 48 silver terminals arranged 1.5 mm apart, was implanted over the node,and an indifferent electrode was implanted on the superior vena cava. Through terminals of the SNelectrode paired with the vena caval electrode, "unipolar" electrograms were recorded at 100 /iV/cmand with a time constant of 0.1 second. Low amplitude and low frequency deflections (dV/dt s 20 mV/sec) which resulted from electrical activity of the node could be differentiated from the more rapiddeflections due to atrial electrical activity. Electrical activity due to the inherent automaticity of whatappeared to be groups of automatic cells was recognized as a slow negative-going diastolic slopefollowed by a slow negative-going, or negative and then positive-going, SN potential. Impulse propa-gation toward the SN electrode terminal in groups of automatic cells appeared as a slow positive-goingdeflection interrupting the diastolic slope. Adjacent groups of automatic cells located near the sites ofearliest atrial activation discharged asynchronously before the earliest atrial activity; this suggeststhat multiple groups of automatic cells might initiate atrial activation. In addition to changes in rateand in location of the pacemaking groups of automatic cells, significant beat-to-beat variation in thesinoatrial interval contributed to the changes in atrial rate in "sinus arrhythmia." These studiesprovide a better understanding of SN function in conscious animals. Circ Res 47: 775-791, 1980
IN 1910, Lewis used electrical methods to determinethe location of the pacemaker in the heart. He wasable to reproduce P waves identical to the sponta-neous ones by electrically stimulating an area in thesuperior vena caval-right atrial junction (Lewis,1910), and concluded that the pacemaker of theheart was located in that area. He also used sur-face electrodes to determine the point of "primarynegativity," which also was located in the area ofthe sinus node (SN) (Lewis et al., 1910). Erlanger(1912-1913), in his evaluation of Lewis's results(Lewis, 1910; Lewis et al., 1910), stated that theseresults indicated only the place where the sinusimpulse passed from the SN into the atrium andnot the location of the impulse origin. Subsequently
From the Department of Pharmacology, College of Physicians andSurgeons, Columbia University, New York, New York.
Supported by Program Project Grant HL 12738-12 and Grant HL08508-10 from the National Heart, Lung and Blood Institute, NationalInstitutes of Health.
Dr. Hariman's current address is: Department of Cardiology, U.S.Public Health Service Hospital, Staten Island, New York 10304.
Address for reprints: Brian F. Hoffman, M.D., Department of Phar-macology, College of Physicians and Surgeons, 630 West 168th Street,New York, New York 10032.
Received February 13, 1980; accepted for publication May 21, 1980.
West (1955) identified the pacemaker transmem-brane action potential in the rabbit SN and showedthat this action potential preceded the earliest atrialactivity. Recent studies using multiple microelec-trodes to study the rabbit SN preparation in vitrodemonstrated that the sinus impulse spread pref-erentially toward the cranial end of the crista ter-minalis (Steinbeck et al., 1978). Several other stud-ies using extracellular electrodes placed in proxim-ity to the SN have reported the recording of whatwas believed to be electrical activity of the SN.These studies, carried out in both canines and hu-mans, showed various defections preceding the Pwave of the ECG (Hecht, 1946; Battro and Bidoggia,1947; van der Kooi et al., 1956; Warembourg et al.,1973; Ramlau, 1974; Thery et al., 1976; Fenoy et al.,1979). Recently, we developed and validated amethod for recording rabbit and canine sinus elec-trograms (Cramer et al., 1977, 1978). This methodled us to develop a conscious canine model in whichwe could study impulse initiation in the SN and itspropagation to the atrium. The records obtainedfrom this model may provide an understanding ofthe way groups of automatic cells within the SNactivate the atrium.
by guest on June 7, 2018http://circres.ahajournals.org/
Dow
nloaded from

776 CIRCULATION RESEARCH VOL. 47, No. 5, NOVEMBER 1980
iM11111iIiH«1111111111111111H1111MI
B
FIGURE 1 A picture of the acrylic plaque electrode andthe sinus electrode (above). The sinus electrode contains48 silver terminals and 9 holes in the periphery for theplacement of sutures; the acrylic plague electrode con-tains 5 silver terminals and 4 holes in the periphery forsutures. Below: The acrylic plaque electrode was im-planted on the superior vena cava and the sinus elec-
Methods
Experimental ModelFifteen healthy dogs of reasonable temperament,
weighing 20-25 kg, were anesthetized with intrave-nous sodium pentobarbital, 25 mg/kg, and mor-phine sulfate, 1 mg/kg. A right thoracotomy wasperformed through the 4th intercostal space. Anacrylic plaque electrode containing five silver ter-minals was sewn on the adventitia of the superiorvena cava about 3 cm superior to its junction withthe right atrium (Fig. 1). Pericardiotomy then wasperformed and the heart suspended in a pericardialsling. We used a "unipolar lead" consisting of a 1-mm platinum electrode mounted in a piece of trans-parent Teflon (Cramer et al., 1978) paired with oneterminal of the acrylic plaque electrode to deter-mine the site on the epicardium over the SN fromwhich a diastolic slope, an upstroke slope, and pri-mary negativity (see Definition of Terms) could berecorded. A sinus electrode containing 48 silverterminals about 0.25 mm in diameter mounted in a3.5 by 2.0-cm plate of plexiglass then was sewn overthat site (Fig. 1). The 48 terminals of the sinuselectrode were arranged in twelve rows of fourterminals, and each terminal was separated fromthe adjacent ones by about 1.5 mm.
The Teflon-coated silver wires from the acrylicplaque and sinus electrodes were externalizedthrough Teflon skin buttons implanted between thescapulas. Electrocardiographic electrodes (Beck-man) were implanted in the subcutaneous tissueover the sternum and the spine at the level of the3rd thoracic vertebra. Postoperatively the animalswere given intramuscular oxacillin (1 g/day) andgentamicin (40 mg/day) for 7 days.
Experimental ProtocolData collection was started after postoperative
day 3, by which time the dogs had recovered fromthe anesthesia and the acute effects of surgicaltrauma; usually this was indicated by the disap-pearance of "sinus tachycardia" (rate >120 beats/min) and the reappearance of "sinus arrhythmia."Each dog was allowed to become accustomed to theexperimental conditions through repeated expo-sures to the laboratory. The dogs were studied whilethey were resting comfortably on a sling.
Electrograms from the region of the SN wererecorded through "unipolar" leads consisting ofeach terminal of the sinus electrode and one of theterminals of the superior vena caval electrode. Thepolarity of the unipolar leads was reversed fromthat used for conventional ECG recording to obtainupward deflections of the negative-going sinus po-tentials (Cramer et al., 1977, 1978). The recording
trode implanted on the epicardium over the sinus node.See text for details.
by guest on June 7, 2018http://circres.ahajournals.org/
Dow
nloaded from

SINUS ELECTROGRAMS IN CONSCIOUS BOGS/Hariman et al. Ill
sites were designated by numbers from 1 to 48according to the locations of the terminals on thesinus electrode. Number 1 was the most postero-superior terminal; numbers 2, 3, and 4 from poste-rior to anterior, completed the superior row, andnumbers 5, 6, 7, and 8, from posterior to anterior,completed the second row. The numbering contin-ued through number 48, the most antero-inferiorterminal. One ECG lead and a bipolar high rightatrial electrogram recorded through two terminalsof the sinus electrode were studied simultaneouslywith one, two, or three simultaneous unipolar leadsof the sinus electrode using an E for M DR 8recorder at a paper speed of 100 mm/sec or anAmpex FR 1300 tape recorder. Filter settings were0.1-20 Hz for the unipolar electrograms of the SN,0.1-500 Hz for the ECG, and 40-500 Hz for thebipolar high right atrial electrogram. In some ex-periments, the unipolar electrograms were recordedusing DC Intronics isolation amplifiers fed to theDC input of the DR 8 recorder. High amplificationin the range of 100 juV/cm was used for the unipolarelectrograms.
Twelve of 15 dogs were suitable for our studiesin terms of the presence of the diastolic and up-stroke slopes (see Definition of Terms) in the rec-ords obtained from the sinus electrode (Table 1).These 12 dogs were used for repeated experimentsat 1- to 3-day intervals for periods varying from 7to 35 dayys (mean ± SD = 22.4 ± 9.7 days, Table 1).Five to 20 consecutive complexes from each recordobtained from these dogs were selected for analysison the basis of stability of recording and clearseparation between T (or U) and P waves of theECG; the latter criterion almost invariably wassatisfied at sinus rates lower than 120 beats/min.The cycle lengths and the sinoatrial intervals weremeasured from the sinus electrograms obtainedfrom each recording site by using a vernier measur-ing device with an accuracy of ± 1 msec.
TABLE 1 Data from Dogs Included in the Current Studies
In three dogs (#9, 12, and 13, Table 1) the sinuselectrode was modified so that it contained 24 closebipolar pairs. These bipolar pairs were arranged in2.0 by 2.0-cm plate of plexiglass, one bipolar pair oneach site, with an interterminal distance of about0.2 mm in each pair and interpair distance of 1.5mm. The numbering, from 1 to 24, for the bipolarpairs was the same as that for the original sinuselectrode. Electrograms from the SN region in thesedogs were obtained through unipolar leads consist-ing of one terminal of each bipolar pair coupledwith one terminal of the superior vena caval elec-trode. Epicardial mapping of atrial activation in thearea surrounding the SN was performed during a"stable" sinus rhythm using the close bipolar leadsin these three dogs and the unipolar leads in threeother dogs (#7, 8, and 15, Table 1). The signalsrecorded through these bipolar or unipolar leadswere displayed on a two-channel Tektronix R5103N storage oscilloscope at a sweep speed of 1000mm/sec and an amplification of 1 mV/cm. Theearliest rapid deflections in the bipolar records orthe earliest rapid negative deflections in the uni-polar records were used to time local atrial activa-tion and to construct isochrone lines.
An upstroke slope and primary negativity (seeDefinition of Terms) could not be recorded throughany of the unipolar leads after about four postop-erative weeks in seven dogs because of the devel-opment of an ectopic atrial rhythm. This ectopicatrial rhythm was proved by epicardial mappingperformed in four of these dogs (Table 1).
Definition of Terms
1. Sinus electrogram: This is a unipolar electro-gram recorded from the area of the SN showing adiastolic slope and a sinus potential (Fig. 2).
2. Diastolic slope (Cramer et al., 1977, 1978):This is a slow negative-going deflection (dV/dt =
Dog.no.
Experiments onpostoperative
day
Sites ofdiastolic and
upstrokeslopes
Sites ofprimary
negativity
Ectopic atrialrhythm on
postoperativeday
Open-chestmapping on
postoperativeday
12345
789
101213
15
4-77-144-93-283-121518-355-346-317-125-296-163-68-1518-286-161820-26
7,811,12,1543,48,12,1619,208,12,164,7,819,20,23,24,2811,15,1627,28,317,8,1123,248,11,1223,242,5,62,352,5,6
6,7,8,12,1610,11,12,15,163,4,6,7,8,122,3,4,7,87,8,11,12,1519,20,24,28,327,8,11,12,152,3,4,6,7,8,11,1219,20,23,24,289,10,11,12,14,1524,27,28,31,324,5,6,7,821,22,23,247,8,10,11,12,1621,22,23,242,3,4,5,6,7,11,122,3,4,6,35,362,3,4,5,6,7,11,12
3038
3733
31
30
29
41
35
33
32
by guest on June 7, 2018http://circres.ahajournals.org/
Dow
nloaded from

778 CIRCULATION RESEARCH VOL. 47, No. 5, NOVEMBER 1980
ECG
HRAE
SNE
FIGURE 2 A record from a conscious dog showing, from top to bottom, inverted Z lead of the ECG, a high right atrialelectrogram (HRAE), and sinus electrograms (SNE) recorded using AC amplifiers from site 7 (A and C) and site 8 (B).Each sinus electrogram in panel A shows a slow negative-going diastolic slope (a) and a slow negative-going upstrokeslope (b) followed by rapid primary negativity (c). The sinoatrial interval (SAI) is measured from the point of departureof the upstroke slope from the line of trajectory of the diastolic slope (d) to the beginning of the primary negativity orthe high right atrial electrogram. The cycle length (CL) of an automatic group is the interval between two consecutivepoints of departure of the upstroke slope from the trajectory of the diastolic slope. Note that with shorter (B) andlonger (C) sinoatrial intervals, a less and more complete sinus potential can be seen. Voltage calibration is for sinuselectrograms.
0.05 to 1.5 mV/sec) recorded during the T-P or U-P segment of the ECG (Fig. 2).
3. Sinus potential (Cramer et al., 1977, 1978):This is a slow negative-going or negative and thenpositive-going deflection (dV/dt < 20 mV/sec) re-corded after the diastolic slope but before primarynegativity and preceding the high right atrial elec-trogram (Fig. 2).
4. Upstroke slope (Cramer et al., 1977, 1978):This is a slow negative-going deflection (dV/dt = 5to 20 mV/sec) recorded after the diastolic slope butbefore primary negativity and the high right atrialelectrogram (Fig. 2). An upstroke slope is the initialpart of the sinus potential.
5. Primary negativity (Lewis et al., 1910): Thisis a rapid negative-going deflection in a unipolarrecord of atrial activity (dV/dt > 25 mV/sec) notpreceded by a positive-going deflection due to atrialactivity (Fig. 2).
6. Automatic group* within the SN: This is anumber of automatic cells from which a typicalsinus electrogram is recorded. An automatic group
* Certain assumptions are necessary to develop a terminology suitableto describe our results. One of these is that the electrica) signals wedesignated as the diastolic slope and the sinus potential are generated bya number of adjacent cells in which the time course of change in trans-membrane potential is quite similar. This assumption is based on studiesof transmembrane potential recorded from many sites in the rabbit SN(Noma and Irisawa, 1976). The cells which undergo a quite simultaneouschange in transmembrane potential and from which we recorded a sinuspotential are defined as an automatic group.
may or may not be a pacemaker (pacemakinggroup), depending on whether or not its impulse isthe first to activate the right atrium.
7. Time of discharge of an automatic group: Thisis indicated by the point of departure of the up-stroke slope from the trajectory of the diastolicslope (Fig. 2).
8. Cycle length of an automatic group: This isthe interval (in msec) between two consecutivetimes of discharge of that group (Fig. 2).
9. Sinoatrial interval (Cramer et al., 1977, 1978)of an automatic group: This is the interval (in msec)between the time of discharge of the group and thebeginning of primary negativity or the beginning ofthe high right atrial electrogram (Fig. 2).
Results
Animal ModelFive of the 12 dogs selected for studies (dogs #1,
2, 3, 9, and 12, Table 1) developed infection rela-tively soon after implantation of the electrodes; theinfection was associated with tachycardia whichabolished the T-P segment of the ECG and maderecognition of the diastolic slope and sinus potentialimpossible. These dogs were not used for experi-ments after infection had developed. Sinus electro-grams were recorded from the other seven dogs forlonger periods until the development of an ectopicatrial rhythm.
by guest on June 7, 2018http://circres.ahajournals.org/
Dow
nloaded from

SINUS ELECTROGRAMS IN CONSCIOUS DOGS/Hariman et al. 779
SNE (DC)
Condenser-Coupled vs. Direct-CoupledAmplifiers
Both condenser-coupled (filters 0.1-20 Hz) anddirect-coupled amplifiers were used to record uni-polar electrograms from the region of the SN. Fig-ure 3 shows electrograms recorded simultaneouslywith both methods. When the traces are compared,T waves in the trace recorded with a condenser-coupled amplifier tend to be broader and upstrokeslopes tend to be less steep (5 mV/sec for thecondenser-coupled trace vs. 17 mV/sec for the di-rect-coupled trace); no difference in the time ofdischarge of the automatic group can be discerned.
Electrical Activity of the AutomaticGroups—Asynchrony, Changes in Rate andin Location
In 12 dogs, diastolic and upstroke slopes wererecorded from one to five sites encompassing an
1100 (AC)
1100 JJV (DC)
FIGURE 3 A record from a consciousdog showing from, top to bottom, lead IIof the ECG, a high right atrial electro-gram (HRAE), and sinus electrogramsrecorded from the same site using a con-denser-coupled amplifier • SNE (AC) anda direct-coupled amplifier - SNE (DC).Voltage calibrations are for sinus electro-grams. See text for details.
o.i sec
area of up to about 4 mm2 (Table 1). Figure 4 showsa record obtained from dog #7. Electrograms fromsites 4, 7, and 8 all show upstroke slopes. However,the automatic groups at these sites discharge asyn-chronously. For example, for complex 15, the timeof discharge of the automatic group at site 7 pre-cedes those at sites 4 and 8. On the following day,the record from this dog showed a change in theabove sequence, i.e., the automatic group at site 8discharged earlier than the automatic groups atsites 4 and 7 (Fig. 5A). This change in sequence ofdischarge was associated with a more rapid atrialrate, less variability in atrial cycle, and a slightchange in P wave configuration (compare parts Band C, Fig. 5).
Periodic changes in the site from which diastolicand upstroke slopes were recorded occurred in threedogs (#5, 13 and 15, Table 1). These periodicchanges were associated with changes in sites fromwhich primary negativity was recorded (Table 1)
A
COMPLEX I
B
I 100 »iV
COMPLEX 10
FIGURE 4 A record from a conscious dog showing from top to bottom, inverted Z lead of the ECG, a high righ'tptrialelectrogram (HRAE) and three simultaneous unipolar electrograms (SNE) recorded from sites 4, 7, and 8 usin'g ACamplifiers. Voltage calibration is for the unipolar electrograms. See text for details.
by guest on June 7, 2018http://circres.ahajournals.org/
Dow
nloaded from
780 CIRCULATION RESEARCH VOL. 47, No. 5, NOVEMBER 1980
EC6"HRAE
SNE4 / -
SNE7
SNE8IlOO(iV
O.I SEC
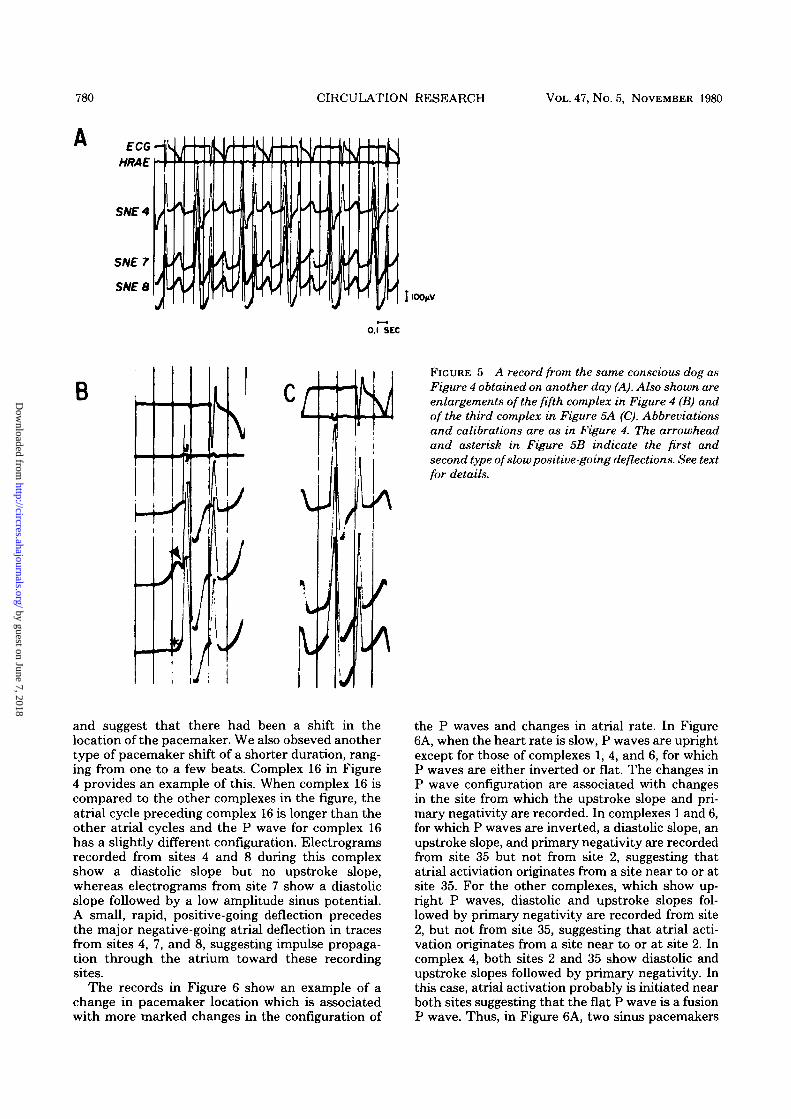
BFIGURE 5 A record from the same conscious dog asFigure 4 obtained on another day (A). Also shown areenlargements of the fifth complex in Figure 4 (B) andof the third complex in Figure 5A (C). Abbreviationsand calibrations are as in Figure 4. The arrowheadand asterisk in Figure 5B indicate the first andsecond type of slow positive-going deflections. See textfor details.
and suggest that there had been a shift in thelocation of the pacemaker. We also obseved anothertype of pacemaker shift of a shorter duration, rang-ing from one to a few beats. Complex 16 in Figure4 provides an example of this. When complex 16 iscompared to the other complexes in the figure, theatrial cycle preceding complex 16 is longer than theother atrial cycles and the P wave for complex 16has a slightly different configuration. Electrogramsrecorded from sites 4 and 8 during this complexshow a diastolic slope but no upstroke slope,whereas electrograms from site 7 show a diastolicslope followed by a low amplitude sinus potential.A small, rapid, positive-going deflection precedesthe major negative-going atrial deflection in tracesfrom sites 4, 7, and 8, suggesting impulse propaga-tion through the atrium toward these recordingsites.
The records in Figure 6 show an example of achange in pacemaker location which is associatedwith more marked changes in the configuration of
the P waves and changes in atrial rate. In Figure6A, when the heart rate is slow, P waves are uprightexcept for those of complexes 1, 4, and 6, for whichP waves are either inverted or flat. The changes inP wave configuration are associated with changesin the site from which the upstroke slope and pri-mary negativity are recorded. In complexes 1 and 6,for which P waves are inverted, a diastolic slope, anupstroke slope, and primary negativity are recordedfrom site 35 but not from site 2, suggesting thatatrial activiation originates from a site near to or atsite 35. For the other complexes, which show up-right P waves, diastolic and upstroke slopes fol-lowed by primary negativity are recorded from site2, but not from site 35, suggesting that atrial acti-vation originates from a site near to or at site 2. Incomplex 4, both sites 2 and 35 show diastolic andupstroke slopes followed by primary negativity. Inthis case, atrial activation probably is initiated nearboth sites suggesting that the flat P wave is a fusionP wave. Thus, in Figure 6A, two sinus pacemakers
by guest on June 7, 2018http://circres.ahajournals.org/
Dow
nloaded from

SINUS ELECTROGRAMS IN CONSCIOUS DOGS/Harimanetal. 781
SNE 35
COMPLEX 1
HOOyUV
2 3 4 6 7 8•-1 O.I sec
FIGUBE 6 4̂ record from a conscious dog showing two competing sinus pacemakers. The ECG is recorded throughlead II. Unipolar electrograms are recorded using AC amplifiers. Abbreviations and calibrations are as in Figure 4.See text for details.
compete to activate the right atrium, and this re-sults in three different P wave configurations. Therecord in Figure 6B was obtained on the samepostoperative day as Figure 6A, but when the dogwas restless. A tachycardia (rate about 135 beats/min) is present and is associated with inverted Pwaves similar to the P waves for complexes 1 and 6in Figure 6A. Primary negativity is recorded in eachcomplex; no diastolic and upstroke slopes can beseen clearly preceding the primary negativity, ex-cept for complex 6 which follows a longer atrialcycle.
The Sinoatrial IntervalSince the automatic groups from which we re-
corded sinus potentials often discharged asynchro-nously, the measured sinoatrial interval varied fromgroup to group. For example, for complex 15 ofFigure 4, the sinoatrial interval is 86 msec whenmeasured from the sinus electrogram recorded fromsite 7, whereas the sinoatrial intervals measured forsites 4 and 8 are 42 and 33 msec, respectively. Inaddition to the variation due to asynchronous activ-ity of automatic groups at different sites, we foundbeat-to-beat variation in the sinoatrial interval at asingle site. For example, for complex 8 of Figure 4,the sinoatrial interval is 150 msec in the trace fromsite 7 and for complex 7 of the same figure, thesinoatrial interval in the trace from the same site is114 msec. The sinoatrial intervals measured fromsinus electrograms recorded from different sites inthe 12 dogs ranged from 30 to 175 msec for auto-matic group cycle lengths ranging from 350 to 1250msec.
Slow Positive-Going DeflectionsWe observed two types of slow (dV/dt < 20 mV/
sec) positive-going deflections in our unipolar rec-
ords from the SN region. The first type followedthe upstroke slope and preceded primary negativityand the bipolar high right atrial electrogram (Fig.5B, arrowhead). This type of slow positive-goingdeflection frequently was seen in association with arelatively long sinoatrial interval. For example, inFigure 4, complex 11 in the trace from site 7 doesnot show such a slow positive-going deflection; thesinoatrial interval for this complex is 85 msec. Incontrast, complex 2 in the same trace does showsuch a deflection; the sinoatrial interval for thiscomplex is 110 msec. Complex 4 with an even longersinoatrial interval of 153 msec shows a bigger slowpositive-going deflection.
The second type of slow positive-going deflectionfollowed the diastolic slope but preceded primarynegativity and the bipolar high right atrial electro-gram (Fig. 5B, asterisk). This slow positive-goingdeflection might be followed by a slow negative-going upstroke slope, primary negativity, or a rapidpositive-going deflection. Two examples are shownin Figure 7, which was obtained from the same dogas Figures 4 and 5. In Figure 7A, the slow positive-going deflection recorded from site 2 is followed byprimary negativity, whereas in Figure 7B in thetrace from site 6, it is followed by a slow negative-going upstroke slope. This positive-going deflection,which was recorded from sites over a distance of 1.5to 3.0 mm around the area from which both diastolicand upstroke slopes were recorded, tended to be-come larger at sites progressively removed from thisarea. In Figure 7, the record from site 2, which isslightly farther than site 6 from the area from whichdiastolic and upstroke slopes are recorded (sites 4,7 and 8), shows a bigger slow positive-going deflec-tion.
As we discuss below, the first type of slow posi-tive-going deflection can be assumed to result from
by guest on June 7, 2018http://circres.ahajournals.org/
Dow
nloaded from

782 CIRCULATION RESEARCH VOL. 47, No. 5, NOVEMBER 1980
SNE2
s
FIGURE 7 A record from the sameconscious dog as Figures 4 and 5,showing the second type of slow posi-tive-going deflection recorded fromsites 2 and 6 using AC amplifiers. Ab-breviations and calibrations are as inFigure 4. See text for details.
1100 )iV
O.I SEC
changes in transmembrane potentials of the cells inthe automatic group from which the signals arerecorded, whereas the second type of slow positive-going deflection can be assumed to result fromimpulse propagation through the SN toward therecording site.
Atrial ActivationIn six dogs (#7, 8, 9, 12,13, and 15, Table 1) atrial
activation times in the epicardial region of the SNwere determined from the rapid deflections re-corded through unipolar or close bipolar leads ofthe sinus electrode. The earliest epicardial activa-tion occurred almost simultaneously (within 1-2msec) over an area of up to about 8 mm2 andencompassed the sites from which primary negativ-ity was recorded. Figure 8 shows 2-msec isochronelines drawn from the atrial activation times deter-mined in dog #7 using unipolar leads. The timereference is the bipolar electrogram recordedthrough two adjacent terminals of the sinus elec-trode. Consistent with the data reported for therabbit SN preparation (Sano and Yamagishi, 1965,Steinbeck et al., 1978), there is more rapid spreadof activation along the axis of the sulcus terminalisthan in other directions (Fig. 8); similar results wereobtained from the other five dogs. In dog #7, dia-stolic and upstroke slopes were recorded from sites4, 7, and 8; primary negativity was recorded fromsites 2, 3, 4, 6, 7, 8, 11, and 12 (Table 1) and thesecorrespond to the shaded area showing earliestatrial activation in Figure 8. Outside of this area of
earliest activation, a rapid positive-going deflectionprecedes the major rapid negative-going deflection.In dogs that showed periodic changes in the locationof the area from which diastolic and upstroke slopeswere recorded (dogs #5, 13, and 15), there werecorresponding periodic changes in the location ofthe area from which primary negativity was re-corded (Table 1). This suggests that the earliestatrial activation in these dogs indeed originatedfrom the impulses generated by these automaticgroups.
The area from which primary negativity wasrecorded usually was larger than the area fromwhich both diastolic and upstroke slopes were re-corded (Table 1). Thus, there were epicardial sitesin the SN region from which a diastolic slope andprimary negativity, but no upstroke slope, wererecorded.
In three dogs (#5, 9, and 12, Table 1), the reversewas obtained. In these dogs, there were sites fromwhich a diastolic slope and an upstroke slope, butno primary negativity, were recorded. Figure 9Ashows an example of this phenomenon in dog #5.The traces from sites 8 and 12 show both a diastolicslope and a sinus potential followed by primarynegativity, whereas trace from site 16 shows dia-stolic and upstroke slopes followed by a rapid pos-itive-going deflection (arrow). This rapid positive-going deflection indicates atrial activation movingtoward recording site 16. This atrial activationmight result from an impulse originating from theadjacent automatic groups at sites 8 or 12 (Fig. 9B),
by guest on June 7, 2018http://circres.ahajournals.org/
Dow
nloaded from

SINUS ELECTROGRAMS IN CONSCIOUS DOGS/Hariman et al. 783
Dog # 7Nov. 11-1978
I Sulcus' Terminalis
FIGURE 8 A map of atrial activation time in the samedog as in Figures 4, 5, and 7, determined using theunipolar leads of the sinus electrode. The numbers (inmsec) indicate the moment of activation related to theearliest rapid negative deflection. Heavy black linesindicate the constructed 2-msec isochrone lines from thedetermined atrial activation time. The shaded area rep-resents the area of earliest activation. S = superior, A= anterior, I = inferior and P — posterior. See text fordetails.
or from an impulse from the automatic group at site16 itself, which propagated through the SN, had anatrial breakthrough remote from this site, activatedthe neighboring atrium, and initiated propagationin the direction of this site (Fig. 9C).
DiscussionConscious Canine Model
We elected to study sinus function in consciousdogs for the following reasons: (1) heart rate issignificantly lower than in anesthetized dogs andallows better identification of diastolic and upstrokeslopes (Cramer et al., 1977, 1978), (2) studies onconscious animals provide an opportunity to eval-uate sinus function in the presence of modulation
by an intact autonomic nervous system, manifestedby changes in rate, in the sinoatrial interval re-corded from each automatic group and in the loca-tion of the sinus pacemaker. Such spontaneouschanges are not observed in an isolated preparation(Steinbeck et al., 1978), presumably because of theabsence of autonomic modulation, and are lessprominent in anesthetized animals.
The questions to be asked concern the suitabilityof the canine SN for these studies and the appro*priateness of the recording methods we used. Thedog heart has been used for many electrophysiolog-ical and pharmacological studies and thus wouldpermit a direct correlation between our results andprevious observations. There have been many stud-ies on the transmembrane potentials of the rabbitSN, but only limited data are available for the dog(Woods et al., 1976; Cramer et al., 1978). It has beenshown that, as expected, the voltage-time course ofthe transmembrane potential of the canine sinuspacemaker is like that recorded from the rabbit(Woods et al., 1976). Also, there appears to be thesame sort of transition in configuration and mag-nitude of the transmembrane action and restingpotentials as one proceeds from pacemaker fibersthrough transitional fibers to atrial muscle (Woodset al., 1976). Unforunately, there is no completemap of the canine SN, like that prepared for therabbit (Steinbeck et al., 1978), and thus some of ourarguments must be based on data for the latterspecies.
The fine structure of the canine and rabbit SNhas been described by several investigators andthere have been attempts to correlate the structurewith the electrical activity (Trautwein and Uchi-zono 1963; James et al., 1966; Woods et al., 1976;Taylor et al., 1978; Tranum-Jensen, 1978). In gen-eral, the organization of the SN can be described asfollows: Clusters of cells which are poor in myofila-ments have been described by all; these have beentermed P cells by James et al. (1966), and arethought to represent the pacemaker cells or cellswith the highest automaticity. These cells in eachcluster have fairly large areas of membrane in closeapposition and a basement membrane envelopingthem (Trautwein and Uchizono, 1963; James et al.,1966; Woods et al., 1976; Taylor et al., 1978). Theclusters are separated by connective tissue, vessels,nerves, and transitional fibers. Most investigatorshave not found frequent gap junctions betweenthese cells, and some have suggested that the elec-trical coupling is poor; nevertheless, electrotonicinteraction between those cells seems to be strong(Bonke, 1973; Noma and Irisawa, 1976). Moreover,sufficient studies employing freeze-fracture havenot been done and thus the relative density ofjunctional particles not associated with gap junctionis unknown. From these data, we think it permis-sible to assume that the canine SN includes groupsof specialized cells which normally show prominentphase 4 depolarization and which can generate
by guest on June 7, 2018http://circres.ahajournals.org/
Dow
nloaded from

784 CIRCULATION RESEARCH VOL. 47, No. 5, NOVEMBER 1980
EC6
HRAE
I 1 )
0.1 SEC
B8 12 IS. 8 12 Ji
FIGURE 9 A record of sinus electrograms (SNE) from a conscious dog obtained using AC amplifiers (A) anddiagrammatic drawings of impulse propagation from the possible sinus pacemakers to the atrium (B and C). Thearrow in Figure 9A indicates a rapid positive-going deflection following diastolic and upstroke slopes. SN = sinusnode, RA = right atrium, EPI = epicardium and SVC = superior vena cava; other abbreviations and calibrations areas in Figure 4. See text for details.
spontaneous action potentials. We assume, on thebasis of data for the rabbit SN (Noma and Irisawa,1976), that transmembrane potential changes al-most simultaneously in all cells in a group, but thetime course of change in transmembrane potentialmay not by synchronous for cells in differentgroups.
Anatomically and histologically, the canine SNresembles the human SN (James, 1962a; James etal., 1966). The canine SN lies about 1 mm beneaththe epicardium, separated from it by fat and looseconnective tissue (James 1962a). The shape of thecanine SN may vary from oblong or spindle-shapedto irregular; the large variation in the shape of thecanine SN makes it difficult to specify its exactmeasurements. Lewis et al. (1910) estimated thelength of the canine SN to be about 8 to 16 mm andits width about 2 mm. In humans, Walmsley (1929)described the SN as spindle-shaped and measuring20 by 3 by 1 mm. From studies on dogs (Meek andEyster, 1914), we assume that the sinus pacemakermay shift from the cranial to the caudal part of thenode under the influence of the autonomic nerves.If this is so, it would be essential for our recordingterminals to extend over an area at least as great as
the projection of the node on the epicardium. Al-though data for the dimensions of the canine SNvary somewhat, we believe that we have satisfiedthis criterion. Unlike the case for the rabbit, thecanine SN is a three-dimensional structure; somecells thus are much farther from the epicardiumthan the others. In spite of this, since we haveshown that a diastolic slope and an upstroke slopecan be recorded simultaneously and with approxi-mately equal amplitude from both the epicardialand endocardial surfaces of the canine SN (Crameret al., 1978), we believe that our sinus electrodeimplanted on the epicardium was able to detectsignals originating deep in the node and not justthose originating close to the epicardium.
Sinus electrograms were recorded for up to 35days after implantation of the sinus electrode(Table 1); after this period, no sinus potential couldbe recorded from any of the 48 sites because of thedevelopment of an ectopic atrial rhythm. The de-velopment of this rhythm in our dogs probably wasrelated to damage caused by chronic implantationof the sinus electrode as well as to pericarditiscaused by surgery (James, 1962b). Impairment ofblood supply to the SN might have contributed to
by guest on June 7, 2018http://circres.ahajournals.org/
Dow
nloaded from

SINUS ELECTROGRAMS IN CONSCIOUS BOGS/Harimanetal. 785
this damage, although this is rather unlikely in dogsbecause of the presence of extensive arterial anas-tomoses (James, 1962a). With the exception of therecord in Figure 6 obtained from dog #15 on post-operative day 18, results of these studies could notbe attributed solely to abnormal sinus function,because similar results were obtained early in thepostoperative period, at a time when significantdamage to the SN would not be expected. Also, insupport of this belief, records obtained intraopera-tively from healthy dogs using a hand-held elec-trode probe showed similar changes in location ofthe sinus pacemaker (Cramer, et al, 1978).
Interpretation of the Records
The records obtained through the sinus electrodehave some characteristics that are the same asthose recorded from the isolated rabbit and canineSN (Cramer et al, 1977, 1978). In these experi-ments, we observed a slow negative-going diastolicslope and a more rapid negative-going upstrokeslope, which we have shown to be due to phase 4and phase 0 depolarization of the automatic cells(Cramer et al., 1977,1978). The upstroke slope quiteoften merged with a slow positive-going deflection.We have termed the upstroke slope, with or withoutthe subsequent slow-positive-going deflection, thesinus potential. This is based on earlier studiesusing microelectrodes and tetrodotoxin to identifythe components of the sinus electrogram (Crameret al, 1977, 1978).
We have assumed, by our definitions, that elec-trical activity manifest in the unipolar electrogramsas the diastolic slope and the sinus potential re-sulted from changes in the transmembrane poten-tial of a number of closely coupled cells, an auto-matic group. This assumption seems justified interms of the geometry of the node and the simul-taneous changes in transmembrane potentials inmany adjacent cells in the rabbit SN (Noma andIrisawa, 1976).
Our records also show that the electrical activityrecorded through adjacent terminals is not neces-sarily synchronous. In Figures 4 and 5, it is clearthat even for adjacent terminals there are differ-ences in the unipolar electrograms. Although a di-astolic slope may be present in all records, the rateof change in potential need not be the same. Also,the upstroke slope usually appears earlier in onetrace than in others and may be completely absentin some. The differences in the slope of the diastolicdeflection might result from local differences in therate of phase 4 depolarization of the automatic cellsor from geometric factors. The asynchronous onsetof the upstroke slope, however, forces us to concludethat the automatic cell groups adjacent to differentrecording terminals attain threshold at differenttimes. This leads to the additional conclusion that,although cells in a single group are electrically well-
coupled, cells in different groups may not be.As a general rule, slow deflections (dV/dt < 20
mV/sec) recorded during the T-P or U-P segmentshould originate from the electrical activity of theSN, whereas rapid deflections coinciding with orwithin a few milliseconds after the beginning ofprimary negativity should originate from the elec-trical activity of the atrium. Figure 10 shows, indiagrammatic fashion, how we interpret the re-corded deflections. In this figure, we have shown across-section through the node and the atrium, fourterminals on the epicardial surface, the localchanges in transmembrane potential, the extracel-lular currents caused by local differences in trans-membrane potential, and also the extracellular po-tential differences caused by these currents. In thediagram, each nodal "cell" represents an automaticgroup. Early during the diastolic interval of theautomatic cells, there is a gradient of potentialbetween the automatic cells (-50 mV) and atrialcells (—90 mV) which causes current to flow extra-cellularly back toward and into the automatic cells.This current increases in magnitude as the potentialgradient increases during phase 4 depolarization ofthe automatic cells and causes the negative-goingdiastolic slope in the sinus electrograms. Thus, inFigure 10A, all four electrograms show a diastolicslope. In Figure 10B, the automatic group underterminal 1 begins to develop the upstroke of thetransmembrane action potential. This causes a gra-dient in intracellular potential between this and theadjacent groups, a more intense local current, andthe beginning of the upstroke slope in the electro-gram recorded through terminal 1. At this time, thenet extracellular current at any point depends onthe current still engendered by phase 4 depolariza-tion in groups which have not attained thresholdand the current caused by the coupling of adjacentgroups, some of which have initiated a regenerativeresponse and the others have not. This is repre-sented in Figure IOC. Here, extracellular currentflows from the group under terminal 2 to the groupunder terminal 1 and, as a result, the electrogramfrom site 2 shows the second type of slow positive-going deflection. Figure 10D shows the potentialsand currents at a slightly later time; both the neg-ative-going deflection from site 1 and the positive-going deflection from site 2 are larger. In Figure10E, repolarization of the group under terminal 1brings this group to a more negative intracellularpotential than the adjacent groups which have morepositive intracellular potentials as a result of theaction potential upstroke; this causes extracellularcurrent to flow away from the group under terminal
1 to the adjacent ones and results in the first typeof slow positive-going deflection in electrogramfrom site 1. At this time, the group under terminal2 has initiated a regenerative response which causesa decrease in the net extracellular current flowingaway from it. The decrease in the net current results
by guest on June 7, 2018http://circres.ahajournals.org/
Dow
nloaded from

786 CIRCULATION RESEARCH VOL. 47, No. 5, NOVEMBER 1980
EPICARDIUM
e
n rn n
ir
9 0 : -"0 4 0 -Iff - 5 / - I i7 - 4 0 4 0 - 4 0
I /~2
n n nn rn n m
FIGURE 10 A schematic drawing showing how the deflections in the unipolar records can be related to changes intransmembrane potentials of the automatic nodal and atrial cells. The squares indicate automatic groups within thesinus node and the shaded area of the atrium; the numbers in the squares and in the shaded area indicate the relativemagnitudes of the transmembrane potentials of the cells in the groups and the atrium. The + and — signs are estimatesof the positivity and negativity outside and inside the cells in the automatic groups and the atrium. Arrows in the cleararea indicate the direction of extracellular current flow; arrows in the shaded area, impulse propagation in the atrium.Stippled bars are recording electrode terminals 1 to 4. Deflections inside the squares represent transmembrane actionpotentials of automatic cells in each group; deflections above each stippled bar, the recorded extracellular potential.See text for details.
in reversal of the extracellular deflection recordedfrom site 2, from positive-going to negative-going.At this time, also, the group under terminal 3 has amore negative intracellular potential than the ad-jacent groups which have undergone partial or com-
plete regenerative excitation; this causes extracel-lular current to flow away from this group to theadjacent ones and results in the second type of slowpositive-going deflection recorded from site 3. Themaximum positive-going deflection recorded from
by guest on June 7, 2018http://circres.ahajournals.org/
Dow
nloaded from

SINUS ELECTROGRAMS IN CONSCIOUS DOGS/Hariman et al. 787
site 3 should be larger than the maximum positive-going deflection recorded from site 2 because, asmore groups have achieved threshold, a larger netcurrent flows extracellularly away from the groupat site 3 than from the group at site 2 (compareparts D and E of Fig. 10). In Figure 10F, the netextracellular current flows into the group underterminal 2 because this group is at the peak of thetransmembrane action potential and, therefore, hasa more positive intracellular potential than theadjacent groups which have partially repolarized orhave not reached the peak of the transmembraneaction potential; this causes a further slow negative-going deflection recorded from site 2. As the atriumis depolarized as a result of impulse propagationfrom sites 1, 2, and 3, primary negativity is recordedthrough the terminals at these sites. A rapid posi-tive-going deflection, indicating impulse propaga-tion through the atrium toward the recording site,is recorded through terminal 4, which is outside ofthe area of earliest activation.
According to the above analysis, one would ex-pect the peak of the extracellularly recorded sinuspotential to be reached within about 75 to 100 msecfrom the time of discharge of the automatic group;this is similar to the time interval from the time ofdischarge to the peak of transmembrane actionpotential of the canine sinus pacemaker cell (Woodset al., 1976; Cramer et al., 1978). In Figure 4, theinterval from the time of discharge to the peak ofsinus potential recorded from the automatic groupat site 7 varies from 75 to 150 msec, slightly longerthan expected. A possible explanation for this dis-crepancy is that each terminal of the sinus electroderecorded activity of a number of automatic cellsthat might be slightly asynchronous in attainingthreshold and thereby generate the peak of thetransmembrane action potential at slightly differenttimes. These cells whose activity is recordedthrough one terminal make up one "automaticgroup" as we have defined it.
The trace recorded from site 16 in Figure 9Aneeds some comment. The rapid positive-going de-flection clearly indicates impulse propagationthrough the atrium toward site 16. Atrial activationat site 16 therefore might result from an impulseoriginating from the adjacent automatic group (Fig.9B) or from an impulse originating from the auto-matic group at site 16 itself which propagated awayfrom this site through the SN and had an atrialbreakthrough slightly remote from this site (Fig.9C). The complex geometry of the SN and theneighboring atrium makes both explanations pos-sible.
The Sinus Pacemaker: Does it Consist of aSingle or Multiple Automatic Groups?
Our records suggest that somewhat asynchro-nous activity of automatic groups is recorded
through adjacent terminals of the sinus electrode.This is possible, because the intergroup electricalcoupling may not be strong. In isolated preparationof the rabbit SN, a space constant in the range ofabout 500 /un was estimated (Bonke, 1973; Nomaand Irisawa, 1976). A lower space constant wouldbe expected in conscious dogs as a result of thevagal activity (Hoffman, 1977).
The next question to be asked concerns how theatrium is activated by the asynchronous dischargeof groups within the SN in conscious dogs, i.e.,whether the atrium is activated by an impulse thatoriginates from one automatic group or by impulsesfrom more than one automatic group. Our epicar-dial mapping studies of atrial activation sequenceshowed that the earliest right atrial activation oc-curred simultaneously over a relatively broad areaof up to 8 mm2, enclosing the sites from which botha sinus potential and primary negativity were re-corded. From this area, activation spread to theneighboring atrial tissue. These mapping data donot answer the above question, because this earliestatrial activation still could result either from theimpulse initiated by one automatic group or theimpulses initiated by multiple groups. Figure 11depicts complexes 13 to 16 of Figure 4 with the twocorresponding diagrams showing the possible waysthe earliest atrial activation might have beenachieved. Diagram A shows that the earliest atrialactivation resulted from an impulse that originatedfrom one automatic group (possibly at site 7) andconducted with a sinoatrial interval varying be-tween 67 and 86 msec. Diagram B shows that theearliest atrial activation resulted from impulses thatoriginated from three automatic groups (at sites, 4,7, and 8), and conducted with different sinoatrialintervals. The latter diagram is consistent with theinterpretation of the fusion P wave in complex 4 ofFigure 6A. We cannot completely rule out, however,the possibility that for all complexes of Figure 4(except for complex 16) the earliest atrial activationresulted from an impulse which originated from anautomatic group at site 7, or, in other words, therewas a "dominant automatic group" located at site7. The automatic group at site 7 discharged earliestand had a sinus potential of a bigger amplitude thanthe automatic groups at sites 4 and 8. The ampli-tude of a sinus potential depends not only on thedistance from the automatic group to the recordingsite (the shorter the distance, the larger the re-corded amplitude) but also on the sinoatrial interval(Fig 2, A, B, and C); therefore, it is difficult todetermine the locations of automatic groups only interms of relative amplitudes of the recorded sinuspotentials. The early discharge of the automaticgroup at site 7 makes it likely that the impulse fromthis automatic group had an earlier atrial break-through than the impulses from the automaticgroups at sites 4 and 8, and therefore more chanceto activate the neighboring right atrium. This is
by guest on June 7, 2018http://circres.ahajournals.org/
Dow
nloaded from

788 CIRCULATION RESEARCH VOL. 47, No. 5, NOVEMBER 1980
supported further by the more consistent nature ofthe sinus potential recorded from site 7 comparedto the sinus potentials recorded from sites 4 and 8.In Figure 4, the trace from site 4, for example, showsthe absence of an upstroke slope in complexes 10,12, 13, 16, and 17, whereas the trace from site 7shows diastolic and upstroke slopes in all com-plexes. In Figure 5, recorded from the same dog asFigure 4 but on a different day, it is possible thatthe location of the dominant group changed fromsite 7 to site 8 and this was associated with a morerapid atrial rate.
The problem with the above concept, whichstates that the atrium is activated by only oneautomatic group, is that the sinus node is not elec-trically homogeneous; i.e., the space constant andconduction are not equal in all directions (Steinbecket al., 1978), and the distance between the auto-matic group and the atrium varies. This could in-validate the preceding analysis. Although the au-tomatic group at site 7 discharged earliest, its im-pulse might take a longer time to reach the atriumthan impulses originating from other automaticgroups.
A question that can be raised is how the auto-matic groups discharged somewhat asynchronously,but still within less than about 150 msec from eachother and, by so doing, might have activated theneighboring right atrium simultaneously. One pos-sible mechanism that might explain this phenome-non is the existence of electrotonic interaction be-tween automatic sinus cells described by Sano et al.(1978). It is possible that there is such an electro-tonic interaction between automatic groups at ad-jacent sites. Through this mechanism, the fasterautomatic cells could accelerate the slower onesand the slower automatic cells could decelerate thefaster ones. Still another possible mechanism is thepresence of interaction between the automaticgroups and the atrial tissue. Depolarization of theatrial mass would be expected to create a strongdepolarizing current that would tend to depolarizeall automatic groups within the SN. Such repeateddepolarization also might be expected to result inresetting and "entrainment" of the automatic cells.
Shifts in Sinus Pacemaker Location
In our dogs, we observed shifts in sinus pace-maker location (Table 1 and Figs. 4 and 6), andchanges in the sequence of discharge of the auto-matic groups (Fig. 5). Shifts of sinus pacemakerlocation due to an increase in vagal tone have beenknown to occur since 1914 (Meek and Eyster), andhave been restudied recently (Bouman et al., 1968;Bouman et al., 1978). In complex 16 of Figure 4, theshift in pacemaker location was associated withprolongation of the preceding atrial cycle and adecrease in the amplitude of the sinus potentialrecorded from site 7; those changes, which are
known effects of acetylcholine on nodal tissue(Hoffman, 1977), suggest that for this complex theshift in pacemaker location was due to an increasein vagal tone.
In Figure 6B, the shift in pacemaker location tosite 35 was associated with a faster heart rate. Thissuggests that a decrease in vagal tone and/or anincrease in sympathetic tone induced this shift insinus pacemaker location. In the rabbit heart, sym-pathetic stimulation has been shown to cause a shiftin sinus pacemaker location (Toda and Shimamoto,1968). The change in sequence of discharge of theautomatic groups in Figure 5, which was associatedwith a more rapid heart rate, similarly could beexplained by a decrease in vagal tone and/or anincrease in sympathetic tone. The change in auto-nomic tone might accelerate the automatic groupat site 8, which in turn would accelerate the auto-matic groups at sites 4 and 7 through the electro-tonic interaction described above (Sano et al., 1978).Why the automatic group at site 8 was more re-sponsive to the change in autonomic tone can beexplained by differences in sensitivity to acetylcho-line or catecholamines among the automatic cells(Toda and Shimamoto, 1968), or, more likely, by anuneven distribution of parasympathetic and sym-pathetic nerve endings in the node (Angelakos etal., 1963; Brooks and Lu, 1972).
The shifts in the location of sinus pacemakerwere associated with various degrees of change inP wave configuration. In Figure 6, the markedchange in P wave vector when the sinus pacemakershifted from site 2 to site 35 could be explained bythe associated change in the sequence of atrialactivation (Boineau et al., 1978; Waldo et al., 1970).In other dogs, a less marked change in P waveconfiguration could be due to a less dramatic shiftin sinus pacemaker location (for example, complex16 in Figs. 4 and 11).
"Sinus Arrhythmias" and the SinoatrialInterval
We have demonstrated that changes in the lo-cation of the possible pacemaking group were ac-companied by either a slower or a faster atrial rate.Two other factors which contribute to the sponta-neous changes in atrial cycle in "sinus arrhythmia"are: (1) changes in the cycle length of the sinuspacemaking group (s), and (2) beat-to-beat variationin the sinoatrial interval for each automatic group.
Throughout this paper, we have deliberatelyavoided the term "sinoatrial conduction time," be-cause we were not certain that each of the sinoatrialintervals measured from the asynchronous auto-matic groups truly represented the conduction timefor impulse propagation from a particular automaticgroup to the neighboring atrium. This uncertaintyhas the same basis as the uncertainty about whethera single pacemaking group or multiple pacemaking
by guest on June 7, 2018http://circres.ahajournals.org/
Dow
nloaded from

SINUS ELECTROGRAMS IN CONSCIOUS DOGS/Hariman et al. 789
HRAE
SNE 4
SNE 7
SNE 8
COMPLEX 13
SNE 4
SNE 7
SNE 8High RA
' SNE 4
SNE 7
SNE 8 '
High RA
14
1VX1
\
57B „
607-,1
*q4 -i
578 n
607
594 ,
fi?6
615I1 K55
I
626
1 615\| 655
\ \
»\
\ \
871 ?<^
\
871 ?̂ "
FIGURE 11 Diagrams of two possible pathsof atrial activation for complexes 13 to 16 inFigure 4. Abbreviations and calibrations areas in Figure 4. Diagram A shows that anautomatic group at site 7 is the single pace-making group which activates the neighbor-ing right atrium (RA); diagram B shows thatautomatic groups at sites 4, 7, and 8 contrib-ute to activation of the neighboring rightatrium. Note the sinus pacemaker shift incomplex 16. See text for further discussion.
groups are operative in the canine heart. Similaruncertainty might arise from an ECG record show-ing isorhythmic atrioventricular dissociation, inwhich a reasonable P-R interval may or may notrepresent atrioventricular conduction time.
In these conscious dogs, changes in the cyclelength of the sinus pacemaking groups and changesin the sinoatrial interval, as well as shifts in thelocation of the sinus pacemaking groups, could beexplained by variation in autonomic tone. In con-trast to the minimal beat-to-beat changes in the P-R interval, beat-to-beat changes in the sinoatrialinterval were marked (up to 100 msec); this can beexplained by the much more dense autonomic in-nervation in the area of the SN compared to thearea of the atrioventricular node (James, 1961; An-gelakos et al., 1963; James and Spence, 1966).
Conduction in and around the Sinus Node
As we discussed in relation to Figure 10, ourrecording technique made possible analysis of ap-proaching and passing wavefronts propagatingthrough the sinus nodal and atrial tissue. A slowpositive-going deflection interrupting a diastolicslope thus could be interpreted as slow conductionthrough the SN toward the recording site, whereasas rapid positive-going deflection preceding the ma-jor atrial deflections resulted from rapid conductionthrough the atrium toward the recording site.
It is possible, therefore, to differentiate automaticgroups within the SN that were activated by thespread of impulse from the adjacent automatic tis-
sue from groups that were activated by their owninherent automatic activity.
We observed three patterns of conduction aroundthe area from which a sinus potential and primarynegativity were recorded. The first pattern involvedconduction through the SN to sites around the areafrom which a sinus potential and primary negativitywere recorded, followed by local atrial activationand impulse propagation away from these sites.This type of conduction could be recognized by theslow positive-going or positive and then negative-going deflections recorded between the diastolicslope and primary negativity (Fig. 4, the trace fromsite 8, complexes 1 to 9, and Fig. 7, A and B).
The second pattern of conduction consisted of anearly atrial breakthrough from the automatic groupand atrial conduction to the adjacent sites. Thistype of conduction was marked by a diastolic slopewith or without an upstroke slope followed by arapid positive-going deflection (Fig. 9, A and B).
The third pattern of conduction was a combina-tion of the first two patterns. In Figure 4, the tracefrom site 8 showed this combination in complexes16 and 17; in these complexes, the diastolic slope isfollowed by a slow positive-going deflection and arapid positive-going deflection. Interestingly, thetrace from this site in Figure 4 shows the firstpattern of conduction in complexes 1 to 9, suggest-ing that the automatic group at site 8 was activatedby impulses spreading from the adjacent automaticgroups; however, this automatic group at site 8 wasactivated by its inherent automaticity for com-plexes 11, 13, 14, and 15. In complexes 10 and 12 of
by guest on June 7, 2018http://circres.ahajournals.org/
Dow
nloaded from

790 CIRCULATION RESEARCH VOL. 47, No. 5, NOVEMBER 1980
the trace from site 8, the automatic group at site 8might have been activated from the atrium or theadjacent automatic groups; the extracellular poten-tial changes resulting from activation of this auto-matic group in these two complexes might bemasked by the high amplitude extracellular poten-tial change resulting from the atrial activation. An-other possibility is that the slow positive-going de-flection resulting from impulse propagation towardrecording site 8 might cancel the slow negative-going deflection resulting from activation of theautomatic group at site 8; the result would be failureto record either a low negative-going upstroke slopeor a slow positive-going deflection of the secondtype.
In Figure 7B, if the sinus pacemaker impulseoriginated from site 7 and conducted to site 6 overthe interterminal distance of 1.5 mm with a con-duction time of about 90 msec (the interval betweenthe time of discharge of the pacemaker group atsite 7 and the beginning of the slow negative deflec-tion recorded from site 6), conduction velocitythrough the SN in a conscious dog would be about17 mm/sec. The conduction time calculated aboveslightly overestimates the true conduction time,because, as shown in Figure 10E (extracellular rec-ord through terminal 2), the beginning of the slownegative deflection recorded from site 6 correspondswith the time the intracellular potential reaches themidpoint of phase 0 and not the beginning of thetransition from phase 4 to phase 0. Since the inter-val from the beginning of the transition from phase4 to phase 0 to the midpoint of phase 0 is about 40msec (Woods et al., 1976; Cramer et al., 1978), thetrue conduction time would be in the range of 50msec and the true conduction velocity would beabout 30 mm/sec. This conduction velocity is inagreement with the values calculated for rabbitsinus preparation which ranged from 10 to 100 mm/sec (Paes de Carvalho et al., 1959; Steinbeck et al.,1978). One would expect a slower velocity in con-scious dogs, because of the dominance of vagalactivity in these animals (Hoffman, 1977). However,this was not the case; the slow rate of the sinuspacemaker in these animals might have counter-acted the slowing action of the vagus on conductionby allowing more complete recovery of excitabilityof the sinus nodal cells, a property similar to that ofthe atrioventricular node (Merideth et al., 1968).
Similar calculations using data obtained fromcomplexes 1 to 9 of traces from sites 7 and 8 inFigure 4 yield conduction velocities varying fromabout 10 to 30 mm/sec. Such differences in conduc-tion velocity, depending on the direction of theimpulse propagation, have been described in therabbit SN (Steinbeck et al., 1978). Also, beat-to-beat and day-to-day changes in vagal tone mightexplain the differences in the results obtained usingthe traces from sites 6 and 8.
In conclusion we have described a method of
recording electrical activity from the region of theSN in conscious dogs in which electrodes are im-planted. The records obtained allow beat-to-beatand day-to-day monitoring of (1) the time of dis-charge of the groups of automatic cells within theSN, (2) the changes in location of the pacemakinggroups, (3) the impulse propagation from the pace-making groups to the atrium through both nodaland atrial tissue, and (4) the changes in the sinoat-rial interval for each group. The method providesinformation not available through the use of othertechniques and thereby improves our understand-ing of the role of the SN in controlling the cardiacrhythm.
AcknowledgmentsThe authors would like to thank Dr. Antonio Paes de Car-
valho for his suggestions in the interpretation of the records, andBeverly Lewis and Anne Mazzella for expert help in preparingthe manuscript.
ReferencesAngelakos ET, Fuxe K, Torchiana ML (1963) Chemical and
histochemical evaluation of the distribution of catecholaminesin the rabbit and guinea pig hearts. Acta Physiol Scand 59:184-192
Battro A, Bidoggia H (1947) Endocardiac electrocardiogramobtained by heart catheterization in the man. Am Heart J 33:604-632
Boineau JP, Schuessler RB, Mooney CR, Wylds AC, Miller CB,Hudson RD, Borremans JM, Brockus CW (1978) Multicentricorigin of the atrial depolarization waves: The pacemaker com-plex. Relation to dynamics of atrial conduction, P-wavechanges and heart rate control. Circulation 58: 1036-1048
Bonke FIM (1973) Electrotonic spread in the sino atrial node ofthe rabbit heart. Pfluegers Arch 339: 17-23
Bouman LN, Gerlings ED, Biersteker PA, Bonke FIM (1968)Pacemaker shift in the sinoatrial node during vagal stimula-tion. Pfluegers Arch 302: 255-267
Bouman LN, Mackaay AJC, Bleeker WK, Becker AE (1978)Pacemaker shifts in the sinus node: Effects of vagal stimula-tion, temperature and reduction of extracellular calcium, InBonke The Sinus Node: Structure, Function and ClinicalRelevance, edited by FIM Bonke. The Hague, Boston, Lon-don, Martinus Nijhoff Medical Division, pp 245-257
Brooks CM, Lu HH (1972) The sino-atrial pacemaker of theheart. Charles C Thomas, Springfield, 111.
Cramer M, Siegal M, Bigger JT Jr, Hoffman BF (1977) Char-acteristics of extracellular potentials recorded from the sino-atrial pacemaker of the rabbit. Circ Res 41: 292-300
Cramer M, Hariman RJ, Boxer R, Hoffman BF (1978) Electro-grams from the canine sinoatrial pacemaker recorded in vitroand in situ. Am J Cardiol 42: 939-946
Erlanger J (1912-1913) The localization of impulse initiation andconduction in the heart. Harvey Lecture 44-85
Fenoy AC, Thebaut JF, Achard F, Delangenhagen B (1979)Identification du potentiel sinusal par electrocardiographieendocavitaire chez l'homme. Criteres d'identification, resultatspreliminaires. Arch Mai Coeur 72: 938-956
Hecht HH (1946) Potential variations of the. right auricular andventricular cavities in man. Am Heart J 32: 39-51
Hoffman BF (1977) Neural influences on cardiac electrical activ-ity and rhythm, in Randall WC (Ed): Neural Regulation ofthe Heart, Oxford University Press, pp 289-312
James TN (1961) Anatomy of the human sinus node. Anat Rec141: 109-139
James TN (1962a) Anatomy of the sinus node of the dog. AnatRec 143: 251-265
by guest on June 7, 2018http://circres.ahajournals.org/
Dow
nloaded from

SINUS ELECTROGRAMS IN CONSCIOUS DOGS/Hariman et al. 791
James TN (1962b) Pericarditis and the sinus node. Arch InternMed 110: 305-311
James TN, Spence CA (1966) Distribution of the cholinesterasewithin the sinus node and AV node of the human heart. AnatRec 15: 151-161
James TN, Sherf L, Fine G, Morales AR (1966) Comparativeultrastructure of the sinus node in man and dog. Circulation34: 139-163
Lewis T (1910) Galvanometric curves yielded by cardiac beatsgenerated in various areas of the auricular musculature. Thepacemaker of the heart. Heart 2: 23-46
Lewis T, Oppenheimer BS, Oppenheimer A (1910) The site oforigin of the mammalian heart-beat; the pacemaker in thedog. Heart 2: 147-169
Meek WJ, Eyster JAE (1914) Experiments on the origin andpropagation of the impulse in the heart. IV. The effect of vagalstimulation and cooling on the location of the pacemakerwithin the sino-auricular node. Am J Physiol 34: 368-383
Merideth J, Mendez C, Mueller C, Mueller WJ, Moe GK (1968)Electrical excitability of atrioventricular nodal cells. Circ Res23: 69-85
Noma A, Irisawa H (1976) Membrane currents in the rabbitsinoatrial node cell as studied by the double microelectrodemethod. Pfluegers Arch 364: 45-52
Paes de Carvalho A, De Mello WC, Hoffman BF (1959) Electro-physiological evidence for specialized fiber types in rabbitatrium. Am J Physiol 196: 483-488
Ramlau RA (1974) Electrograms of the sinu-atrial node in dogsfollowing surgical implantation of electrodes on the epicar-dium. J Electrocardiol 7: 137-148
Sano T, Yamagishi S (1965) Spread of excitation from the sinusnode. Circ Res 16: 423-430
Sano T, Sawanobori T, Adaniya H (1978) Mechanism of rhythmdetermination among pacemaker cells of the mammalian sinusnode. Am J Physiol 235: H379-384
Steinbeck G, Allessie MA, Bonke FIM, Lammers WJEP (1978)
Sinus node response to premature atrial stimulation in therabbit studied with multiple microelectrode impalements. CircRes 43: 695-704
Taylor JJ, D'Agrosa LS, Burn EM (1978) The pacemaker cell ofthe sinoatrial node of the rabbit. Am J Physiol 235: H407-412
Thery Cl, Lekieffre J, Lemaire P, Asseman Ph, Dupuis B,Warembourg H (1976) L'activite electrique de la region dunoeud sinusal. Etude experimentale. Arch Mai Coeur 69: 661-669
Toda N, Shimamoto K (1968) The influence of sympatheticstimulation on transmembrane potentials in the S-A node. JPharmacol Exp Ther 159: 298-305
Tranum-Jensen J (1978) The fine structure of the sinus node: Asurvey. In The Sinus Node: Structure, Function, and ClinicalRelevance, edited by FIM Bonke. The Hague, Boston, Lon-don, Martinus Nijhoff Medical Division, pp 149-165
Trautwein W, Uchizono K (1963) Electron microscopic andelectrophysiologic study of the pacemaker in the sinoatrialnode of the rabbit heart. Z Zellforsch 61: 96-109
van der Kooi MW, Durrer D, van Dam RTH, van der Tweel LH(1956) Electrical activity in sinus node and atrioventricularnode. Am Heart J 51: 684-700
Waldo AL, Vitikainen KJ, Kaiser GA, Malm JR, Hoffman BF(1970) The P wave and P-R interval. Effects of the site oforigin of atrial depolarization. Circulation 42: 653-671
Walmsley TA (1929) The Heart, part III, vol 4, Quain's Elementsof Anatomy, edited by TH Bryce, T Walmsley. London, Long-mans, Green & Co.
Warembourg H, Thery Cl, Lekieffre J, Ketelers JY (1973) Etudede l'activite electrique de la region du noeud sinusal chezl'homme. Lille Med 18: 845-852
West TC (1955) Ultramicroelectrode recording from the cardiacpacemaker. J Pharmacol Exp Ther 155: 283-290
Woods WT, Urthaler F, James TN (1976) Spontaneous actionpotentials of cells in the canine sinus node. Circ Res 39: 76-82
by guest on June 7, 2018http://circres.ahajournals.org/
Dow
nloaded from

R J Hariman, B F Hoffman and R E NaylorElectrical activity from the sinus node region in conscious dogs.
Print ISSN: 0009-7330. Online ISSN: 1524-4571 Copyright © 1980 American Heart Association, Inc. All rights reserved.is published by the American Heart Association, 7272 Greenville Avenue, Dallas, TX 75231Circulation Research
doi: 10.1161/01.RES.47.5.7751980;47:775-791Circ Res.
http://circres.ahajournals.org/content/47/5/775World Wide Web at:
The online version of this article, along with updated information and services, is located on the
http://circres.ahajournals.org//subscriptions/
is online at: Circulation Research Information about subscribing to Subscriptions:
http://www.lww.com/reprints Information about reprints can be found online at: Reprints:
document. Permissions and Rights Question and Answer about this process is available in the
located, click Request Permissions in the middle column of the Web page under Services. Further informationEditorial Office. Once the online version of the published article for which permission is being requested is
can be obtained via RightsLink, a service of the Copyright Clearance Center, not theCirculation Research Requests for permissions to reproduce figures, tables, or portions of articles originally published inPermissions:
by guest on June 7, 2018http://circres.ahajournals.org/
Dow
nloaded from