Electric Vehicle Cost-Benefit Analysis Electric Vehicle Cost-Benefit Analysis: ... Figure 12 NPV of...
29
Electric Vehicle Cost-Benefit Analysis Plug-in Electric Vehicle Cost-Benefit Analysis: Illinois September 2017
Transcript of Electric Vehicle Cost-Benefit Analysis Electric Vehicle Cost-Benefit Analysis: ... Figure 12 NPV of...

Electric Vehicle Cost-Benefit Analysis Plug-in Electric Vehicle Cost-Benefit Analysis: Illinois
September 2017
Contents
Executive Summary ...................................................................................................................................... ii
Background - Illinois .................................................................................................................................... 1
Study Results ................................................................................................................................................ 2
Plug-in Electric Vehicles, Electricity Use, and Charging Load ................................................................ 2
Vehicles and Miles Traveled ................................................................................................................ 2
PEV Charging Electricity Use ......................................................................................................... 3
PEV Charging Load ...................................................................................................................... 4
Utility Customer Benefits ......................................................................................................................... 7
Illinois Driver Benefits ........................................................................................................................... 11
Other Benefits ......................................................................................................................................... 12
Total Societal Benefits ............................................................................................................................ 15
Study Methodology ..................................................................................................................................... 18
References ................................................................................................................................................... 20
Acknowledgements ..................................................................................................................................... 22

Page | ii
List of Figures Figure 1 Comparison of PEV Penetration Scenarios ................................................................................................... ii
Figure 2 NPV Cumulative Societal Net Benefits from MI PEVs – Moderate PEV (MISO) scenario ........................iv
Figure 3 NPV Cumulative Societal Net Benefits from MI PEVs – High PEV (Bloomberg) scenario .........................iv
Figure 4 Projected Illinois Light Duty Fleet .................................................................................................................. 2
Figure 5 Projected Illinois Light Duty Fleet Vehicle Miles Traveled............................................................................ 3
Figure 6 Estimated Total Electricity Use in Illinois ...................................................................................................... 4
Figure 7 2040 Projected Illinois PEV Charging Load, Baseline Charging (High PEV (Bloomberg) scenario) ............ 5
Figure 8 2040 Projected Illinois PEV Charging Load, Off-peak Charging (High PEV (Bloomberg) scenario) ........... 5
Figure 9 PEV Charging Load in Dallas/Ft Worth and San Diego areas, EV Project ................................................... 6
Figure 10 NPV of Projected Utility Net Revenue from Baseline PEV Charging ......................................................... 7
Figure 11 NPV of Projected Utility Revenue and Costs from Off-peak PEV Charging ............................................... 8
Figure 12 NPV of Projected Life-time Utility New Revenue per PEV ......................................................................... 9
Figure 13 Potential Effect of PEV Charging Net Revenue on Utility Customer Bills (nominal $) ............................. 10
Figure 14 Cumulative Gasoline Savings from PEVs in Illinois .................................................................................. 12
Figure 15 Projected GHG Emissions from the Light Duty Fleet in Illinois ................................................................ 13
Figure 16 NPV of Projected Social Value of PEV GHG Reductions……………………………………………...…14
Figure 17 Projected NPV of Total Societal Benefits from Greater PEV use in MI – Baseline Charging ................... 15
Figure 18 Projected NPV of Total Societal Benefits from Greater PEV use in MI – Off-peak Charging ................... 16
List of Tables Table 1 Projected Incremental Afternoon Peak Hour PEV Charging Load (MW) ....................................................... 7
Table 2 Projected Fleet Average Vehicle Costs to Vehicle Owners (nominal $) ....................................................... 11

Page | i
About M.J. Bradley & Associates
M.J. Bradley & Associates, LLC (MJB&A), founded in 1994, is a strategic consulting firm focused on
energy and environmental issues. The firm includes a multi-disciplinary team of experts with
backgrounds in economics, law, engineering, and policy. The company works with private companies,
public agencies, and non-profit organizations to understand and evaluate environmental regulations and
policy, facilitate multi-stakeholder initiatives, shape business strategies, and deploy clean energy
technologies.
Our multi-national client base includes electric and natural gas utilities, major transportation fleet
operators, clean technology firms, environmental groups and government agencies.
We bring insights to executives, operating managers, and advocates. We help you find opportunity in
environmental markets, anticipate and respond smartly to changes in administrative law and policy at
federal and state levels. We emphasize both vision and implementation, and offer timely access to
information along with ideas for using it to the best advantage.
© M.J. Bradley & Associates 2017
For questions or comments, please contact:
Dana Lowell
Senior Vice President
M.J. Bradley & Associates, LLC
+1 978 369 5533

Page | ii
Executive Summary This study estimated the costs and benefits of increased penetration of plug-in electric vehicles (PEVs) in
the state of Illinois. The study estimated the benefits that would accrue to all electric utility customers in
Illinois due to greater utilization of the electric grid during off-peak hours, and increased utility revenues
from PEV charging. In addition, the study estimated the annual financial benefits to Illinois drivers from
owning PEVs—from fuel and maintenance cost savings compared to owning gasoline vehicles—and
societal benefits resulting from reduced gasoline consumption and associated greenhouse gas (GHG)
emissions.
Two different PEV penetration levels between 2030 and 2050 are utilized to estimate costs and benefits.1
The “Moderate PEV” scenario is based on levels of PEV penetration included in an on-going future
planning analysis being conducted by the Midcontinent Independent System Operator (MISO), which is
the regional transmission organization (RTO) that covers most of Illinois2. The “High PEV” scenario is
based on Bloomberg New Energy Finance’s (Bloomberg) July 2017 global outlook of PEV sales through
2040. See Figure 1 for a comparison of the two scenarios through 2050.
Under the Moderate PEV (MISO) scenario, the number of PEVs registered in Illinois would increase
from approximately 12,300 today to 726,273 in 2030, 1.4 million in 2040, and 2.1 million in 2050. This
equates to approximately 6 percent of in-use light duty vehicles in Illinois in 2030, 12 percent in 2040,
and 18 percent in 2050. Under the High PEV (Bloomberg) scenario there would be 1.2 million PEVs in
1 PEVs include battery-electric vehicles (BEV) and plug-in hybrid vehicles (PHEV). This study focused on
passenger vehicles and trucks; there are opportunities for electrification of non-road equipment and heavy-duty
trucks and buses, but evaluation of these applications was beyond the scope of this study. 2 Parts of northern Illinois, including the Chicago metro area, are included in the PJM Interconnection RTO region.
Figure 1 Comparison of PEV Penetration Scenarios
0%
10%
20%
30%
40%
50%
60%
2015 2030 2040 2050
PEV Penetration by Scenario
MISO (McKinsey) Bloomberg
Page | iii
Illinois by 2030, rising to 4.8 million in 2040, and 6.6 million in 2050. This equates to 11 percent of in-
use light duty vehicles in Illinois in 2030, rising to 42 percent in 2040 and 56 percent in 2050.
As shown in Figure 2, if Illinois PEV adoption follows the trajectory assumed by MISO, the net present
value of cumulative net benefits from greater PEV use in Illinois will exceed $12.2 billion state-wide
by 2050.3 Of these total net benefits:
• $0.6 billion will accrue to electric utility customers in the form of reduced electric bills,
• $10.3 billion will accrue directly to Illinois drivers in the form of reduced annual vehicle
operating costs, and
• $1.4 billion will accrue to society at large, as the monetized value of reduced GHG emissions.
As shown in Figure 3, if Bloomberg’s projections for national EV sales are achieved in Illinois, which
would result in even greater PEV penetration, the net present value of cumulative net benefits from
greater PEV use in Illinois could exceed $43 billion state-wide by 2050. Of these total net benefits:
• $1.8 billion will accrue to electric utility customers in the form of reduced electric bills,
• $35.2 billion will accrue directly to Illinois drivers in the form of reduced annual vehicle
operating costs, and
• $5.6 billion will accrue to society at large, as the monetized value of reduced GHG emissions.
A large portion of the direct financial benefits to Illinois drivers derives from reduced gasoline use—from
purchase of lower cost, regionally produced electricity instead of gasoline imported to the state. Under
the Moderate PEV (MISO) scenario, PEVs will reduce cumulative gasoline use in the state by more than
4.5 billion gallons through 2050, helping to promote energy security and independence, and keeping more
of vehicle owners’ money in the local economy, thus generating even greater economic impact. In
addition, this reduction in gasoline use will reduce cumulative net GHG emissions by 25 million metric
tons4, which would provide an additional societal benefit of $1.4 billion, from reduced pressure on
climate change.
With PEV penetration equivalent to the High PEV (Bloomberg) scenario, electrifying vehicles will reduce
cumulative gasoline use in the state by more than 17 billion gallons through 2050, and will reduce
cumulative net GHG emissions by more than 97 million metric tons, which would provide an additional
societal benefit of $5.6 billion.
In 2050, annual average gasoline savings will be approximately 153 gallons per PEV under the Moderate
PEV (MISO) scenario, while savings under the High PEV (Bloomberg) scenario are nearly 195 gallons
per PEV.
Compared to baseline emissions in 2050, PEVs are projected to reduce annual GHG emissions by up to
1.7 million tons under the Moderate PEV penetration scenario and as much as 7.7 million tons under the
High PEV (Bloomberg) scenario.
3 Using a 3% discount rate 4 Net of emissions from electricity generation

Page | iv
Figure 2 NPV Cumulative Societal Net Benefits from IL PEVs – Moderate PEV (MISO) scenario
$0
$5
$10
$15
$20
$25
$30
$35
$40
$45
2030 2035 2040 2045 2050
NPV Cumulative Net Benefits from Plug-in Vehicles in Illinois(MISO Scenario- Off-peak Charging)
$ billions
PEV Owner Savings
Utility Customer Benefits
Social Value of CO2 Reductions
Figure 3 NPV Cumulative Societal Net Benefits from IL PEVs – High PEV (Bloomberg) scenario
$0
$5
$10
$15
$20
$25
$30
$35
$40
$45
2030 2035 2040 2045 2050
NPV Cumulative Net Benefits from Plug-in Vehicles in Illinois(Bloomberg Scenario- Off-peak Charging)
$ billions
PEV Owner Savings
Utility Customer Benefits
Social Value of CO2 Reductions

Page | 1
Background - Illinois
Illinois’s state government and the Illinois Commerce Commission (ICC) have taken a number of steps over the
past decade to prepare for PEV adoption while reducing GHG emissions from the power sector. In 2007, the
Climate Change Advisory Group established by Governor Blagojevich set state-wide goals to reduce GHG
emissions to 1990 levels by 2020 and 60 percent below 1990 levels by 2050. [1] In 2011, Illinois passed the
Electric Vehicle Act, which found that electric vehicles provide health, economic, and environmental benefits to
the state and established the Electric Vehicle Advisory Council (EVAC). [2] That same year, the Commission
launched the Initiative on Plug-In Electric Vehicles, inviting utilities and other invested stakeholders to evaluate
emerging regulatory issues surrounding the growth of the electric vehicle market. EVAC submitted
recommendations to the ICC in this proceeding, concerning the adoption of time-varying rates for EV charging,
utility customer education and outreach, and legal considerations surrounding the use of charging stations. [3]
More recently, the Illinois General Assembly passed the Future Energy Jobs Act in December 2016, updating and
strengthening existing energy efficiency and renewable energy policies. In March 2017, the ICC initiated
“NextGrid,” an 18-month study designed to provide recommendations focused on new energy technologies,
regulatory strategies, and utility business models that can modernize and enhance the state’s grid. [4] Several
commenters recommended addressing regulatory topics surrounding EVs and related market acceleration
programs within the NextGrid study.
Despite forward progress, several partnerships and programs that have provided a foundation for reducing
greenhouse gas (GHG) emissions and supporting transportation electrification in Illinois are now defunct. The
Illinois Environmental Protection Agency offered rebates up to $4,000 for PEV customers, through its Illinois
Green Fleets program, which was suspended in 2015. [5] Ten million dollars in capital funding was also
appropriated to award EVSE and PEV manufacturing grants and loans, but the initiative was suspended in 2016.
[6]
In the last few years, utilities and coalitions have been the main drivers for PEV adoption. Two primary utilities in
Illinois—Commonwealth Edison (ComEd) and Ameren Illinois (Ameren)—are offering to their customers
$10,000 rebates on 2017 Nissan LEAF vehicles, through September 2017. [7] The Illinois Electric Cooperative
provides the only utility incentive program for PEV purchases, in which members who purchase a new PEV are
eligible for 0.5 percent loan financing for 60 months. [8] Organizations and city efforts have also played large
roles in encouraging PEV purchases and EVSE development. EVTown was created in Bloomington-Normal,
Illinois to provide incentives to local residents. Qualifying PEV purchases are eligible for a rebate of the 1
percent local share of the state sales tax, and electric permit fees are waived for EVSE that is installed in the town
of Normal. [9] Additionally, the Chicago Area Clean Cities Coalition worked with the City of Chicago to launch
“Clean Fuels Across Chicago,” which in part funds the development of EV charging infrastructure and PEV
deployment in ComEd’s vehicle fleet. [10] The City of Chicago has committed to adopting the guidelines of the
Paris Agreement despite the federal government’s withdrawal from the accord, and has expressed interest in
increasing the number of PEVs in the city’s fleet. [11] Coalitions such as ChargeUp Midwest and Midwest
EVOLVE are also working to expand and improve charging infrastructure by partnering with organizations and
utilities throughout the region.
There are currently 4.8 million cars and 5.4 million light trucks registered in Illinois, and these vehicles travel
107.2 billion miles per year. Both the number of vehicles and total annual vehicle miles are projected to increase
by 16 percent through 2050, to 11.9 million light duty vehicles traveling 124.2 billion miles annually. As of
January 2016, there were about 12,300 PEVs (including battery-electric and plug-in hybrid vehicles) registered in
Illinois and they comprised about 0.12 percent of the 10.2 million cars and light trucks registered in the State. In
2014 and 2015, sales of new PEVs in the state were less than one half of one percent of new vehicle sales. [12]
Despite this relatively low percentage, Illinois ranks in the top ten states for PEV sales.
Page | 2
Study Results This section summarizes the results of this study, including: the projected number of PEVs; electricity use and
load from PEV charging; projected gasoline savings and GHG reductions compared to continued use of gasoline
vehicles; financial benefits to utility customers from increased electricity sales; and projected financial benefits to
Illinois drivers compared to owning gasoline vehicles. All costs and financial benefits are presented as net
present value (NPV), using a 3 percent discount rate.
Plug-in Electric Vehicles, Electricity Use, and Charging Load
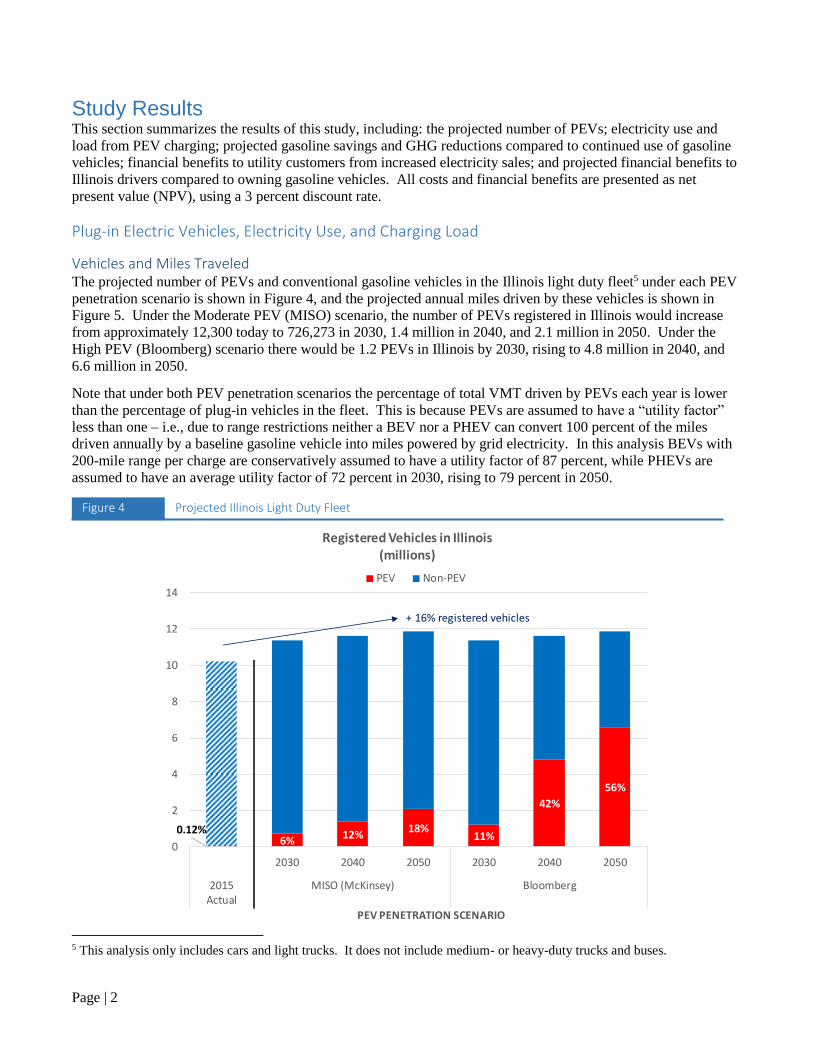
Vehicles and Miles Traveled The projected number of PEVs and conventional gasoline vehicles in the Illinois light duty fleet5 under each PEV
penetration scenario is shown in Figure 4, and the projected annual miles driven by these vehicles is shown in
Figure 5. Under the Moderate PEV (MISO) scenario, the number of PEVs registered in Illinois would increase
from approximately 12,300 today to 726,273 in 2030, 1.4 million in 2040, and 2.1 million in 2050. Under the
High PEV (Bloomberg) scenario there would be 1.2 PEVs in Illinois by 2030, rising to 4.8 million in 2040, and
6.6 million in 2050.
Note that under both PEV penetration scenarios the percentage of total VMT driven by PEVs each year is lower
than the percentage of plug-in vehicles in the fleet. This is because PEVs are assumed to have a “utility factor”
less than one – i.e., due to range restrictions neither a BEV nor a PHEV can convert 100 percent of the miles
driven annually by a baseline gasoline vehicle into miles powered by grid electricity. In this analysis BEVs with
200-mile range per charge are conservatively assumed to have a utility factor of 87 percent, while PHEVs are
assumed to have an average utility factor of 72 percent in 2030, rising to 79 percent in 2050.
5 This analysis only includes cars and light trucks. It does not include medium- or heavy-duty trucks and buses.
Figure 4 Projected Illinois Light Duty Fleet
0.12%6%
12%18%
11%
42%
56%
0
2
4
6
8
10
12
14
2030 2040 2050 2030 2040 2050
2015Actual
MISO (McKinsey) Bloomberg
PEV PENETRATION SCENARIO
Registered Vehicles in Illinois(millions)
PEV Non-PEV
+ 16% registered vehicles

Page | 3
This analysis estimates that under the High PEV (Bloomberg) scenario Illinois will reduce light-duty fleet
gasoline consumption in 2050 by 41 percent compared to a baseline with no PEVs, due to 41 percent of fleet
miles being driven by PEVs on electricity (Figure 5). However, in order to achieve this level of electric miles, 56
percent of light-duty vehicles will be PEVs (Figure 4).
PEV Charging Electricity Use The estimated total PEV charging electricity used in Illinois each year under the PEV penetration scenarios is
shown in Figure 6.
In Figure 6, projected baseline electricity use without PEVs is shown in blue and the estimated incremental
electricity use for PEV charging is shown in red. State-wide electricity use in Illinois is currently 128 million
MWh per year. Annual electricity use is projected to increase to 137 million MWh in 2030 and continue to grow
after that, reaching 152 million MWh in 2050 (19 percent greater than 2015 level).
Under the Moderate PEV penetration scenario, electricity used for PEV charging is projected to be 1.6 million
MWh in 2030 – an increase of 1.2 percent over baseline electricity use. By 2050, electricity for PEV charging is
projected to grow to 4.2 million MWh – an increase of 2.8 percent over baseline electricity use. Under the High
PEV (Bloomberg) scenario electricity used for PEV charging is projected to be 2.8 million MWh in 2030,
growing to 14.7 million MWh and adding 10 percent to baseline electricity use in 2050.
Figure 5 Projected Illinois Light Duty Fleet Vehicle Miles Traveled
4% 9% 13% 8%
30%41%
0
20,000
40,000
60,000
80,000
100,000
120,000
140,000
2030 2040 2050 2030 2040 2050
2015Actual
MISO (McKinsey) Bloomberg
PEV PENETRATION SCENARIO
Projected Light-Duty VMT - Illinois(million miles)
Gasoline Electric
+16% annual VMT

Page | 4
PEV Charging Load This analysis evaluated the effect of PEV charging on the Illinois electric grid under two different charging
scenarios. Under both scenarios 80 percent of all PEVs are assumed to charge exclusively at home and 20 percent
are assumed to charge both at home and at work. Under the baseline charging scenario all Illinois drivers are
assumed to plug-in their vehicles and start charging as soon as they arrive at home or at work (if applicable) each
day. Under the off-peak charging scenario 65 percent of Illinois drivers who arrive at home in the afternoon and
early evening are assumed to delay the start of home charging until after midnight – in response to a price signal
or incentive provided by their utility.6
See Figure 7 (baseline) and Figure 8 (off-peak) for a comparison of PEV charging load under the baseline and off-
peak charging scenarios, using the 2040 High PEV penetration scenario as an example. In each of these figures
the 2016 Illinois 95th percentile load (MW)7 by time of day is plotted in orange, and the projected incremental
load due to PEV charging is plotted in grey.
In 2016 daily electric load in Illinois was generally in the range of 18,100 – 19,200 MW from midnight to 5 AM,
ramping up through the morning and early afternoon to peak at approximately 25,000 MW between 3 PM and 5
PM, and then falling off through the late afternoon and evening hours.
6 Utilities have many policy options to incentivize off-peak PEV charging. This analysis does not compare the efficacy of
different options. 7 For each hour of the day actual load in 2016 was higher than the value shown on only 5 percent of days (18 days).
Figure 6 Estimated Total Electricity Use in Illinois
0
20
40
60
80
100
120
140
160
180
2030 2040 2050 2030 2040 2050
2015Actual
MISO (McKinsey) Bloomberg
PEV PENETRATION SCENARIO
Projected Total Electricity Use - Illinois(million MWh)
Baseline PEV Charging
+3%
+10%+19%

Page | 5
Figure 7 2040 Projected Illinois PEV Charging Load, Baseline Charging (High PEV (Bloomberg) scenario)
0
5,000
10,000
15,000
20,000
25,000
30,000
35,000
Time of Day
Illinois PEV Charging Load2040, Bloomberg Scenario, Baseline Charging
(MW)
2016 IL 95th Percentile Load
PEV Charging Load
Figure 8 2040 Projected Illinois PEV Charging Load, Off-peak Charging (High PEV (Bloomberg) scenario)
0
5,000
10,000
15,000
20,000
25,000
30,000
35,000
Time of Day
Illinois PEV Charging Load2040, Bloomberg Scenario, Off-peak Charging
(MW)
2016 IL 95th Percentile Load
PEV Charging Load
Page | 6
As shown in Figure 7, baseline PEV charging is projected to add load primarily between 8 AM and 11 PM, as
people charge at work early in the day and then at home later in the day. The PEV charging peak coincides with
the existing afternoon peak load period between 3 PM and 5 PM. As shown in Figure 8, off-peak charging
significantly reduces the incremental PEV charging load during the afternoon peak load period, but creates a
secondary peak in the early morning hours, between midnight and 3 AM. The shape of this early morning peak
can potentially be controlled based on the design of off-peak charging incentives. It should also be noted that
those early morning hours are often the hours of the day when wind generation peaks.
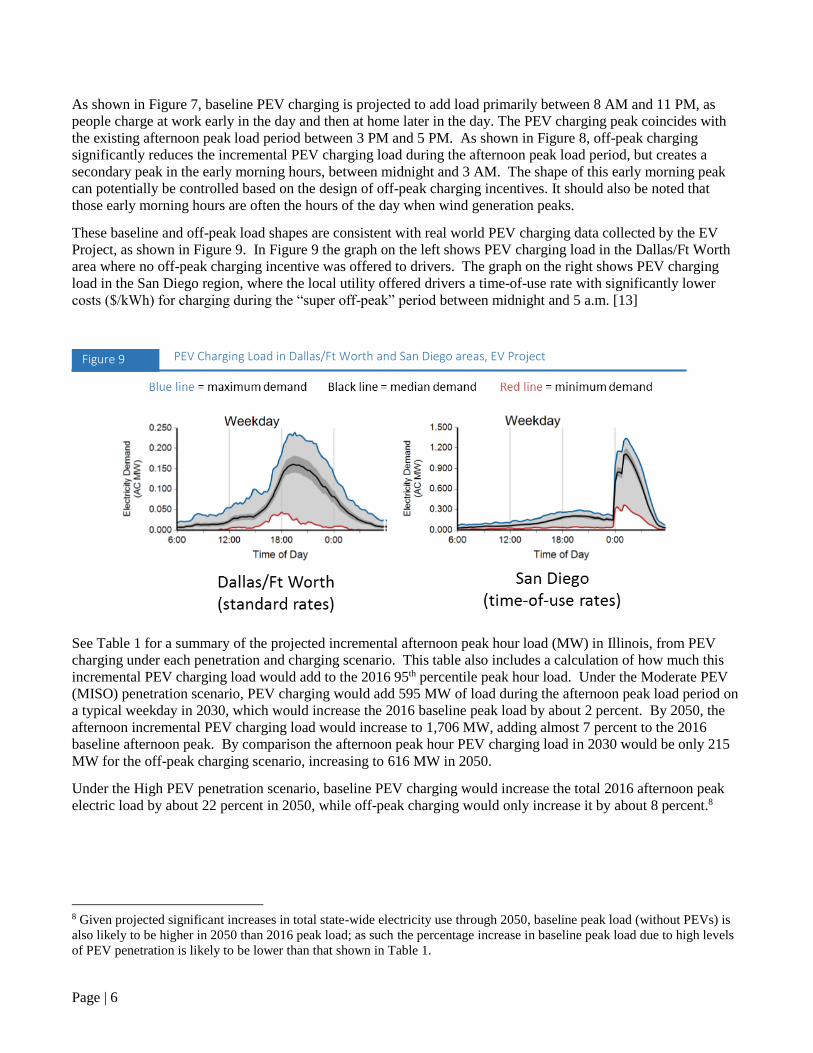
These baseline and off-peak load shapes are consistent with real world PEV charging data collected by the EV
Project, as shown in Figure 9. In Figure 9 the graph on the left shows PEV charging load in the Dallas/Ft Worth
area where no off-peak charging incentive was offered to drivers. The graph on the right shows PEV charging
load in the San Diego region, where the local utility offered drivers a time-of-use rate with significantly lower
costs ($/kWh) for charging during the “super off-peak” period between midnight and 5 a.m. [13]
See Table 1 for a summary of the projected incremental afternoon peak hour load (MW) in Illinois, from PEV
charging under each penetration and charging scenario. This table also includes a calculation of how much this
incremental PEV charging load would add to the 2016 95th percentile peak hour load. Under the Moderate PEV
(MISO) penetration scenario, PEV charging would add 595 MW of load during the afternoon peak load period on
a typical weekday in 2030, which would increase the 2016 baseline peak load by about 2 percent. By 2050, the
afternoon incremental PEV charging load would increase to 1,706 MW, adding almost 7 percent to the 2016
baseline afternoon peak. By comparison the afternoon peak hour PEV charging load in 2030 would be only 215
MW for the off-peak charging scenario, increasing to 616 MW in 2050.
Under the High PEV penetration scenario, baseline PEV charging would increase the total 2016 afternoon peak
electric load by about 22 percent in 2050, while off-peak charging would only increase it by about 8 percent.8
8 Given projected significant increases in total state-wide electricity use through 2050, baseline peak load (without PEVs) is
also likely to be higher in 2050 than 2016 peak load; as such the percentage increase in baseline peak load due to high levels
of PEV penetration is likely to be lower than that shown in Table 1.
Figure 9 PEV Charging Load in Dallas/Ft Worth and San Diego areas, EV Project

Page | 7
Moderate PEV (MISO) High PEV (Bloomberg)
2030 2040 2050 2030 2040 2050
Baseline
Charging
PEV Charging (MW) 594.9 1,139.2 1,706.2 1,004.6 3,945.0 5,408.3
Increase relative to
2016 Peak 2.4% 4.6% 6.8% 4.0% 15.8% 21.7%
Off-Peak
Charging
PEV Charging (MW) 214.9 411.6 616.4 363.0 1,425.3 1,953.9
Increase relative to
2016 Peak 0.9% 1.6% 2.5% 1.5% 5.7% 7.8%
As discussed below, increased peak hour load increases a utility’s cost of providing electricity, and may result in
the need to upgrade distribution infrastructure. As such, off-peak PEV charging can provide net benefits to all
utility customers by bringing in significant new revenue in excess of associated costs.
Utility Customer Benefits
The estimated NPV of revenues and costs for Illinois’s electric utilities to supply electricity to charge PEVs under
each penetration scenario are shown in Figure 10, assuming the baseline PEV charging scenario.
Under the Moderate PEV penetration scenario, the NPV of revenue from electricity sold for PEV charging in
Illinois is projected to total $191 million in 2030, rising to $393 million in 2050. Under the High PEV
(Bloomberg) scenario, the NPV of utility revenue from PEV charging is projected to total $327 million in 2030,
rising to $1.4 billion in 2050.
In Figure 10, projected utility revenue is shown in dark blue. The different elements of incremental cost that
utilities would incur to purchase and deliver additional electricity to support PEV charging are shown in red
(generation), yellow (transmission), orange (peak capacity), and purple (infrastructure upgrade cost). Generation,
transmission, and peak capacity costs generally represent payments made by distribution utilities to other
companies to purchase and transmit power in the competitive wholesale electricity market. Generation and
transmission costs are proportional to the total power (MWh) used for PEV charging, while peak capacity costs
are proportional to the incremental peak load (MW) imposed by PEV charging. Infrastructure upgrade costs are
costs incurred by the utility to upgrade their own distribution infrastructure to handle the increased peak load
imposed by PEV charging.
Table 1 Projected Incremental Afternoon Peak Hour PEV Charging Load (MW)

Page | 8
The striped light blue bars in Figure 10 represent the NPV of projected “net revenue” (revenue minus costs) that
utilities would realize from selling additional electricity for PEV charging under each PEV penetration scenario.
Under the Moderate PEV penetration scenario, the NPV of net revenue in Illinois is projected to total $7 million
in 2030 and $1 million in 2050. Under the High PEV (Bloomberg) scenario, the NPV of utility net revenue from
PEV charging is projected to total $13 million in 2030, rising to $25 million in 20509. The NPV of projected
annual utility net revenue averages $9 per PEV in 2030, and $2 - $4 per PEV in 2050.
9 Under both penetration scenarios utility net revenue is negative in 2040, if all PEV owners start to charge as soon as they
arrive home each day – i.e. the incremental cost of serving the PEV load, especially the increased peak capacity costs, are
higher than projected revenue from increased energy sales. This is a temporary condition; by 2050 utility net revenue is again
positive even under the baseline charging scenario.
Figure 10 NPV of Projected Utility Revenue and Costs from Baseline PEV Charging
$7
-$25$1 $13
-$78
$25
$0
$500
$1,000
$1,500
$2,000
2030 2040 2050 2030 2040 2050
MISO (McKinsey) Bloomberg
PEV Penetration Scenario
Illinois: NPV Utility Costs & Net Revenue from PEV ChargingBaseline Charging
($ millions)
Generation Cost Transmission Cost Peak Capacity Cost
Infrastructure Cost Net Revenue Revenue

Page | 9
Figure 11 summarizes the NPV of projected utility revenue, costs, and net revenue for off-peak charging under
each PEV penetration scenario. Compared to baseline charging (Figure 10) projected revenue, and projected
generation and transmission costs are the same, but projected peak capacity and infrastructure costs are lower due
to a smaller incremental peak load (see Table 1). Compared to baseline charging, off-peak charging will increase
the NPV of annual utility net revenue by $23 million in 2030 and $46 million in 2050 under the Moderate PEV
penetration scenario, due to lower costs. Under the High PEV (Bloomberg) scenario, off-peak charging will
increase the NPV of annual utility net revenue by $39 million in 2030 and $147 million in 205010. This analysis
estimates that compared to baseline charging, off-peak charging will increase the NPV of annual utility net
revenue by $32 per PEV in 2030 and $22 per PEV in 2050.
10 Under the off-peak charging scenario utility net revenue is positive in all years, including in 2040.
Figure 11 NPV of Projected Utility Revenue and Costs from Off-peak PEV Charging
$30$12
$47$52
$51
$172
$0
$500
$1,000
$1,500
$2,000
2030 2040 2050 2030 2040 2050
MISO (McKinsey) Bloomberg
PEV Penetration Scenario
Illinois: NPV Utility Costs & Net Revenue from PEV ChargingOff-peak Charging
($ millions)
Generation Cost Transmission Cost Peak Capacity Cost
Infrastructure Cost Net Revenue Revenue
Page | 10
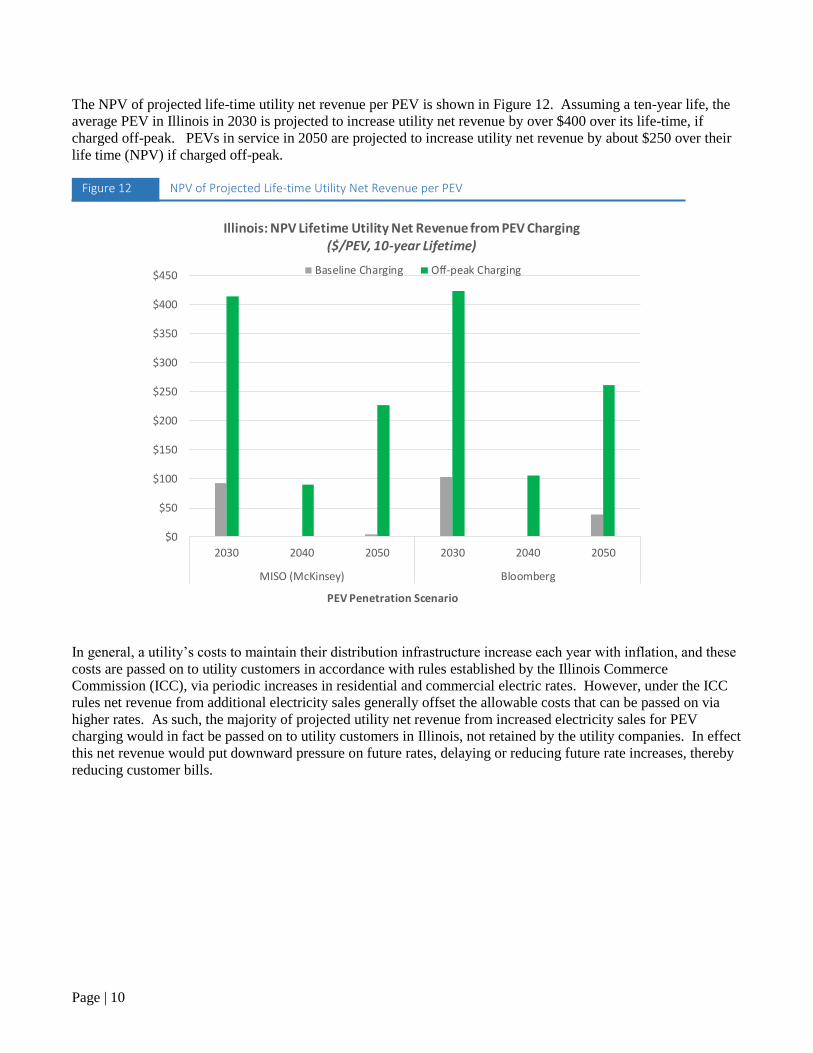
The NPV of projected life-time utility net revenue per PEV is shown in Figure 12. Assuming a ten-year life, the
average PEV in Illinois in 2030 is projected to increase utility net revenue by over $400 over its life-time, if
charged off-peak. PEVs in service in 2050 are projected to increase utility net revenue by about $250 over their
life time (NPV) if charged off-peak.
In general, a utility’s costs to maintain their distribution infrastructure increase each year with inflation, and these
costs are passed on to utility customers in accordance with rules established by the Illinois Commerce
Commission (ICC), via periodic increases in residential and commercial electric rates. However, under the ICC
rules net revenue from additional electricity sales generally offset the allowable costs that can be passed on via
higher rates. As such, the majority of projected utility net revenue from increased electricity sales for PEV
charging would in fact be passed on to utility customers in Illinois, not retained by the utility companies. In effect
this net revenue would put downward pressure on future rates, delaying or reducing future rate increases, thereby
reducing customer bills.
Figure 12 NPV of Projected Life-time Utility Net Revenue per PEV
$0
$50
$100
$150
$200
$250
$300
$350
$400
$450
2030 2040 2050 2030 2040 2050
MISO (McKinsey) Bloomberg
PEV Penetration Scenario
Illinois: NPV Lifetime Utility Net Revenue from PEV Charging($/PEV, 10-year Lifetime)
Baseline Charging Off-peak Charging
Page | 11
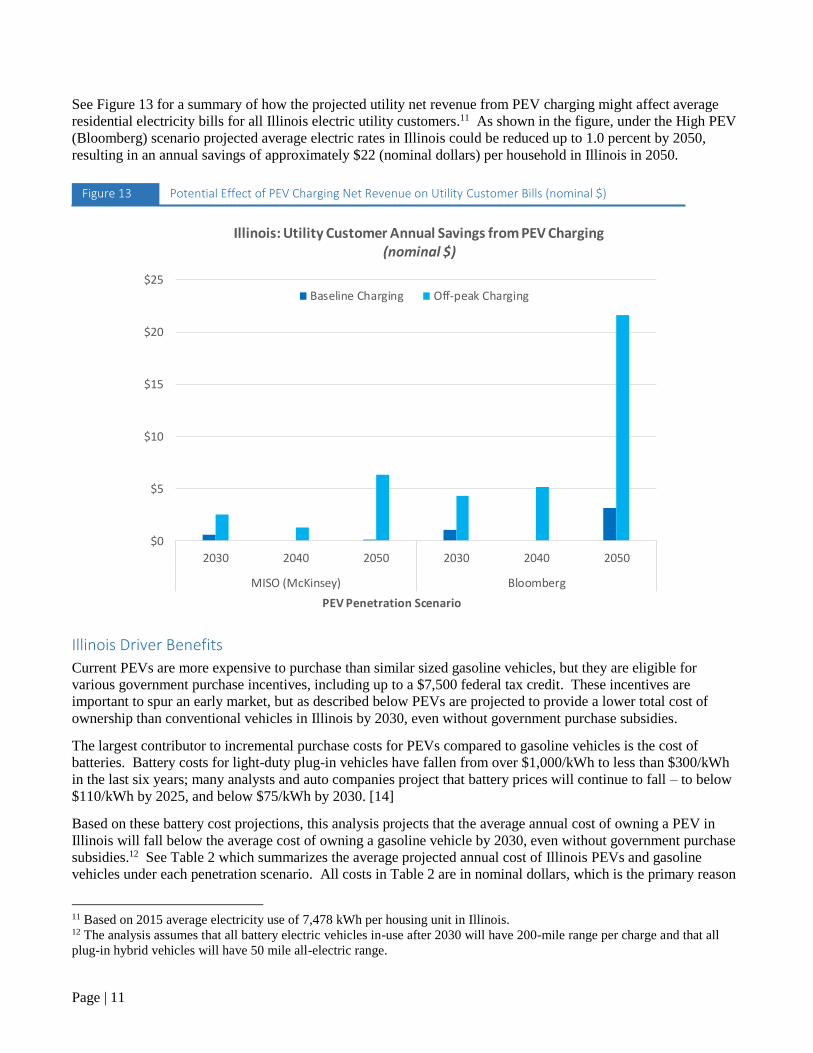
See Figure 13 for a summary of how the projected utility net revenue from PEV charging might affect average
residential electricity bills for all Illinois electric utility customers.11 As shown in the figure, under the High PEV
(Bloomberg) scenario projected average electric rates in Illinois could be reduced up to 1.0 percent by 2050,
resulting in an annual savings of approximately $22 (nominal dollars) per household in Illinois in 2050.
Illinois Driver Benefits
Current PEVs are more expensive to purchase than similar sized gasoline vehicles, but they are eligible for
various government purchase incentives, including up to a $7,500 federal tax credit. These incentives are
important to spur an early market, but as described below PEVs are projected to provide a lower total cost of
ownership than conventional vehicles in Illinois by 2030, even without government purchase subsidies.
The largest contributor to incremental purchase costs for PEVs compared to gasoline vehicles is the cost of
batteries. Battery costs for light-duty plug-in vehicles have fallen from over $1,000/kWh to less than $300/kWh
in the last six years; many analysts and auto companies project that battery prices will continue to fall – to below
$110/kWh by 2025, and below $75/kWh by 2030. [14]
Based on these battery cost projections, this analysis projects that the average annual cost of owning a PEV in
Illinois will fall below the average cost of owning a gasoline vehicle by 2030, even without government purchase
subsidies.12 See Table 2 which summarizes the average projected annual cost of Illinois PEVs and gasoline
vehicles under each penetration scenario. All costs in Table 2 are in nominal dollars, which is the primary reason
11 Based on 2015 average electricity use of 7,478 kWh per housing unit in Illinois. 12 The analysis assumes that all battery electric vehicles in-use after 2030 will have 200-mile range per charge and that all
plug-in hybrid vehicles will have 50 mile all-electric range.
Figure 13 Potential Effect of PEV Charging Net Revenue on Utility Customer Bills (nominal $)
$0
$5
$10
$15
$20
$25
2030 2040 2050 2030 2040 2050
MISO (McKinsey) Bloomberg
PEV Penetration Scenario
Illinois: Utility Customer Annual Savings from PEV Charging(nominal $)
Baseline Charging Off-peak Charging

Page | 12
why costs for both gasoline vehicles and PEVs are higher in 2040 and 2050 than in 2030 (due to inflation). In
addition, the penetration scenarios assume that the relative number of PEV cars and higher cost PEV light trucks
will change over time; in particular the High PEV (Bloomberg) scenario assumes that there will be a significantly
higher percentage of PEV light trucks in the fleet in 2050 than in 2030, which further increases the average PEV
purchase cost in 2050 compared to 2030.
As shown in Table 2, even in 2050 average PEV purchase costs are projected to be higher than average purchase
costs for gasoline vehicles (with no government subsidies), but the annualized effect of this incremental purchase
cost is outweighed by significant fuel cost savings, as well as savings in scheduled maintenance costs. In 2030,
the average Illinois driver is projected to save $308 – $323 per year compared to the average gasoline vehicle
owner, without government subsidies. These annual PEV savings are projected to increase to an average of $652
- $796 per PEV in 2040, and $1,093 - $1,161 per PEV in 2050, as relative PEV purchase costs continue to fall,
and the projected price of gasoline continues to increase faster than projected electricity prices. The NPV of
annual savings for the average PEV owner in Illinois is projected to be $203 in 2030, rising to $400 in 2050.
The NPV of total annual cost savings to Illinois drivers from greater PEV ownership are projected to be $144
million in 2030 under the Moderate PEV penetration scenario, rising to $433 million in 2040 and $859 million in
2050. Under the High PEV (Bloomberg) scenario, the NPV of total annual cost savings to Illinois drivers from
greater PEV ownership are projected to be $255 million in 2030, rising to $1.8 billion in 2040 and $2.6 billion in
2050.
Other Benefits
Along with the financial benefits to electric utility customers and PEV owners described above, light-duty vehicle
electrification can provide additional societal benefits, including significant reductions in gasoline fuel use, and
significant reductions in GHG emissions.
Table 2 Projected Fleet Average Vehicle Costs to Vehicle Owners (nominal $)
GASOLINE VEHICLE
2030 2040 2050 2030 2040 2050
Vehicle Purchase $/yr $4,387 $5,607 $7,137 $4,507 $6,352 $8,217
Gasoline $/yr $1,104 $1,435 $1,849 $1,123 $1,574 $2,077
Maintenance $/yr $233 $292 $358 $235 $301 $371
$/yr $5,724 $7,334 $9,343 $5,865 $8,228 $10,665
PEV
2030 2040 2050 2030 2040 2050
Vehicle Purchase $/yr $4,574 $5,688 $7,010 $4,688 $6,382 $8,308
Electricity $/yr $456 $519 $590 $464 $554 $648
Gasoline $/yr $183 $215 $266 $186 $234 $296
Personal Charger $/yr $81 $101 $122 $81 $101 $122
Maintenance $/yr $122 $158 $195 $122 $161 $199
$/yr $5,416 $6,682 $8,183 $5,541 $7,432 $9,573
Savings per PEV $/yr $308 $652 $1,161 $323 $796 $1,093
TOTAL ANNUAL COST
MISO (McKinsey) Bloomberg
MISO (McKinsey) Bloomberg
TOTAL ANNUAL COST

Page | 13
The estimated cumulative fuel savings (barrels of gasoline13) from PEV use in Illinois under each penetration
scenario are shown in Figure 14. Annual fuel savings under the Moderate PEV penetration scenario are projected
to total 3.1 million barrels in 2030, with cumulative savings of more than 111 million barrels by 2050. For the
High PEV (Bloomberg) scenario, annual fuel savings in 2030 are projected to be 5.4 million barrels, and by 2050
cumulative savings will exceed 404 million barrels. These fuel savings can help put the U.S. on a path toward
energy independence, by reducing the need for imported petroleum. In addition, a number of studies have
demonstrated that EVs can generate significantly greater local economic impact than gasoline vehicles - including
generating additional local jobs - by keeping more of vehicle owners’ money in the local economy rather than
sending it out of state by purchasing gasoline. [15]
The projected annual greenhouse gas (GHG) emissions (million metric tons carbon-dioxide equivalent, CO2-e
million tons) from the Illinois light duty fleet under each PEV penetration scenario are shown in Figure 15. In
this figure, projected baseline emissions from a gasoline fleet with few PEVs are shown in red for each year, and
projected emissions under the PEV scenarios are shown in blue. The values shown represent “wells-to-wheels”
emissions, including direct tailpipe emissions and “upstream” emissions from production and transport of
gasoline. Estimated emission for the PEV scenarios includes GHG emissions from generating electricity to
charge PEVs, as well as GHG emissions from gasoline vehicles in the fleet. Estimated emissions from PEV
13 One barrel of gasoline equals 42 US gallons
Figure 14 Cumulative Gasoline Savings from PEVs in Illinois
0
50
100
150
200
250
300
350
400
450
2030 2040 2050 2030 2040 2050
MISO (McKinsey) Bloomberg
PEV Penetration Scenario
Illinois: Cumulative Gasoline Savings from PEVs(Million Barrels)

Page | 14
charging are based on EIA projections of average carbon intensity for the – SERC Reliability Corporation /
Gateway (SRGW) electricity market module region, which includes Illinois.
As shown in Figure 15, GHG emissions from the light duty fleet in Illinois were approximately 53 million tons in
2015. Absent significant PEV penetration, baseline annual fleet emissions are projected to fall to 32.0 million
tons by 2050, a reduction of 53 percent from current levels. This projected reduction is based on turnover of the
existing vehicle fleet to more efficient vehicles that meet more stringent fuel economy and GHG standards.
Compared to baseline emissions in 2050, GHG emissions are projected to be reduced by up to 1.7 million tons
under the Moderate PEV penetration scenario and as much as 7.7 million tons under the High PEV (Bloomberg)
scenario. Through 2050, cumulative net GHG emissions are projected to be reduced by 25 million tons under the
Moderate PEV penetration scenario and 97 million metric tons under the High PEV (Bloomberg) scenario.
Figure 16 summarizes the estimated NPV of the monetized “social value” of GHG reductions that will result from
greater PEV use in Illinois. The social value of GHG reductions represents potential societal cost savings from
avoiding the negative effects of climate change, if GHG emissions are reduced enough to keep long term warming
below two degrees Celsius from pre-industrial levels. The values summarized in Figure 16 were developed using
the Social Cost of CO2 ($/MT) as calculated by the U.S. government’s Interagency Working Group on Social
Cost of Greenhouse Gases. [16]
Figure 15 Projected GHG Emissions from the Light Duty Fleet in Illinois
0
10
20
30
40
50
60
Actual 2030 2040 2050 2030 2040 2050
2015 MISO (McKinsey) Bloomberg
PEV Penetration Scenarios
Annual Illinois LDV GHG Emissions (CO2-e million MT)
Baseline - no PEVs PEVs w/ SRGW Electricity
-53%
-64%

Page | 15
The NPV of the monetized social value of GHG reductions resulting from greater PEV use is projected to total
$34 million per year in 2030 under the Moderate PEV penetration scenario, rising to as much as $100 million per
year in 2050. Under the High PEV (Bloomberg) scenario the NPV of the monetized social value of GHG
reductions from greater PEV is projected to be $60 million per year in 2030, rising to as much as $441 million per
year in 2050.
The NPV of the projected monetized social value of annual GHG reductions averages $48 per PEV in 2030, and
$48 - $67 per PEV in 2050.
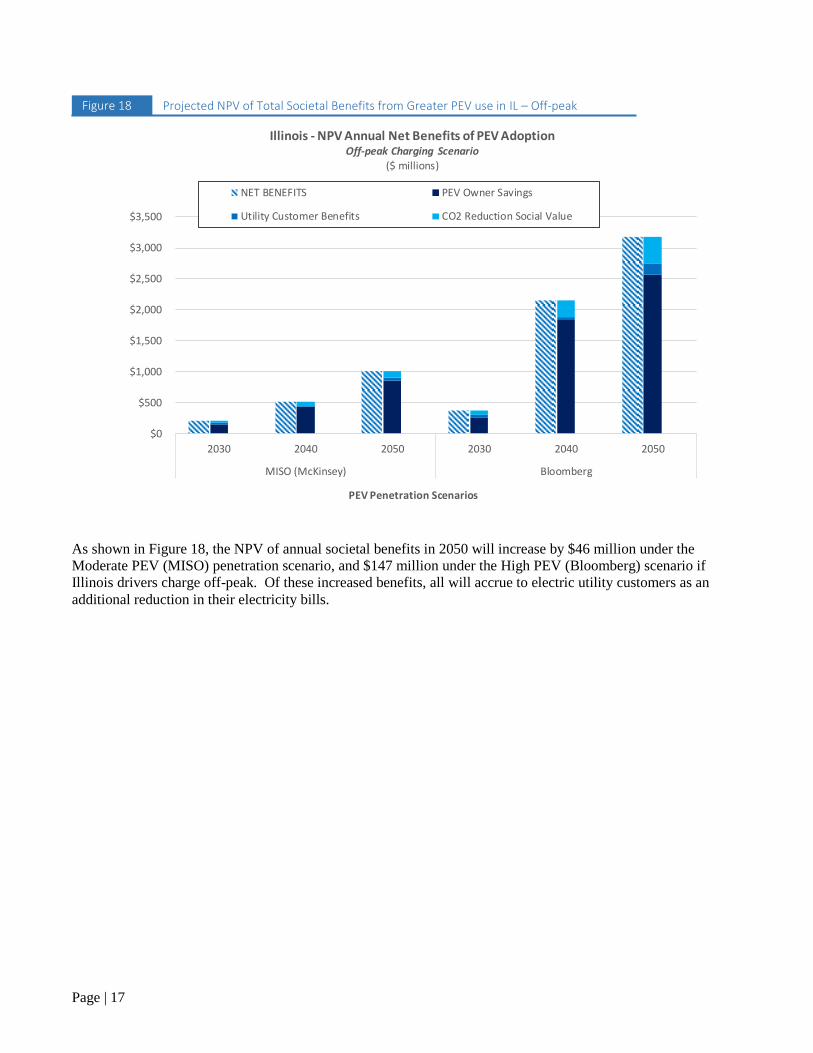
Total Societal Benefits
The NPV of total estimated societal benefits from increased PEV use in Illinois under each PEV penetration
scenario are summarized in Figures 17 and 18. These benefits include cost savings to Illinois drivers, utility
customer savings from reduced electric bills, and the monetized benefit of reduced GHG emissions. Figure 17
shows the NPV of projected societal benefits if Illinois drivers charge in accordance with the baseline charging
scenario. Figure 17 shows the NPV of projected societal benefits if Illinois drivers charge off-peak. Both figures
assume that GHG emissions from electricity production follow EIA’s current projections for future carbon
intensity of the regional electric grid.
Figure 16 NPV of Projected Social Value of PEV GHG Reductions
$0
$50
$100
$150
$200
$250
$300
$350
$400
$450
$500
2030 2040 2050 2030 2040 2050
MISO (McKinsey) Bloomberg
PEV Penetration Scenarios
Illinois NPV of Annual Social Value of PEV CO2 Reductions ($ millions)

Page | 16
As shown in Figure 17, the NPV of annual societal benefits are projected to be a minimum of $959 million per
year in 2050 under the Moderate PEV penetration scenario and $3.0 billion per year in 2050 under the High PEV
(Bloomberg) scenario. Approximately 90 percent of these annual benefits will accrue to Illinois drivers as a cash
savings in vehicle operating costs, 0.1 percent will accrue to electric utility customers as a reduction in annual
electricity bills, and 10 percent will accrue to society at large in the form of climate change mitigation due to
reduced GHG emissions.
Figure 17 Projected NPV of Total Societal Benefits from Greater PEV use in IL – Baseline Charging
$0
$500
$1,000
$1,500
$2,000
$2,500
$3,000
$3,500
2030 2040 2050 2030 2040 2050
MISO (McKinsey) Bloomberg
PEV Penetration Scenarios
Illinois - NPV Annual Net Benefits of PEV AdoptionBaseline Charging Scenario
($ millions)
NET BENEFITS PEV Owner Savings
Utility Customer Benefits CO2 Reduction Social Value
Page | 17
As shown in Figure 18, the NPV of annual societal benefits in 2050 will increase by $46 million under the
Moderate PEV (MISO) penetration scenario, and $147 million under the High PEV (Bloomberg) scenario if
Illinois drivers charge off-peak. Of these increased benefits, all will accrue to electric utility customers as an
additional reduction in their electricity bills.
Figure 18 Projected NPV of Total Societal Benefits from Greater PEV use in IL – Off-peak Charging
$0
$500
$1,000
$1,500
$2,000
$2,500
$3,000
$3,500
2030 2040 2050 2030 2040 2050
MISO (McKinsey) Bloomberg
PEV Penetration Scenarios
Illinois - NPV Annual Net Benefits of PEV AdoptionOff-peak Charging Scenario
($ millions)
NET BENEFITS PEV Owner Savings
Utility Customer Benefits CO2 Reduction Social Value

Page | 18
Study Methodology This section briefly describes the methodology used for this study. For more information on how this study was
conducted, including a complete discussion of the assumptions used and their sources, see the report: Mid-
Atlantic and Northeast Plug-in Electric Vehicle Cost-Benefit Analysis, Methodology & Assumptions (October
2016).14 This report can be found at:
http://mjbradley.com/sites/default/files/NE_PEV_CB_Analysis_Methodology.pdf
This study evaluated the costs and benefits of two distinct levels of PEV penetration in Illinois between 2030 and
2050, based on the range of publicly available PEV adoption estimates from various analysts.
Moderate PEV Scenario – MISO (McKinsey): Penetration of PEVs modeled by MISO Energy – the
regional transmission organization that covers most of Illinois - during on-going MISO Transmission
Expansion Planning (MTEP) efforts; this PEV penetration scenario was produced for MISO by McKinsey &
Company. [17] Under this scenario approximately 6 percent of in-use light duty vehicles in Illinois will be
PEV in 2030, rising to 12 percent in 2040, and 17.6 percent in 2050.
High PEV Scenario - Bloomberg: The estimated level of PEV penetration each year, based on Bloomberg
New Energy Finance’s (Bloomberg) July 2017 global outlook on annual PEV sales through 2040,
conservatively extended through 2050. [18] For this scenario the estimate of total in-use PEVs each year is
based on cumulative PEV sales over the preceding thirteen years (average in-service life for light duty
vehicles), and assuming that PEV sales in Illinois will be proportional to total vehicle sales. Under this
scenario 10.8 percent of in-use vehicles will be PEV in 2030, rising to 41.5 percent in 2040 and 55.7 percent
in 2050.
Both of these scenarios are compared to a baseline scenario with very little PEV penetration, and continued use of
gasoline vehicles. The baseline scenario is based on future annual vehicle miles traveled (VMT) and fleet
characteristics (e.g., cars versus light trucks) as projected by the Illinois Department of Transportation.
Based on assumed future PEV characteristics and usage, the analysis projects annual electricity use for PEV
charging at each level of penetration, as well as the average load from PEV charging by time of day. The analysis
then projects the total revenue that Illinois’s electric distribution utilities would realize from sale of this
electricity, their costs of providing the electricity to their customers, and the potential net revenue (revenue in
excess of costs) that could be used to support maintenance of the distribution system.
The costs of serving PEV load include the cost of electricity generation, the cost of transmission, incremental
peak generation capacity costs for the additional peak load resulting from PEV charging, and annual infrastructure
upgrade costs for increasing the capacity of the secondary distribution system to handle the additional load.
For each PEV penetration scenario this analysis calculates utility revenue, costs, and net revenue for two different
PEV charging scenarios: 1) a baseline scenario in which all PEVs are plugged in and start to charge as soon as
they arrive at home each day, and 2) an off-peak charging scenario in which a significant portion of PEVs that
arrive home between noon and 11 PM each day delay the start of charging until after midnight.
Real world experience from the EV Project demonstrates that, without a “nudge”, drivers will generally plug in
and start charging immediately upon arriving home after work (scenario 1), exacerbating system-wide evening
14 This analysis used the same methodology as described in the referenced report, but used different PEV penetration
scenarios, as described here. In addition, for this analysis fuel costs and other assumptions taken from the Energy
Information Administration (EIA) were updated from EIA’s Annual Energy Outlook 2016 to those in the Annual Energy
Outlook 2017. Finally, for projections of future PEV costs this analysis used updated July 2017 battery cost projections
from Bloomberg New Energy Finance.

Page | 19
peak demand.15 However, if given a “nudge” - in the form of a properly designed and marketed financial
incentive - many Illinois drivers will choose to delay the start of charging until off-peak times, thus reducing the
effect of PEV charging on evening peak electricity demand (scenario 2). [19]
For each PEV penetration scenario, this analysis also calculates the total incremental annual cost of purchase and
operation for all PEVs in the state, compared to “baseline” purchase and operation of gasoline cars and light
trucks. For both PEVs and baseline vehicles annual costs include the amortized cost of purchasing the vehicle,
annual costs for gasoline and electricity, and annual maintenance costs. For PEVs it also includes the amortized
annual cost of the necessary home charger. This analysis is used to estimate average annual financial benefits to
Illinois drivers.
Finally, for each PEV penetration scenario this analysis calculates annual greenhouse gas (GHG) emissions from
electricity generation for PEV charging, and compares that to baseline emissions from operation of gasoline
vehicles. For the baseline and PEV penetration scenarios GHG emissions are expressed as carbon dioxide
equivalent emissions (CO2-e) in metric tons (MT). GHG emissions from gasoline vehicles include direct tailpipe
emissions as well as “upstream” emissions from production and transport of gasoline.
For each PEV penetration scenario GHG emissions from PEV charging are calculated based on an electricity
scenario that is consistent with the latest Energy Information Administration (EIA) projections for future SERC
Reliability Corporation / Gateway grid emissions in Illinois.
Net annual GHG reductions from the use of PEVs are calculated as baseline GHG emissions (emitted by gasoline
vehicles) minus GHG emissions from each PEV penetration scenario. The monetized “social value” of these
GHG reductions from PEV use are calculated using the Social Cost of Carbon ($/MT), as calculated by the U.S.
government’s Interagency Working Group on Social Cost of Greenhouse Gases. [20]
15 The EV Project is a public/private partnership partially funded by the Department of Energy which has collected and
analyzed operating and charging data from more than 8,300 enrolled plug-in electric vehicles and approximately 12,000
public and residential charging stations over a two-year period.
Page | 20
References
[1] http://www.epa.state.il.us/air/climatechange/documents/iccag-final-report.pdf
[2] http://ilga.gov/legislation/publicacts/fulltext.asp?Name=097-0089&GA=97
[3] https://www.icc.illinois.gov/Electricity/programs/pev.aspx
[4] https://www.icc.illinois.gov/NextGrid/
[5] https://www.afdc.energy.gov/laws/state_summary?state=IL
[6] https://www.illinois.gov/dceo/whyillinois/TargetIndustries/Energy/Documents/20111230
EVACFinalReport.pdf
[7] https://www.afdc.energy.gov/laws/state_summary?state=IL
[8] http://www.e-co-op.com/services/electric-cars
[9] http://www.evtown.org/ev-incentives.html
[10] http://chicagocleancities.org/success/clean-fuels-across-chicago/
[11] https://www.cityofchicago.org/city/en/depts/mayor/press_room/press_releases/2017/may/
ParisAgreementExecOrder.html
[12] R.L. Polk & Company, Light duty vehicle registrations, by county and state, as of January 2016
[13] Idaho National Laboratory, 2013 EV Project Electric Vehicle Charging Infrastructure Summary Report,
January 2013 through December 2013. [14] S. Morsy, Bloomberg New Energy Finance, Long-Term Electric
Vehicle Outlook 2017, July 6, 2017
[14] S. Morsy, Bloomberg New Energy Finance, Advanced Transport, Long-term Electric Vehicle Outlook 2017,
July 6, 2017
[15] AECOM and Quercus Consulting, Ripple Effect, Forecasting the economic impact of electric vehicles in
Florida, August 2014
Drive Electric Ohio, Electric Vehicle Readiness Plan for Ohio, 2013
California Electric Transportation Coalition (2012), Plug-in Electric Vehicle Deployment in California: An
Economic Jobs Assessment. http://www.caletc.com/wp-content/uploads/2012/11/Economic-Jobs-
AssessmentExec-Summary.pdf
E. Korejwa, (2015), The Returns to Vehicle Electrification: An Assessment of the Economic and Budgetary
Impacts of Electric Vehicle Adoption in Oregon, Drive Oregon. http://driveoregon.org/wp-
content/uploads/2015/02/Oregon-EV-Returns.pdf
J. Todd, J. Chen, and F. Clogston, (2012), Creating the Clean Energy Economy: Analysis of the Electric
Vehicle Industry, 2013. Originally from U.S. Energy Information Administration. Gasoline and Diesel Fuel
Update. Retrieved from http://www.eia.gov/petroleum/gasdiesel/
J. Cortright, (2010) New York City’s Green Dividend. CEOs for Cities.
http://www.ceosforcities.org/pagefiles/NYCGD_elctrnc_FINAL.pdf

Page | 21
[16] Technical Support Document: Technical Update of the Social Cost of Carbon for Regulatory Impact
Analysis Under Executive Order 12866 Interagency Working Group on Social Cost of Greenhouse Gases,
United States Government, Appendix A, August 2016.
[17] The MISO PEV penetration estimates were provided by R. Konidena, Principal Advisor, Policy Studies,
Midwest Independent System Operator.
[18] S. Morsy, Bloomberg New Energy Finance, Advanced Transport, Long-term Electric Vehicle Outlook 2017,
July 6, 2017
[19] Idaho National Laboratory, 2013 EV Project Electric Vehicle Charging Infrastructure Summary Report,
January 2013 through December 2013
[20] Technical Support Document: Technical Update of the Social Cost of Carbon for Regulatory Impact
Analysis Under Executive Order 12866 Interagency Working Group on Social Cost of Greenhouse Gases,
United States Government, Appendix A, August 2016.

Page | 22
Acknowledgements
Lead Authors: Dana Lowell, Brian Jones, and David Seamonds
This study was conducted by M.J. Bradley & Associates for the Natural Resources Defense Council, Ecology
Center, Sierra Club and Charge Up Midwest. It is one of seven state-level analyses of plug-in electric vehicle
costs and benefits for different U.S. states, including Colorado, Connecticut, Maryland, Massachusetts, Michigan,
New York, and Pennsylvania. These studies are intended to provide input to state policy discussions about actions
required to promote further adoption of electric vehicles.
Charge Up Midwest is a partnership of environmental and clean energy organizations actively working to increase
electric vehicle deployment throughout the region in Illinois, Missouri, Illinois, Minnesota, and Ohio. Partner
organizations include the Natural Resources Defense Council, Sierra Club, Great Plains Institute, Environmental
Law and Policy Center, Clean Fuels Ohio, and Fresh Energy. Through ChargeUp Midwest these organizations
seek to engage with a broad range of stakeholders to support actions that increase investment in electric vehicle
infrastructure, create a more resilient and low-carbon grid, expand education of the public and policymakers about
the benefits of electric vehicles, and otherwise accelerate the production, sales, and access to electric vehicles in
the region for all Midwest residents.
This report, and the other state reports, are available at www.mjbradley.com.