Electric System in Crisis
9
Electric System in Crisis More Power Plants or a Lower-Cost, Greener Solution? Written for by William Ryan, Ph.D. f Research Associate Professor Department of Mechanical Engineering University of Illinois at Chicago
Transcript of Electric System in Crisis

Electric System in Crisis
More Power Plants or a Lower-Cost, Greener Solution?
Written for
byWilliam Ryan, Ph.D.
fResearch Associate ProfessorDepartment of Mechanical Engineering
University of Illinois at Chicago

Electric SystemElectric Systemin Crisis
Mo e Po e Plants o a More Power Plants or a Lower-Cost, Greener Solution?William Ryan, Ph.D., Research Associate Professor, Department of Mechanical Engineering, University of Illinois at Chicago
Consistent, reliable electric power is generally takenfor granted by the modern consumer. Flip a switchor press a button and lights, computers, officeequipment, household appliances and a myriad ofother electrically driven devices come to life, makingtoday’s workdays and lifestyles more productive,
equipment—constitutes the greatest portion of theoverall price of electricity.1 Infrastructure costs canmake up 60% to 70% of total electric price asillustrated in Chart 1. Additionally, the more erraticthe load, the more infrastructure needed to deliverthe same amount of energy.
convenient and enjoyable.
However, the system we depend on to satisfy ourenormous appetite for electric power is aging,overloaded and at risk for breakdowns, brownoutsand blackouts. Possible solutions includeconstructing new power plants and expandingtransmission systems Some think these are thetransmission systems. Some think these are theonly viable solutions. Yet the cost of these optionsis likely to significantly raise electric rates.
Considering the potential expense, a look at whatdrives the need for more capacity and theopportunities that exist to do more with the currentsystem is important.
DEMAND FOR ELECTRICITY EXCEEDING SUPPLY
In reality, electricity is simply one form of energy.Perceptually, it is a valuable commodity, a businessresource, a 24-hour-a-day and seven-day-a-weekexpectation, and an essential convenience—alwaysavailable and plentiful With deregulation in the
Chart 1: Cost of Generating ElectricityAlthough difficult to calculate fully, estimating the costs ofgenerating electricity from a new generating station anddelivering that electricity can be instructive. Best currentestimates show total cost including a reasonable profit tobe higher than electric prices in many areas, indicatingthat older infrastructure is being heavily depended uponavailable and plentiful. With deregulation in the
electric market, it is becoming apparent that to meetcustomer demand the infrastructure component—that is, the generation, transmission and distribution
Traditionally, industrial customers with their largeand steady loads covered a major portion of infra-
that older infrastructure is being heavily depended upon.
Page 2© 2008 Energy Solutions Center Inc. All Rights Reserved

structure costs under regulated “rate base”schedules. As the electric market deregulates, therate base structure that once spread infrastructurecosts over all classes of customer can no longer
electric demand rather than focus entirely onefficiency measures that may have no impacton demand.
costs over all classes of customer can no longereffectively shield customers with less consistentloads, such as commercial buildings, from the bruntof these costs. Manufacturers can now leveragetheir large, steady loads on the open market tosecure more attractive (i.e., less expensive) powerarrangements. With manufacturing customers“buying out” to private electricity providers,
EFFORTS TO MEET DEMAND CONSTRAINED
Some problems plague the electric transmissionsystem in specific areas, especially the crowdedurban Northeast and California.5 Major issuesconcern the cost of land to expand the network,
commercial and residential rates must rise to coverthe cost of the infrastructure these customersactually use.
This shift is occurring at a time when the existinginfrastructure is significantly antiquated andoverloaded. George Gross, a leading electricsystem expert noted “The need to strengthen the
public objections to new power lines, and the lack ofa clear line of responsibility for the soundness of thetransmission network in a deregulated environment.Under deregulation, the transmission network canbe compared to an interstate highway for electricpower. Like a toll road, regional authorities collectthe tolls and should be responsible for maintenanceof the system These lines of responsibility are onlysystem expert, noted, The need to strengthen the
existing transmission infrastructure, to expand it andto effectively harness advances in technologyconstitutes the single most pressing challenge forthe country's electricity system.”2 Transmissionoverload was identified as the cause of the EastCoast Blackout in 20033.
of the system. These lines of responsibility are onlyjust beginning to emerge, and, as they do, littleupgrading of the transmission system is takingplace. Additionally, it is unclear if the transmissioncharges currently in place will sufficiently pay for therequired work.
OPEN MARKET ELECTRIC PRICE INSTABILITY
Another shift in the marketplace as a result ofderegulation is occurring in the ownership of theplants that generate power. Regulated utilities oncegenerated most or all U.S. electricity. In today’sderegulated environment, regulated utilitiespurchase power on the open market from privately
U.S. Capacity Additions
purchase power on the open market from privatelyowned generators. In this open market venue, theprinciples of supply and demand dictate electricpricing. Price increases are passed on to the end-use customer.
As a result, a very real image of the value ofelectricity on an hour-by-hour basis begins toChart 2: Slower Generation Construction
Despite strains on the existing system, additionalgenerating capacity has and is projected to continue
emerge, especially during the critical peak summerperiod. Given generation and transmission con-straints, the price of electricity on hot summer daystends to spike. For example, Chart 3 (next page)illustrates hour-by-hour price fluctuations on a daywhere peak electric prices climbed from $0.04/kWhto $0.60/kWh on the PJM Interconnection* tradingsystem This type of price instability is becoming a
Mistrust of the capital markets following the Enroncollapse, controversy over new large coal plants due toglobal warming, and slower gas plant construction due tohigher gas prices combined to reduce power plantconstruction.
generating capacity has and is projected to continueto decrease as indicated in Chart 2.4 Given thesignificant impact of infrastructure costs on electricprices, a better approach may be to limit peak
system. This type of price instability is becoming atrademark of an overloaded summer electric market.
Page 3© 2008 Energy Solutions Center Inc. All Rights Reserved

CONCURRENT LOADS AND THE COOLING LOAD
A closer look at the components of demand showsth t ll l t i l d d t t ib t ll t
adequacy of the generation and transmissionsystem all focus on meeting summer load.
The North American Electric Reliabilitythat all electric loads do not contribute equally topeak demand. Many load types tend to be non-concurrent. That is, they occur at different times ofthe day or week and, therefore, contribute less toregional peak electric demand. For example, thepower to light large office buildings diminishes at theend of the workday simultaneous with an increasedneed to power residential indoor lighting and retail
The North American Electric ReliabilityCorporation’s (NERC)6 2007 SummerAssessment: The Reliability of the Bulk PowerSystem in North America begins with the followingwarning based on the 2006 season:
Extreme weather was experienced acrossmuch of North America in the summer of2006 R d k d d d l t dp g g
signage. Averaging over thousands of loads andload types reveals significant dispersion over theday or week.
However one load stands out as highly coincident …the air conditioning or space cooling load. Metalmost entirely by electric equipment, this load
d ith td t t d
NERC cites the following hot weather circumstancesas contributing to a “perfect storm” condition for the
l t i t i i t
2006. Record peak demands depletedavailable resources, which necessitated theimplementation of preplanned emergencyprocedures in some areas to maintain abalance between supply and demand.7
waxes and wanes with outdoor temperature andhumidity levels and affects all structures in a regionsimultaneously. In other words, air conditioningloads peak together. Thus, peak demand, higherelectric wholesale prices, and electric supplyproblems tend to correspond to hot weather. This isevidenced by the fact that annual peak demand for49 of the 50 states and Canada occurs in the
electric transmission system.
1. High demand is driven by cooling loads.2. Gas turbine peaking plants are de-rated at high
air temperatures.3. Substation failures increase at high
temperatures.4. Run-of-river hydro and wind generation capacity
summer. It also explains why statistics on the4. Run of river hydro and wind generation capacity
declines in hot weather.
PJM Average Hourly LMP Pricing
Chart 3: On a hot summer day, prices fluctuate hourly and tend to spike, as shown in the illustration where pricesclimbed from $0.04/kWh to $0.60/kWh.
* PJM Interconnection is a regional transmission organization that coordinates the movement of wholesale electricity in all or partsof Delaware, Illinois, Indiana, Kentucky, Maryland, Michigan, New Jersey, North Carolina, Ohio, Pennsylvania, Tennessee, Virginia,West Virginia, and District of Columbia.
Page 4© 2008 Energy Solutions Center Inc. All Rights Reserved

It is well known that the infrastructure investmentneeded to meet cooling loads is an expensiveproblem. In Japan, non-electric chillers are requiredi l i l b ildi lti i i bl
into the rate base. The allowable rate of return wascalculated as an annual percentage of the rate base,meaning that a larger rate base allowed greaterret rns Th s far nder dereg lation the ind strin larger commercial buildings, resulting in a sizable
market for gas cooling (see Chart 4). Governmentpolicies in China and South Korea also encouragethe use of non-electric equipment. These countriesimplemented such policies to help minimize heavygovernment-subsidized investment in electricgeneration and delivery.
returns. Thus far under deregulation, the industryhas taken the opposite approach of minimizinginvestment to maximize an unregulated rate ofreturn. In such an environment, new non-electriccooling technologies should move to the forefront asa means of reducing demand on an overstressedinfrastructure. However, the American buildingdesign community remains entrenched in a long
In contrast, under regulation the American electricindustry rolled the cost of excessive infrastructure
The Japanese MarketSales of Gas Cooling in Japan: 1996 to 2006
(Values are in 1,000’s of kW and Tons of Cooling)
g y gtradition of electric cooling.
EXPLORING ALTERNATIVE COOLING OPTIONS
Capital Costs
Reducing demand at the source through aggressive
( , g)
use of alternative cooling options is less expensiveoverall than utility peaking turbines as demonstratedin Chart 5. This chart compares various coolingtechnologies for meeting the needs of a largecommercial building, using a conventional electricchiller (line 1) as the base case. The Total Demand(column 2) represents the daytime electric demandadded by each technology The Cost of Demand
Annual Japanese Gas Sales by Month
added by each technology. The Cost of DemandReduction (column 3) was calculated by firstcompleting a first-cost assessment for each type ofcooling system, then dividing the added cost, abovethat of a conventional electric chiller, by the amount
Chart 4: Japan controls their investment in electricgenerating capacity and transmission through policiesthat reward the use of gas cooling Summer use of gas
Chart 5: Cost of Meeting Electric DemandReducing demand at the source through the aggressiveuse of alternative cooling options such as natural gasthat reward the use of gas cooling. Summer use of gas
in commercial buildings increased to nearly 80% by2005. Systems shown are large chillers. Small airconditioners are generally electric.
Page 5
absorption and engine-driven chillers is less expensiveoverall than utility peaking turbines. Values are for a1,000 ton cooling plant and include all tower and coolingwater pumps.
© 2008 Energy Solutions Center Inc. All Rights Reserved

of demand reduced. The Cost of DemandReduction is shown on a dollar per kW of demandreduction basis.
electric cooling is installed, the first cost of theneeded electric capacity has traditionally beenspread across all electric consumers as part of therate base This inherent subsidy by non commercial
For example, opting for a high-efficiency electricchiller rather than a conventional electric chillerreduces demand from 780 kW to 700 kW. Theadditional first cost of this option amounts to $625for each kW of avoided demand. An ice storagesystem requires no additional daytime demand, butthe cost of the ice storage system adds $600 for
rate base. This inherent subsidy by non-commercialratepayers allows commercial building owners toavoid rate structures that encourage the use of lessexpensive alternative cooling options. As industrialcustomers abandon regulated rates in many states,the only remaining major customer class, theresidential consumer, will increasingly pay thissubsidy.g y
every kW of demand reduced.
Although the cost of simply adding an on-sitegenerator to carry the chiller plant varies, it is stillmore than $500/kW. For smaller facilities requiringgenerators of less than 500 kW, this cost can be$1000/kW or more.
Demand Reduction Potential
When estimating the potential for demand reduction,it must be recognized that the opportunity incommercial buildings occurs when an existing chilleris replaced or during new construction. Each year,
f t d l hill liAt $1,000/kW, the cost of the electric utility carryingthe demand, using the least expensive solution ofpeaking turbines and the needed transmission anddistribution to deliver the peak electricity, is the mostexpensive option. Even so, many experts considerthis estimate to be conservatively low.
manufacturers produce large chillers, or coolingsystems targeted to new and existing largecommercial buildings, equal to approximately3,000,000 refrigeration tons. If natural gastechnologies displace electric chillers in half of theseinstallations, demand shrinks by 900 MW per year,thereby eliminating the need to build one large coalor nuclear plant per year. Based on the NERC’s
At $469/kW and $538/kW respectively, the gascooling options, absorption and engine chillers, offerthe lowest-cost demand reduction.
If gas absorption and engine chillers are the leastexpensive approach to demand reduction, whyaren’t more natural gas systems specified forcommercial buildings? The reason is a market
or nuclear plant per year. Based on the NERC sNorth American demand growth projection of 15,000MW/year over the next 10 years8, the policy ofpromoting non-electric equipment makes sense.
More importantly, the largest markets for gas coolingin commercial buildings, which predominate in themetropolitan areas, are the most capacity
t i d D d d ti i iti l th
2004 Total 2004 SO2 2004 NOx 2004 CO2 2004 Hg
commercial buildings? The reason is a marketdefect that penalizes commercial building ownerswho choose natural gas. The costs shown in Chart5 are overall. If gas cooling is specified, the firstcost falls entirely to the building owner. When
constrained. Demand reduction in cities along theEastern Seaboard, the West Coast, and portions ofCanada can alleviate their most critical challenge,the inability to import sufficient power regardless ofthe source.
Generation Emissions Emissions Emissionsg
Emissions
(MWh) (pounds/MWh) (pounds/MWh) (pounds/MWh) (pounds/MWh)
3,945,431,404 5.22 1.98 1284.669 0.000024
Chart 6: Emissions from Power Plants in 200410
Page 6
These values are national averages for each MWh of electricity produced from whatever source including those that donot emit these pollutants such as wind, nuclear and hydro power. As such, this represents the environmental footprint ofevery MWh produced given the current national mix of power plants. Canadian values tend to be lower due to the largerpercentage of hydroelectric power used in Canada.
© 2008 Energy Solutions Center Inc. All Rights Reserved

Many of these areas are dealing with localizednegative summer reserve margins, requiringenactment of emergency demand reductionprograms for every hot weather period Currently
operation, the gas engine and peaking turbinepresent a more valid comparison of CO2 emissions.
A comparison of sulfur dioxide emissions for electricprograms for every hot weather period. Currentlythe most constrained areas are New York, NewEngland, Ontario, Southern California, and Texas.All have total summer reserve margins below 15%.Specific areas like Southern Connecticut andBoston have negative summer reserve margins forall power whether internally generated or imported.
A comparison of sulfur dioxide emissions for electricand gas technologies is much simpler. Every 1,000-ton hours of cooling from an electric chiller, runningon typical grid power, will release 3.1 pounds of SO2into the atmosphere. Conversely, sulfur compoundsare removed from pipeline quality natural gas.Therefore, gas cooling (and cooling run by gaspeaking turbines) will produce effectively zero sulfur
Gas Cooling and Emissions
Given the current national mix of power plants,Chart 6 (previous page) shows the national averageemissions for each MWh of electricity produced.
The impact on emissions when using gas coolingtechnologies rather than electric chiller equipment
dioxide. Similarly, mercury emissions are noproblem for systems operating on natural gas, asnatural gas contains no mercury.
GAS COOLING AND WATER USAGE
Water is a critical resource in many parts of NorthA i d i d b th d i titechnologies rather than electric chiller equipment
depends on the source of the electric power. Forelectric chillers running on typical power supplied bythe grid, CO2 emissions are lower for the gasengine-driven chillers than the electric units (seeChart 7). However, the chillers will operate duringperiods of peak summer demand when electricitygenerators must rely on peaking gas turbines to
America and is used both during power generationand by cooling systems. Power generation useswater to reject energy that cannot be converted toelectricity by evaporating water in cooling towers.Cooling chillers reject heat in the same way.
g y p g gproduce marginal power to cover peak loads. Sincethe gas cooling option can supplant peaking turbine
Although electric chillers reject less heat than gasengine or absorption chillers, a valid comparisontakes into account the water used during the electricgeneration process to determine the water usage of
Chart 8: Water Usage for Large Cooling SystemsWater usage for the electric cooling system includeswater used at a typical fossil fuel power plant.
Chart 7: Cooling and Global WarmingCarbon dioxide emissions due to gas or electric chiller operation. Electric chiller values vary depending on the generation source.
Page 7
generation process to determine the water usage ofthe electric chiller. As shown in Chart 8, natural gasengine chillers use less water overall.
© 2008 Energy Solutions Center Inc. All Rights Reserved
SMALLER GAS COOLING SYSTEMS
A larger potential market exists for gas cooling insmaller equipment Smaller air conditioning systems
• Small gas air conditioning systems aregenerally set up to operate as heat pumps inthe winter, providing a greater level ofefficiency than any existing gas heatingsmaller equipment. Smaller air conditioning systems
are sold at a rate of approximately 8-10,000,000 tonsper year in North America. However, at present thereare few producers of gas cooling systems in thesesmaller residential or light commercial sizes. Giventhe societal benefits possible, development efforts intopractical systems for this market seem warranted.Advantages in this area of the market include:
efficiency than any existing gas heatingsystem. Gas heat pumps can also providespace heating at a lower carbon emission ratethan any other form of space heating (seeChart 9).
Gas Heat Pumps and Carbon Emissions
• The market for smaller cooling units representsan even greater potential for demand reduction.
• Small-sized gas units, serving residential andlight commercial loads, can reduce powerdemand on both the transmission and theextensive low voltage distribution systems,yielding even greater infrastructure savings.
• Some of these units can also be fired onpropane or oil, allowing for load relief on lengthyand expensive-to-maintain rural electricdistribution systems.
• Small-sized gas air conditioning equipment is aircooled and requires no cooling water. Since theequipment is gas fired, the units do notcontribute to water usage at power plants anduse no water on site, making the overall waterconsumption effectively zero.
THE GAS SYSTEM
This discussion focused on the maximum summer
Chart 9: No other available form of heating is as low incarbon dioxide emissions as a gas heat pump.
This discussion focused on the maximum summerloads experienced by the electric distribution systemand the transfer of some cooling load to the gasdistribution system. As shown in Chart 10, (nextpage) the gas distribution system is very lightlyloaded in summer months. Even with the greateruse of gas for power generation, long distancetransmission capacity significantly exceeds summersales. In addition, urban gas distribution systems,sized for the heating season, are very lightly loadedin the summer. Moving a significant portion of thecooling load from the electric to the gas distributionsystem effectively aids in leveling the loads on bothsystems, maximizing usage of the currentinvestment in both distribution systems. Given thatdistribution costs remain regulated and aredistribution costs remain regulated and areultimately paid for by the energy ratepayer, makingthe best use of this investment is in the publicinterest.
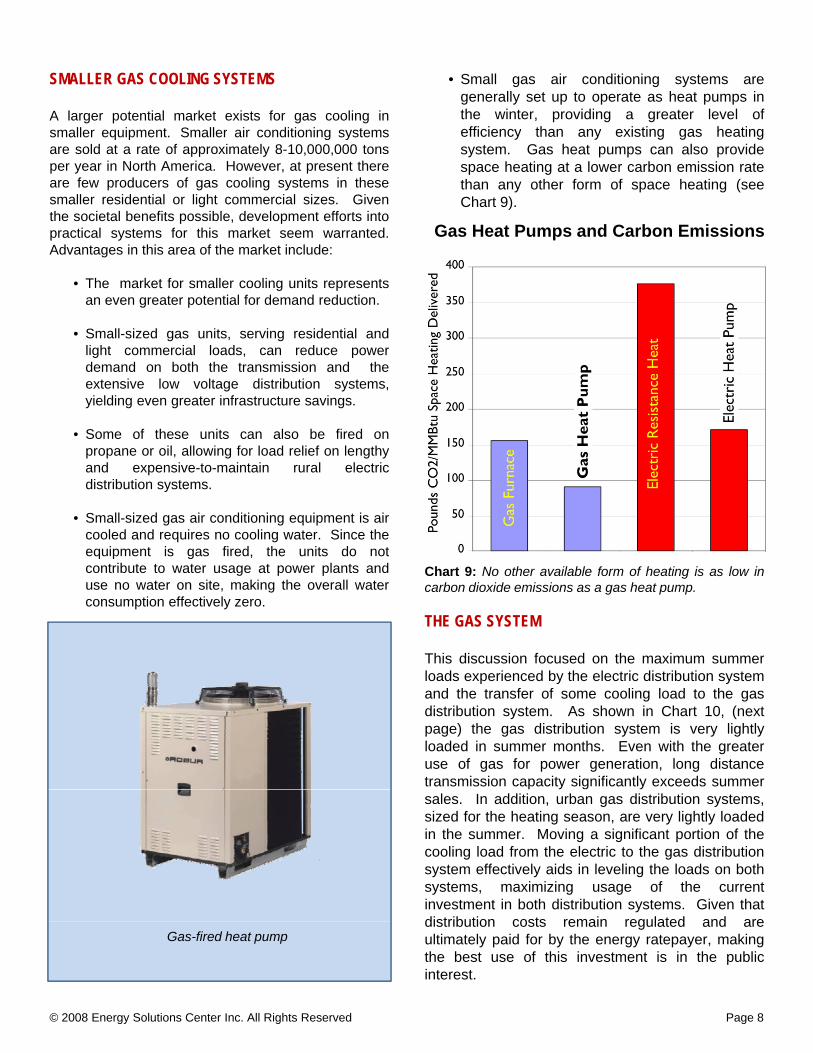
Gas-fired heat pump
Page 8© 2008 Energy Solutions Center Inc. All Rights Reserved

REFERENCES
1 TRANSFORMING ELECTRICITY by Thomas
Gas & Electric Demand
TRANSFORMING ELECTRICITY, by ThomasCasten and Sean Casten, Northeast MidwestEconomic Review, NORTHEAST-MIDWESTINSTITUTE, November/December 2001
2 Transmission Congestion Threatens To ClogNation's Power Grid, Science Daily, July 27,2006
3 Final Report on the August 2003 Blackout,US/Canadian Power Outage Taskforce 2004
Chart 10: General Pattern in Gas and Electric DemandElectric systems peak in the summer and gas systemspeak in the winter. Growth in gas usage for electricgeneration has not significantly changed this traditionalpattern.
US/Canadian Power Outage Taskforce, 20044 Long-Term Reliability Assessment, The Relia-
bility of Bulk Electric Systems in North America,North American Electric Reliability Council,September 2005
5 Transmission Planning and Investment in theCompetitive Environment, George Gross,University of Illinois, PowerTech 2005, St.P t b R i 2005
SUMMARY
The opportunity to control and minimize theinvestment needed in the electric infrastructure tomeet growing demand through the use of gascooling technologies is substantial. Implementingthe following actions will prime the marketplace for
Petersburg, Russia, 20056 NERC, The North American Electric Reliability
Council (now Corporation), is responsible forreviewing the adequacy of the North Americanelectric infrastructure. Each year they prepare asummer assessment based entirely on thisconcern.
7 2007 SUMMER ASSESSMENT: The Reliabilitythe following actions will prime the marketplace forwider acceptance of natural gas cooling as aneconomically and environmentally viable alternative.
• Eliminate the current “inherent subsidies”promoting electric cooling through theapplication of electric rates that do not spreadthe cost of this subsidy to residential rate
of the Bulk Power System in North America, May2007, North American Electric ReliabilityCorporation, Princeton, New Jersey
8 2006, Long-Term Reliability Assessment, TheReliability of the Bulk Power Systems In NorthAmerica, North American Electric ReliabilityCouncil, October 2006, Page 6
9 This amounts to 1,284 lb/kWh in reasonablepayers.
• Educate designers of commercial buildingsabout the advantages of gas cooling.
• Develop a domestic market for the smaller gascooling systems that have successfully proventheir value in overseas markets
agreement with the 1,340 lb/kWh found from the2002 data.
10 Benchmarking Air Emissions of the 100 LargestElectric Power Producers in the United States,NRDC. Study compiled statistics from 6250plants throughout the U.S. whether owned byone of the 100 largest producers.
their value in overseas markets.
Page 9© 2008 Energy Solutions Center Inc. All Rights Reserved