Electric Field Modulation of Electron Transfer Reaction ... · J. Phys. Chem. 1990, 94, 5 135-5 149...
15
J. Phys. Chem. 1990, 94, 5 135-5 149 5135 Electric Field Modulation of Electron Transfer Reaction Rates in Isotropic Systems: Long-Distance Charge Recombination in Photosynthetic Reaction Centers Stefan Franzen, Robert F. Goldstein,+ and Steven G. Boxer* Department of Chemistry, Stanford University, Stanford, California 94305 (Received: September 14, 1989; In Final Form: December 4, 1989) A general method is demonstrated for experimentally obtaining the rate constant of electron transfer as a function of the free energy of the reaction in nonoriented systems. An external electric field is used to modulate the energy levels of dipolar states and thereby affect the electron-transfer rate. The method is valid for any electron-transfer system which has a fixed distance between the donor and acceptor. The method is employed to obtain the experimental rate vs applied electric field curve of the charge recombination reaction between the oxidized special pair electron donor and the reduced ubiquinone acceptor in bacterial reaction centers of Rb. sphaeroides at 80 K. The experimental rate vs electric field curve is shown to be equivalent to the rate vs free energy curve when it is linearly scaled by the dipole moment of the charge-transfer state and the local field correction. The reaction is biexponential at zero field, and possible mechanisms that could give rise to two populations are discussed in the context of the electric field effect. The rate vs free energy curve for each of the two processes is compared to several theoretical models for the rate constant. The apparent absence of structure due to quantum mechanical resonances in the experimentally determined energy gap law is addressed, and calculations based only on the free energy dependence of the Franck-Condon factors are contrasted with a model including superexchange in the electronic coupling. Introduction The relationship between the rate constant and the free energy change for an electron-transfer reaction has been the subject of widespread theoretical and experimental interest.lJ One ex- perimental approach to this question involves the application of an external electric field which changes the energy of the dipolar charge-separated state depending on the orientation of its electric dipole moment relative to the field. If the sample is oriented and immobilized, the free energy change, AGO,,, can be tuned by increasing the electric field strength leading to a change in the rate, k,. The energy of a 100 D dipole (charge separation of about 20 A) aligned with an electric field of 1 X lo6 V/cm is decreased by about 200 meV relative to zero field. If the dipoles are im- mobilized but not oriented, a situation which is easily realized for many systems, application of a field will produce a spread in AGOet values around the zero-field value, and consequently a spread in k,,. This spread in rates is highly sensitive to the dependence of k,, on AGO,, for an electron-transfer system as we have shown earlier in model calculation^.^-^ In this paper we demonstrate that an electric field effect on the electron-transfer kinetics for an isotropic, immobilized sample is readily observed and can be used to obtain the relationship between k,, and AGO,,. We have chosen the charge recombination reaction between the oxidized primary electron donor or special pair (denoted P) and the reduced ubiquinone electron acceptor (denoted QA) in Rb. sphaeroides photosynthetic reaction centers (RCs) for a number of reasons. First, as shown in Figure 1, electron transfer is initiated by photoexcitation of P which reacts rapidly to form the state P*H'QA (where H is ba~teriopheophytin~); the electron on H- moves on to QA to form P+HQA'- with an overall quantum yield approaching unity.6 The recombination charge-transfer reaction from P'+HQA'- to the ground-state PHQA can be con- veniently monitored by observing the bleach in the absorption band of the donor P which is centered at 870 nm. Second, since P and QA are separated by about 25 A (center-to-center the P'QA' dipole moment is approximately 130 D, and the energy of this state can be. varied by nearly *300 meV with fields available in the laboratory. Third, the kinetics of the P'+QA'- - PQA recombination reaction have been extensively characterized.I0J1 The reaction is relatively slow and speeds up somewhat as the temperature is lowered [k,, = 20 s-I at 298 K and 39 s-l at 77 K in poly(viny1 alcohol) matrices] so very high signal-to-noise 'Permanent address: Computer Center, University of Illinois at Chicago, Chicago, IL 60680. decay kinetics can be obtained over a wide temperature range. Finally, there have been two previous studies of electric field effects on this reaction in oriented systems at room temperature. Feher and co-workers inserted RCs into lipid bilayers and measured the effect of an applied transmembrane potential on the recombination rate at room temperat~re.'~,'~ Popovic and co-workers studied RCs in Langmuir-Blodgett monolayers sandwiched between ele~trodes.'~J~ The quantitative results from these labs were very different, and the origin of this difference is not known, so an independent approach is desirable. As pointed out in detail by the authors in ref 13, there are several potential problems with bilayer samples including uncertainty and heterogeneity in the degree of insertion of the RC into the bilayer. Likewise there are shortcomings to the Langmuir-Blodgett samples including un- certainty in the sample thickness, mosaic spread, and space charge effects. As described below, our isotropic samples avoid these problems; however, the electric field effects on the electron-transfer (1) Marcus, R. A,; Sutin, N. Biochim. Biophys. Acta 1985,811, 265-322. (2) Closs, G. L.; Miller, J. R. Science 1988, 240, 440-446. (3) Boxer, S. G.; Goldstein, R. A.; Franzen, S. In Photoinduced Elecfron Transfer; Fox, M. A,, Chanon, M., Eds.; Elsevier Press: New York, 1988; Volume B, pp 163-215. (4) Boxer, S. G.; Lockhart, D. J.; Franzen, S. In Photochemical Energy Conversion; Norris, Jr., J. R., Meisel, D., Eds.; Elsevier Press: New York, 1989; pp 196-210. (5) Kirmaier, C.; Holten, D. Phofosynth. Res. 1987, 13, 225-260. (6) Wraight, C. A.; Clayton, R. K. Biochim. Biophys. Acta 1973, 333, 246-260. (7) Deisenhofer, J.; Epp, 0.; Miki, K.; Huber, R.; Michel, H. J. Mol. Biol. (8) The center-to-distance is the distance between the geometric center of the special pair P and the center of the quinone acceptor (menadione) in Rps. uiridis at room temperature. We have assumed that the distance in Rb. sphaeroides9 is the same as in Rps. uiridis. (9) Allen, J. P.; Feher, G.; Yeates, T. 0.; Komiya, H.; Rees, D. C. Proc. Nail. Acad. Sci. V.S.A. 1987, 84, 6162-6166. (IO) Feher, G.; Okamura, M. Y. In The Photosynthetic Bacteria; Clayton, R. K., Sistrom, W. R., Eds.; Plenum: New York, 1978; pp 349-386. (I I) Kleinfeld, D.; Okamura, M. Y.; Feher, G. Biochemistry 1984, 23, 5780-5786. (12) Gopher, A.; Schonfeld, M.; Okamura. M. Y.; Feher, G. Biophys. J. 1985, 48, 31 1-320. (13) Feher, G.; Arno, T. R.; Okamura, M. Y. In The Photosynthetic Bacterial Reaction Center: Structure and Dynamics; Breton, J., Vermeglio, A., Eds.; Plenum Press: New York, 1988; pp 271-287. (14) Popovic, Z. D.; Kovacs, G. J.; Vincett, P. S.; Dutton, P. L. Chem. Phys. Lett. 1985, 116, 405-410. (15) Popovic, 2. D.; Kovacs, G. J.; Vincett. P. S.; Alegria, G.; Dutton, P. L. Chem. Phvs. 1986. 110, 227-237. 1984, 180, 385-398. 0022-3654/90/2094-5 135$02.50/0 C 1990 American Chemical Society
Transcript of Electric Field Modulation of Electron Transfer Reaction ... · J. Phys. Chem. 1990, 94, 5 135-5 149...
J . Phys. Chem. 1990, 94, 5 135-5 149 5135
Electric Field Modulation of Electron Transfer Reaction Rates in Isotropic Systems: Long-Distance Charge Recombination in Photosynthetic Reaction Centers
Stefan Franzen, Robert F. Goldstein,+ and Steven G . Boxer*
Department of Chemistry, Stanford University, Stanford, California 94305 (Received: September 14, 1989; In Final Form: December 4, 1989)
A general method is demonstrated for experimentally obtaining the rate constant of electron transfer as a function of the free energy of the reaction in nonoriented systems. An external electric field is used to modulate the energy levels of dipolar states and thereby affect the electron-transfer rate. The method is valid for any electron-transfer system which has a fixed distance between the donor and acceptor. The method is employed to obtain the experimental rate vs applied electric field curve of the charge recombination reaction between the oxidized special pair electron donor and the reduced ubiquinone acceptor in bacterial reaction centers of Rb. sphaeroides at 80 K . The experimental rate vs electric field curve is shown to be equivalent to the rate vs free energy curve when it is linearly scaled by the dipole moment of the charge-transfer state and the local field correction. The reaction is biexponential at zero field, and possible mechanisms that could give rise to two populations are discussed in the context of the electric field effect. The rate vs free energy curve for each of the two processes is compared to several theoretical models for the rate constant. The apparent absence of structure due to quantum mechanical resonances in the experimentally determined energy gap law is addressed, and calculations based only on the free energy dependence of the Franck-Condon factors are contrasted with a model including superexchange in the electronic coupling.
Introduction The relationship between the rate constant and the free energy
change for an electron-transfer reaction has been the subject of widespread theoretical and experimental interest.lJ One ex- perimental approach to this question involves the application of an external electric field which changes the energy of the dipolar charge-separated state depending on the orientation of its electric dipole moment relative to the field. If the sample is oriented and immobilized, the free energy change, AGO,,, can be tuned by increasing the electric field strength leading to a change in the rate, k,. The energy of a 100 D dipole (charge separation of about 20 A) aligned with an electric field of 1 X lo6 V/cm is decreased by about 200 meV relative to zero field. If the dipoles are im- mobilized but not oriented, a situation which is easily realized for many systems, application of a field will produce a spread in AGOet values around the zero-field value, and consequently a spread in k,,. This spread in rates is highly sensitive to the dependence of k,, on AGO,, for an electron-transfer system as we have shown earlier in model calculation^.^-^ In this paper we demonstrate that an electric field effect on the electron-transfer kinetics for an isotropic, immobilized sample is readily observed and can be used to obtain the relationship between k,, and A G O , , .
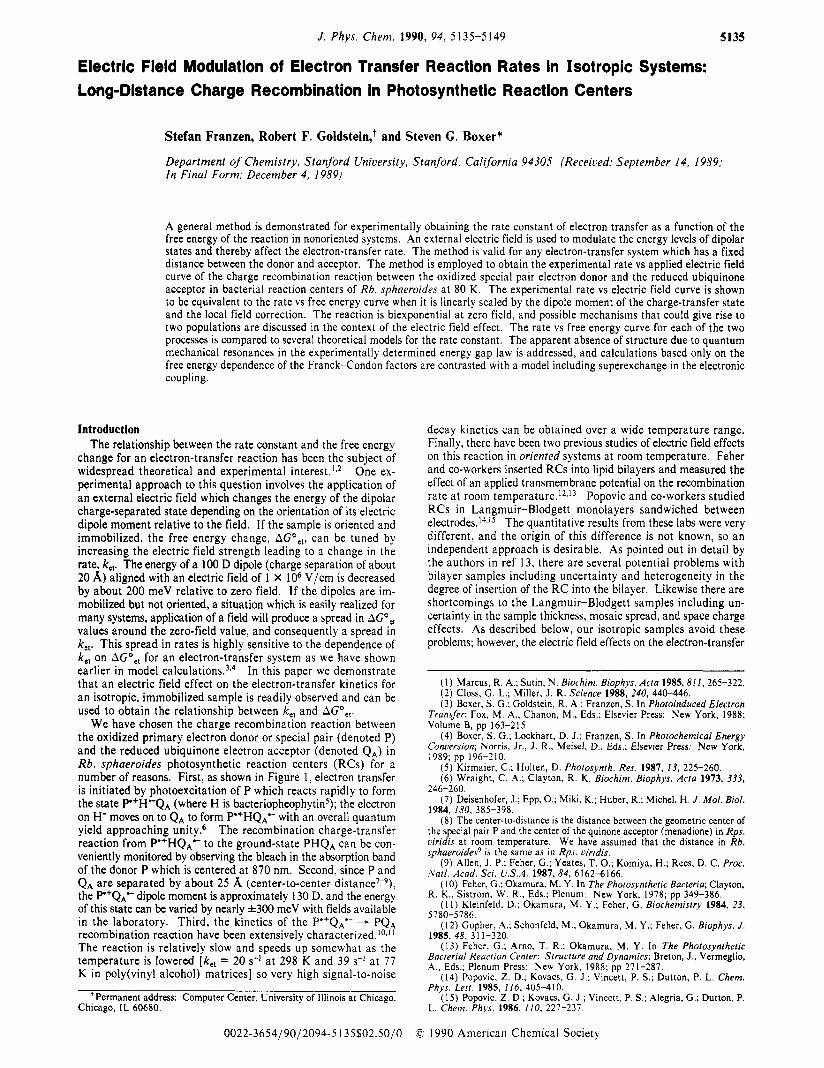
We have chosen the charge recombination reaction between the oxidized primary electron donor or special pair (denoted P) and the reduced ubiquinone electron acceptor (denoted QA) in Rb. sphaeroides photosynthetic reaction centers (RCs) for a number of reasons. First, as shown in Figure 1, electron transfer is initiated by photoexcitation of P which reacts rapidly to form the state P*H'QA (where H is ba~teriopheophytin~); the electron on H- moves on to QA to form P+HQA'- with an overall quantum yield approaching unity.6 The recombination charge-transfer reaction from P'+HQA'- to the ground-state PHQA can be con- veniently monitored by observing the bleach in the absorption band of the donor P which is centered at 870 nm. Second, since P and QA are separated by about 25 A (center-to-center the P'QA' dipole moment is approximately 130 D, and the energy of this state can be. varied by nearly *300 meV with fields available in the laboratory. Third, the kinetics of the P'+QA'- - PQA recombination reaction have been extensively characterized.I0J1 The reaction is relatively slow and speeds up somewhat as the temperature is lowered [k, , = 20 s-I at 298 K and 39 s-l at 77 K in poly(viny1 alcohol) matrices] so very high signal-to-noise
'Permanent address: Computer Center, University of Illinois at Chicago, Chicago, IL 60680.
decay kinetics can be obtained over a wide temperature range. Finally, there have been two previous studies of electric field effects on this reaction in oriented systems at room temperature. Feher and co-workers inserted RCs into lipid bilayers and measured the effect of an applied transmembrane potential on the recombination rate at room t e m p e r a t ~ r e . ' ~ , ' ~ Popovic and co-workers studied RCs in Langmuir-Blodgett monolayers sandwiched between e l e ~ t r o d e s . ' ~ J ~ The quantitative results from these labs were very different, and the origin of this difference is not known, so an independent approach is desirable. As pointed out in detail by the authors in ref 13, there are several potential problems with bilayer samples including uncertainty and heterogeneity in the degree of insertion of the RC into the bilayer. Likewise there are shortcomings to the Langmuir-Blodgett samples including un- certainty in the sample thickness, mosaic spread, and space charge effects. As described below, our isotropic samples avoid these problems; however, the electric field effects on the electron-transfer
(1) Marcus, R. A,; Sutin, N. Biochim. Biophys. Acta 1985,811, 265-322. (2) Closs, G. L.; Miller, J. R. Science 1988, 240, 440-446. (3) Boxer, S. G.; Goldstein, R. A.; Franzen, S. In Photoinduced Elecfron
Transfer; Fox, M. A,, Chanon, M., Eds.; Elsevier Press: New York, 1988; Volume B, pp 163-215.
(4) Boxer, S. G.; Lockhart, D. J.; Franzen, S. In Photochemical Energy Conversion; Norris, Jr., J. R., Meisel, D., Eds.; Elsevier Press: New York, 1989; pp 196-210.
(5) Kirmaier, C.; Holten, D. Phofosynth. Res. 1987, 13, 225-260. (6) Wraight, C. A.; Clayton, R. K. Biochim. Biophys. Acta 1973, 333,
246-260. (7) Deisenhofer, J.; Epp, 0.; Miki, K.; Huber, R.; Michel, H. J . Mol. Biol.
(8) The center-to-distance is the distance between the geometric center of the special pair P and the center of the quinone acceptor (menadione) in Rps. uiridis at room temperature. We have assumed that the distance in Rb. sphaeroides9 is the same as in Rps. uiridis.
(9) Allen, J . P.; Feher, G.; Yeates, T. 0.; Komiya, H.; Rees, D. C. Proc. Nail. Acad. Sci. V .S .A . 1987, 84, 6162-6166.
( I O ) Feher, G.; Okamura, M. Y. In The Photosynthetic Bacteria; Clayton, R. K., Sistrom, W. R., Eds.; Plenum: New York, 1978; pp 349-386.
( I I ) Kleinfeld, D.; Okamura, M. Y.; Feher, G. Biochemistry 1984, 23, 5780-5786.
(12) Gopher, A.; Schonfeld, M.; Okamura. M. Y.; Feher, G. Biophys. J. 1985, 48, 31 1-320.
(13) Feher, G.; Arno, T. R.; Okamura, M. Y . In The Photosynthetic Bacterial Reaction Center: Structure and Dynamics; Breton, J., Vermeglio, A., Eds.; Plenum Press: New York, 1988; pp 271-287.
(14) Popovic, Z. D.; Kovacs, G. J.; Vincett, P. S.; Dutton, P. L. Chem. Phys. Lett . 1985, 116, 405-410.
( 1 5 ) Popovic, 2. D.; Kovacs, G. J.; Vincett. P. S.; Alegria, G.; Dutton, P. L. Chem. Phvs. 1986. 110, 227-237.
1984, 180, 385-398.
0022-3654/90/2094-5 135$02.50/0 C 1990 American Chemical Society

5136 The Journal of Phvsical C'hemistrj, Yo1 94, h o 12, 1990
cm. eV ? i n 5 0 - 3 3' ' P H Q ~ k i 5 x 10" S '
1 '1
Franzen et al.
8468 - 1 0 5 ! P+H*Qb
J PHQA 0 - - 0 0
Figure 1. Reaction scheme for the primary charge-separation and -re- combination steps of bacterial photosynthesis, and approximate rate constants at 80 K . The energies relative to the ground state are given on the right in cm-' and eV.
kinetics in isotropic samples are much smaller than for the oriented samples, and more numerical analysis is required i n order to extract information on the dependence of the rate of electron transfer on free energy. In the following we demonstrate that a quantitative analysis is quite straightforward and that the ease of sample preparation and applicability over a wide temperature range makes this a potentially useful method for studies of electron-transfer reactions in
Experimental Section Reaction centers from Rb. sphaeroides R-26 were obtained by
standard methodsI0 and contain a single ubiquinone. Samples were prepared by spin coating solutions containing RCs [ I O m M Tris, pH 8.0, 0.025% lauryldimethylamine oxide detergent (LDAO) in 18% (w/v) poly(viny1 alcohol) (PVA, average M W = 125000, Aldrich)] onto glass slides coated with indium tin oxide (ITO) (>85% transparency in the 500-1000-nm range, conduc- tance > 1.25 X IO-3 mho. 0.17 pm thick). Samples were spun on a photoresist spinner (Headway Research Instruments) a t a rate of 3600-4600 rpm using 90 f IO pL of the viscous PVA solution for a sample with an electrode area of about 1 cm?. Different samples had thicknesses ranging from 3.0 f 0.1 to 10.0 f 0.3 pm as measured with a Sloan Dektak IIa thickness measuring system (precision f O . l pm) and had optical densities ranging from 0.02 to 0.1 a t 870 nm. The thinnest samples were the most homogeneous and often had no detectable surface fea- tures within the accuracy of the Dektak. The second electrode was prepared by evaporating 0.3 pm of AI onto the polymer film.
The samples were placed in a closed-cycle helium refrigerator in a copper sample holder designed to allow thermal contact with the cold finger through the aluminum electrode. Data were collected for 3-5-min periods while the compressor was turned off to reduce the noise. The temperature rise during these time periods was less than 2.0 K as determined by a gold-constantan thermocouple near the sample. The sample was excited by using the frequency-doubled output of a Nd:YAG laser (pulse width - 10 ns) resulting in a bleach of the 870-nm band which was less than 70% of saturation. The time course of the kinetics was not affected by changes in the excitation laser power. The probe beam was broad band light from a tungsten halogen lamp filtered to produce a beam centered a t 880 f 20 nm. The kinetics and electric field response of the sample were tested as a function of the probe beam intensity. The kinetics were unaffected by the probe beam when the intensity was less than 400 pW/cm*. However, transient electric field induced responses were observed if the probe intensity was greater than 150 pW/cm* and all work was carried out with the probe intensity less than 150 pW/cm2. The probe beam was reflected off the aluminum electrode at 16.4"
( 16) For example, we have recently measured the effects of an electric field on the initial charge separation kinetics in RCs on a picosecond time scale in a n isotropic sample: Lockhart. D. J.; Kirmaier, C.: Holten. D.: Boxer. S. G. J . Phys. Chem.. in press.
2.01 - m 0 3-
1.5 v
W 0 2 a m 1 . 0 a 0 v) m u 0.5
n o r - 0 50 100 150
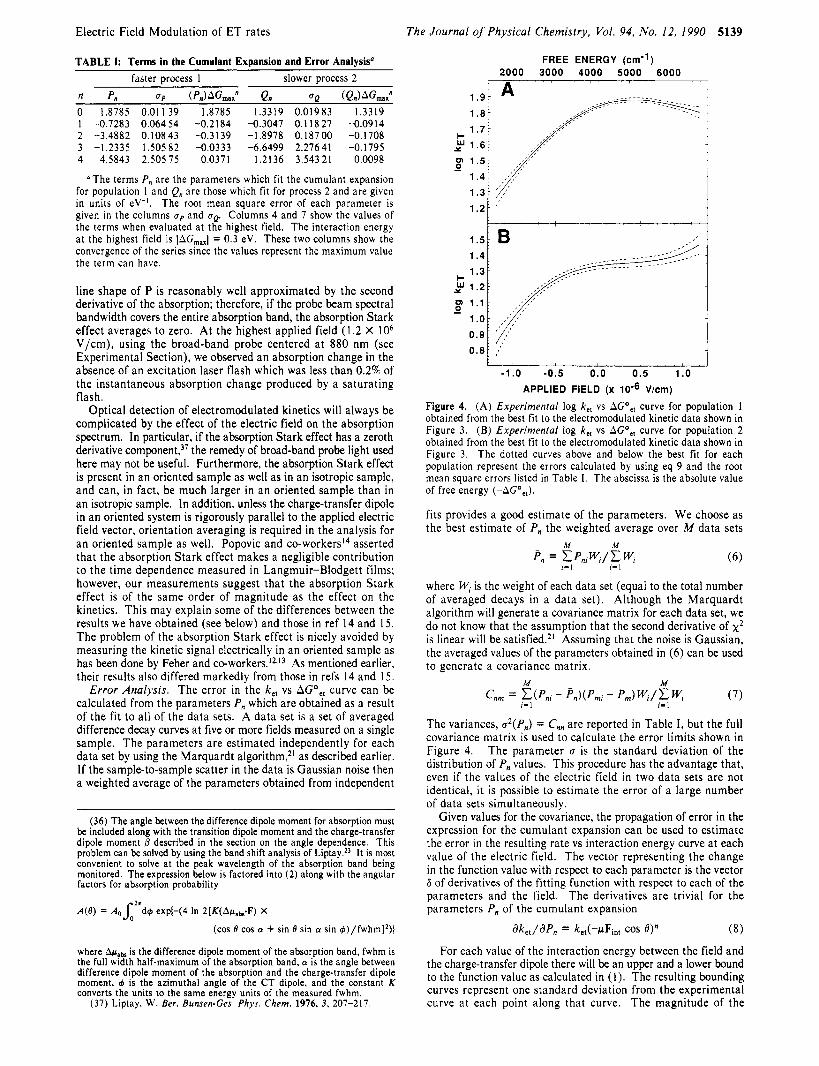
TIME (ms) Figure 2. Decay curves showing the return of the bleach of the absorption band of P at 80 K with and without an applied electric field. The zero-field bleach is the bottom trace. The external field values are 9.05 X IO5 , 9 . 5 2 X IO5, 10.47 X lo', and 11.43 X I O 5 V/cm. These curves are raw data and have not been corrected for offsets (see text).
0.06 0
z w
0 0 w
5 1
0.04
N i 0.02 i? P
0.00- .~ . . - ~~ -.--L __i..i_. 2 0 100 200 300
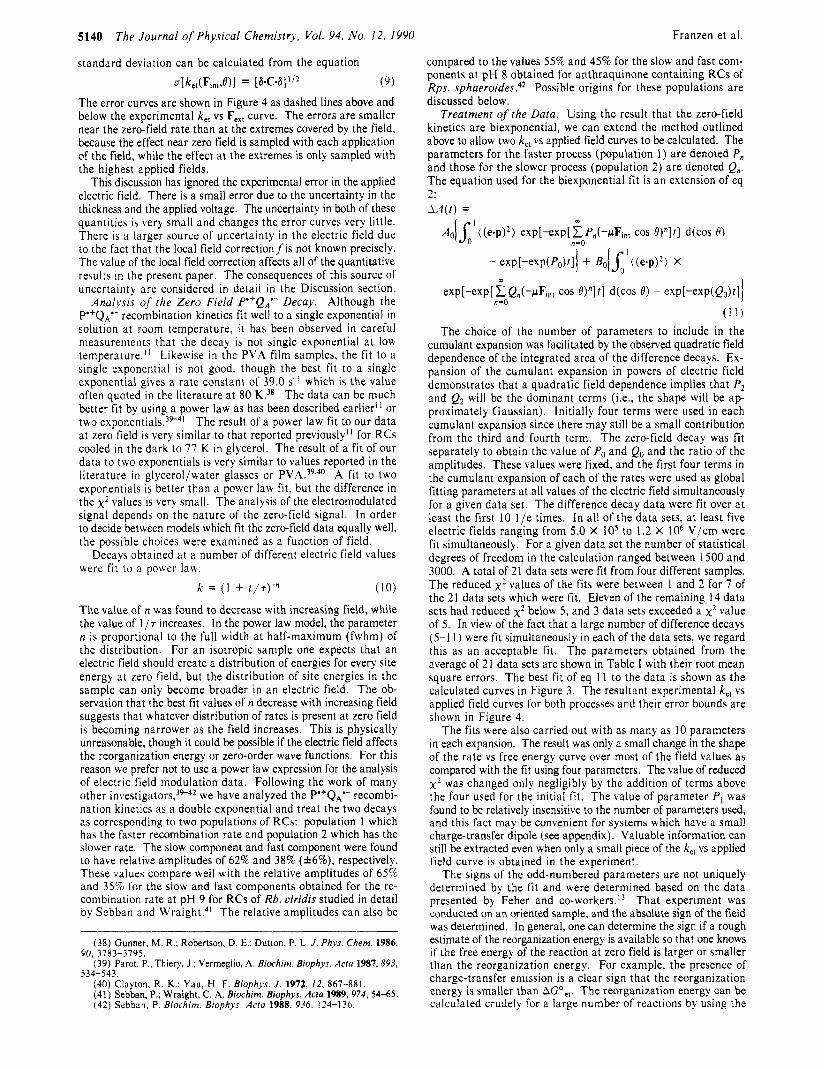
TIME (ms) Figure 3. Difference decay curves (field-on minus field-off) for P'+Q,'- charge recombination at 80 K. Data are shown for external fields (7.61, 8.57, 9.05, 9.52, 10.00. 10.47, 10.96, and 11.43) X IOs V/cm where increasing fields lead to larger differences relative to zero field. The smooth lines through the data were generated from the parameters ob- tained from the best f i t to all the data using a cumulant expansion in powers of !he field (Table I ) .
incidence. and the transient signal was measured with a silicon photodiode. For some experiments, the probe beam was a C W laser diode at 872 f 0.2 nm. The high voltage was gated on immediately following the excitation flash with a rise time of C50 ps.I'.'' The high voltage (between 400 and 1200 V depending on the sample thickness) was generated by amplifying the DAC (digital to analog converter) output of an IBM-XT computer with a TREK high-voltage amplifier (Model 609-3). Signal averaging was carried out either with an IBM data acquisition adapter in the PC or by triggering a Nicolet 1 180. both using a 12-bit ADC. Typically about 200 transients were averaged to achieve the necessary signal-to-noise ratio in excess of 1000: 1.
Results and Methods of Analysis The effects of increasing an applied electric field on the P'+QA'-
decay kinetics a t 80 K are shown in Figure 2. The bottom trace i n Figure 2 is the zero field data. The electric field modulation effect is small and grows as the applied field strength increases. I n Figure 3 the data are displayed as difference decays for field-on minus field-off (referred to as difference decays in the following).
( I 7 ) I f the field is applied during excitation, the data are complicated by the field effect on the charge-separation steps. The voltage was applied for 400 ms and then the bias was reversed for 400 ms in order to prevent space charge buildup.
(18 ) Popovic, 2. D.; Kovacs, G. J. ; Vincett, P. S.; Alegria. G.; Dutton. P. 1 Hin<hinr. Lliophys. Acta 1986, 851, 38-48.

Electric Field Modulation of ET rates The Journal of Physical Chemistry, Vol. 94, No. 12, 1990 5137
which are normalized to the zero field initial amplitude of the bleach. The decay is slower a t all times with the field on than with the field off for all field strengths. Note that the difference reaches a maximum a t slightly greater than one 1 / e time of a single-exponential fit to the data (see below). Differences as large as 7% of the initial amplitude are observed a t an applied field of 1.2 X lo6 V/cm. The effect is less than 1% for fields of less than 5.0 x I O 5 V/cm. Qualitatively similar results were obtained between 20 and 100 K, although the overall slowing down of the reaction is slightly larger at lower temperature. Markedly different results are observed a t higher temperatures due to charge re- combination via an activated pathway; this will be discussed in detail in a subsequent paper."
At the highest fields the difference decay does not return completely to a zero base line at long times. The difference decay was observed to return to a constant value after 15 1 /e times of the zero-field decay (one I / e time 25 ms for the purpose of discussion, see below). The offset was constant for as long as the field was applied. This was tested for times as long as 1.2 s (about 50 l / e times of the zero-field decay). The magnitude of the offset was 1.5% of the initial amplitude of the bleach at the highest field applied (1.2 X IO6 V/cm). When the field is turned off. the return of the electric-field-induced offset to the zero-field base line was observed to have a rate constant of roughly 100 s-'. I f the field is applied in the absence of a laser flash there was a gradual change in the signal on the millisecond time scale which was smaller than the offset observed in the presence of the flash. The origin of the effect is a t present uncertain. The base-line offset is both field and temperature dependent and is being investigated currently." I f i t can be shown that the offset is due to the change in equi- librium concentration of a known dipolar state in the presence of the field, such an offset can be used to calibrate the field strength. Measurements of this type are a potential means of determining the local field correction (discussed in detail below). The absorption Stark effect (see below) can be excluded as the origin of these offsets because traces with the field applied but without a laser flash showed no instantaneous change in absorption when the field was turned on. No change in the base line could be detected when a field of 1 X IO6 V/cm was applied to a blank PVA film prepared identically to the sample suggesting that the effect is not due to electrostriction. Electrostriction is given by the equation ( 1 / V)(6V/6Fe,,) = -( 1 /45~)(6t/SP)F,,,, where Vis the volume, P is the pressure. and t is the optical dielectric constant. Electrostriction may cause an offset due a change in the index of refraction of the PVA which would change the angle of re- fraction and therefore the path length through the sample. Re- gardless of the origin, it is clear that these offsets do not contribute to the change in the kinetics with an applied electric field, because the kinetic trace decays to a level which is constant over a time exceeding 25 I /e times of the zero-field decay (from 0.4 to 1.2 s). Therefore, the longtime base line was subtracted prior to calculation of the normalized difference decays. The subtracted base line was obtained by averaging 7 5 points a t a time longer than 0.4 s (i.e., at the longest time possible depending on the data set), thus requiring all of the difference decays to return to zero by about 0.4 s. The integrated area of the difference decays was found to be proportional to the square of the applied electric field. This field dependence alone indicates that the k,, vs AGO,, curve will have an approximately Gaussian shape. Although we refer to the functional form as k,, vs AGOet in the text, all figures depicting this dependence will show the logarithm of the rate as a function of free energy (log k,, vs AGO,,).
Approach fo Data Annlysis. We shall extract the form of the k,, vs F,,, curve from the raw data (difference decays) by assuming that this curve is well represented by a cumulant expansion (see below) and adjusting the cumulants for a best fit. This is justifiable a postiori by the fact that only a few cumulants are needed for a good fit. This method is completely general and can be used for any electron-transfer system. In order to interpret this par- ticular system we make the following common assumptions: ( i )
(19) Franzen, S.; Boxer, S. G. Manuscript in preparation
The field only affects the energy of the P'+QA'- state dipole; that is, possible effects of the field on the ground state, the reorgan- ization energy, and the zero-order electronic wave functions are ignored. We specifically address the electric field dependence of the electronic coupling matrix element due to coupled excited states to second order (superexchange) in the Discussion section. (ii) The interaction energy between the electric field and the P"QA'- dipole moment represents a contribution to the free energy of the charge separated state P'+QA'-. (iii) There are no other pathways in the decay of P'+QA'- to the ground state a t 80 K up to the highest fields; that is, we do not consider activated back reactions through other state^.^ (iv) Electron transfer is the rate-limiting step in the recombination of P*'QA'-.
The distribution of electron-transfer rates induced by the field is treated by using a cumulant expansion of each rate in powers of the energy of interaction AU between the P ' + Q A ' - dipole p and the electric field Fin,, where AU = -pFint cos 8, and 6 is the angle between p and the internal field Fin, (see below). A cumulant expansion is a statistical distribution function which represents deviations from a Gaussian distribution by adding terms of higher order than quadratic in the exponent. The modified rate constant a t a given orientation and field is given by
m
where the zero-field rate constant is given by k,,(F,,,, = 0) = exp(Po). Equation (1) is simply the representation of the logarithm of the rate constant by a general polynomial. The high-tem- perature limit of the k,, vs AGOet curve has a Gaussian form, and thus it is well represented by a cumulant expansion with terms up to A@. At lower temperatures the form of the dependence is not predicted to be purely Gaussian and this deviation can be represented by higher order terms in the cumulant expansion. The cumulants P, can be related to the moments of an expansion of the rate constant on powers of the free energy, and the shape of the curve they describe can be compared with the shape predicted by theory. This allows various theories and also levels of ap- proximation within one theory to be tested. The relationship between the moments and the cumulants is well-known in the stochastic rate theory,20 and it suggests that the number of mo- ments which can be obtained in any fit to theory cannot exceed the number of cumulants determined by the data analysis. The value of the linear term in the electric field PI (which is the slope of the rate vs energy curve a t zero field) can be simply related to the electrochemical transfer coefficient (see Appendix).
For the case that the P"QA'- decay rate constant is well de- scribed by a single exponential a t zero field, application of the field shifts the value of the decay rate constant to a new value depending on the angle 8. The experimentally observed difference decay curves can be fit to the orientation averaged difference decay function
1 AA(t ) = A o / x exp[-exp{E Pn(-pFint cos 8 ) n ] t ] d(cos 0) -
n=O
e x p [ - e x ~ o ) l ~ ) (2)
using the Marquardt algorithm for nonlinear least-squares fitting21 The parameter Po is obtained from the zero-field fit of the data to a single exponential. The parameters P, resulting from the fit describe the shape of the distribution of rates as a function of energy for the process. In the fit the sign of the even-numbered terms P,, P,, etc. is absolute, whereas all of the odd-numbered terms when multiplied by -1 give the same result. The correct sign can be determined by comparison with other information (the determination of the sign of the odd-numbered terms in the cu- mulant expansion is equivalent to determining the direction of orientation in an oriented sample). The parameters P, are obtained
(20) Van Kampen, N. G. Stochastic Processes in Physics and Chemistry; Elsevier Science: New York, 1981; pp 6-8.
(21) Press, W . H.; Flannery, 9. P.; Teukolsky, S. A,; Vetterling, W. T. Numerical Recipes; Cambridge University Press: London, 1988; pp 540-548.
5138 The Journal of Physical Chemistry, Vol. 94, No. 12. 1990 Franzen et al.
by fitting a set of difference decay curves obtained at many electric field values simultaneously and requiring that the parameters are globally valid for all of the fields. As long as the number of field values is large enough, the problem is overdetermined. We stress that the determination of the rate vs interaction energy curve determined in this way is an experimental quantity and is free from theoretical modeling. Starting with the data, which is de- scribed by a function of time AA(t), one obtains the distribution function k,,(F,J) which satisfies eq 2.
Local Field Correction. The internal field F,,, is the electric field actually experienced by the P'+QA'- dipole in the medium in response to the externally applied electric field F,,,. The internal field can in principle be related to the external field F,,, by the local field correction f (assumed to be a scalar):
In the absence of detailed information concerning the dielectric constant in the vicinity of the P'+QA'- dipole, estimation of the local field correction is problematic. The factor f is dependent on the model used (e.g.. spherical cavity approximationf= 3t/(2t + I ) ) . Variations of the spherical cavity approximation to include the geometry of the molecule are the most common expressions for the local field correction.22 An excellent discussion of the mathematical treatment of the effect of the local field on ex- perimental observables can be found in Liptay.23 The treatment of multiple dielectric constants is available in BottcherZ2 and in a detailed treatment by Pethig.24 Typical values of the local field correction for nonpolar molecules in a moderately polar solvent range between 1.0 and 1.3, using the spherical cavity approxi- mation.** I n this paper we will assumef= 1.0 for the purpose of calculation. The consequences of a local field correction not equal to 1 can be explored by scaling the experimental k,, vs F,,, curve once it is obtained. The reorientation of dipoles and the migration of charged groups in response to the P'+QA'- dipole also create an electric field, as does the static charge distribution in the RC; however, these contributions are present even at zero field and are therefore included in the experimental determination of AC'e,(Fexl=0).25-27 According to eq 3 when F,,, = 0, then F,,, = 0; F,,, = 0 does not mean that internal electric fields which are present in the absence of an external field are zero. Recently there have been both experimental and theoretical investigations of electric field effects that have treated the problem of the local field very differently.28s29 W e find no physical justification for these treatments and therefore will use the standard treatment outlined above.
There is a second issue which makes comparisons among results from different laboratories difficult. The externally applied field F,,, is equal to the applied voltage Vapp divided by the distance d between the electrodes (F,,, = Vapp/d). The most accurate determination of the electric field is obtained by measuring these two quantities directly as in the present paper. An alternate approach is to measure the sample capacitance and assume a value for the bulk dielectric constant in order to obtain the scmple thickness. This indirect approach I s perfectly valid; however, i t depends directly on the value assumed for the bulk dielectric constant (and that the sample thickness is homogeneous). Al- though the dielectric constant is well-known for simple homo- geneous materials, its value for more complex samples, e.g.. a hydrated Lanpmuir-Blodgett film as in ref 14. is not well-known.
Thus, particularly for hydrated samples, measurements of the sample thickness and F,,, via the capacitance may contain a substantial systematic error, much greater than the uncertainty infwhich must also be considered after the value for F,,, is known.
Angle Dependence. The formalism developed thus far is a general one for isotropic systems. Equation 2 is valid for isotropic systems if both the excitation and the probe light in an optical experiment are isotropic. In the case of RCs, excitation with 532-nm light (see Experimental Section) results in very nearly isotropic e x ~ i t a t i o n ; ~ ~ , ~ ' however, the probe beam is not isotropic. The absorption probability as a function of angle in the sample is not unity, and the appropriate correction must be applied.
The orientation averaged dot product of the electric vector of the probe light e and the transition dipole moment p is ( ( e . ~ ) ~ ) . I f the direction of the externally applied field is taken to define the Z axis in the lab frame and the P'+QA'- dipole vector lies along the 2 axis in the molecular frame, the angle connecting these two axes is 0. W e define the angle between the P'+QA'- dipole and the transition dipole moment of P as /3 in the molecular frame. The polarization of the probe beam is defined relative to the lab Z axis. The weighting factor for vertically polarized light is
(4)
Defining the angle x as the angle between the direction of propagation of the probe light and the external electric field vector, the weighting factor for horizontally polarized light is
((e, , .p)2) = sin2 p(I + cos2 0)/4 + cos2 sin2 O / 2
The angle @ was estimated from the crystal structure of Rp. uiridis to be 82',' using the assumption that the transition dipole moment of the primary electron donor lies in a plane parallel to the macrocycle planes and bisecting the angle between the monomeric Q, transition^.^^ The angle of incidence of the probe beam was 25' with respect to the normal of the sample surface which was corrected using Snell's law to calculate the refracted angle, yielding an experimental angle x equal to 16.4' (the index of refraction of the PVA was taken to be 1.5).33 For unpolarized probe light the angle-dependent factor is the average of (4) and ( 5 ) .
ilbsorption Stark Effect. If a probe beam whose bandwidth is narrow relative to the absorption bandwidth of P (fwhm = 580 cm-I) is used to probe the bleached absorption band of P (see Experimental Section), a pronounced absorption change is ob- served a t all times in the presence of an external electric field. This electric-field-induced absorption change was observed in the absence of the flash and has a rise time equal to that of the high voltage. The wavelength dependence of the offset was determined by using a monochromator and had the same zero crossings as the well-characterized absorption Stark e f f e ~ t . ~ ~ . ~ ~ Both this dc Stark effect and the conventional ac Stark effect were found to be quadratic in field. Although the absorption Stark effect can be accounted for quantitatively in the analysis of the difference decays, it complicates the analysis.36 The absorption Stark effect
(22) Bottcher, J . F. Theory of Dielectric Polarizafion, Elsevier: New
(23) Liptay, W. Z . Naturforsch. 1965, ZOa, 272-289. (24) Pethig, R. Dieleciric and Electronic Properties of Biological Mate-
( 2 5 ) Arata. H.; Nishimura, M. Biochim. Biophys. Acta 1983, 725.
(26) .&rata. H : Parson, W. W. Biochim. Biophys. Acra 1981. 638.
(27) Arata, H.; Parson, W. W. Biochim. Biophys. Acta 1981.636, 70-81. (28) Moser, C. C.; Alegria. G.: Gunner, M. R.; Dutton. P. L. Isr. J . Cheni
(29) Jortner, J . J Chem. Phys 1988. 92. 7148-7156.
York, 1973; Vol. 1.
rials; Wiley: Chichester, U.K., 1979.
394-401.
201 -209.
1988, 28, 133-139.
(30) Vermeglio, A.; Breton, J.; Paillotin, G.; Cogdell, R. Biochim. Biophys. Acfa 1978, 50/, 514-530.
(31) Boxer, S.; Chidsey, E. D.; Roelofs, M. G. Proc. Nori. Acad. Sci.
( 3 2 ) Zinth, W.; Sander, M.; Dobler, J.; Kaiser, W. Anrennas and Reaction Centers of Photosynthetic Bacteria; Springer-Verlag Series in Chemical Physics Vol. 42; Springer: New York, 1985; p 97-102.
(33) Polymer Handbook; Brandrup, J., Immergut, E. H., Eds.; Wiley-In- terscience: New York, 1975; p 111-242.
(34) Lockhart, D. J . ; Boxer, S. G. Biochemistry 1987. 26, 644-668. 2958. 0 5 ) Losche, M.; Feher. G.; Okamura, M. Y . Proc. )Vat/. Acad. Sci. U.S.A.
L,.S.A. 1982, 79, 4632-4636.
1987. 3 4 . 7537--7541
Electric Field Modulation of ET rates The Journal of Physical Chemis t ry , Vol. 94, No. 12, 1990 5139
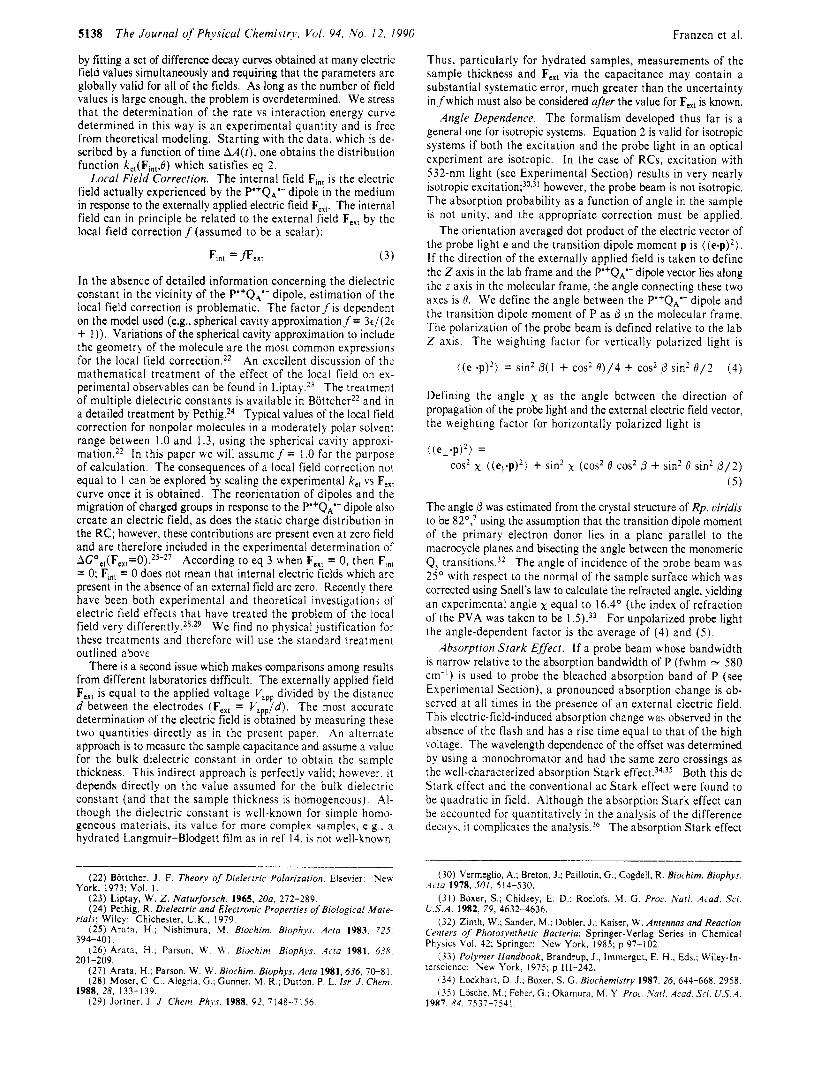
TABLE I: Terms in the Cumulant Expansion and Error Analysis" faster process 1 slower process 2
n P" UP (Pn)AGma," Qn up (QAAGma," 0 1.8785 0.011 39 1.8785 1.3319 0.01983 1.3319 1 -0.7283 0.06454 -0.2184 -0.3047 0.11827 -0.0914 2 -3.4882 0.10843 -0.3139 -1.8978 0.18700 -0.1708 3 -1.2335 1.50582 -0.0333 -6.6499 2.27641 -0.1795 4 4.5843 2.50575 0.0371 1.2136 3.54321 0.0098
"The terms P, are the parameters which fit the cumulant expansion for population 1 and Q, are those which fit for process 2 and are given in units of e V 1 . The root mean square error of each parameter is given in the columns up and up Columns 4 and 7 show the values of the terms when evaluated at the highest field. The interaction energy at the highest field is IAG,,,,,I = 0.3 eV. These two columns show the convergence of the series since the values represent the maximum value the term can have.
line shape of P is reasonably well approximated by the second derivative of the absorption; therefore, if the probe beam spectral bandwidth covers the entire absorption band, the absorption Stark effect averages to zero. At the highest applied field (1.2 X lo6 V/cm), using the broad-band probe centered at 880 nm (see Experimental Section), we observed an absorption change in the absence of an excitation laser flash which was less than 0.2% of the instantaneous absorption change produced by a saturating flash.
Optical detection of electromodulated kinetics will always be complicated by the effect of the electric field on the absorption spectrum. In particular, if the absorption Stark effect has a zeroth derivative ~omponent,~' the remedy of broad-band probe light used here may not be useful. Furthermore, the absorption Stark effect is present in an oriented sample as well as in an isotropic sample, and can, in fact, be much larger in an oriented sample than in an isotropic sample. In addition, unless the charge-transfer dipole in an oriented system is rigorously parallel to the applied electric field vector, orientation averaging is required in the analysis for an oriented sample as well. Popovic and c o - ~ o r k e r s ' ~ asserted that the absorption Stark effect makes a negligible contribution to the time dependence measured in Langmuir-Blodgett films; however, our measurements suggest that the absorption Stark effect is of the same order of magnitude as the effect on the kinetics. This may explain some of the differences between the results we have obtained (see below) and those in ref 14 and 15. The problem of the absorption Stark effect is nicely avoided by measuring the kinetic signal electrically in an oriented sample as has been done by Feher and c ~ - w o r k e r s . ~ ~ J ~ As mentioned earlier, their results also differed markedly from those in refs 14 and 15.
Error Ana lys i s . The error in the k,, vs AGO,, curve can be calculated from the parameters P , which are obtained as a result of the fit to all of the data sets. A data set is a set of averaged difference decay curves at five or more fields measured on a single sample. The parameters are estimated independently for each data set by using the Marquardt algorithm,21 as described earlier. I f the sample-to-sample scatter in the data is Gaussian noise then a weighted average of the parameters obtained from independent
(36 ) The angle between the difference dipole moment for absorption must be included along with the transition dipole moment and the charge-transfer dipole moment B described in the section on the angle dependence. This problem can be solved by using the band shift analysis of L i ~ t a y . ~ ~ It is most convenient to solve at the peak wavelength of the absorption band being monitored. The expression below is factored into (2) along with the angular factors for absorption probability
A(0) = A o ~ 2 ' d $ exp(-(4 In 2[K(Afin,.F) X
(cos 0 cos a + sin 0 sin a sin q5)/fwhm]*)1
where Apab is the difference dipole moment of the absorption band, fwhm is the full width half-maximum of the absorption band, a is the angle between difference dipole moment of the absorption and the charge-transfer dipole moment, Q is the azimuthal angle of the CT dipole, and the constant K converts the units to the same energy units of the measured fwhm.
(37) Liptay. W. Ber. Bunsen-Ges. Phys. Chem. 1976, 3, 207-217.
FREE ENERGY (cm-1) 2000 3000 4000 5000 6000
8 1 . 1 - 1 1 .or
- 1 . 0 -0.5 0.0 0.5 1.0
APPLIED FIELD (X 10-6 V/cm)
Figure 4. (A) Experimenral log k,, vs A G O s , curve for population 1 obtained from the best fit to the electromodulated kinetic data shown in Figure 3. (B) Experimental log k,, vs A G O , , curve for population 2 obtained from the best fit to the electromodulated kinetic data shown in Figure 3. The dotted curves above and below the best fit for each population represent the errors calculated by using eq 9 and the root mean square errors listed in Table 1. The abscissa is the absolute value of free energy (-AGO,,).
fits provides a good estimate of the parameters. We choose as the best estimate of P, the weighted average over M data sets
M M
I= I r = l p , = X P n , W r / X K (6)
where W, is the weight of each data set (equal to the total number of averaged decays in a data set). Although the Marquardt algorithm will generate a covariance matrix for each data set, we do not know that the assumption that the second derivative of x2 is linear will be satisfied.21 Assuming that the noise is Gaussian, the averaged values of the parameters obtained in (6) can be used to generate a covariance matrix.
M M
r = l I = I Cnm = C(Pm - pn)(Pmi - pm)Wt/CWi (7)
The variances, u2(P , ) = C,, are reported in Table I, but the full covariance matrix is used to calculate the error limits shown in Figure 4. The parameter u is the standard deviation of the distribution of P, values. This procedure has the advantage that, even if the values of the electric field in two data sets are not identical, it is possible to estimate the error of a large number of data sets simultaneously.
Given values for the covariance, the propagation of error in the expression for the cumulant expansion can be used to estimate the error in the resulting rate vs interaction energy curve a t each value of the electric field. The vector representing the change in the function value with respect to each parameter is the vector 6 of derivatives of the fitting function with respect to each of the parameters and the field. The derivatives are trivial for the parameters P , of the cumulant expansion
For each value of the interaction energy between the field and the charge-transfer dipole there will be an upper and a lower bound to the function value as calculated in ( I ) . The resulting bounding curves represent one standard deviation from the experimental curve at each point along that curve. The magnitude of the
5140
standard deviation can be calculated from the equation
The Journal of Physical Chemistry, Vol. 94, No. 12, 1990 Franzen et al.
(9)
The error curves are shown in Figure 4 as dashed lines above and below the experimental k,, vs F,,, curve. The errors are smaller near the zero-field rate than a t the extremes covered by the field, because the effect near zero field is sampled with each application of the field, while the effect at the extremes is only sampled with the highest applied fields.
This discussion has ignored the experimental error in the applied electric field. There is a small error due to the uncertainty in the thickness and the applied voltage. The uncertainty in both of these quantities is very small and changes the error curves very little. There is a larger source of uncertainty in the electric field due to the fact that the local field correction f is not known precisely. The value of the local field correction affects all of the quantitative results in the present paper. The consequences of this source of uncertainty are considered in detail in the Discussion section.
Analysis of the Zero Field P'+Q,'- Decay. Although the P'+QA'- recombination kinetics fit well to a single exponential in solution at room temperature, it has been observed in careful measurements that the decay is not single exponential at low temperature." Likewise in the PVA film samples, the fit to a single exponential is not good, though the best fit to a single exponential gives a rate constant of 39.0 s-I which is the value often quoted in the literature at 80 K.38 The data can be much better fit by using a power law as has been described earlier" or two exponential^.^^^' The result of a power law fit to our data at zero field is very similar to that reported previously" for RCs cooled in the dark to 77 K in glycerol. The result of a fit of our data to two exponentials is very similar to values reported in the literature in glycerol/water glasses or PVA.39,40 A fit to two exponentials is better than a power law fit, but the difference in the x 2 values is very small. The analysis of the electromodulated signal depends on the nature of the zero-field signal. In order to decide between models which fit the zero-field data equally well, the possible choices were examined as a function of field.
Decays obtained at a number of different electric field values were f i t to a power law:
k = ( 1 + t / r ) - n (10)
The value of n was found to decrease with increasing field, while the value of 1 / T increases. In the power law model, the parameter n is proportional to the full width at half-maximum (fwhm) of the distribution. For an isotropic sample one expects that an electric field should create a distribution of energies for every site energy at zero field, but the distribution of site energies in the sample can only become broader in an electric field. The ob- servation that the best fit values of n decrease with increasing field suggests that whatever distribution of rates is present at zero field is becoming narrower as the field increases. This is physically unreasonable, though it could be possible if the electric field affects the reorganization energy or zero-order wave functions. For this reason we prefer not to use a power law expression for the analysis of electric field modulation data. Following the work of many other i n v e ~ t i g a t o r s , ~ ~ ~ ~ we have analyzed the P'+QA'- recombi- nation kinetics as a double exponential and treat the two decays as corresponding to two populations of RCs: population 1 which has the faster recombination rate and population 2 which has the slower rate. The slow component and fast component were found to have relative amplitudes of 62% and 38% (*6%), respectively. These values compare well with the relative amplitudes of 65% and 35% for the slow and fast components obtained for the re- combination rate at pH 9 for RCs of Rb. viridis studied in detail by Sebban and W r a i g h ~ ~ ~ The relative amplitudes can also be
(38) Gunner, M. R.; Robertson, D. E.; Dutton. P. L. J . Phys. Chem. 1986,
(39) Parot. P.: Thiery, J.: Vermeglio, A. Biochim. Biophys. Acta 1987,893,
(40) Clayton, R. K.; Yau, H F. Biophys. J. 1972, 12, 867-881. (41) Sebban, P.; Wraight, C , A. Biochim. Biophys. Acta 1989, 974, 54-65. (42) Sebban. P. Biochim. Biophys. Acra 1988, 936. 124-136.
90, 3783-3795.
534-543.
compared to the values 55% and 45% for the slow and fast com- ponents a t pH 8 obtained for anthraquinone containing RCs of Rps. s p h a e r o i d e ~ . ~ ~ Possible origins for these populations are discussed below.
Treatment o f the Data. Using the result that the zero-field kinetics are biexponential, we can extend the method outlined above to allow two k,, vs applied field curves to be calculated. The parameters for the faster process (population I ) are denoted P, and those for the slower process (population 2) are denoted Q,. The equation used for the biexponential fit is an extension of eq 2: AA( t ) =
- exp[-exp(~O)r~l+ ~ o ! ~ ' ( ( e . p ) 2 ) x
exp[-exp[ 2 Qn(-wFlnt cos 0)"Itl d(cos 0) - exp[-exp(Q~)zl)
( 1 1 ) The choice of the number of parameters to include in the
cumulant expansion was facilitated by the observed quadratic field dependence of the integrated area of the difference decays. Ex- pansion of the cumulant expansion in powers of electric field demonstrates that a quadratic field dependence implies that P2 and Q2 will be the dominant terms (i.e., the shape will be ap- proximately Gaussian). Initially four terms were used in each cumulant expansion since there may still be a small contribution from the third and fourth term. The zero-field decay was fit separately to obtain the value of Po and Qo and the ratio of the amplitudes. These values were fixed, and the first four terms in the cumulant expansion of each of the rates were used as global fitting parameters at all values of the electric field simultaneously for a given data set. The difference decay data were fit over a t least the first 10 I / e times. In all of the data sets, at least five electric fields ranging from 5.0 X IO5 to 1.2 X lo6 V/cm were fit simultaneously. For a given data set the number of statistical degrees of freedom in the calculation ranged between 1500 and 3000. A total of 21 data sets were fit from four different samples. The reduced x 2 values of the fits were between 1 and 2 for 7 of the 21 data sets which were fit. Eleven of the remaining 14 data sets had reduced x 2 below 5, and 3 data sets exceeded a x2 value of 5. In view of the fact that a large number of difference decays (5-1 1) were fit simultaneously in each of the data sets, we regard this as an acceptable fit. The parameters obtained from the average of 21 data sets are shown in Table I with their root mean square errors. The best fit of eq 1 1 to the data is shown as the calculated curves in Figure 3. The resultant experimental k,, vs applied field curves for both processes and their error bounds are shown in Figure 4.
The fits were also carried out with as many as 10 parameters in each expansion. The result was only a small change in the shape of the rate vs free energy curve over most of the field values as compared with the fit using four parameters. The value of reduced x2 was changed only negligibly by the addition of terms above the four used for the initial fit. The value of parameter P, was found to be relatively insensitive to the number of parameters used, and this fact may be convenient for systems which have a small charge-transfer dipole (see appendix). Valuable information can still be extracted even when only a small piece of the k,, vs applied field curve is obtained in the experiment.
The signs of the odd-numbered parameters are not uniquely determined by the fit and were determined based on the data presented by Feher and co-workers.13 That experiment was conducted on an oriented sample, and the absolute sign of the field was determined. In general, one can determine the sign if a rough estimate of the reorganization energy is available so that one knows if the free energy of the reaction at zero field is larger or smaller than the reorganization energy. For example, the presence of charge-transfer emission is a clear sign that the reorganization energy is smaller than SG',,. The reorganization energy can be calculated crudely for a large number of reactions by using the
n=O
Electric Field Modulation of ET rates The Journal of Physical Chemistry, Vol. 94, No. 12, 1990 5141
activation energy obtained from the temperature dependence.
Discussion Experiments designed to probe the dependence of rate on free
energy have often relied upon comparisons of different donor/ acceptor pairs with different free energies of reactiom2 Each donor/acceptor pair represents a point on the k,, vs AGO,, curve. The experimental results in Figure 4 give a continuous rate vs free energy curve using the assumption that the interaction energy in the field is AU = -pF cos 0 and the interaction energy is equal to the change in free energy (see next section). The information in Figure 4 can be used to study the details of coupling in the electron-transfer system and to examine the applicability of different theories of electron transfer.
The curves shown in Figure 4 show that the faster rate is more sensitive to the electric field. In both cases the reorganization energy is not equal to the free energy of reaction. One can conclude immediately that charge recombination in RCs is not activationless38 as has been often assumed due to its mild tem- perature d e p e n d e n ~ e . ~ ~
The experimental curves in Figure 4 are smooth and lack features that might indicate quantum interference effects." The fit to a large number of parameters (IO for each process) in the cumulant expansion failed to show evidence of well-defined structure in the k,, vs electric field curve. The slower rate process of population 2 has a more peculiar electric field dependence than that of population 1 . However, the shape of the curve due to population 2 does not resemble vibrational structure. This ob- servation suggests that strong coupling to a single high-frequency mode will not account for the data.
General Theoretical Considerations. The experimental results in Figure 4 show the change in rate as an external electric field is applied. The top axis in Figure 4 is the interaction energy of the P'+Q,'- dipole in the field. If the local field correction has a value other than unity or the magnitude of the P'+Q,'- dipole moment were different from that calculated by using the crystal structure the result could be scaled by multiplying the abscissa by the appropriate factor.
I f the electric field does not introduce a volume change or a change in the frequencies of the vibrations relevant to the elec- tron-transfer reaction, the internal energy change due to the internal field will be equal to the free energy change due to the internal field. Electrostriction due to the external field is a bulk phenomenon which affects both the initial and final states equally in a sufficiently dilute sample, and therefore the volume change due to electrostriction can be neglected. The interaction of the field with microscopic volume changes in the RC itself is a t present unknown, and we will assume that they are negligible in a polymer matrix a t low temperature. In accordance with assumption (i) discussed a t the outset it is assumed that the wave functions in the molecules are not significantly perturbed by the external field and therefore their vibrational frequencies are not altered. As a result the equation
A w l " , ) = AU(Fl",) (12) will be assumed to hold as stated in assumption (ii).
The quantities in the rate constant which are dependent on the free energy will be affected by the external field. By use of the Fermi Golden Rule expression and the Born-Oppenheimer ap- proximation the rate constant for electron transfer can be ex- pressed'.2 as
where V is the electronic coupling matrix element (p is the electronic factor) and FC is the vibrational overlap integral squared (Franck-Condon factor). The dependence of the Franck-Condon factors on AGO,, is described by all electron-transfer theories. The location of the transition state in the space of the nuclear coor- dinates is also dependent on AGO,,. The electronic matrix element
(43) Bixon, M.; Jortner, J . J. Phys. Chem. 1986, 90, 3795-3800. (44) Sarai, A. Chem. Phys. Leu. 1979, 63, 360-366.
Vis proportional to the overlap of the electronic wave functions which are a function of the nuclear coordinates. Consequently, V itself may depend on AGO,, which is a breakdown of the Condon a p p r o x i m a t i ~ n . ~ ~ , ~ ~ In such cases, 13 is no longer valid because it is not possible to separate the electronic and nuclear terms.
The experimental results yield information which pertains to both the electronic and vibrational parts of the rate expression in ( 1 3). The experimental rate vs free energy curve can be compared to the shape of theoretical models for the FC factor or a model including the free energy dependence of the super- exchange matrix element.
Free Energy Dependence of the Franck-Condon Factors. There are a variety of levels of approximation which can be used to calculate the FC factors. W e first consider the Marcus theory (dielectric continuum theory)47 with
k,, = p ( 4 r 2 / h ) ( 1 / [4rXkT]i /2) exp[-(A + AGo)2/4hkT] (14)
where X is the reorganization energy. To allow inclusion of high-frequency vibrational modes one can use a multiphonon linear coupling model for calculating the Franck-Condon factors (as- suming no frequency shift^):^^,^^
k,, = p ( 4 r 2 / h ) x : d t explf(t) + iAGOt) (15)
f(t) = m
j = l cSi(ui + 1) exp(ihwit) + Sivj exp(-ihwit) - SJ(2vJ + 1) (16)
Expression 16 is derived from (13) by using the correlation function approach to obtain the Franck-Condon factors49 assuming the difference in reactant and product potential surfaces is a function of nuclear position shifts only. In expression 16 Si is the nuclear coupling parameter of mode j and w j is the frequency of that mode. The energy gap between the donor and acceptor is AGO. The thermal population of the mode is given by vi:
(17) uJ = [exp(hw,/kT) -- 11-l
Equation 14 is derived from (16) when k T >> hw for all modes and the saddle-point approximation is used (discussed below). In (14) the reorganization energy X is equal to the sum of couplings and frequencies in (16): X = xSihwJ.
The calculation of Franck-Condon factors with linear coupling has been accomplished by two approaches in this paper. First, the rate vs free energy curve can be fit to a modified Bessel function (eq 15 is the generating function for the modified Bessel function) as proposed first by Levich and DogonadzeS0 and later adapted to biological systems by J ~ r t n e r . ~ ~
k,, = ( 8 r 3 p / h 2 w , ) exp[-S,(Zu, + 1) -- S(2u + l ) ] X m
E [ ( v + l)"""~rp,,,{2S,[v,(u~ + 1)]1'2] x m=O
[ ( u + I ) / V ] " ' ~ ~ I ~ { ~ S [ ~ ( V + 1 ) ] ' / 2 ) (18)
where I, is the modified Bessel function of order m and p(m) = (AGO,, - mhw)/hw,. The restriction that m must be an integer is required by conservation of energy and results in a finite transition probability for discrete values of the energy gap AGO,,. The k,, vs AGO,, curve is then a series of delta functions describing energies at which electron transfer is allowed. In condensed media there will be some amount of damping due to the spectrum of phonon frequencies (density of states) in the solvent which will
(45) Ulstrup, J. Charge Transfer Processes in Condensed Media; 1979, Lecture Series in Chemistry Vol. 10; Springer Verlag: New York, 1979.
(46) Beratan, D.; Hopfield, J . J . J. Chem. Phys. 1984, 81, 5753-5761. (47) Marcus, R. A. J. Chem. Phys. 1965, 43, 679-701. (48) Jortner, J . J. Chem. Phys. 1976, 64, 4860-4867. (49) Fischer, S. J. Chem. Phys. 1970, 53, 3195-3207. (50) Levich, V . G . ; Dogonadze, R . R. Dokl. Akad. Nauk S.S.S.R. 1959,
124, 123-126.

5142 The Journal of Physical Chemistry, Vol. 94, No. 12, 1990 Franzen et al.
give width to the delta function transition probability. One common calculational approach is simply to use the modified Bessel function of noninteger order for the low-frequency modes as proposed by J ~ r t n e r . ~ * It is assumed that the density of states is determined solely by the lowest frequency mode (w,) in the equation. In theory, the modified Bessel function approach can be used to calculate the coupling of an electron-transfer reaction to an arbitrary number of modes. The form given in eq 18 is a two-mode function where s is the low-frequency mode. The approach is limited to two modes for convenience because cal- culation with the modified Bessel function requires a matrix with as many dimensions as modes. Equation 18 predicts that there will be vibronic structure due to quantum interference effects in the rate as a function of free energy whenever hw >> k T .
The integral in ( 1 5) can also be solved approximately by using the saddle-point a p p r ~ x i m a t i o n . ~ ~ The saddle point can be com- puted by taking the derivative of the exponent in ( 1 5) with respect to t and then solving for r S p the point on the imaginary axis which represents the first saddle point. Substituting back into the ex- pression, the saddle-point approximation for the value of the integral becomes
The saddle-point method predicts that there will be no vibronic structure. Physically this is equivalent to assuming that one is in the limit where the coupling to the medium is large.5' I n practice this is accomplished by only taking the first saddle point in the calculation. Damping due to medium effects is then as- sumed to eliminate the remaining saddle points. Explicit calcu- lation of damping due to coupling to the medium is not included in either of the linear coupling models used here.52 It is unlikely that damping due to the medium will be large relative to the high-frequency modes coupled to most electron-transfer reactions. The smooth shape of the saddle-point approximation can also be interpreted as being due to the cancellation of the vibrational structure of a number of high-frequency modes. The frequency values w j obtained from a least-squares fit using two modes rep- resent average values of the high-frequency modes. The couplings S, obtained represent the sum of the couplings of the high-fre- quency modes which have an average frequency wj . We shall use this interpretation for the purpose of the discussion below.
Comparison of Data with Theoretical Models o f the Franck- Condon Factors. The Marquardt algorithm was used to fit the expressions for the Franck-Condon factors to the experimental k,, vs AGO,, curve. The derivatives of all of the functions in the previous section can be calculated analytically. The Marcus theory has only one fitting parameter (the reorganization energy A) and is extremely easy to implement. The modified Bessel function has complicated derivatives and is a slow method of fitting even for two modes. An arbitrary number of modes can be readily fit by using the saddle-point approximation. The saddle-point nonlinear least-squares fitting program can easily be adapted to include frequency shifts, mode rotations, and non-Condon effects if the data warrant more extensive analysis. In practice we limited consideration of the fitting to only two modes because with four cumulants obtained in the data analysis using eq 10 we are limited to the information contained in the first four moments in a free energy expansionz0 of the expression for the rate constant (eq 15). The nth moment is the nth derivative of the functionf(t) i n eq 16. Knowledge of' the first four moments uniquely defines two coupling constants and two frequencies. The results of nonlinear least-squares fitting were corroborated by the moment analysis for the fits with linear coupling (position shifts only) by solving for the moments using the parameters S, and w j and then cal- culating the expected rate constant as a function of AGO,,.
I t i s worth noting that the effect of an electric field is much
TABLE 11: Parameters from the Fit of the Experimental k,, vs AGO,, Curve to the Linear Coupling Model Using the Saddle-Point Approximation"
population I population 2 ( k , = 75.6 S K I ) ( k , = 21.5 s-l)
Linear Coupling Two Modes s, 2.76 f 0.10 1.88 f 0.05 wI, cm-' I5 16.0 f 50.0 2434.0 f 90.0
wz, cm-' 50.0 f 3.1 199.0 f 6.0 reduced x2 0.58 0.50
s2 39.4 f 0.4 13.1 f 0.10
"The standard deviations of the parameters were calculated from the covariance matrix of the fit. All fits assume -AGO,, = 4194 cm-I.
TABLE 111: Parameters from the Fit of the Experimental k, vs AGO,, Curve to the Linear and Quadratic Coupling Model with Two Modes Using the Saddle-Point Approximation"
population I population 2 ( k , = 75.6 s-l) ( k , = 21.5 s?)
Quadratic Coupling Two Modes SI 2.90 * 0.15 1.71 f 0.03 q. cm-' 1416.0 f 62.0 2574.0 f 125.0 s, 42.8 f 2.7 11.4 f 1.5 wZR, cm-' 51.8 f 3.4 288.7 f 3.0
K 0.67 0.7 I reduced xz 0.24 0.42
wzp, cm-' 42.5 f 1.9 243.3 f 2.2
"The values of the modes in the reactants state and the products state a re w R and up, respectively. The standard deviations of the pa- rameters were calculated from the covariance matrix of the fit. All fits assume -AG",, = 4 I94 cm-'.
for both populations of RCs. Dielectric continuum theory is the high-temperature limit of the theories for calculating the Franck-Condon factors (Le., it assumes k T >> hw for all modes), and it is not surprising that this theory does not fit data obtained a t 80 K. Although the integrated field dependence of the data suggests a Gaussian form for the k , vs hG0, curve and the Marcus theory also has Gaussian shape, the fwhm of the two Gaussians is substantially different as seen in Figure 5A. The fact that the high-temperature approximation (dielectric continuum theoryj does not fit the data suggests that hw >> k T ( k T = 55 cm-I) for a majority of the modes coupled to the reaction.
F i f f o r the Faster Process. The fit to the experimental k,, vs AGO,, curve for the faster process using dielectric continuum theory is shown i n Figure SA along with the fit using the saddle-point a p p r o x i m a t i ~ n . ~ ~ Although the fit using dielectric continuum theory is very far from the experimental result, it converges to a reorganization energy of 4530 cm-l for this process, which is 330 cm" larger than AGO,, (-4200 cm-I). The nonlinear least-squares fit of the data to the modified Bessel function is very poor because the data lack the structure which is present in a tho-mode fit to that model. A simulation using the Bessel function with the parameters obtained in the saddle point fit is depicted in Figure 6A. The interference effects seen in Figure 6A would undoubtedly be cancelled out if one included more modes with different frequencies in the model.43 As already discussed, this is a formidable computational task for nonlinear least-squares fitting of the data due to the fact that for N modes an N-di- mensional matrix is required. The best fit using the saddle-point approximation is very good if two modes are used, a low-frequency mode of SO cm-' and a high-frequency mode of I510 cm-'. The high-frequency mode can best be interpreted as the average of a number of different vibrational frequencies near 1 SI0 cm-I. The structure inherent in each mode (as described by eq 18) is cancelled due to interference between the modes.
smaller than would-be predicted by dielectric continuum theory (53) We have assumed that AGO,, at 80 K is equal to the room tempera-
ture value. The assumption that AGO,, is temperature independent has often been made3* in view of conflicting evidence on the magnitude of the entro- py.25-27 I f AGO,, depends on temperature, the meaning of chemical substi- tution experiments becomes doubtful since each different species will have a different entropy (e.g. anthraquinone and ubiquinone in ref 54) .
-____ ( 5 1 ) Kuznetsov. A. M.; Ssndergilrd, N. C.: Ulstrup. J Chem. Phys. 1978,
( 5 2 ) Dogonadze, R. R.; Kuznetsov. A. M.; Vorotyntsev. M. A.; Zaqaraia. 29, 383-390.
M. G. J . Electroanal. Chem. 1977. 75. 315-337

Electric Field Modulation of ET rates The Journal of Physical Chemistry, Vol. 94, No. 12, 1990 5143
FREE ENERGY (eV) 0 .3 0 .4 0.5 0.6 0 .7 0 .8
B 1 . 5 -
1 . 0 !;;/ \ 1
-2
2000 3000 4000 5000 6000 FREE ENERGY (cm-1)
Figure 5. (A) Fits using theories of electron transfer to the experimental log k,, vs AGO, curve for population 1 (-). (B) Fits to the experimental log k,, vs AGO,, curve for population 2 (-). The parabolic curves in both panels indicate dielectric continuum theory (--). The two curves that closely fit the data are the linear coupling ( - - - ) and quadratic coupling (---) models using the saddle-point approximation with two modes. The abscissa is the absolute value of free energy (-AGOe,).
The data were also fit to a model in which vibrational frequency shifts were included as well as position shifts. The functional form off(t) in eq 16 was altered to include quadratic coupling and the saddle point is calculated by using this new function in eq 19. The modes are separable and in this case the function can be adapted for nonlinear least-squares fitting as well. In the calculation, only the low-frequency mode is allowed to have a frequency shift. This is reasonable on physical grounds (Le., a low-frequency or solvent mode is more dependent on the charge distribution than high- frequency intramolecular modes), and it avoids the problem of small frequency shifts in high-frequency modes which are mathematically difficult to handle because the saddle point is often too near to a pole in such cases. The results of such a fit for two modes are shown in Table 111. There is a substantial shift in the frequency of the 50-cm-I mode. This is consistent with predictions of the shapes of the reactants and products potential surfaces discussed below in the superexchange section.
The estimated error in the parameters in fits to theoretical models was obtained by using the value of the covariance matrix from the fit to the shape in Figure 4A with the standard deviation in each point given by the upper dashed minus the lower dashed curve in Figure 4A. These errors are very small and the major uncertainty in the values of the modes resides in the uncertainty in the true value of the internal electric field, which is considered in detail below. The value of the local field correction will change the quantitative result but not qualitative comparisons of the results for the two populations of RCs.
Fit for the Slower Process. The k,, vs AGO, curve for the slower process is not fit well by the Marcus model or by two modes using the modified Bessel function approach. The saddle-point method can be used to show that high-frequency modes with an energy in excess of 2000 cm-' may be coupled to this electron-transfer process. The parameters from the best fit of both processes to a two-mode linear coupling model are shown in Table 11. The process in population 2 clearly has a broader fwhm in Figure 4B than population 1 in Figure 4A. This larger fwhm implies a larger reorganization energy (e.g., in Marcus theory fwhm a [4Xk77'i2). The reorganization energy for population 2 obtained from the fit
1 . 5 -
1 . 4 '
w 1 . 3 - I-
Y
g 1 . 2 - - 1.1 -
1 . 0 - / --,
2000 3000 4000 5000 ' 6000
FREE ENERGY (cm-1) Figure 6. (A) Modified Bessel function model (--) plotted along with the experimental k,, vs AGO,, curve for population 1. (B) Modified Bessel function model (--) plotted along with the experimental k,, vs AGO,, curve for population 2. The smaller oscillatory function in each panel (---) was calculated from the formula a log (keosscl) + (1 - a) log (ksaddlc). The coupling constants and frequencies used to calcualte the Bessel function and saddle-point function were obtained from the two- mode fit in Table 11. In part A the high-frequency mode is 1510 cm-' and low-frequency mode is 50 cm-' and in part B the high-frequency mode is 2450 cm? and the low-frequency mode is 200 cm-l. The abscissa is the absolute value of free energy (-AGo,,).
to the saddle-point approximation is larger than that for population 1 (assuming that AGOet at zero field is the same for both processes). As shown in Table 11, if two modes are fit to the data, the im- portant modes for population 2 include a 200-cm-' mode and higher frequency mode of 2450 cm-I. If two modes with a fre- quency shift in the low-frequency mode are fit to the data, the values of the modes are similar to the two-mode model without frequency shifts as shown in Table 111. The frequency shift obtained from the best fit to the data is approximately 20% of the value of the reactant's frequency and is thus similar in both populations 1 and 2. The model with one frequency shift is capable of fitting the data much better than the models which lack fre- quency shifts.
Comparison of the data with calculations of the Franckxondon factors leads to the conclusion that the smaller electric field dependence of the rate for population 2 is due to coupling to a mode with a higher frequency. The upturn observed for the slower process at high AGO,, cannot be accounted for by either of the methods of calculation employed here. The upturn is well within the experimental error, and its interpretation may be facilitated by data at different temperature^.'^ This upturn does not greatly affect the numerical results obtained, although it does worsen the value of x2 in the fit.
The shape predicted by the modified Bessel function (eq 18) for this process is shown as the curve with large oscillations in Figure 6B. In order to demonstrate the sensitivity of the difference decays to quantum mechanical interference effects inherent in eq 18, difference decays were simulated for a double-exponential process using the parameters obtained from the fit to two modes substituted into eq 18, the Bessel function expression, and eq 19, the saddle-point approximation at fields of (2.0,4.0, 6.0, 8.0, 10.0, and 12.0) X 1 Os V/cm. The difference between these calculated difference decays and the experimental ones can be seen by comparing the simulations in Figure 7 to the data in Figure 3.
The Journal of Physical Chemistry, Vol. 94, No. 12. 1990 Franzen et ai. _ _ _ -
A r \
0.06 \
0.06- \ i
0.04k \
_-__. d-.-- i .- . ~
0 1 2 3 4 5 6 7 8 9 Time (lie)
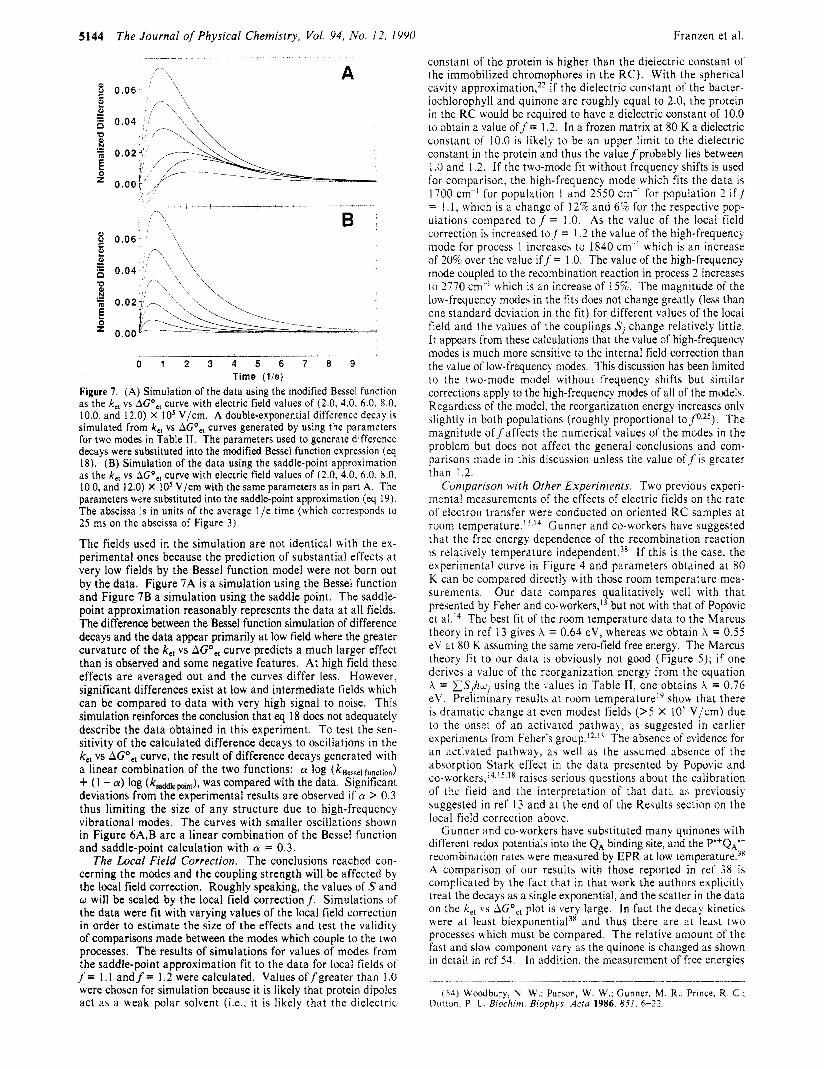
Figure 7. (A) Simulation of the data using the modified Bessel function as the k,, vs AGO,, curve with electric field values of (2.0, 4.0. 6.0, 8.0, 10.0, and 12.0) X I O 5 V/cm. A double-exponential difference decay is simulated from k,, vs AGO,, curves generated by using the parameters for two modes in Table I I . The parameters used to generate difference decays were substituted into the modified Bessel function expression (eq 18). (B) Simulation of the data using the saddle-point approximation as the k,, vs A G O , , curve with electric field values of (2.0, 4.0, 6.0, 8.0. 10.0, and 12.0) X IO5 V/cm with the same parameters as in part A. The parameters were substituted into the saddle-point approximation (eq 19). The abscissa is in units of the average l /e time (which corresponds lo 25 ms on the abscissa of Figure 3).
The fields used i n the simulation are not identical with the ex- perimental ones because the prediction of substantial effects a t very low fields by the Bessel function model were not born out by the data. Figure 7A is a simulation using the Bessel function and Figure 7B a simulation using the saddle point. The saddle- point approximation reasonably represents the data a t all fields. The difference between the Bessel function simulation of difference decays and the data appear primarily a t low field where the greater curvature of the k,, vs AGO,, curve predicts a much larger effect than is observed and some negative features. At high field these effects are averaged out and the curves differ less. However, significant differences exist a t low and intermediate fields which can be compared to data with very high signal to noise. This simulation reinforces the conclusion that eq 18 does not adequately describe the data obtained in this experiment. To test the sen- sitivity of the calculated difference decays to oscillations in the k,, vs AGO,, curve, the result of difference decays generated with a linear combination of the two functions: cy log (ksessel function) + (1 - a) log (kssddleMnt), was compared with the data. Significant deviations from the experimental results are observed if cy > 0.3 thus limiting the size of any structure due to high-frequency vibrational modes. The curves with smaller oscillations shown in Figure 6A,B are a linear combination of the Bessel function and saddle-point calculation with cy = 0.3.
The Local Field Correction. The conclusions reached con- cerning the modes and the coupling strength will be affected by the local field correction. Roughly speaking, the values of S and w will be scaled by the local field correctionf. Simulations of the data were fit with varying values of the local field correction in order to estimate the size of the effects and test the validity of comparisons made between the modes which couple to the two processes. The results of simulations for values of modes from the saddle-point approximation fit to the data for local fields of f= 1 . 1 and /= 1.2 were calculated. Values offgreater than 1.0 were chosen for simulation because it is likely that protein dipoles act as a weak polar solvent (i.e., i t is likely that the dielectric
constant of the protein is higher than the dielectric constant of the immobilized chromophores in the RC). With the spherical cavity approximation,22 i f the dielectric constant of the bacter- iochlorophyll and quinone are roughly equal to 2.0, the protein i n the RC would be required to have a dielectric constant of 10.0 to obtain a value o f f = 1.2. In a frozen matrix at 80 K a dielectric constant of 10.0 is likely to be an upper limit to the dielectric constant in the protein and thus the valuefprobably lies between 1.0 and 1.2. I f the two-mode fit without frequency shifts is used for comparison, the high-frequency mode which fits the data is 1700 cm-' for population 1 and 2550 cm-! for population 2 i f j = i .1, which is a change of 12% and 6% for the respective pop- ulations compared to f = 1 .O. As the value of the local field Correction is increased t o f = 1.2 the value of the high-frequency mode for process I increases to 1840 cm-' which is an increase of 20% over the value i f f = 1 .O. The value of the high-frequency mode coupled to the recombination reaction in process 2 increases to 2770 cm-' which is an increase of 15%. The magnitude of the low-frequency modes in the fits does not change greatly (less than one standard deviation in the fit) for different values of the local field and the values of the couplings S, change relatively littie. It appears from these calculations that the value of high-frequency modes is much more sensitive to the internal field correction than the value of low-frequency modes. This discussion has been limited to the two-mode model without frequency shifts but similar corrections apply to the high-frequency modes of all of' the models. Regardless of the model, the reorganization energy increases only slightly in both populations (roughly proportional The magnitude offaffects the numerical values of the modes in the problem but does not affect the general conclusions and com- parisons made in this discussion unless the value o f f i s greater than 1.2.
Comparison with Other Experiments. Two previous experi- mental measurements of the effects of electric fields on the rate of electron transfer were conducted on oriented KC samples a t room t e m p e r a t ~ r e . ~ ~ , ' ~ Gunner and co-workers have suggested that the free energy dependence of the recombination reaction is relatively temperature i n d e ~ e n d e n t . ~ ~ I f this is the case. the experimental curve in Figure 4 and parameters obtained a t 80 K can be compared directly with those room temperature mea- surements. Our data compares qualitatively well with that presented by Feher and c o - ~ o r k e r s , ' ~ but not with that of Popovic el aI.l4 The best fit of the room temperature data to the Marcus theory in ref 13 gives X = 0.64 eV, whereas we obtain X = 0.55 eV at 80 K assuming the same zero-field free energy. The Marcus theory fit to our data is obviously not good (Figure 5); if one derives a value of the reorganization energy from the equation X = xS,hu, using the values i n Table 11, one obtains X = 0.76 eV. Preliminary results at room t e m p e r a t ~ r e ' ~ show that there is dramatic change a t even modest fields (>5 X IO5 V/cm) due to the onset of an activated pathway, as suggested in earlier experiments from Feher's group.!*." The absence of evidence for an activated pathway, as well ds the assumed absence of the absorption Stark effect in the data presented by Popovic and c o - w o r k e r ~ , ' ~ ~ ! ~ ~ ' ~ raises serious questions about the calibration of the field and the interpretation of that data previouslj suggested in ref 13 and at the end of the Results section on the local field correction above.
Gunner and co-workers have substituted many quinones with different redox potentials into the QA binding site, and the P'+QA'- recombination rates were measured by EPR a t low t e m p e r a t ~ r e . ~ ~ A comparison of our results with those reported in ref 38 is complicated by the fact that i n that work the authors explicitly treat the decays as a single exponential, and the scatter in the data on the k,, vs Xa,, plot is very large. In fact the decay kinetics were a t least biexponentia138 and thus there are 21. least two processes which must be compared. The relative amount of the fast and slow component vary as the quinone is changed as shown in detail in ref 54. In addition, the measurement of free energies
(54 ) Woodbury, N . W.; Parson, W. W.; Gunner, M. R.: Prince. R . C.; Dutton. P. L . Riochim. Biophy.r. Acta 1986. 851. 6-12
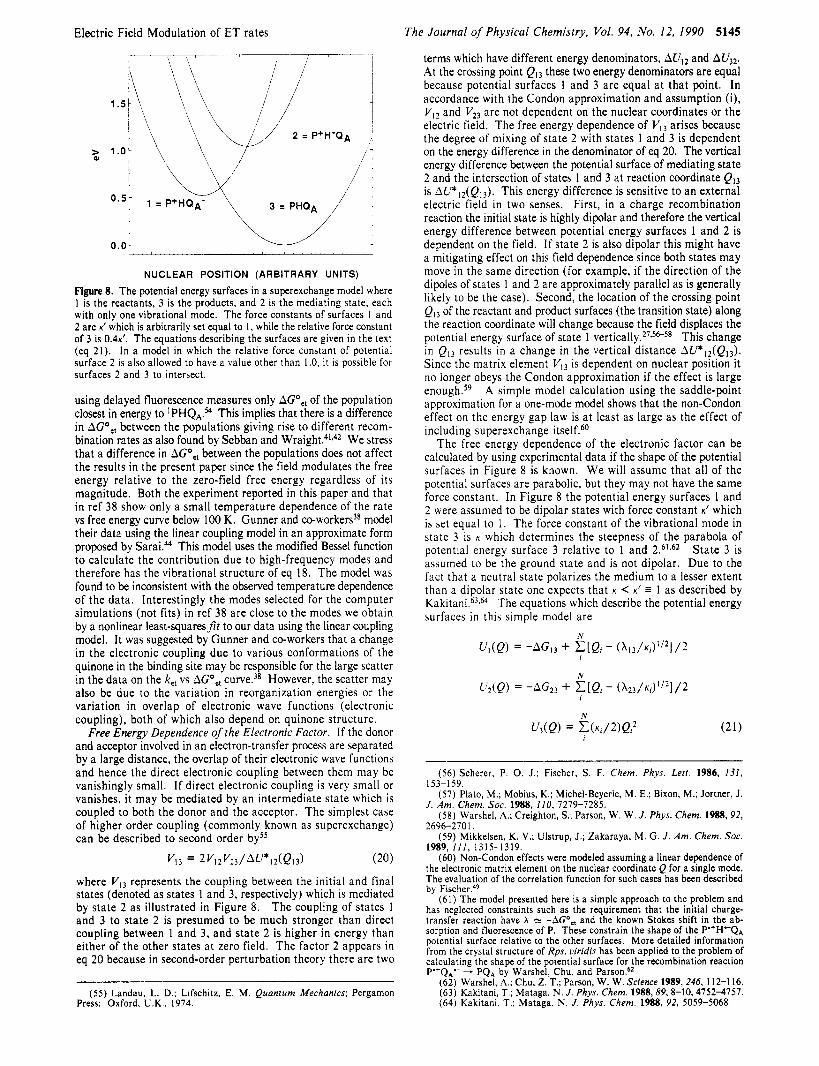
Electric Field Modulation of ET rates
NUCLEAR POSITION (ARBITRARY UNITS)
Figure 8. The potential energy surfaces in a superexchange model where 1 is the reactants, 3 is the products, and 2 is the mediating state, each with only one vibrational mode. The force constants of surfaces 1 and 2 are K' which is arbitrarily set equal to I , while the relative force constant of 3 is 0.4~'. The equations describing the surfaces a re given in the text (eq 21). In a model in which the relative force constant of potential surface 2 is also allowed to have a value other than 1 .O, it is possible for surfaces 2 and 3 to intersect.
using delayed fluorescence measures only AGO,, of the population closest in energy to IPHQ,." This implies that there is a difference in AGO,, between the populations giving rise to different recom- bination rates as also found by Sebban and Wraight.41,42 We stress that a difference in AGO,, between the populations does not affect the results in the present paper since the field modulates the free energy relative to the zero-field free energy regardless of its magnitude. Both the experiment reported in this paper and that in ref 38 show only a small temperature dependence of the rate vs free energy curve below 100 K. Gunner and co-workers3* model their data using the linear coupling model in an approximate form proposed by Sarai." This model uses the modified Bessel function to calculate the contribution due to high-frequency modes and therefore has the vibrational structure of eq 18. The model was found to be inconsistent with the observed temperature dependence of the data. Interestingly the modes selected for the computer simulations (not fits) in ref 38 are close to the modes we obtain by a nonlinear least-squaresfit to our data using the linear coupling model. It was suggested by Gunner and co-workers that a change in the electronic coupling due to various conformations of the quinone in the binding site may be responsible for the large scatter in the data on the k,, vs AGO,, curve.38 However, the scatter may also be due to the variation in reorganization energies or the variation in overlap of electronic wave functions (electronic coupling), both of which also depend on quinone structure.
Free Energy Dependence of the Electronic Factor. If the donor and acceptor involved in an electron-transfer process are separated by a large distance, the overlap of their electronic wave functions and hence the direct electronic coupling between them may be vanishingly small. I f direct electronic coupling is very small or vanishes, it may be mediated by an intermediate state which is coupled to both the donor and the acceptor. The simplest case of higher order coupling (commonly known as superexchange) can be described to second order byss
where VI3 represents the coupling between the initial and final states (denoted as states 1 and 3, respectively) which is mediated by state 2 as illustrated in Figure 8. The coupling of states 1 and 3 to state 2 is presumed to be much stronger than direct coupling between 1 and 3, and state 2 is higher in energy than either of the other states at zero field. The factor 2 appears in eq 20 because in second-order perturbation theory there are two
( 5 5 ) Landau, L. D.; Lifschitz, E. M. Quantum Mechanics; Pergamon Press: Oxford, U.K., 1974.
The Journal of Physical Chemistry, Vol. 94, No. 12, 1990 5145
terms which have different energy denominators, AU12 and AUj2. At the crossing point Q,3 these two energy denominators are equal because potential surfaces 1 and 3 are equal a t that point. In accordance with the Condon approximation and assumption (i), VI, and V23 are not dependent on the nuclear coordinates or the electric field. The free energy dependence of VI3 arises because the degree of mixing of state 2 with states 1 and 3 is dependent on the energy difference in the denominator of eq 20. The vertical energy difference between the potential surface of mediating state 2 and the intersection of states 1 and 3 at reaction coordinate Ql3 is Ao",,(QI3). This energy difference is sensitive to an external electric field in two senses. First, in a charge recombination reaction the initial state is highly dipolar and therefore the vertical energy difference between potential energy surfaces 1 and 2 is dependent on the field. If state 2 is also dipolar this might have a mitigating effect on this field dependence since both states may move in the same direction (for example, if the direction of the dipoles of states 1 and 2 are approximately parallel as is generally likely to be the case). Second, the location of the crossing point Q13 of the reactant and product surfaces (the transition state) along the reaction coordinate will change because the field displaces the potential energy surface of state 1 v e r t i ~ a l l y . * ~ ~ ~ ~ ~ * This change in Q13 results in a change in the vertical distance A V I 2 ( Q l 3 ) . Since the matrix element VI3 is dependent on nuclear position it no longer obeys the Condon approximation if the effect is large enough.59 A simple model calculation using the saddle-point approximation for a one-mode model shows that the non-Condon effect on the energy gap law is a t least as large as the effect of including superexchange itself.60
The free energy dependence of the electronic factor can be calculated by using experimental data if the shape of the potential surfaces in Figure 8 is known. We will assume that all of the potential surfaces are parabolic, but they may not have the same force constant. In Figure 8 the potential energy surfaces 1 and 2 were assumed to be dipolar states with force constant K' which is set equal to 1. The force constant of the vibrational mode in state 3 is K which determines the steepness of the parabola of potential energy surface 3 relative to 1 and 2.61-62 State 3 is assumed to be the ground state and is not dipolar. Due to the fact that a neutral state polarizes the medium to a lesser extent than a dipolar state one expects that K < K' 1 as described by K a k i t a r ~ i . ~ ~ , ~ ~ The equations which describe the potential energy surfaces in this simple model are
(56) Scherer, P. 0. J.; Fischer, S. F. Chem. Phys. L e f f . 1986, 131,
(57) Plato, M.; Mobius, K.; Michel-Beyerle, M. E.; Bixon, M.; Jortner, J.
(58) Warshel, A.; Creighton, S.; Parson, W. W. J . Phys. Chem. 1988, 92,
(59) Mikkelsen, K. V.; Ulstrup, J.; Zakaraya, M. G. J . A m . Chem. SOC.
(60) Non-Condon effects were modeled assuming a linear dependence of the electronic matrix element on the nuclear coordinate Q for a single mode. The evaluation of the correlation function for such cases has been described by F i ~ c h e r . ~ ~
(61) The model presented here is a simple approach to the problem and has neglected constraints such as the requirement that the initial charge- transfer reaction have X = -AGO,, and the known Stokes shift in the ab- sorption and fluorescence of P. These constrain the shape of the P'+H'-QA potential surface relative to the other surfaces. More detailed information from the crystal structure of Rps. uiridis has been applied to the problem of calculating the shape of the potential surface for the recombination reaction P.+QA'- - PQA by Warshel, Chu, and Parson.62
(62) Warshel, A.: Chu, 2. T.; Parson, W. W. Science 1989, 246, 112-1 16. (63) Kakttani, T.; Mataga. N. J . Phys. Chem. 1988,89,8-IO, 4752-4757. (64) Kakitani, T.; Mataga, N. J . Phys. Chem. 1988, 92, 5059-5068.
153-1 59.
J . Am. Chem. Sac. 1988, 110, 7279-7285.
2696-2701.
1989, 111, 1315-1319.

5146
where Qi is the displacement for the mode i. The relative force constant K~ is the product's force constant divided by reactant's force constant for each mode. For one mode, K is obtained from the constraint imposed by the reorganization energies in the problem:
The Journal of Physical Chemistry, Vol. 94, No. 12, 1990 Franzen et al.
The difference in force constants between reactants and products implies a frequency shift which must be taken into account in the definition of the reorganization energy which is calculated based on the energy of the product's potential surface at the nuclear position of the reactants. For two or more modes the h , are constrained by the total reorganization energy and the partitioning of that total among the modes. For a single mode, QI3 is obtained from the condition a t the crossing point,
Ul(Qi3) = l j i (Q13) (23)
I f two or more modes are coupled, eq 23 can be used as a con- straint for minimization using a La Grange multiplier and the derivative of eqs 21 with respect to Q, to determine the lowest crossing point Q13 on the multidimensional surface This allows the denominator in eq 20 to be calculated:
Using this model one can incorporate the effect of an electric field on the electronic factor along with the effect on the Franck- Condon factor in a single nonlinear least-squares calculation. We have done this for one or two modes including the change in the force constant h as a frequency shift in the calculation of the Franck-Condon factors. We assume in this paper that the field dependence of Vi, is small enough that the Condon approximation holds, and we can simply multiply the nuclear and electronic factors together (eq 13).
The decision to include a change in the force constant of vi- bration into the calculation of the potential surfaces is not ar- bitrary. There is considerable information on the possible su- perexchange state (P'+H'-QA) for the P'+HQA'- recombination reaction. The energies of all of the states are known along with good estimates for their reorganization energies. This constrains the potential surfaces to have a certain shape relative to one another as shown in eq 22. The constraint imposed by eq 22 applies even in the absence of superexchange which is why we considered frequency shifts in the Franck-Condon factor analysis. In the model calculations we have treated the two modes explicitly in the determination of the crossing point on a three-dimensional potential surface and accounted for the frequency shift implied by the constraints in the potential surfaces using quadratic coupling (vibrational frequency shifts) as well as linear coupling in the calculation of the Franck-Condon factors. This result is then compared with a one-mode treatment of superexchange. It i b
important to recognize that the difference between 3 two-mode treatment is more than a refinement of a one-mode treatment. The trends seen in one mode may be offset by opposite trends in a mode with a different frequency. In a two-mode treatment we can accommodate the general trends of both the high- and lou- frequency modes that are coupled to the reaction.
Estimates of Rates Using a Superexchange Model. The im- portance of a state or states which can mediate superexchange coupling has been postulated for the initial charge-separation event 'PHQ, - p*+H*-QA.27 We are unaware of attempts to describe P'+QA'- charge recombination in bacterial RCs using a super- exchange formalism. The large distance between the donor P and the acceptor QA implies that the electronic overlap between P and Q, should be very small and higher order coupling to intermediate states is likely. In the following discussion the information obtained from the data in the electric field modulation experiment i n this paper is used to test the possibility that charge recombination occurs by a superexchange mechanism. In general, superexchange implies the presence of a parallel activated pathway which can contribute to the electron-transfer rate at high temperature. Information available from measurements of the P'+QA'- charge-recombination rate as a function of temperature suggest
that an activated pathway does exist in the charge-recombination reaction in RCs. I n Rps. ~ i r i d i s ~ ~ and for some quinone re- placements in the Q, site of Rb. s p h a e r ~ i d e s , ~ ~ ~ ~ ~ recombination i5 believed to occur through an activated pathway via the state P'+H'-QA a t room temperature. As the temperature is lowered recombination no longer occurs via this activated pathway. In addition, there is evidence for electric field modulated charge recombination via an activated pathway above 180 K in Rb. sphaeroides RCs containing native u b i q ~ i n o n e . ' ~
I f the mechanism of recombination is superexchange, the candidate for the mediating state is likely to be P'+H'-QA, and in Figure 8 we make the state identification: 1 = P'+HQA'-, 2 = P'+H'-QA, and 3 = PHQA. Unlike the case for the initial charge separation step, IPHQA - P'+H'-QA, the parameters relevant to the P'+QA'- recombination problem can be estimated from experimental observables for each state. As an initial test of the validity of a superexchange mechanism one must first compare the magnitude of the calculated superexchange matrix element with an experimental estimate based on the measured rate constant a t zero field. The two charge-separation steps and their free energies are66-68 (see Figure 1)
'PHQA - P'+H-QA
P'+H'-QA - P'+HQA'-
AGO = -2120 cm-'
ACo2, = -4274 cm-l
Both of the charge-separation reactions are considered to be activationless on the basis of their temperature dependence.43 This is usually taken to mean that X = -AGOet. We have already seen in the fits of the electric field modulated kinetics data to models of the Franck-Condon factors that it is possible for X to be greater than AGO,, in the case of P'+HQA'- - PHQA, which has the same temperature dependence as the charge-separation reactions. However, for simplicity, we shall assume that A,, = -AGo2, and furthermore that the reorganization energy for charge recom- bination is equal to the reorganization energy for charge separation for this reaction. This is implicit in our assumption that there is no frequency shift between the reactants and the mediating state. The two charge-recombination reactions and their free energies arez7
P'+H'-QA - PHQ, AGO,, = -8468 cm-'
P'+HQA'- - PHQ, AG013 = -4194 cm-I
The recombination reaction rate P'+H'-QA - PHQA decreases with decreasing temperature and is undoubtedly in the inverted region of the Marcus The value of the reorganization energy for this recombination reaction should be smaller than the reorganization energy for the initial charge separation which would be 2120 cm-' i f X = There is experimental evidence that
(65) Shopes. R. J.; Wraight, C . A. Biochim. Biophys. Acta 1987, 893, 409-425.
(66) The value used for AG',, for the initial charge separation reaction 'PHQ, - P'+H'-Q was obtained from magnetic field effect experiments on the triplet decay."$ It is larger than the value obtained from delayed fluore~cence.~' This discrepancy may be due to relaxation of the energy of the state P'+H'-Q, on the nanosecond time scale. The value for the relaxed state would appear to be more relevant for calculations of the activated recombination of P'+HQ,'- and is close to the energy actual1 obtained from the temperature dependence of the recombination reactionJ5 The value of AGO,, for the reaction P'+H'-Q, - P'+HQA'- is obtained by subtracting AGO for 'PHQ, - P'+H'-QA and P'+HQ,'- - PHQ, from the transition energy P -* 'P, which is 1.37 eV when corrected for the Stokes shift (0.06 eV).
(67) Woodbury, N. T.; Parson, W. W. Biochim. Biophys. Acta 1984, 767, 345-361.
(68) Goldstein. R. A,; Takiff, L.; Boxer, S. G. Biochim. Biophys. Acta 1988, 934, 253-263.
(69) The temperature dependence of the recombination rate for the process l(P'+H'-QA) - PHQ, (known as ks ) is obtained in ref 70 by assuming that the rate constant of '(P'+H'-Q,) - 'PHQ, (known as k,) is temperature independent."
(70) Schenk, C. C.; Blankenship, R. E.; Parson, W. W. Biochim. Biophys. Acta 1982, 680, 44-59.
(71) Ogrodnik, A,; Volk, M.; Michel-Beyerle, M . E. In The Photosynthetic Bacterial Reaction Center: Structure and Dynamics; Breton, J . , Vermeglio, A . Eds.: Plenum Press: Yew York. 1988: pp 177-183
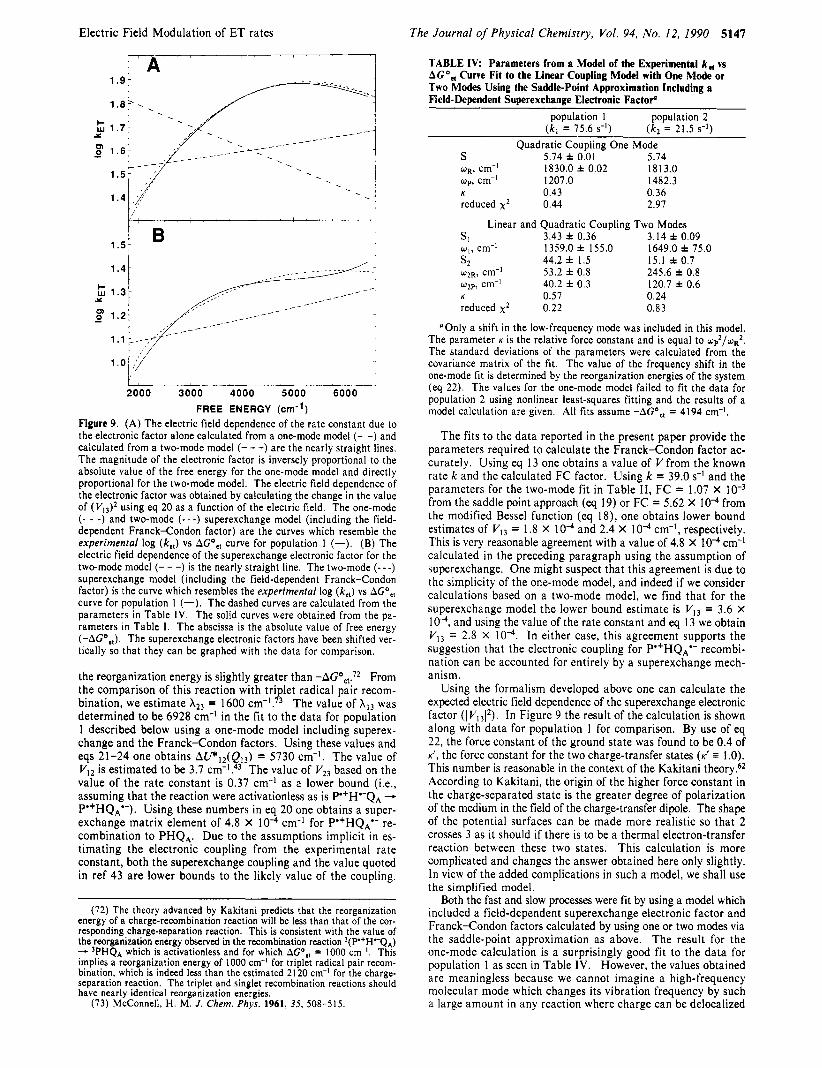
Electric Field Modulation of ET rates
I ,'; i
1 . 5 \ I B
l . O i ; :, i I-, 2000 3000 4000 5000 6000
FREE ENERGY (cm-1) Figure 9. (A ) The electric field dependence of the rate constant due to the electronic factor alone calculated from a one-mode model (- -) and calculated from a two-mode model (- - -) are the nearly straight lines. The magnitude of the electronic factor is inversely proportional to the absolute value of the free energy for the one-mode model and directly proportional for the two-mode model. The electric field dependence of the electronic factor was obtained by calculating the change in the value of ( using eq 20 as a function of the electric field. The one-mode (- - -) and two-mode ( - - - ) superexchange model (including the field- dependent Franck-Condon factor) are the curves which resemble the experimental log (keJ vs AGO,, curve for population 1 (-). (B) The electric field dependence of the superexchange electronic factor for the two-mode model (- - -) is the nearly straight line. The two-mode (- - -) superexchange model (including the field-dependent Franck-Condon factor) is the curve which resembles the experimental log (kCJ vs AGOc, curve for population 1 (-). The dashed curves are calculated from the parameters in Table 1V. The solid curves were obtained from the pa- rameters in Table l . The abscissa is the absolute value of free energy (-AGO,,). The superexchange electronic factors have been shifted ver- tically so that they can be graphed with the data for comparison.
the reorganization energy is slightly greater than From the comparison of this reaction with triplet radical pair recom- bination, we estimate A23 = 1600 c ~ n - ~ . ' ~ The value of X I 3 was determined to be 6928 cm-' in the fit to the data for population 1 described below using a one-mode model including superex- change and the Franck-Condon factors. Using these values and eqs 21-24 one obtains ACPlz(Q,3) = 5730 cm-I. The value of VI, is estimated to be 3.7 The value of VZ3 based on the value of the rate constant is 0.37 cm-I as a lower bound (Le., assuming that the reaction were activationless as is P'+H'-QA - P'+HQA'-). Using these numbers in eq 20 one obtains a super- exchange matrix element of 4.8 X IO4 cm-' for P'+HQA'- re- combination to PHQA. Due to the assumptions implicit in es- timating the electronic coupling from the experimental rate constant, both the superexchange coupling and the value quoted in ref 43 are lower bounds to the likely value of the coupling.
(72) The theory advanced by Kakitani predicts that the reorganization energy of a charge-recombination reaction will be less than that of the cor- responding charge-separation reaction. This is consistent with the value of the reorganization energy observed in the recombination reaction )(P'+H'-QA) - )PHQ, which is activationless and for which AGO,, = 1000 cm-I. This implies a reorganization energy of 1000 cm-' for triplet radical pair recom- bination, which is indeed less than the estimated 2120 cm-' for the charge- separation reaction. The triplet and singlet recombination reactions should have nearly identical reorganization energies.
(73) McConnell, H. M. J . Chem. Phys. 1961, 35, 508-515.
T h e Journal of Physical Chemis t ry , Vol. 94, No. 12, 1990 5147
TABLE I V Parameters from a Model of the Experimental k , vs AGO, Curve Fit to the Linear Coupling Model with One Mode or Two Modes Using the Saddle-Point Approximation Including a Field-Dependent Superexchange Electronic FactoP
population 1 population 2 ( k , = 75.6 s - I ) (k, = 21.5 s-')
Quadratic Coupling One Mode S 5.74 f 0.01 5.74 w R , cm-I 1830.0 f 0.02 1813.0 up, cm-I 1207.0 1482.3 K 0.43 0.36 reduced x 2 0.44 2.97
Linear and Quadratic Coupling Two Modes SI 3.43 f 0.36 3.14 f 0.09 q, cm-' 1359.0 f 155.0 1649.0 f 75.0 s2 44.2 f 1.5 15 .1 f 0.7 qR. cm-' 53.2 f 0.8 w2p, cm-' 40.2 f 0.3 K 0.57 0.24 reduced x2 0.22 0.83
245.6 f 0.8 120.7 f 0.6
'Only a shift in the low-frequency mode was included in this model. The parameter K is the relative force constant and is equal to uP2/uR2. The standard deviations of the parameters were calculated from the covariance matrix of the fit. The value of the frequency shift in the one-mode fit is determined by the reorganization energies of the system (eq 22). The values for the one-mode model failed to fit the data for population 2 using nonlinear least-squares fitting and the results of a model calculation are given. All fits assume -AGO,, = 4194 cm-I.
The fits to the data reported in the present paper provide the parameters required to calculate the Franck-Condon factor ac- curately. Using eq 13 one obtains a value of V from the known rate k and the calculated FC factor. Using k = 39.0 s-I and the parameters for the two-mode fit in Table 11, FC = 1.07 X from the saddle point approach (eq 19) or FC = 5.62 X IO4 from the modified Bessel function (eq 18), one obtains lower bound estimates of VI3 = 1.8 X lo4 and 2.4 X lo4 cm-I, respectively. This is very reasonable agreement with a value of 4.8 X IO4 cm-' calculated in the preceding paragraph using the assumption of superexchange. One might suspect that this agreement is due to the simplicity of the one-mode model, and indeed if we consider calculations based on a two-mode model, we find that for the superexchange model the lower bound estimate is VI, = 3.6 X IOn4, and using the value of the rate constant and eq 13 we obtain VI3 = 2.8 X In either case, this agreement supports the suggestion that the electronic coupling for P'+HQA'- recombi- nation can be accounted for entirely by a superexchange mech- anism.
Using the formalism developed above one can calculate the expected electric field dependence of the superexchange electronic factor (lVI3l2). In Figure 9 the result of the calculation is shown along with data for population 1 for comparison. By use of eq 22, the force constant of the ground state was found to be 0.4 of K', the force constant for the two charge-transfer states (K' 1.0). This number is reasonable in the context of the Kakitani theory.6z According to Kakitani, the origin of the higher force constant in the charge-separated state is the greater degree of polarization of the medium in the field of the charge-transfer dipole. The shape of the potential surfaces can be made more realistic so that 2 crosses 3 as it should if there is to be a thermal electron-transfer reaction between these two states. This calculation is more complicated and changes the answer obtained here only slightly. In view of the added complications in such a model, we shall use the simplified model.
Both the fast and slow processes were fit by using a model which included a field-dependent superexchange electronic factor and Franck-Condon factors calculated by using one or two modes via the saddle-point approximation as above. The result for the one-mode calculation is a surprisingly good fit to the data for population 1 as seen in Table IV. However, the values obtained are meaningless because we cannot imagine a high-frequency molecular mode which changes its vibration frequency by such a large amount in any reaction where charge can be delocalized
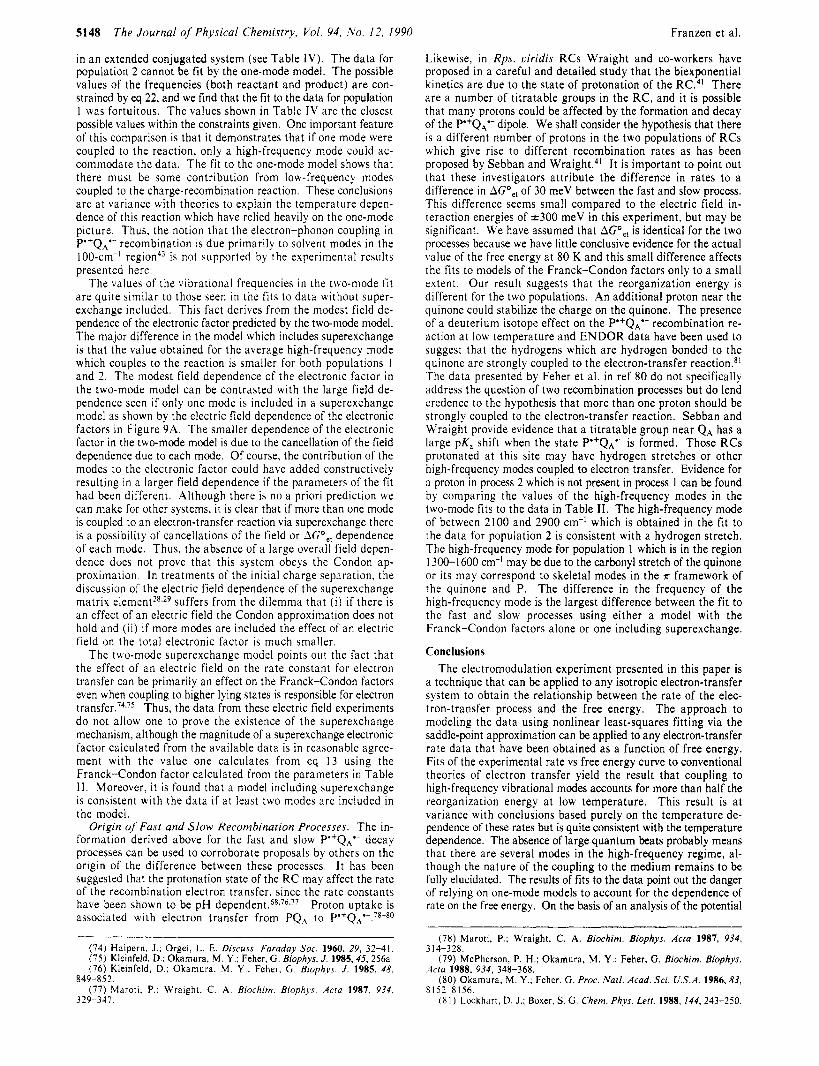
5148 The Journal of Physical Chemistry, Vol. 94, No. 1.2, 1990 Franzen et al.
in an extended conjugated system (see Table IV). The data for population 2 cannot be fit by the one-mode model. The possible values of the frequencies (both reactant and product) are con- strained by eq 22, and we find that the fit to the data for population 1 was fortuitous. The values shown in Table IV are the closest possible values within the constraints given. One important feature of this comparison is that it demonstrates that if one mode were coupled to the reaction, only a high-frequency mode could ac- commodate the data. The fit to the one-mode model shows that there must be some contribution from low-frequency modes coupled to the charge-recombination reaction. These conclusions are at variance with theories to explain the temperature depen- dence of this reaction which have relied heavily on the one-mode picture. Thus, the notion that the electron-phonon coupling i n P'+QA'- recombination is due primarily to solvent modes in the 100-cm-l region43 is not supported by the experimental results presented here.
The values of the vibrational frequencies i n the two-mode f i t are quite similar to those seen i n the fits to data without super- exchange included. This fact derives from the modest field de- pendence of the electronic factor predicted by the two-mode model. The major difference in the model which includes superexchange is that the value obtained for the average high-frequency mode which couples to the reaction is smaller for both populations 1 and 2. The modest field dependence of the electronic factor in the two-mode model can be contrasted with the large field de- pendence seen if only one mode is included in a superexchange model as shown by the electric field dependence of the electronic factors in Figure 9A. The smaller dependence of the electronic factor in the two-mode model is due to the cancellation of the field dependence due to each mode. Of course, the contribution of the modes to the electronic factor could have added constructively resulting i n a larger field dependence if the parameters of the fit had been different. Although there is no a priori prediction we can make for other systems, it is clear that i f more than one mode is coupled to an electron-transfer reaction via superexchange there is a possibility of cancellations of the field or AGO,, dependence of each mode. Thus, the absence of a large overall field depen- dence does not prove that this system obeys the Condon ap- proximation. In treatments of the initial charge separation, the discussion of the electric field dependence of the superexchange matrix e l e m e r ~ t ~ ~ , ~ ~ suffers from the dilemma that (i) i f there is an effect of an electric field the Condon approximation does not hold and (ii) if more modes are included the effect of an electric field on the total electronic factor is much smaller.
The two-mode superexchange model points out the fact that the effect of an electric field on the rate constant for electron transfer can be primarily an effect on the Franck-Condon factors even when coupling to higher lying states is responsible for electron t r a n ~ f e r . ~ ~ . ~ ~ Thus, the data from these electric field experiments do not allow one to prove the existence of the superexchange mechanism, although the magnitude of a superexchange electronic factor calculated from the available data is in reasonable agree- ment with the value one calculates from eq 13 using the Franck-Condon factor calculated from the parameters in Table 11. Moreover, it is found that a model including superexchange is consistent with the data if at least t n o modes are included in the model.
Origin of Fast and Slow Recombination Processes. The in- formation derived above for the fast and slow P'+QA'- decay processes can be used to corroborate proposals by others on the origin of the difference between these processes. I t has been suggested that the protonation state of the R C may affect the rate of the recombination electron transfer, since the rate constants have been shown to be pH dependent.6x*76,77 Proton uptake is associated with electron transfer from PQA to P'+QA*-.78-x0
(74) Halpern, J.; Orgel, L. E. Discuss. Faraday Soc. 1960, 29, 32-41 (75) Kleinfeld. D.; Okamura, M. Y.; Feher, G. Eiophys. J . 1985, 45. 256a. ( 7 6 ) Kleinfeld. D.; Okamura, M. Y . : Feher, G. Eiophys. J . 1985, 48,
(77) Maroti, P.: Wraight, C. A. Biochim. Biophys. Acta 1987, 934, 849-852.
329-341.
Likewise, i n Rps. ciridis RCs Wraight and co-workers have proposed in a careful and detailed study that the biexponential kinetics are due to the state of protonation of the R C 4 ' There are a number of titratable groups in the RC, and it is possible that many protons could be affected by the formation and decay of the P'+QA'- dipole. We shall consider the hypothesis that there is a different number of protons in the two populations of RCs which give rise to different recombination rates as has been proposed by Sebban and W r a i g h ~ ~ ' It is important to point out that these investigators attribute the difference in rates to a difference in AGO,, of 30 meV between the fast and slow process. This difference seems small compared to the electric field in- teraction energies of f300 meV in this experiment, but may be significant. We have assumed that AGO,, is identical for the two processes because we have little conclusive evidence for the actual value of the free energy a t 80 K and this small difference affects the fits to models of the Franck-Condon factors only to a small extent. Our result suggests that the reorganization energy is different for the two populations. An additional proton near the quinone could stabilize the charge on the quinone. The presence of a deuterium isotope effect on the P'+QA'- recombination re- action a t low temperature and ENDOR data have been used to suggest that the hydrogens which are hydrogen bonded to the quinone are strongly coupled to the electron-transfer reaction.*! The data presented by Feher et al. in ref 80 do not specifically address the question of two recombination processes but do lend credence to the hypothesis that more than one proton should be strongly coupled to the electron-transfer reaction. Sebban and Wraight provide evidence that a titratable group near QA has a large pK, shift when the state P'+QA'- is formed. Those RCs protonated at this site may have hydrogen stretches or other high-frequency modes coupled to electron transfer. Evidence for a proton in process 2 which is not present in process 1 can be found by comparing the values of the high-frequency modes in the two-mode fits to the data in Table 11. The high-frequency mode of between 2100 and 2900 cm-' which is obtained in the fit to the data for population 2 is consistent with a hydrogen stretch. The high-frequency mode for population 1 which is in the region 1300-1 600 cm-' may be due to the carbonyl stretch of the quinone or its may correspond to skeletal modes in the 7~ framework of the quinone and P. The difference in the frequency of the high-frequency mode is the largest difference between the fit to the fast and slow processes using either a model with the Franck-Condon factors alone or one including superexchange.
Conclusions The electromodulation experiment presented in this paper is
a technique that can be applied to any isotropic electron-transfer system to obtain the relationship between the rate of the elec- tron-transfer process and the free energy. The approach to modeling the data using nonlinear least-squares fitting via the saddle-point approximation can be applied to any electron-transfer rate data that have been obtained as a function of free energy. Fits of the experimental rate vs free energy curve to conventional theories of electron transfer yield the result that coupling to high-frequency vibrational modes accounts for more than half the reorganization energy a t low temperature. This result is a t variance with conclusions based purely on the temperature de- pendence of these rates but is quite consistent with the temperature dependence. The absence of large quantum beats probably means that there are several modes in the high-frequency regime, al- though the nature of the coupling to the medium remains to be fully elucidated. The results of fits to the data point out the danger of relying on one-mode models to account for the dependence of rate on the free energy. On the basis of an analysis of the potential
(78) Maroti, P.; Wraight, C. A. Eiochim. Biophys. Acfa 1987, 934,
(79) McPherson, P. H.; Okamura, M. Y . : Feher, G. Eiochim. Biophys.
(80 ) Okamura, M. Y . ; Feher, G. Proc. Nut/. Acad. Sci. U.S.A. 1986,83,
( 8 1 ) Lockhart, D. J . ; Boxer, S. G. Chem. Phys. Lef t . 1988, 144, 243-250.
3 14-328.
Acta 1988, 934, 348-368.
8152-81 56.

J . Phys. Chem. 1990, 94, 5 149-5 154 5149
surfaces it was found that frequency shifts should accompany electron transfer, and indeed the best fit to the data was obtained by using a model which included frequency shifts in the Franck-Condon factors. Coupling to higher lying states is found to be consistent with the results obtained here. In addition, we have shown that the field dependence of the electronic factor is much smaller than that of the Franck-Condon factor when a reasonable model is employed. We caution that i f the Condon approximation breaks down the conclusions of this and all other attempts to apply higher order coupling may be altered.
The experimental technique used can easily be applied to other electron-transfer systems on a faster time scale. The measurement of electric field modulation of electron transfer on the millisecond or microsecond time scale is quite feasible for charge-recombi- nation reactions and on the picosecond time scale for charge- separation reactions. Many features of the result obtained here for the P*+Q,’- recombination kinetics are similar to the electric field effect found for the primary charge separation in RCs.I6 For example, both electron-transfer reactions slow down in the presence of an external electric field and the observed field dependence in both reactions is quadratic.I6 The charge-separation and -re- combination reactions occur on drastically different time scales, and it is surprising that both exhibit the same time-averaged field dependence as well as a similar temperature dependence which has long been known. Also, the electronic coupling in both processes may be mediated by higher lying state^.^^,^^ Much more is known about the likely intermediate or mediating states in the case of charge recombination, so these results may be useful to calibrate studies of the charge-separation dynamics.
Acknowledgment. This work was supported in part by a grant from the N S F Biophysics Program. S.G.B. is the recipient of a Presidential Young Investigator Award.
Appendix Electrochemical- Transfer Coefficient. Information concerning
the nature of the transition state can be obtained from parameter PI. This parameter is directly related to the electrochemical- transfer coefficient CI (Bransted ~ o e f f i c i e n t ) ~ ~
CY = -kBT(d log ( k e , ) / 6 h C ) ( 2 5 )
CY = -kBTPl ( 2 6 )
therefore
The determination of PI is quite precise regardless of the number of terms used in the cumulant expansion. The transfer coefficient can be used to calculate the nonequilibrium polarization a t the transition state as well as the activation energy of a reaction by using Marcus theory. The transfer coefficient can be used to calculate the exponent in the electronic wave functions at the transition state.49 The transfer coefficient deserves mention here because there are electron-transfer systems which have small difference dipole moments of reaction for which the linear term will be the only one obtained in the electromodulation of kinetics experiment aside from its general usefulness in estimating quantities of interest at the transition state. Furthermore, more advanced theoretical treatments of the rate as a function of free energy including medium effects which are not included in the simple models presented in this paper often rely on knowledge of the transfer c o e f f i ~ i e n t . ~ ~
(82) Marcus, R. A. Chem. Phys. Lett. 1988, 146, 13-21. (83) Won, Y.; Friesner, R. A. Biochim. Biophys. Acta 1988, 935, 9-18. (84) Marcus, R. A. Electrochim. Acta 1968, 13, 995-1004.
Nature of Macromolecular Denaturation by Urea and Other Cosolutes: Experiments on Agarose Interpreted within a Lattice Model for Adsorption from a Mixed Solvent
Svante Nilsson,* Lennart Piculell, and Martin Malmsten Physical Chemistry I, University of Lund, Chemical Center, Box 124, S-221 00 Lund, Sweden (Received: November 16, 1989)
The effects of added urea and of several other low molecular weight cosolutes (including methylated ureas and alcohols) on the coil-to-helix transition of agarose in aqueous solution have been studied. Both stabilizing and destabilizing effects on the helical state (an increase or a decrease in the transition temperature) were observed, depending on the cosolute. The adsorption of the various cosolutes to agarose has also been investigated, by gel permeation chromatography on an agarose column, and a clear correlation is found between the destabilizing (stabilizing) efficiency of a cosolute and its degree of adsorption (desorption) to agarose. A lattice model, in which all pair interactions between the system components are considered, is used to analyze the effects of the adsorption/desorption of cosolutes on the conformational equilibria of macromolecules. The important role of solvent-cosolute interactions for the adsorption behavior (and denaturing efficiency) of the cosolute is brought out by this analysis. Thus, the slightly unfavorable urea-water interaction, evidenced by thermodynamic data on the binary system, largely suffices to explain the helix-destabilizing effect of urea on agarose.
I. Introduction The effects of added low molecular weight cosolutes on the
conformational equilibria of macromolecules in aqueous solution (e&, the reversible denaturation of globular proteins and the helix-coil equilibria of polypeptides, DNA, and polysaccharides) typically follow very general patterns.’” Thus, regardless of the
( 1 ) von Hippel, P. H.; Wong, K.-Y. Science 1964, 145, 577. (2) Klotz, I. M. Fed. Proc. 1965, 24, S24. (3) von Hippel, P. H.: Schleich, T. In Structure and Stability of Biological
Macromolecules; Timasheff, S. N.; Fasman, G. D., Eds.; Marcel Dekker: New York, 1969; p 417.
(4) Eagland, D. In Water-A Comprehensiue Treatise; Franks, F., Ed.; Plenum: New York, 1975; Vol. 4, p 305.
identity of the macromolecule, the addition of a typical “denaturant”, like urea, generally increases the stability of the unfolded (disordered) conformation. This insensitivity to the chemical details of the macromolecule has lead to suggestions that the effect of cosolutes can be sought in the cosolute-water in- teractions, and much effort has been spent on the understanding of the effects of such interactions on the, loosely speaking, solvent quality of the mixture. Quite popular in this context have been explanations in terms of cosolute-induced changes in the structure
( 5 ) Suggett, A. In Water -A Comprehensive Treatise; Franks, F., Ed.;
( 6 ) Collins, K. D.; Washabaugh, M. W . Q. Reu. Biophys. 1985, 18, 323. Plenum: New York, 1975; Vol. 4, p 519.
0022-3654/90/2094-5 149$02.50/0 G 1990 American Chemical Society