Electric field-mediated transport of plasmid DNA in tumor interstitium in vivo
10
Electric field-mediated transport of plasmid DNA in tumor interstitium in vivo Joshua W. Henshaw, David A. Zaharoff 1 , Brian J. Mossop, Fan Yuan ⁎ Department of Biomedical Engineering, Duke University, 136 Hudson Hall, Durham, NC 27708, USA Received 10 November 2006; received in revised form 7 July 2007; accepted 18 July 2007 Available online 1 August 2007 Abstract Local pulsed electric field application is a method for improving non-viral gene delivery. Mechanisms of the improvement include electroporation and electrophoresis. To understand how electrophoresis affects pDNA delivery in vivo, we quantified the magnitude of electric field-induced interstitial transport of pDNA in 4T1 and B16.F10 tumors implanted in mouse dorsal skin-fold chambers. Four different electric pulse sequences were used in this study, each consisted of 10 identical pulses that were 100 or 400 V/cm in strength and 20 or 50 ms in duration. The interval between consecutive pulses was 1 s. The largest distance of transport was obtained with the 400 V/cm and 50 ms pulse, and was 0.23 and 0.22 μm/pulse in 4T1 and B16.F10 tumors, respectively. There were no significant differences in transport distances between 4T1 and B16.F10 tumors. Results from in vivo mapping and numerical simulations revealed an approximately uniform intratumoral electric field that was predominantly in the direction of the applied field. The data in the study suggested that interstitial transport of pDNA induced by a sequence of ten electric pulses was ineffective for macroscopic delivery of genes in tumors. However, the induced transport was more efficient than passive diffusion. © 2007 Elsevier B.V. All rights reserved. Keywords: In vivo DNA electrophoresis; Interstitial transport; Non-viral gene therapy; DNA electrotransfer; Electric field-mediated gene delivery 1. Introduction The efficacy of non-viral gene therapy is limited by poor delivery of therapeutic genes into the nucleus of target cells. A rate-limiting physiological barrier to gene delivery is the interstitial space. In tumor interstitium, convection is negligible due to a uniformly elevated interstitial fluid pressure [1], leaving gene delivery through the extracellular matrix (ECM) to rely on passive diffusion [2]. Unfortunately, diffusion is also inefficient for larger therapeutics in tumors [3], and can be considered as a negligible transport mechanism for therapeutics the size of a typical plasmid DNA (pDNA). The limited interstitial transport implies that only the pDNA molecules localized within a very thin layer outside the cell membrane have the potential to enter the cell and elicit successful transgene expression. Increasing pDNA interstitial transport may significantly increase the thickness of this layer in vivo, and therefore the transfection efficiency of pDNA. One strategy to improve the interstitial transport is to locally apply a pulsed electric field to push exogenous genes in tumors. Electric field-mediated gene delivery has been investigated extensively both in vitro [4–7] and in vivo [8–21]. Mechanisms of the delivery include cell membrane electroporation and DNA electrophoresis. Electroporation has been studied extensively in vitro [22–30]. The process is characterized by an increased permeability of the cell membrane to traditionally non-permeant molecules, caused by the presence of an external, pulsed electric field. The permeability increase is thought to occur due to the formation of transient, hydrophilic pores in the cell membrane in response to an above threshold transmembrane potential [31]. These pores allow cellular uptake of small molecules primarily by passive diffusion. For larger molecules such as pDNA, mechan- isms of the uptake remain unclear [32], however studies have shown that the process involves DNA absorption to the cell envelope prior to transport across the membrane [33]. Regardless of the uptake mechanisms, the pDNA must be within a critical distance from the cell membrane in order to be taken up by the Available online at www.sciencedirect.com Bioelectrochemistry 71 (2007) 233 – 242 www.elsevier.com/locate/bioelechem ⁎ Corresponding author. Tel.: +1 919 660 5411; fax: +1 919 684 4488. E-mail address: [email protected] (F. Yuan). 1 Present address: Laboratory of Tumor Immunology and Biology, National Cancer Institute (NIH), Bethesda, MD 20892, USA. 1567-5394/$ - see front matter © 2007 Elsevier B.V. All rights reserved. doi:10.1016/j.bioelechem.2007.07.005
-
Upload
joshua-w-henshaw -
Category
Documents
-
view
212 -
download
0
Transcript of Electric field-mediated transport of plasmid DNA in tumor interstitium in vivo
Available online at www.sciencedirect.com
(2007) 233–242www.elsevier.com/locate/bioelechem
Bioelectrochemistry 71
Electric field-mediated transport of plasmid DNA in tumorinterstitium in vivo
Joshua W. Henshaw, David A. Zaharoff 1, Brian J. Mossop, Fan Yuan ⁎
Department of Biomedical Engineering, Duke University, 136 Hudson Hall, Durham, NC 27708, USA
Received 10 November 2006; received in revised form 7 July 2007; accepted 18 July 2007Available online 1 August 2007
Abstract
Local pulsed electric field application is a method for improving non-viral gene delivery.Mechanisms of the improvement include electroporationand electrophoresis. To understand how electrophoresis affects pDNA delivery in vivo, we quantified the magnitude of electric field-inducedinterstitial transport of pDNA in 4T1 andB16.F10 tumors implanted inmouse dorsal skin-fold chambers. Four different electric pulse sequences wereused in this study, each consisted of 10 identical pulses that were 100 or 400 V/cm in strength and 20 or 50 ms in duration. The interval betweenconsecutive pulses was 1 s. The largest distance of transport was obtained with the 400 V/cm and 50ms pulse, and was 0.23 and 0.22 μm/pulse in 4T1and B16.F10 tumors, respectively. There were no significant differences in transport distances between 4T1 and B16.F10 tumors. Results from invivo mapping and numerical simulations revealed an approximately uniform intratumoral electric field that was predominantly in the direction of theapplied field. The data in the study suggested that interstitial transport of pDNA induced by a sequence of ten electric pulses was ineffective formacroscopic delivery of genes in tumors. However, the induced transport was more efficient than passive diffusion.© 2007 Elsevier B.V. All rights reserved.
Keywords: In vivo DNA electrophoresis; Interstitial transport; Non-viral gene therapy; DNA electrotransfer; Electric field-mediated gene delivery
1. Introduction
The efficacy of non-viral gene therapy is limited by poordelivery of therapeutic genes into the nucleus of target cells. Arate-limiting physiological barrier to gene delivery is theinterstitial space. In tumor interstitium, convection is negligibledue to a uniformly elevated interstitial fluid pressure [1], leavinggene delivery through the extracellular matrix (ECM) to rely onpassive diffusion [2]. Unfortunately, diffusion is also inefficientfor larger therapeutics in tumors [3], and can be considered as anegligible transport mechanism for therapeutics the size of atypical plasmid DNA (pDNA). The limited interstitial transportimplies that only the pDNA molecules localized within a verythin layer outside the cell membrane have the potential to enterthe cell and elicit successful transgene expression. IncreasingpDNA interstitial transport may significantly increase the
⁎ Corresponding author. Tel.: +1 919 660 5411; fax: +1 919 684 4488.E-mail address: [email protected] (F. Yuan).
1 Present address: Laboratory of Tumor Immunology and Biology, NationalCancer Institute (NIH), Bethesda, MD 20892, USA.
1567-5394/$ - see front matter © 2007 Elsevier B.V. All rights reserved.doi:10.1016/j.bioelechem.2007.07.005
thickness of this layer in vivo, and therefore the transfectionefficiency of pDNA. One strategy to improve the interstitialtransport is to locally apply a pulsed electric field to pushexogenous genes in tumors.
Electric field-mediated gene delivery has been investigatedextensively both in vitro [4–7] and in vivo [8–21].Mechanisms ofthe delivery include cell membrane electroporation and DNAelectrophoresis. Electroporation has been studied extensively invitro [22–30]. The process is characterized by an increasedpermeability of the cell membrane to traditionally non-permeantmolecules, caused by the presence of an external, pulsed electricfield. The permeability increase is thought to occur due to theformation of transient, hydrophilic pores in the cell membrane inresponse to an above threshold transmembrane potential [31].These pores allow cellular uptake of small molecules primarily bypassive diffusion. For larger molecules such as pDNA, mechan-isms of the uptake remain unclear [32], however studies haveshown that the process involves DNA absorption to the cellenvelope prior to transport across the membrane [33]. Regardlessof the uptake mechanisms, the pDNA must be within a criticaldistance from the cell membrane in order to be taken up by the
234 J.W. Henshaw et al. / Bioelectrochemistry 71 (2007) 233–242
permeabilized cell. This distancemay be increased through in vivoelectrophoresis in the presence of an external, pulsed electric field.
Despite its potential significance, the in vivo electrophoresiscomponent of electric field-mediated gene delivery is only thefocus of a few studies in the literature [34–38]. The significance ofthe electrophoretic component has been demonstrated in vivo inmuscle by studying the transfection levels obtained using acombination of low voltage, non-porating pulses with longduration (LV), and high voltage, porating pulses with shortduration (HV). Bureau et al. reported high levels of transgeneexpression following a pulse sequence consisting of a single HV(800 V/cm, 0.1 ms), followed by four LVs (80 V/cm, 83 ms) [34].Satkauskas et al. later demonstrated that the HV resulted inelectropermeabilization and the LVs resulted in pDNA electro-phoresis [35]. A recent study by Satkauskas et al. revealed that theLVs played an important role in determining the levels of transgeneexpression following a prerequisite HV [36]. These studiesdemonstrate the significant effects the electrophoretic componenthas on in vivo cell transfection following the initial pore formation.However, these studies fail to distinguish between the potentialroles of electrophoresis in increasing interstitial transport versusfacilitating cellular uptake. Furthermore, it is still unclear how farand how fast the pDNA can move during electrophoresis.
In this study, we investigated the ability of an applied pulsedelectric field to overcome the interstitial barrier by quantifying themagnitude of in vivo electric field-induced transport of pDNA intumor interstitium. Zaharoff et al. have previously reported pDNAelectromobility ex vivo in tumor interstitium [37], as well aspDNA electromobility in agarose tissue phantoms [38]. Here, weused a similar technique to quantify interstitial transport of pDNAin vivo in two types of tumors (4T1 andB16.F10) grown inmousedorsal skin-fold chambers (DSCs), and correlated the observedelectrophoretic movement with the tissue collagen content as hasbeen observed in previous studies [37,39]. Furthermore, weexperimentally mapped and numerically simulated the in vivodistribution of electric potential in tumors. The potentialdistribution determines the local field strength that is the drivingforce for electrophoresis in tumor interstitium.
2. Materials and methods
2.1. Tumor model
4T1 (amurinemammary carcinoma) andB16.F10 (ametastaticsubline of B16 murine melanoma) cells were cultured in DMEMsupplemented with 10% fetal bovine serum, 100 U/ml streptomy-cin, and 100 U/ml penicillin at 37 °C, 95% air and 5% carbondioxide. Cells were harvested from flasks with 0.25% trypsin/EDTA and rinsed with DMEM then PBS. Cells were centrifugedfor 2min at 176 g and re-suspended in PBS to a final concentrationof 5×10⁷ cells/ml. Fluorescently labeled, electrically neutral,yellow-green latex microspheres with a diameter of 1.0 μm (YG-MS, Polysciences, Inc., Warrington, PA, USA) were added to thecell suspension to be used as a tissuemarker during image analysis.
Female BALB/C and C57BL/6 mice (18–24 g, Charles River,Raleigh, NC, USA) were used as hosts for 4T1 and B16.F10tumors, respectively. DSCs were implanted in mice anesthetized
with an i.p. injection of 80 mg ketamine and 10 mg xylazine perkg body weight. 10 μl of cell suspension (∼5×10⁵ cells) wereinjected into the fascia layer at the center of the DSC, and then theDSC was sealed with a glass coverslip. Tumors were allowed togrow 5–6 days and 7–10 days for 4T1 and B16.F10, respectively.
2.2. pDNA administration
Once the tumors had reached 3–4 mm in diameter, the micewere anesthetized and the coverslip was removed from theDSC. Approximately 1 μg of rhodamine-labeled plasmid DNA(Rho-pDNA, 5.1 kb, Gene Therapy Systems, San Diego, CA,USA) was injected into the center of the tumor using amicroinjection system consisting of a TransferMan NKmicromanipulator and a CellTram Vario oil pump (Eppendorf,Westbury, NY, USA) mounted on an Axioskop 2 Plus uprightmicroscope (Zeiss, Thornwood, NY, USA). This methodallowed precise control over the location and amount ofpDNA delivered while limiting damages to tumor tissue andvasculature. The tissue was washed thoroughly with PBS, andthen the DSC was resealed with a sterile glass coverslip.
2.3. Electric field application
Anesthetized mice were secured on a custom designedmicroscope stage on a Model 510 confocal microscope (Zeiss).A localized electric field was applied using two stainless steel,parallel plate electrodes on the skin side of theDSC (see Fig. 1). Anelectric potential difference was supplied by an ECM 830 electrosquare porator (BTX, San Diego, CA, USA). Pulsed electric fieldsexamined in this study consisted of 10 identical square voltagepulseswith amagnitude of 100 or 400V/cm and a duration of 20 or50 ms. The interval between consecutive pulses was 1 s.
2.4. Image acquisition
Fluorescence images of the Rho-pDNA and YG-MS wereacquired using a 40× objective before and immediately fol-lowing the application of an entire 10-pulse sequence. The areaof the image was away from the needle track to ensure the area ofthe tissue imaged was not damaged during plasmid administra-tion. The one-dimensional resolution of the acquired images was0.44 μm/pixel. Images for control groups were taken with a 10 sdelay between image acquisitions during which no electric fieldwas applied.
2.5. Image analysis
A cross-correlation analysis was performed on the fluores-cence images taken before and following application of the pulsedelectric field. The analysis was performed independently onchannel 1 and channel 2 to determine the linear drift displacement,averaged over a field of view, of Rho-pDNA (D
tpDNA) and YG-
MS (DtMS ) respectively. Details of the analysis are as follows.
Pre- and post-pulse sequence images are represented by p(x, y)and q(x, y), respectively, where x and y are the indices of pixels ineach image. If image p(x, y) is fixed and image q(x, y) is shifted
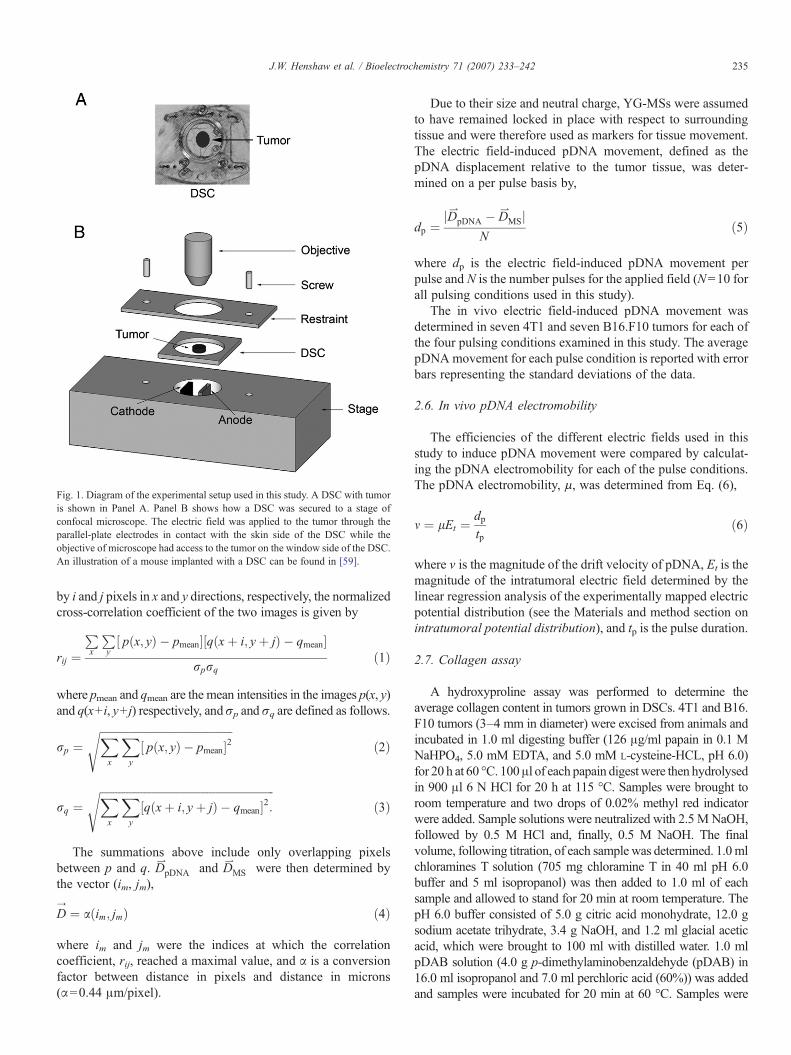
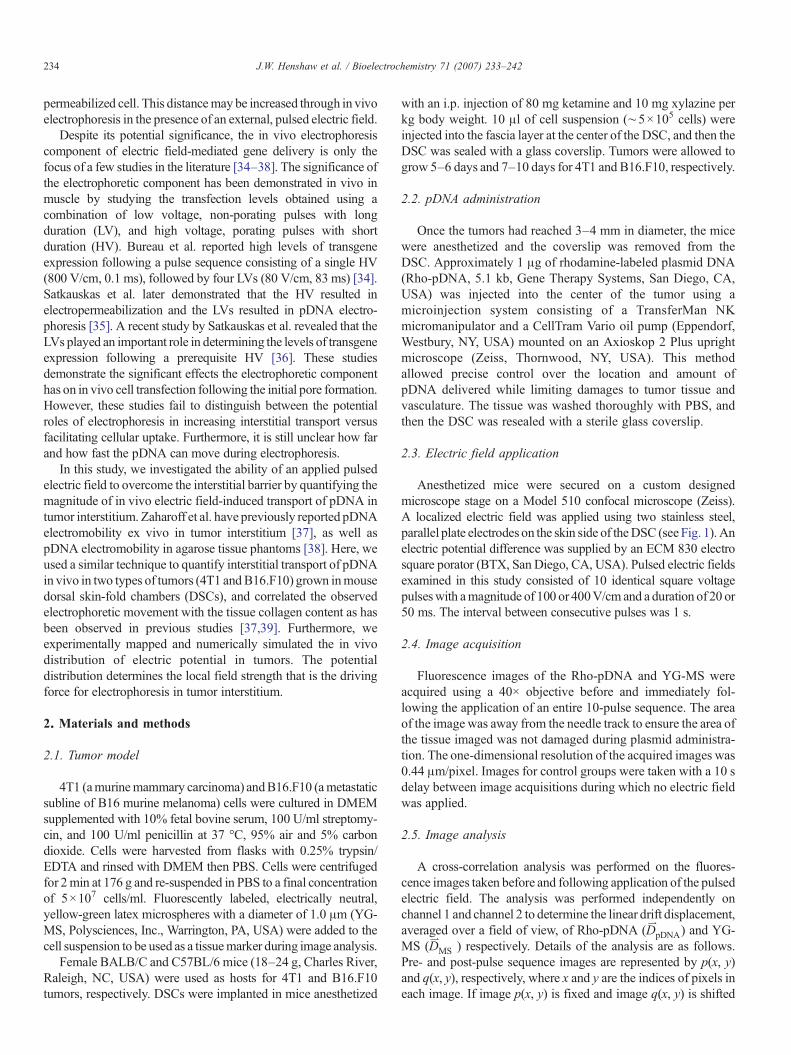
Fig. 1. Diagram of the experimental setup used in this study. A DSC with tumoris shown in Panel A. Panel B shows how a DSC was secured to a stage ofconfocal microscope. The electric field was applied to the tumor through theparallel-plate electrodes in contact with the skin side of the DSC while theobjective of microscope had access to the tumor on the window side of the DSC.An illustration of a mouse implanted with a DSC can be found in [59].
235J.W. Henshaw et al. / Bioelectrochemistry 71 (2007) 233–242
by i and j pixels in x and y directions, respectively, the normalizedcross-correlation coefficient of the two images is given by
rij ¼Px
Py½ pðx; yÞ � pmean�½qðxþ i; yþ jÞ � qmean�
rprqð1Þ
where pmean and qmean are the mean intensities in the images p(x, y)and q(x+ i, y+ j) respectively, andσp andσq are defined as follows.
rp ¼ffiffiffiffiffiffiffiffiffiffiffiffiffiffiffiffiffiffiffiffiffiffiffiffiffiffiffiffiffiffiffiffiffiffiffiffiffiffiffiffiffiffiffiffiffiffiffiffiXx
Xy
½ pðx; yÞ � pmean�2s
ð2Þ
rq ¼ffiffiffiffiffiffiffiffiffiffiffiffiffiffiffiffiffiffiffiffiffiffiffiffiffiffiffiffiffiffiffiffiffiffiffiffiffiffiffiffiffiffiffiffiffiffiffiffiffiffiffiffiffiffiffiffiffiffiffiffiffiffiffiXx
Xy
½qðxþ i; yþ jÞ � qmean�2:s
ð3Þ
The summations above include only overlapping pixelsbetween p and q. D
tpDNA and D
tMS were then determined by
the vector (im, jm),
DY ¼ aðim; jmÞ ð4Þ
where im and jm were the indices at which the correlationcoefficient, rij, reached a maximal value, and α is a conversionfactor between distance in pixels and distance in microns(α=0.44 μm/pixel).
Due to their size and neutral charge, YG-MSs were assumedto have remained locked in place with respect to surroundingtissue and were therefore used as markers for tissue movement.The electric field-induced pDNA movement, defined as thepDNA displacement relative to the tumor tissue, was deter-mined on a per pulse basis by,
dp ¼jDtpDNA � D
tMSj
Nð5Þ
where dp is the electric field-induced pDNA movement perpulse and N is the number pulses for the applied field (N=10 forall pulsing conditions used in this study).
The in vivo electric field-induced pDNA movement wasdetermined in seven 4T1 and seven B16.F10 tumors for each ofthe four pulsing conditions examined in this study. The averagepDNAmovement for each pulse condition is reported with errorbars representing the standard deviations of the data.
2.6. In vivo pDNA electromobility
The efficiencies of the different electric fields used in thisstudy to induce pDNA movement were compared by calculat-ing the pDNA electromobility for each of the pulse conditions.The pDNA electromobility, μ, was determined from Eq. (6),
m ¼ lEt ¼ dptp
ð6Þ
where ν is the magnitude of the drift velocity of pDNA, Et is themagnitude of the intratumoral electric field determined by thelinear regression analysis of the experimentally mapped electricpotential distribution (see the Materials and method section onintratumoral potential distribution), and tp is the pulse duration.
2.7. Collagen assay
A hydroxyproline assay was performed to determine theaverage collagen content in tumors grown in DSCs. 4T1 and B16.F10 tumors (3–4 mm in diameter) were excised from animals andincubated in 1.0 ml digesting buffer (126 μg/ml papain in 0.1 MNaHPO4, 5.0 mM EDTA, and 5.0 mM L-cysteine-HCL, pH 6.0)for 20 h at 60 °C. 100μl of each papain digestwere then hydrolysedin 900 μl 6 N HCl for 20 h at 115 °C. Samples were brought toroom temperature and two drops of 0.02% methyl red indicatorwere added. Sample solutions were neutralized with 2.5 MNaOH,followed by 0.5 M HCl and, finally, 0.5 M NaOH. The finalvolume, following titration, of each sample was determined. 1.0mlchloramines T solution (705 mg chloramine T in 40 ml pH 6.0buffer and 5 ml isopropanol) was then added to 1.0 ml of eachsample and allowed to stand for 20 min at room temperature. ThepH 6.0 buffer consisted of 5.0 g citric acid monohydrate, 12.0 gsodium acetate trihydrate, 3.4 g NaOH, and 1.2 ml glacial aceticacid, which were brought to 100 ml with distilled water. 1.0 mlpDAB solution (4.0 g p-dimethylaminobenzaldehyde (pDAB) in16.0 ml isopropanol and 7.0 ml perchloric acid (60%)) was addedand samples were incubated for 20 min at 60 °C. Samples were
236 J.W. Henshaw et al. / Bioelectrochemistry 71 (2007) 233–242
cooled in a room temperature water bath for 5min. The absorbanceof the solutions at 557 nm was recorded within 1 h followingcooling. A standard hydroxyproline curve was established bydissolving 0–5 μg hydroxyproline in 1 ml deionized water andrepeating the above procedure from the step of chloramines Taddition. Hydroxyproline is an amino acid derivative exclusive tocollagen and accounts for approximately 12.5% of the totalcollagen mass [40]. The average collagen content was determinedfor three 4T1 and three B16.F10 tumors.
2.8. Collagen histology
Histological analysis was performed on tumor sections tovisualize the collagen content and distribution. 4T1 and B16.F10tumors were excised from the DSCs in BALB/C and C57BL/6mice, respectively, and fixed in 10% formalin for 24 h. Tumorswere then embedded in paraffin, sectioned at 5 μm, and stainedwith a Masson trichrome solution.
2.9. Intratumoral potential distribution
The intratumoral electric potential distribution determines theelectric field, which is the driving force for in vivo electrophoresis.The local electric fields within 4T1 and B16.F10 tumors weremapped with a microelectrode array. The DSC coverslip wasremoved from anesthetized mice secured on the custom micro-scope stage. A 5×5 array of microelectrodes (Bionic TechnologiesInc., Salt Lake City, UT, USA) was placed at the center of thetumor, depressed slightly into the tissue, and held in placewith clay.This placement coincided with the approximate location at whichpDNA images were taken. The electrode array consisted of 25glass enclosed, platinum electrodes. Total electrode length was1 mm, with a 50 μm bare platinum tip, 2.0 μm in diameter. Inter-electrode spacing was 400 μm. The potential at each electrode wasrecorded during the application of a 100 or 400 V/cm, 20 ms pulseusing an Enhancer 400 oscilloscope (BTX). Readings at eachelectrodewere taken in triplicate and averaged. A linear decrease inpotential as a function of pulse number was observed during thecourse of these measurements. To compensate for this decrease inpotential, linear regression analysis was performed on the threereadings at each potential and the resulting slopes of these plotswere averaged over the 25 electrodes. This correction factor wasthen applied to each potential reading as a function of pulsenumber. The potential data at each location used in the isopotentialplots was the average of the three corrected readings. The potentialdistribution was determined in three 4T1 and three B16.F10tumors.
The magnitude of the electric field within a tumor was deter-mined by linear regression analysis of the potential distributionrecorded by the array of microelectrodes. If the distribution isuniform and unidirectional, the potential, Φ, can be fit by thefunction,
U ¼ axþ by ð7Þ
where x and y are the known coordinates of the recording electrodesand a and b are constants. Once the values of a and b were
determined numerically through linear regression analysis, themagnitude of the electric field was calculated as the magnitude ofthe potential gradient.
2.10. Numerically simulated potential distribution
A commercially available finite element software (ComsolMultiphysics 3.2, COMSOL, Inc., Burlington, MA) was used todetermine the electric potential distribution as a function of depthwithin the tumor. The concern here was possible variation in thefield strength in the experimental setup used in this study. A two-dimensional volume conductor model of the cross-section of theDSC was used, based on the assumed symmetry of the setup. Thegeometry of the model was determined through experimentalmeasurements of a representative DSC model used in this study.Since current sources existed only at the skin-electrode interfaces,the potential distribution in the DSC was governed by the Laplaceequation,
jd JY ¼ �rj2U ¼ 0 ð8Þ
where JY
is the current density, σ is the conductivity of theconducting medium through which the current is flowing, andΦ isthe electric potential. There were no currents across externalsurfaces, i.e., the no-flux boundary condition was satisfied on theseboundaries,
nYd JY ¼ 0 ð9Þ
where nY is the unit vector in the normal direction of the boundary.Across all internal interfaces in the DSC, the current wascontinuous, i.e., the continuous boundary condition was satisfied,
nYd ðJY1 � JY2Þ ¼ 0 ð10Þ
except at the skin-anode and skin-cathode interfaces where thepotentials were set at 50 Vand 0 V, respectively. JY1 and J
Y2 are the
current vectors on different sides of the interface that was in thedirection of nY. The conductivities of the glass coverslip andelectrodes were assumed to be 10−12 and 109 S/m respectively.The conductivities used for the skin, connective tissue, and tumortissue were 0.2, 0.04, and 0.4 S/m, respectively [41].
2.11. Statistical analysis
The magnitudes of pDNA movement in all experimentalgroups were tested against zero, using a 1-sample sign test witha test mean of zero. Differences in data between any twoexperimental groups were compared using the Mann–Whitneytest. All statistical calculations were performed using Minitabstatistical software (Minitab Inc, State College, PA, USA).
3. Results
3.1. In vivo Imaging of pDNA and tissue marker
Mouse DSC tumor models allowed noninvasive access totumor interstitium with fluorescence confocal microscopy. The
Fig. 3. Mean values of net pDNA movement per pulse, dp, in 4T1 (A) and B16.F10 (B) tumor interstitium with an applied electric field that consisted of 10identical pulses with 100 or 400 V/cm in magnitude and 20 or 50 ms in duration.The interval between consecutive pulses was 1 s. The symbols representindividual data points and the error bars represent the standard deviations of thedata (n=7).
237J.W. Henshaw et al. / Bioelectrochemistry 71 (2007) 233–242
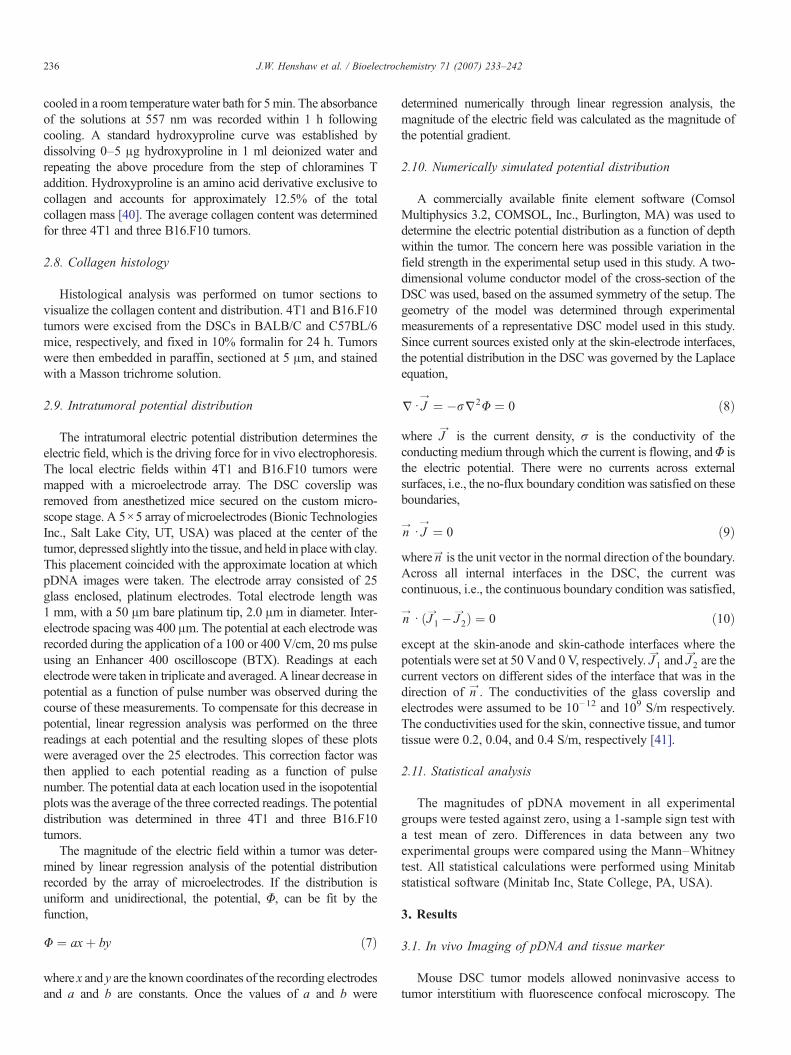
DSC was secured on a confocal microscope stage that allowedsimultaneous electric field application and image acquisition. Adiagram of the experimental setup is shown in Fig. 1. Images ofmicroinjected Rho-pDNA and YG-MS within tumor interstitiumin the DSCs were obtained using a 40× water immersionobjective. The microscope was set to a multichannel configura-tion, with channel 1 capturing the Rho-pDNA signal, and channel2 capturing the YG-MS signal. The images were taken in a line-switching mode to prevent cross talk between the channels. Arepresentative image is shown in Fig. 2.
3.2. In vivo electric field-induced pDNA movement
The electrophoretic movement of pDNA in pulsed electricfields was determined by comparing confocal images takenimmediately before and immediately after pulse application.The distance of electric field-induced pDNA movement perpulse, dp, was determined for a set of four pulsing conditions inboth 4T1 and B16.F10 tumors (Fig. 3). Under each condition,10 identical square wave pulses were applied sequentially totumors, with the time interval between pulses being 1 s. Thestrength and duration of pulses were 100 or 400 V/cm and 20 or50 ms, respectively.
The magnitude of pDNA movement observed without theapplication of a pulsed electric field was not significantlydifferent from zero in both 4T1 and B16.F10 tumors (P=0.50 forboth tumors). The magnitude of pDNA movement wassignificantly greater than zero for each applied field in bothtumor types (Pb0.05 for all groups). The distances of pDNAmovement in 4T1 tumors subjected to a 100 V/cm pulsed fieldwere 2.4×10⁻² μm and 3.3×10⁻² μm for pulse duration of 20and 50 ms, respectively. The distances were increased to9.51×10−2 μm and 2.27×10⁻¹ μm, respectively, when the fieldstrength was increased to 400 V/cm. In B16.F10 tumors, thedistances of pDNA movement subjected to a 100 V/cm pulsedfield were 4.52×10⁻² and 5.05×10⁻² μm for pulse duration of
Fig. 2. A representative confocal image of Rho-pDNA (red) and YG-MS (green)in tumor tissues in the DSC in vivo. The image was acquired in a multichannelconfiguration of the confocal microscope, using a 40× water immersionobjective. (For interpretation of the references to colour in this figure legend, thereader is referred to the web version of this article.)
20 and 50 ms, respectively. The distances were increased to9.93×10−2 μm and 2.23×10⁻¹ μm, respectively, when the fieldstrength was increased to 400 V/cm.
The differences between the data from different groups werecompared statistically and the P-values are shown in Table 1.With a 100 V/cm field, increasing the pulse duration from 20 to50 ms did not result in a significant increase in electrophoreticmovement of pDNA in either 4T1 or B16.F10 tumor. However,with a 400 V/cm field, the electrophoretic movement wassignificantly increased when increasing the pulse duration from20 to 50 ms in both tumor types. If the pulse duration was fixedat 20 ms, increasing the field strength from 100 to 400 V/cmresulted in a significant increase in pDNA electrophoreticmovement in 4T1 tumors, but not in B16.F10 tumors. With the50 ms pulses, increasing the field strength from 100 to 400 V/cmdid result in a significant increase in pDNA electrophoreticmovement in both 4T1 and B16.F10 tumors. Finally, thedistances of pDNA movement were not statistically differentbetween 4T1 and B16.F10 tumors under any pulsing conditionsinvestigated.
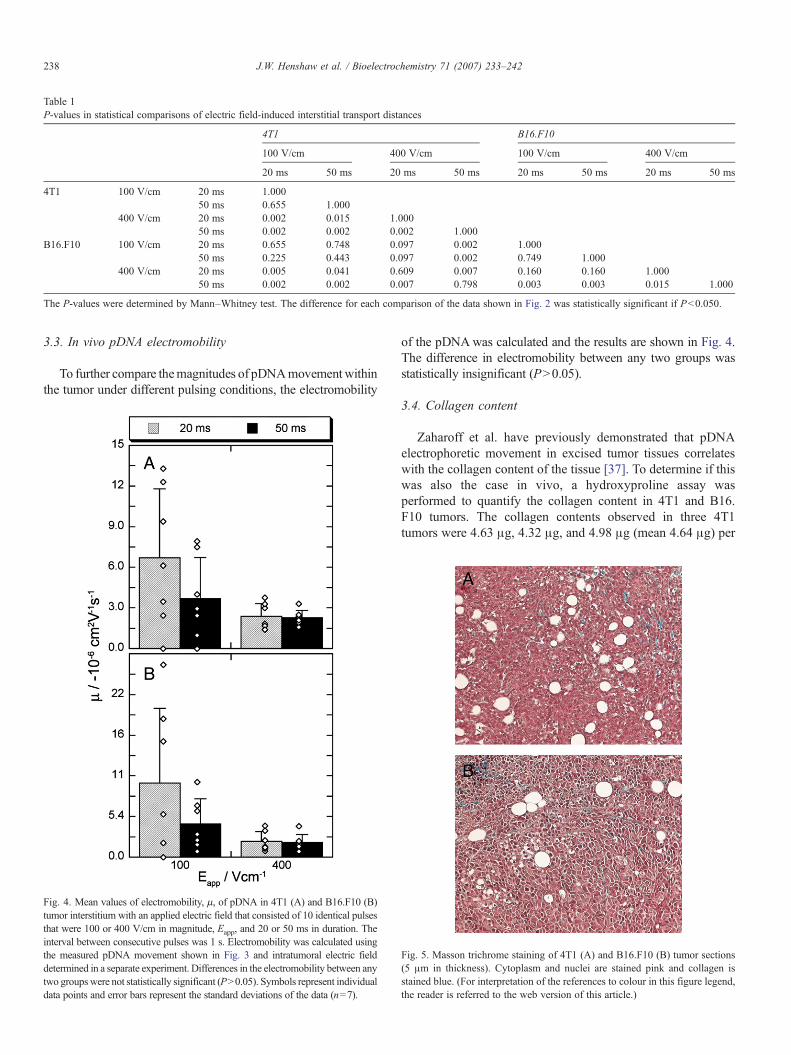
Table 1P-values in statistical comparisons of electric field-induced interstitial transport distances
4T1 B16.F10
100 V/cm 400 V/cm 100 V/cm 400 V/cm
20 ms 50 ms 20 ms 50 ms 20 ms 50 ms 20 ms 50 ms
4T1 100 V/cm 20 ms 1.00050 ms 0.655 1.000
400 V/cm 20 ms 0.002 0.015 1.00050 ms 0.002 0.002 0.002 1.000
B16.F10 100 V/cm 20 ms 0.655 0.748 0.097 0.002 1.00050 ms 0.225 0.443 0.097 0.002 0.749 1.000
400 V/cm 20 ms 0.005 0.041 0.609 0.007 0.160 0.160 1.00050 ms 0.002 0.002 0.007 0.798 0.003 0.003 0.015 1.000
The P-values were determined by Mann–Whitney test. The difference for each comparison of the data shown in Fig. 2 was statistically significant if Pb0.050.
238 J.W. Henshaw et al. / Bioelectrochemistry 71 (2007) 233–242
3.3. In vivo pDNA electromobility
To further compare themagnitudes of pDNAmovement withinthe tumor under different pulsing conditions, the electromobility
Fig. 4. Mean values of electromobility, μ, of pDNA in 4T1 (A) and B16.F10 (Btumor interstitium with an applied electric field that consisted of 10 identical pulsesthat were 100 or 400 V/cm in magnitude, Eapp, and 20 or 50 ms in duration. Theinterval between consecutive pulses was 1 s. Electromobility was calculated usingthe measured pDNA movement shown in Fig. 3 and intratumoral electric fielddetermined in a separate experiment. Differences in the electromobility between anytwo groupswere not statistically significant (PN0.05). Symbols represent individuadata points and error bars represent the standard deviations of the data (n=7).
Fig. 5. Masson trichrome staining of 4T1 (A) and B16.F10 (B) tumor sections(5 μm in thickness). Cytoplasm and nuclei are stained pink and collagen isstained blue. (For interpretation of the references to colour in this figure legend,the reader is referred to the web version of this article.)
)
l
of the pDNAwas calculated and the results are shown in Fig. 4.The difference in electromobility between any two groups wasstatistically insignificant (PN0.05).
3.4. Collagen content
Zaharoff et al. have previously demonstrated that pDNAelectrophoretic movement in excised tumor tissues correlateswith the collagen content of the tissue [37]. To determine if thiswas also the case in vivo, a hydroxyproline assay wasperformed to quantify the collagen content in 4T1 and B16.F10 tumors. The collagen contents observed in three 4T1tumors were 4.63 μg, 4.32 μg, and 4.98 μg (mean 4.64 μg) per
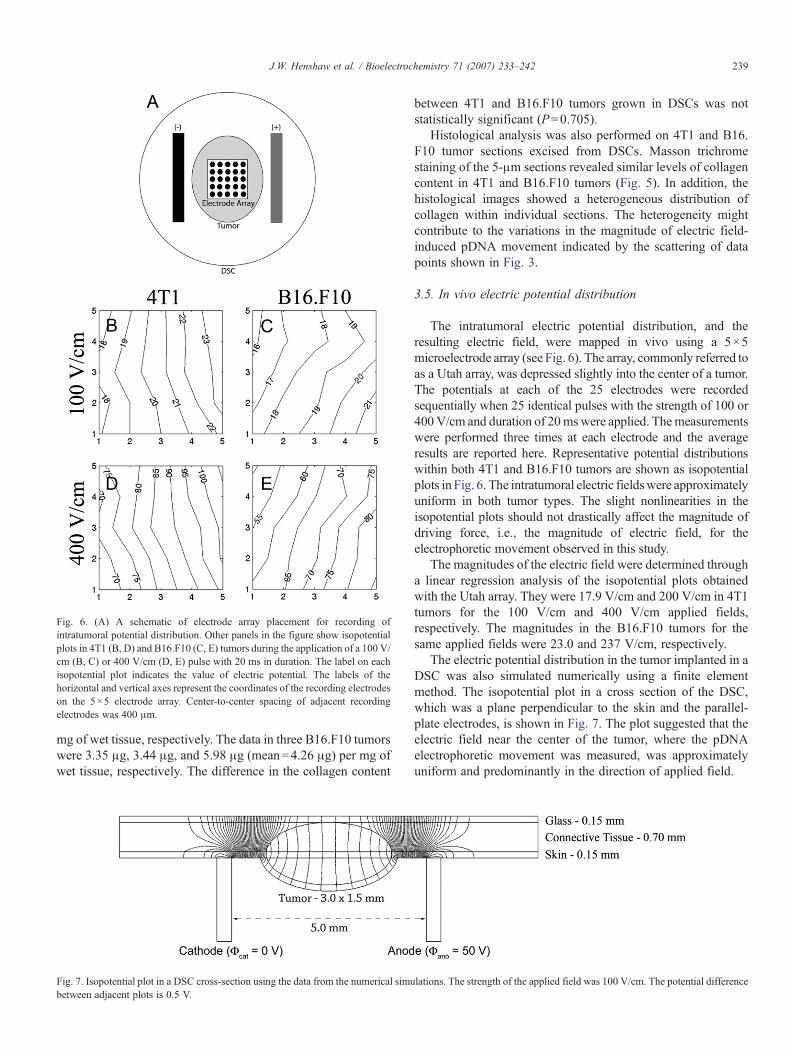
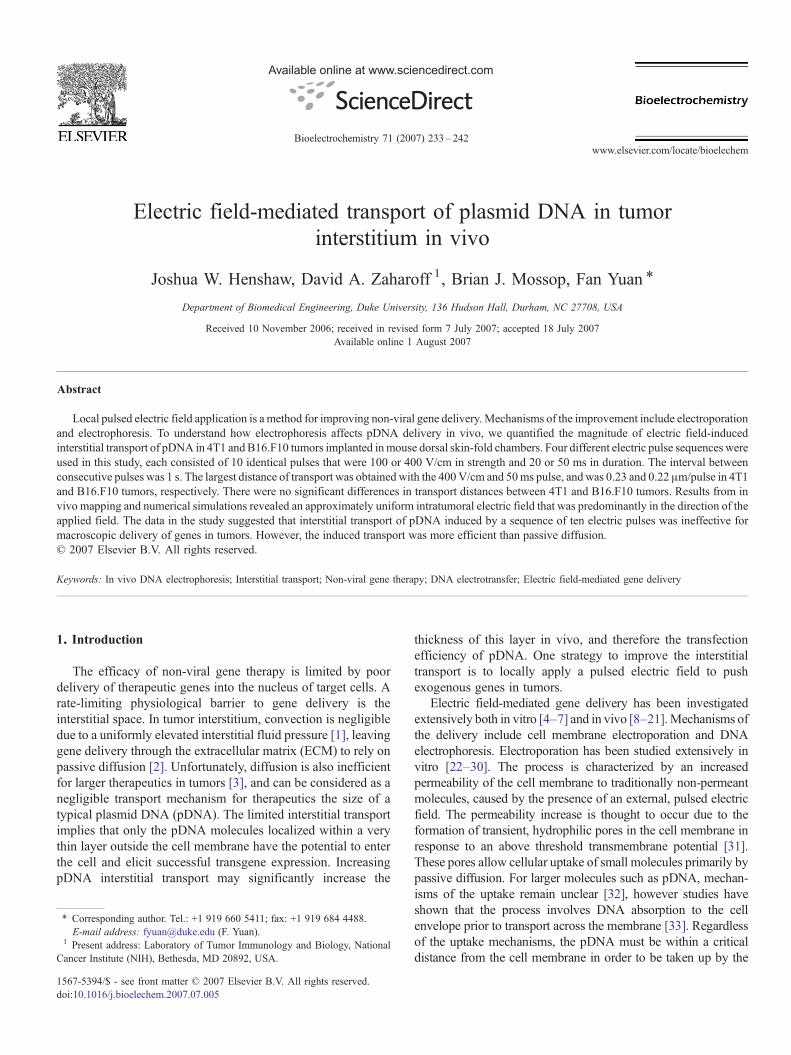
Fig. 6. (A) A schematic of electrode array placement for recording ofintratumoral potential distribution. Other panels in the figure show isopotentialplots in 4T1 (B, D) and B16.F10 (C, E) tumors during the application of a 100 V/cm (B, C) or 400 V/cm (D, E) pulse with 20 ms in duration. The label on eachisopotential plot indicates the value of electric potential. The labels of thehorizontal and vertical axes represent the coordinates of the recording electrodeson the 5×5 electrode array. Center-to-center spacing of adjacent recordingelectrodes was 400 μm.
239J.W. Henshaw et al. / Bioelectrochemistry 71 (2007) 233–242
mg of wet tissue, respectively. The data in three B16.F10 tumorswere 3.35 μg, 3.44 μg, and 5.98 μg (mean=4.26 μg) per mg ofwet tissue, respectively. The difference in the collagen content
Fig. 7. Isopotential plot in a DSC cross-section using the data from the numerical simubetween adjacent plots is 0.5 V.
between 4T1 and B16.F10 tumors grown in DSCs was notstatistically significant (P=0.705).
Histological analysis was also performed on 4T1 and B16.F10 tumor sections excised from DSCs. Masson trichromestaining of the 5-μm sections revealed similar levels of collagencontent in 4T1 and B16.F10 tumors (Fig. 5). In addition, thehistological images showed a heterogeneous distribution ofcollagen within individual sections. The heterogeneity mightcontribute to the variations in the magnitude of electric field-induced pDNA movement indicated by the scattering of datapoints shown in Fig. 3.
3.5. In vivo electric potential distribution
The intratumoral electric potential distribution, and theresulting electric field, were mapped in vivo using a 5×5microelectrode array (see Fig. 6). The array, commonly referred toas a Utah array, was depressed slightly into the center of a tumor.The potentials at each of the 25 electrodes were recordedsequentially when 25 identical pulses with the strength of 100 or400 V/cm and duration of 20mswere applied. Themeasurementswere performed three times at each electrode and the averageresults are reported here. Representative potential distributionswithin both 4T1 and B16.F10 tumors are shown as isopotentialplots in Fig. 6. The intratumoral electric fieldswere approximatelyuniform in both tumor types. The slight nonlinearities in theisopotential plots should not drastically affect the magnitude ofdriving force, i.e., the magnitude of electric field, for theelectrophoretic movement observed in this study.
The magnitudes of the electric field were determined througha linear regression analysis of the isopotential plots obtainedwith the Utah array. They were 17.9 V/cm and 200 V/cm in 4T1tumors for the 100 V/cm and 400 V/cm applied fields,respectively. The magnitudes in the B16.F10 tumors for thesame applied fields were 23.0 and 237 V/cm, respectively.
The electric potential distribution in the tumor implanted in aDSC was also simulated numerically using a finite elementmethod. The isopotential plot in a cross section of the DSC,which was a plane perpendicular to the skin and the parallel-plate electrodes, is shown in Fig. 7. The plot suggested that theelectric field near the center of the tumor, where the pDNAelectrophoretic movement was measured, was approximatelyuniform and predominantly in the direction of applied field.
lations. The strength of the applied field was 100 V/cm. The potential difference
240 J.W. Henshaw et al. / Bioelectrochemistry 71 (2007) 233–242
4. Discussion
We successfully adapted the experimental technique, developedpreviously for ex vivo pDNAmobilitymeasurement, to quantify invivo electrophoresis of pDNA in electric field-mediated genedelivery in tumor interstitium. The technique was based on theDSCmousemodel that allowed noninvasive access to living tumorinterstitium with fluorescence confocal microscopy, and the cross-correlation analysis that allowed quantification of average pDNAdisplacement within a field of view.
Electrical parameters for in vivo DNA electrotransfer have yetto be homogenized in the literature. In particular, pulse durationmay vary from less than 100 μs up to 50 ms and pulse strengthmay vary from 10V/cm to up to 2.0 kV/cm. Both the strength andthe duration of electric pulses can affect the scale of electropho-retic movement of pDNA. It is plausible that increasing theseparameters can enhance pDNA electrophoretic movement.Unfortunately, increasing the energy of the applied pulses alsoincreases their adverse effects on tissues. Therefore, the higherenergy pulses, which may result in an irreversible cell membranemodification [42,43], are unlikely to be suitable for clinical use.
The pulse durations of 20 and 50 ms used in this study, whichrepresent the longer duration pulses used in the literature, wereconsidered to result in the greatest degree of electric field-inducedpDNAmobility [35]. On the other hand, the in vivo mobility datareported in this study showed that electric fields appliedtranscutaneously with parallel-plate electrodes were only effec-tive in driving pDNA over distances less than 0.25 μm per pulse,or 2.5 μm per 10-pulse sequence. The magnitude of thismovement is insignificant in terms of macroscopic transportwithin a tumor since it accounts for only one quarter of thediameter of a single cell (∼10μm). This observation suggests thatelectric fields are not a viable option for enhancing themacroscopic distribution of pDNA within solid tumors. Othertechniques, such as intratumoral infusion [44–46], are likely to bebetter choices for improving pDNA distribution within a tumor.
While the electrophoretic component of electric field-mediatedgene delivery may not play a significant role in macroscopicpDNA movement, it may still have significant contributions toenhancing gene delivery in vivo. Results from this study showedthat in the absence of an applied field, there was no detectableinterstitial transport of pDNA. The distance of pDNA movementwas statistically greater than zero only if a pulsed field was appliedto tumors. This observation confirmed a notion that DNAelectrophoresis was several orders ofmagnitude faster than passivediffusion [37,38]. As a result, the interstitial electrophoresis couldeffectively push more pDNA molecules towards the transientpores in the plasma membrane of cells. While mechanisms ofcellular uptake of pDNA are still not fully understood [47–50], theincrease in extracellular transport of pDNA towards the porescould contribute to the increased levels of transgene expressionobserved in previous studies [34–36].
Previous reports have shown that electric fields are effective indriving the movement of pDNA over a greater distance in tissuephantoms composed of agarose gels [38]. Agarose gels are consi-dered as accurate phantoms for tissue interstitium, as the fibrousnetwork formed by agarose during solidification is structurally
similar to the extracellularmatrix (ECM) in tissue interstitium. Thediscrepancies between the magnitudes of electrophoretic move-ment reported in the Ref. [38] and those reported here may beattributed to differences in fiber spacings and local electric fieldsbetween the phantoms and tumor tissues. We have demonstratedthat electric fields in the phantoms are significantly higher thanthose in tumor tissues when exposed to the same pulsed electricfields [51]. Furthermore, the spacings in agarose gels are likely tobe significantly larger than those in tumor ECM [3,38].
Zaharoff et al. have previously demonstrated that theelectrophoretic mobility of pDNA in 4T1 tumors, whendetermined ex vivo, is significantly different from that in B16.F10 tumors [37]. The in vivo results obtained in this studyshowed no significant difference between the two tumors.Nevertheless, the levels of electrophoretic mobility in bothstudies correlated with the collagen content of the tumor. Theseobservations were consistent with that of the diffusioncoefficient of macromolecules in tumors, which also correlateswith the collagen content [39,52], suggesting that collagen is oneof the main barriers for interstitial transport of macromolecules.
The differences in the collagen content between the ex vivo andthe in vivo studies mentioned above might be attributed to thedifferent locations of tumor growth. Tumors used in the ex vivoexperimentswere harvested from the hind leg, while tumors in thisstudywere from theDSC. Previous studies have shown that tumorcomposition can vary with the site of implantation [53]. Inaddition, the differences in the collagen content might be due todifferent stages of tumor growth. In the ex vivo study, tumors wereexcised when they reached ∼10 mm in diameter. In this study,tumors were used when they were 3–4 mm in diameter.
The local electric field was mapped in vivo in mouse DSCs inthis study. The results demonstrated that the electric fields, whichwere the driving force for pDNA movement, were approximatelyuniform in the central region of tumors where the electrophoreticmobility was measured. The slight nonlinearity observed in theisopotential plots in both tumors shown in Fig. 6might be attributedto inhomogeneities in tissue structures, as shown in histologicalexaminations (see Fig. 5). A common trend observed in theisopotential plots shown in Fig. 6 was that the nonlinearity was afunction of the tissue structure but not the magnitude of the appliedfield. Results from the numerical simulations also demonstratedlittle variation in the electric field as a function of depth in thecentral region of the tumor (see Fig. 7). The intratumoral electricfield will not be uniform if the external electric field is appliedthrough needle electrodes [54,55].
The intratumoral electric fields mapped in the central regionwere approximately 20% of the applied field at 100 V/cm in bothtumors and increased to approximately 55% of the applied field at400 V/cm. The increase was mainly due to electric field-inducedreduction in the total electrical resistance of skin and electrode-tissue interface [51]. To further increase the electric field in tumors,one can improve the connection between tissue and electrodes toreduce the interface resistance and treat the skin to reduce itselectric resistance [56,57] or use internal electrodes to bypass theskin.
Previous studies using agarose gel as a interstitium phantomshowed an increase in electromobility with increasing either pulse
241J.W. Henshaw et al. / Bioelectrochemistry 71 (2007) 233–242
duration or pulse magnitude [38,58]. These dependences wereattributed to the sievingmechanism of the agarose fibermatrix andthe necessity of the DNA molecule to be deformed to an extentbefore it was able to reptate through the matrix. It was expectedthat the collagen fibers of the ECMwould have a similar effect onDNA transport in vivo. However, the in vivo findings reportedhere appeared to contradict these previous findings as they showedthat the dependences of electromobility on pulse magnitude andpulse duration of the applied field were statistically insignificant.The pulse duration and pulse magnitude only affected the rangesof data within the same experimental groups (see Fig. 4).
As a possible explanation for the above observations, themagnitude of pDNAmovement observed in the 100 V/cm appliedfield may represent the initial movement of the molecule from itspost injection site to its first encounter with a physical obstacle(i.e., cell or ECM) in tissues. The applied field of 100V/cm, whichyielded intratumoral electric fields of 17.9 and 23.0 V/cm in 4T1andB16.F10, respectively, may not have been sufficient to deformthe pDNA to the extent necessary to pass through the pores in theinterstitium. This mechanism of DNA transport has beendemonstrated in an agarose gel [58], suggesting that pDNAelectrophoresis is relatively unhindered over approximately 250and 500 nm distances in 4T1 and B16.F10 tumors, respectively.When the magnitude of electric field was increased to 400 V/cm,the intratumoral fields were increased to 200 and 237V/cm in 4T1and B16.F10, respectively, which were likely to be sufficient toallow pDNA to pass through the pores in the interstitium. As aresult, the distances of pDNA movement increased significantlywith increasing the pulse duration in both tumors.
In summary, this study provides the first known, directquantification of electric field-induced interstitial transport ofpDNA in vivo in tumors. The results showed that the magnitudeof the transport, induced by a sequence of ten electrophoreticpulses commonly used in electric field-mediated gene delivery,was insufficient for DNA to move macroscopically throughtissues. However, the magnitude of the movement wassignificantly greater than that observed in the absence of anapplied electric field. Induced transport at this magnitude may becritical for local movement of pDNA from the interstitial spaceto the transient pores in the plasma membrane of electro-permeabilized cells. To induce greater macroscopic movementof pDNA, additional methods must be developed to overcometransport barriers in tumor interstitium.
Acknowlegments
This work was supported in part by a grant from the NationalInstitutes of Health (NIH) (CA94019). JWH was supported inpart by a NIH training grant for the Center for Biomolecular andTissue Engineering at Duke University.
References
[1] Y. Boucher, L.T. Baxter, R.K. Jain, Interstitial pressure gradients in tissue-isolated and subcutaneous tumors: implications for therapy, Cancer Res. 50(1990) 4478–4484.
[2] P.A. Netti, L.M. Hamberg, J.W. Babich, D. Kierstead, W. Graham, G.J.Hunter, G.L. Wolf, A. Fischman, Y. Boucher, R.K. Jain, Enhancement of
fluid filtration across tumor vessels: implication for delivery of macro-molecules, Proc. Natl. Acad. Sci. U. S. A. 96 (1999) 3137–3142.
[3] A. Pluen,Y. Boucher, S. Ramanujan, T.D.McKee, T. Gohongi, E. di Tomaso,E.B. Brown, Y. Izumi, R.B. Campbell, D.A. Berk, R.K. Jain, Role of tumor-host interactions in interstitial diffusion of macromolecules: cranial vs.subcutaneous tumors, Proc. Natl. Acad. Sci. U. S. A. 98 (2001) 4628–4633.
[4] E. Neumann, M. Schaefer-Ridder, Y. Wang, P.H. Hofschneider, Genetransfer into mouse lyoma cells by electroporation in high electric fields,EMBO J. 1 (1982) 841–845.
[5] H. Potter, Electroporation in biology: methods, applications, andinstrumentation, Anal. Biochem. 174 (1988) 361–373.
[6] E. Neumann, Membrane electroporation and direct gene transfer,Bioelectrochem. Bioenerg. 28 (1992) 247–267.
[7] H. Wolf, M.P. Rols, E. Boldt, E. Neumann, J. Teissie, Control by pulseparameters of electric field-mediated gene transfer in mammalian cells,Biophys. J. 66 (1994) 524–531.
[8] E. Neumann, S. Kakorin, K. Toensing, Fundamentals of electroporativedelivery of drugs and genes, Bioelectrochem. Bioenerg. 48 (1999) 3–16.
[9] L.M. Mir, M.F. Bureau, J. Gehl, R. Rangara, D. Rouy, J.M. Caillaud, P.Delaere, D. Branellec, B. Schwartz, D. Scherman, High-efficiency genetransfer into skeletal muscle mediated by electric pulses, Proc. Natl. Acad.Sci. U. S. A. 96 (1999) 4262–4267.
[10] L. Heller, M.J. Jaroszeski, D. Coppola, C. Pottinger, R. Gilbert, R. Heller,Electrically mediated plasmid DNA delivery to hepatocellular carcinomasin vivo, Gene Ther. 7 (2000) 826–829.
[11] J.M. Wells, L.H. Li, A. Sen, G.P. Jahreis, S.W. Hui, Electroporation-enhanced gene delivery in mammary tumors, Gene Ther. 7 (2000) 541–547.
[12] M. Bettan, M.A. Ivanov, L.M. Mir, F. Boissiere, P. Delaere, D. Scherman,Efficient DNA electrotransfer into tumors, Bioelectrochemistry 52 (2000)83–90.
[13] F. Lohr, D.Y. Lo, D.A. Zaharoff, K. Hu, X. Zhang, Y. Li, Y. Zhao, M.W.Dewhirst, F. Yuan, C.Y. Li, Effective tumor therapy with plasmid-encodedcytokines combined with in vivo electroporation, Cancer Res. 61 (2001)3281–3284.
[14] S. Li, Z. Ma, Nonviral gene therapy, Curr. Gene Ther. 1 (2001) 201–226.[15] T. Tamura, T. Nishi, T. Goto, H. Takeshima, S.B. Dev, Y. Ushio, T. Sakata,
Intratumoral delivery of interleukin 12 expression plasmids with in vivoelectroporation is effective for colon and renal cancer, Hum. Gene Ther. 12(2001) 1265–1276.
[16] M.L. Lucas, L. Heller, D. Coppola, R. Heller, IL-12 plasmid delivery by invivo electroporation for the successful treatment of established subcuta-neous B16, F10 melanoma, Mol. Ther. 5 (2002) 668–675.
[17] R. Heller, Delivery of plasmid DNA using in vivo electroporation,Preclinica 1 (2003) 198–208.
[18] F. Andre, L.M.Mir, DNAelectrotransfer: its principles and anupdated reviewof its therapeutic applications, Gene Ther. 11 (Suppl 1) (2004) S33–S42.
[19] M. Golzio, M.P. Rols, J. Teissie, In vitro and in vivo electric field-mediatedpermeabilization, gene transfer, and expression, Methods 33 (2004)126–135.
[20] L.M. Mir, P.H. Moller, F. Andre, J. Gehl, Electric pulse-mediated genedelivery to various animal tissues, Adv. Genet. 54 (2005) 83–114.
[21] S. Kachi, Y. Oshima, N. Esumi, M. Kachi, B. Rogers, D.J. Zack, P.A.Campochiaro, Nonviral ocular gene transfer, Gene Ther. 12 (2005) 843–851.
[22] D.C. Chang, T.S. Reese, Changes in membrane structure induced byelectroporation as revealed by rapid-freezing electron microscopy,Biophys. J. 58 (1990) 1–12.
[23] T.Y. Tsong, Electroporation of cell membranes, Biophys. J. 60 (1991)297–306.
[24] D.C. Chang, Structure and dynamics of electric field-induced membranepores as revealed by rapid-freezing electron microscopy, in: D.C. Chang,B.M. Chassy, J.A. Saunders, A.E. Sowers (Eds.), Guide to Electroporationand Electrofusion, Academic Press, Inc., San Diego, 1992, pp. 9–27.
[25] J.C. Weaver, Electroporation: a general phenomenon for manipulatingcells and tissues, J. Cell. Biochem. 51 (1993) 426–435.
[26] R.F. Probstein, Physicochemical Hydrodynamics, John Wiley & Sons,Inc., New York, 1994.
[27] E. Neumann, S. Kakorin, K. Toensing, Principles of membraneelectroporation and transport of macromolecules, in: M.J. Jaroszeski, R.
242 J.W. Henshaw et al. / Bioelectrochemistry 71 (2007) 233–242
Heller, R. Gilbert (Eds.), Electrochemotherapy, electrogenetherapy, andtransdermal drug delivery: Electrically mediated delivery of molecules tocells, Humana Press, Totowa, 2000, pp. 1–35.
[28] L.M.Mir, Therapeutic perspectives on in vivo cell electropermeabilization,Bioelectrochemistry 53 (2000) 1–10.
[29] P.J. Canatella, J.F. Karr, J.A. Petros, M.R. Prausnitz, Quantitative study ofelectroporation-mediated molecular uptake and cell viability, Biophys. J.80 (2001) 755–764.
[30] J. Teissie, M. Golzio, M.P. Rols, Mechanisms of cell membraneelectropermeabilization: a minireview of our present (lack of ?)knowledge, Biochim. Biophys. Acta 1724 (2005) 270–280.
[31] J.C. Weaver, Y.A. Chizmadzhev, Theory of electroporation: a review,Bioelectrochem. Bioenerg. 41 (1996) 135–160.
[32] J. Gehl, Electroporation: theory and methods, perspectives for drugdelivery, gene therapy and research, Acta Physiol. Scand. 177 (2003)437–447.
[33] E. Neumann, S. Kakorin, I. Tsoneva, B. Nikolova, T. Tomov, Calcium-mediated DNA adsorption to yeast cells and kinetics of cell transformationby electroporation, Biophys. J. 71 (1996) 868–877.
[34] M.F. Bureau, J. Gehl, V. Deleuze, L.M. Mir, D. Scherman, Importance ofassociation between permeabilization and electrophoretic forces forintramuscular DNA electrotransfer, Biochim. Biophys. Acta 1474 (2000)353–359.
[35] S. Satkauskas, M.F. Bureau, M. Puc, A. Mahfoudi, D. Scherman, D.Miklavcic, L.M. Mir, Mechanisms of in vivo DNA electrotransfer:respective contributions of cell electropermeabilization and DNAelectrophoresis, Mol. Ther. 5 (2002) 133–140.
[36] S. Satkauskas, F. Andre, M.F. Bureau, D. Scherman, D. Miklavcic, L.M.Mir, Electrophoretic component of electric pulses determines the efficacyof in vivo DNA electrotransfer, Hum. Gene Ther. 16 (2005) 1194–1201.
[37] D.A. Zaharoff, R.C. Barr, C.Y. Li, F. Yuan, Electromobility of plasmidDNA in tumor tissues during electric field-mediated gene delivery, GeneTher. 9 (2002) 1286–1290.
[38] D.A. Zaharoff, F. Yuan, Effects of pulse strength and pulse duration on invitro DNA electromobility, Bioelectrochemistry 62 (2004) 37–45.
[39] P.A. Netti, D.A. Berk, M.A. Swartz, A.J. Grodzinsky, R.K. Jain, Role ofextracellular matrix assembly in interstitial transport in solid tumors,Cancer Res. 60 (2000) 2497–2503.
[40] C.A. Edwards, W.D. O'Brien Jr., Modified assay for determination ofhydroxyproline in a tissue hydrolyzate, Clin. Chim. Acta 104 (1980)161–167.
[41] N. Pavselj, Z. Bregar, D. Cukjati, D. Batiuskaite, L.M. Mir, D. Miklavcic,The course of tissue permeabilization studied on a mathematical model of asubcutaneous tumor in small animals, IEEE Trans. Biomed. Eng. 52(2005) 1373–1381.
[42] A. Leroy-Willig, M.F. Bureau, D. Scherman, P.G. Carlier, In vivo NMRimaging evaluation of efficiency and toxicity of gene electrotransfer in ratmuscle, Gene Ther. 12 (2005) 1434–1443.
[43] P. Lefesvre, J. Attema, D. van Bekkum, A comparison of efficacy andtoxicity between electroporation and adenoviral gene transfer, BMC Mol.Biol. 3 (2002) 12.
[44] X.Y. Zhang, J. Luck, M.W. Dewhirst, F. Yuan, Interstitial hydraulicconductivity in a fibrosarcoma, Am. J. Physiol. Heart Circ. Physiol. 279(2000) H2726–H2734.
[45] Y. Wang, S. Liu, C.Y. Li, F. Yuan, A novel method for viral gene deliveryin solid tumors, Cancer Res. 65 (2005) 7541–7545.
[46] S. McGuire, D. Zaharoff, F. Yuan, Nonlinear dependence of hydraulicconductivity on tissue deformation during intratumoral infusion, Ann.Biomed. Eng. 34 (2006) 1173–1181.
[47] M. Golzio, J. Teissie, M.P. Rols, Direct visualization at the single-cell levelof electrically mediated gene delivery, Proc. Natl. Acad. Sci. U. S. A. 99(2002) 1292–1297.
[48] Y. Antov, A. Barbul, H. Mantsur, R. Korenstein, Electroendocytosis:exposure of cells to pulsed low electric fields enhances adsorption anduptake of macromolecules, Biophys. J. 88 (2005) 2206–2223.
[49] E. Phez, C. Faurie, M. Golzio, J. Teissie, M.P. Rols, New insights in thevisualization of membrane permeabilization and DNA/membrane interac-tion of cells submitted to electric pulses, Biochim. Biophys. Acta 1724(2005) 248–254.
[50] F. Liu, S. Heston, L.M. Shollenberger, B. Sun, M. Mickle, M. Lovell, L.Huang, Mechanism of in vivo DNA transport into cells by electroporation:electrophoresis across the plasma membrane may not be involved, J. GeneMed. 8 (2006) 353–361.
[51] B.J.Mossop,R.C.Barr, J.W.Henshaw,D.A. Zaharoff, F. Yuan, Electric fieldsin tumors exposed to external voltage sources: implication for electric field-mediated drug and gene delivery, Ann. Biomed. Eng. 34 (2006) 1564–1572.
[52] S. Ramanujan, A. Pluen, T.D. McKee, E.B. Brown, Y. Boucher, R.K. Jain,Diffusion and convection in collagen gels: implications for transport in thetumor interstitium, Biophys. J. 83 (2002) 1650–1660.
[53] S.K. Hobbs, W.L. Monsky, F. Yuan, W.G. Roberts, L. Griffith, V.P.Torchilin, R.K. Jain, Regulation of transport pathways in tumor vessels:role of tumor type and microenvironment, Proc. Natl. Acad. Sci. U. S. A.95 (1998) 4607–4612.
[54] D. Sel, S. Mazeres, J. Teissie, D. Miklavcic, Finite-element modeling ofneedle electrodes in tissue from the perspective of frequent modelcomputation, IEEE Trans. Biomed. Eng. 50 (2003) 1221–1232.
[55] S.B. Dev, D. Dhar, W. Krassowska, Electric field of a six-needle arrayelectrode used in drug and DNA delivery in vivo: analytical versusnumerical solution, IEEE Trans. Biomed. Eng. 50 (2003) 1296–1300.
[56] M.R. Prausnitz, V.G. Bose, R. Langer, J.C. Weaver, Electroporation ofmammalian skin: a mechanism to enhance transdermal drug delivery, Proc.Natl. Acad. Sci. U. S. A. 90 (1993) 10504–10508.
[57] J.C. Weaver, T.E. Vaughan, Y. Chizmadzhev, Theory of electrical creationof aqueous pathways across skin transport barriers, Adv. Drug Deliv. Rev.35 (1999) 21–39.
[58] J.W. Henshaw, D.A. Zaharoff, B.J. Mossop, F. Yuan, A single moleculedetection method for understanding mechanisms of electric field-mediatedinterstitial transport of genes, Bioelectrochemistry 69 (2006) 248–253.
[59] R.K. Jain, Barriers to drug delivery in solid tumors, Sci. Am. 271 (1994)58–65.