Client Westinghouse Electric Company Boring: BR-6-RB Drilling
Westinghouse
Eric Gilstrap, PEProject ManagerMDNR, Federal FacilitiesSection917 N. Highway 67, Suite 104Florissant, MO 63031eric. eil [email protected]. gov
Westinghouse Non-Proprietary Class 3
Westinghouse Electric Company LLCHematite Decommissioning Proj ect3300 State Road PFestus. MO 63028USA
Direct tel: 3 14-8 I 0-337 5
Direct Fax: 3 14-8 I 0-3301Email : malirnnj @westinghouse. comOur ref: HEM-12-40Date: March 27.2012
Ms. Julieann WarrenProject Quality AssuranceOfficerMDNR, Superfund SectionP.O. Box 176Jefferson City, MO 65102i ulieann. [email protected]. eov
Subject: SUBMISSION OF INTERIM GROTINDWATER MONITORING PLAN,(rGMP) REVTSION 3
HEMATITE DECOMMIS SIONING PROJECTHEMATITE, MISSOURI
Dear Mr. Gilstrap and Ms. Warren:
Enclosed for your review is a copy of the newly revised Interim Groundwater MonitoringReport, Revision 3. This revision reflects the removal of the groundwater wells that wereabandoned in January and February 2012 from the text, Table I and corresponding figures.
If you have any questions or are in need of any additional information, please feel free tocontact me at (314) 810-3375.
Sincerely,
1v\,fr 7n*1*Matt MalinEnvironmental ManagerHematite Decommissioning Proj ect
Enclosure: EO-06-003 Interim Groundwater Monitoring Plan, Revision 3,March20l2
ccr Michele Gutman, WECRobert D. Copp, HDP
@ 2012 Westinghouse Electric Company LLCAll Rights Reserved
Westinghouse Non-Proprietary Class 3
© 2012 Westinghouse Electric Company LLC All Rights Reserved
EO-06-003
Interim Groundwater Monitoring Plan
Revision 3
Westinghouse Electric Company LLC Hematite Facility 3300 State Road P Festus, MO 63028
March 2012
Approvals: Author: Martin Swanson* Manager: Matt Malin* Project Director: Robert Copp*
*Electronically Approved Records are Authenticated in the Electronic Document Management System
EO-06-003 i Revision 3
TABLE OF CONTENTS
SECTION
LIST OF TABLES .......................................................................................................................... ii
PAGE
LIST OF FIGURES ........................................................................................................................ ii ABBREVIATIONS AND ACRONYMS ...................................................................................... iii 1.0 INTRODUCTION ...............................................................................................................1
1.1 PURPOSE AND SCOPE .........................................................................................2 1.1.1 Purpose .........................................................................................................2 1.1.2 Scope ............................................................................................................2
1.2 SITE DESCRIPTION AND OPERATIONAL HISTORY .....................................2 1.3 SUMMARY OF RI AND IGMP SAMPLING FOR GROUNDWATER...............3 1.4 ANALYTICAL APPROACH FOR IGMP ..............................................................7 1.5 PLANS AND PROCEDURES ................................................................................7
2.0 MONITORING WELL SAMPLING AND ANALYSIS ....................................................8 2.1 MONITORING WELL FUNCTIONAL GROUPS AND SAMPLING
PROTOCOL ............................................................................................................8 2.1.1 Group I: Sentry Wells .................................................................................8 2.1.2 Group II: Fringe Wells ................................................................................9 2.1.3 Groups III: Plume Wells .............................................................................9 2.1.4 Group IV: Source Wells............................................................................10 2.1.5 Current NRC License Sampling Wells ......................................................11 2.1.6 Remaining Site Wells ................................................................................11
2.2 SAMPLING ACTIVITIES ....................................................................................12 2.2.1 Field Measurements ...................................................................................12 2.2.2 Groundwater Sampling ..............................................................................12 2.2.3 Additional Data ..........................................................................................13
2.3 SAMPLE DESIGNATION ....................................................................................13 2.4 QUALITY CONTROL ..........................................................................................13 2.5 MANAGEMENT OF WASTE ..............................................................................14
3.0 SURFACE WATER LEVEL MEASUREMENTS ...........................................................15 4.0 DATA ASSESSMENT AND REPORTING .....................................................................16
4.1 DATA QUALITY ..................................................................................................16 4.2 DATA REPORTING .............................................................................................16
5.0 HEALTH AND SAFETY ..................................................................................................18 6.0 REFERENCES ..................................................................................................................19
EO-06-003 ii Revision 3
LIST OF TABLES
Table 1 Monitoring Well Functional Groups and Sampling Protocol Table 2 Summary of IGMP Revisions Table 3 Remaining Site Wells Retained for Groundwater Flow Measurements Table 4 Analytical Methods, Sample Containers, Preservation, and Holding Times Table 5 Field Quality Control Sample Summary Table 6 Analytical Parameters, Methods, and Detection Limits
LIST OF FIGURES
Figure 1 Group I Sentry Wells Figure 2 Group II Fringe Wells Figure 3 Group III Plume Wells Figure 4 Group IV Source Wells Figure 5 Remaining Site Wells
EO-06-003 iii Revision 3
ABBREVIATIONS AND ACRONYMS
AHA Activity hazard analysis COC Constituent of concern DNAPL Dense, non-aqueous phase liquid FD Field duplicate ft Feet ft-bgs Feet below ground surface IDW Investigation-derived waste IGMP Interim Groundwater Monitoring Plan MCL Maximum Contaminant Level MDC Minimum detectable concentration MDNR Missouri Department of Natural Resources MS Matrix spike MSD Matrix spike duplicate NRC Nuclear Regulatory Commission OU1 Operable Unit 1 PCE Perchloroethylene pCi/L Picocuries per liter QA Quality assurance QAPP Quality Assurance Program Plan QC Quality control RB Rinsate blank RI Remedial Investigation SAIC Science Applications International Corporation SNM Special nuclear material TB Trip blank Tc-99 Technetium-99 TCE Trichloroethylene U-234 Uranium-234 U-235 Uranium-235 U-238 Uranium-238 USEPA U.S. Environmental Protection VOC Volatile organic compound Westinghouse Westinghouse Electric Company LLC
Interim Groundwater Monitoring Plan
EO-06-003 1 Revision 3
1.0 INTRODUCTION This revision to the Interim Groundwater Monitoring Plan (IGMP) identifies groundwater sampling and analysis activities to be performed in the vicinity of the former fuel cycle Facility in Hematite, Missouri, herein referred to as “the Site.” Revision 1 was based on review of data generated from the Remedial Investigation (RI) (Science Applications International Corporation [SAIC], 2007) (Ref. 6.1) and the 12 quarters of groundwater data collected from June 2007 through March 2010, and the monitoring that is currently performed in accordance with Special Nuclear Materials License SNM-33 issued by the U.S. Nuclear Regulatory Commission (NRC). Revision 2 was necessary to remove the wells that were abandoned in April 2011 from the list of monitoring wells to be sampled. Revision 2 also defined the monitoring to be implemented at the Site prior to and during implementation of the remedy for Operable Unit 1 (OU1). Revision 3 is necessary to remove the wells that were abandoned in January and February 2012 as approved by the Missouri Department of Natural Resources (MDNR).
Due to the evolving nature of Site conditions, and based on the review of IGMP data collected to date, sampling requirements changed from Revision 0 to Revision 1 of this document. Revision 1 to the IGMP defined five categories of wells are used for monitoring of radionuclides and volatile organic compounds (VOCs) in groundwater (Table 1). These categories did not change from Revision 1 to Revision 3 and are described below:
• Group I wells serve as sentry wells. This group of wells is positioned beyond the current boundary of identified contamination and is designed to detect expansion of the plume. The wells chosen as Group I wells have historically shown no contamination. These wells monitor the overburden, the Jefferson City Formation, and the Roubidoux Formation.
• Group II wells serve as fringe wells that are utilized to assess the plume for expansion or changes in the mass contaminant loading in the groundwater. The fringe wells are located along the farthest extent of contamination. These wells monitor the overburden, the Jefferson City Formation, and the Roubidoux Formation.
• Group III wells serve as plume wells and have been selected to represent areas of known contamination. The data are used to evaluate trends in plume movement and concentrations of constituents of concern (COCs). These wells monitor the overburden, the Jefferson City Formation, and the Roubidoux Formation.
• Group IV wells serve as source wells. This group of wells is located in the central tract area of the Site in areas suspected of being sources of groundwater impacts. This group of wells is comprised of overburden wells. These wells are located in areas of OU1 remediation, and the data collected from these wells is evaluated and used for selection of future replacement wells after the OU1 remediation is completed.
• Monitoring wells that serve as license required groundwater monitoring wells and are sampled in accordance with the license SNM-33 requirements.
Interim Groundwater Monitoring Plan
EO-06-003 2 Revision 3
Changes in monitoring requirements from the original IGMP to Revision 3 are summarized in Table 2. This revision does not impact the requirements other than the removal of decommissioned wells. Remaining Site wells (Table 3) serve as groundwater flow wells. These wells are monitored for water elevation and are used for developing potentiometric surface maps.
1.1 PURPOSE AND SCOPE
1.1.1 Purpose The purpose of the original IGMP, which was implemented from June 2007 through March 2010, was to provide periodic groundwater data for evaluation of potential temporal or seasonal changes in concentrations and migration pathways for COCs that were defined in the RI. The specific goals of this revised IGMP are as follows:
• Continue to provide periodic data to evaluate potential changes in COC concentrations within the identified plumes in the bedrock and overburden units at the Site;
• Continue to provide periodic data to assess potential changes in the concentration of COCs at the fringe of the identified plumes in the bedrock and overburden units at the Site;
• Provide periodic data to identify the potential presence of COCs at the sentry wells in the vicinity of the Site;
• Provide periodic data to evaluate potential changes in groundwater elevations, with regard to impacts on regional flow, in the local bedrock units in the vicinity of the Site;
• Provide data to evaluate fluctuations in water levels due to local or regional pumping within the Roubidoux Formation and the impact of private well construction in the area;
• Provide data to evaluate groundwater/surface water interactions; and
• Provide data to assess the impacts of remedial actions on the site groundwater.
1.1.2 Scope The scope of this IGMP includes sampling of existing overburden and bedrock monitoring wells and select private wells for radionuclides and VOCs.
1.2 SITE DESCRIPTION AND OPERATIONAL HISTORY Westinghouse Electric Company LLC (Westinghouse) is the current owner of 228 acres of property in eastern Missouri, in Jefferson County, east of the town of Hematite, where a manufacturing Facility (Facility) is located that formerly produced nuclear fuels from natural, depleted, and enriched uranium. As used throughout this document, the “Facility” refers to the historical primary operations area as well as Site Pond and Burial Pits areas, while the “Site”
Interim Groundwater Monitoring Plan
EO-06-003 3 Revision 3
refers to the Facility plus other areas that were the focus of investigations based on potential impacts by previous Facility operations.
The Facility began operations in the early 1950s and was expanded or modified several times during its period of operation, until operations ceased in June 2001. The Facility is southeast of State Route P between hills to the northwest and a terrace/floodplain of Joachim Creek, a tributary of the Mississippi River. The surface topography of the terrace deposit slopes gently to the southeast and blends with the alluvial floodplain deposits of Joachim Creek. Both grassy areas and wooded areas cover these two deposits; the terrace deposits are primarily grass covered, and the alluvial deposits are primarily wooded.
Westinghouse purchased the Facility in 2000 and is proceeding to decommission and remediate the Facility in accordance with NRC and MDNR regulations. The activities are being performed in accordance with the National Oil and Hazardous Substances Contingency Plan. The Site characterization is presented in a Remedial Investigation report, which has been reviewed by the MDNR.
1.3 SUMMARY OF RI AND IGMP SAMPLING FOR GROUNDWATER The RI determined that the primary COCs at the Site are VOCs, primarily perchloroethylene or perchloroethene (PCE) and trichloroethylene or trichloroethene (TCE), and radiologic compounds, including technetium-99 (Tc-99) and several isotopes of uranium (i.e., U-234, U-235, U-238). The following groundwater summary is based on the RI results and an evaluation of groundwater conditions performed in June 2011.
VOC contamination of groundwater is present in both the overburden and bedrock layers. The VOCs present include PCE, TCE, and their degradation products. The distribution of PCE and TCE in groundwater appears to reflect one or more source areas associated with the Hematite Facility. A number of sampling locations have sufficiently elevated PCE or TCE concentrations to suggest the nearby presence of dense, non-aqueous phase liquid (DNAPL). PCE and TCE in the overburden originate at the Facility and extend southeastward toward Joachim Creek. In the bedrock, one component of contamination in the Jefferson City-Cotter hydrostratigraphic unit has migrated in a southeasterly direction beneath Joachim Creek; a second component has migrated down dip from the Facility toward the northeast. Deeper contamination in the Roubidoux bedrock has only been confirmed in association with former private wells PW-19, PW-16, and PW-06 in a residential community to the southeast of the Facility and with private well PW-03 located east-northeast of the Facility.
Tc-99 and, to a lesser extent, uranium is present above background levels in soils located within close proximity to the former process buildings, but contamination is also associated with present or past waste or wastewater disposal features (i.e., the Evaporation Ponds, Deul’s Mountain, Site Pond and its effluent, and the Burial Pits) and soil beneath the former process buildings. The RI and IGMP data indicate that Tc-99 and uranium have not migrated to the same extent as VOCs. Elevated radionuclide activity levels are present in the leachate zone of the overburden in the same localized areas within the Facility as the soil contamination.
Interim Groundwater Monitoring Plan
EO-06-003 4 Revision 3
Analysis of the data generated from the RI indicates that VOCs are a leading indicator of contaminant migration in groundwater. The VOCs generally move more rapidly and further in groundwater than the radionuclides due to their physical properties and the interaction with the soil or rock matrix through which the groundwater flows.
While showing reductions from baseline 2004 (RI) concentrations, VOC concentrations in the overburden and bedrock formations continue to exceed human health criteria [Maximum Contaminant Levels (MCLs)] for groundwater in areas underlying and downgradient of the Facility. The extent of the VOC plume, as delineated by the IGMP monitoring, does not appear to have expanded beyond the 2004 baseline extent, as evidenced by the results of quarterly sampling at perimeter well locations. Radiological contamination in the leachate zone of the overburden is confined to the Facility area and adjacent perimeter. Groundwater elevation measurements obtained during the IGMP monitoring period indicate that flow in the overburden and upper Jefferson City bedrock formations is to the southeast from the Facility area in the direction of Joachim Creek. Groundwater flow in the deeper Roubidoux Formation is to the east-northeast and remains susceptible to the influences of regional pumping centers.
Analytical results from wells monitoring the periphery of the overburden contaminant plume as defined in 2004 indicate that constituents detected in wells located west of the plume boundary are below U.S. Environmental Protection Agency (USEPA) MCLs. However, VOC concentrations within the plume continued to exceed USEPA MCLs throughout the monitoring period. Further, analytical results from overburden source wells indicate that the Facility area wells continue to be impacted by VOC concentrations that exceed MCLs, with the exception of upgradient overburden wells and plume boundary wells.
Overburden Groundwater
Radionuclide activity in the overburden groundwater was predominantly detected in leachate generated within the Facility area (beneath the process buildings, within the burial pits, and the limestone storage area) and occasionally in wells adjacent to the perimeter of the Facility area. Gross alpha and gross beta activity in overburden groundwater at the Facility was generally below 15 picocuries per liter (pCi/L) and 50 pCi/L respectively, over the duration of the monitoring period.
In the IGMP monitoring, gross alpha activity exceeded 15 pCi/L in the following wells:
• Source Wells: - Facility area: BD-02, BD-03, BD-04, BD-06, BD-14, DM-02, and WS-24; - Evaporation Pond: EP-14, EP-16, and EP-20; - Burial Pits: BP-22B; and
• Plume Wells: NB-31 and NB-33.
In the IGMP monitoring, gross beta activity exceeded 50 pCi/L in the following wells:
• Source Wells:
Interim Groundwater Monitoring Plan
EO-06-003 5 Revision 3
- Facility area: BD-02, BD-03, BD-04, DM-02, PL-06, WS-17B, and WS-24; - Evaporation Pond: EP-14, EP-16, EP-20; - Burial Pits BP-22B;
• Plume Well: NB-31;
• Fringe Well: NB-50; and
• License Well: WS-07.
Tc-99 activity was detected in leachate generated within the Facility area and in groundwater wells NB-31, NB-33, NB-34, NB-35, and NB-84 adjacent to the perimeter of the Facility area.
Tc-99 activity exceeding the EPA MCL (900 pCi/L as calculated in accordance 40 CFR 141.66(d)(2)), was detected in the following wells:
• Source Wells: - Facility area: BD-02, BD-04, and WS-17B; and - Evaporation Ponds: EP-16, and EP-20.
Tc-99 activity was also detected on occasion in groundwater in wells NB-44, NB-72, NB-73, and NB-74 south of the Facility at levels between 1.15 and 5.95 pCi/L. The reported activity at these locations is within the range of minimum detectable concentrations (MDC) and analytical uncertainty.
Total uranium activity in leachate and groundwater ranged from 0.036 to 268.8 pCi/L between June 2007 and June 2008. Total uranium activity exceeded the USEPA MCL of 20 pCi/L for uranium compounds in drinking water in source area wells BD-02, BD-03, BD-04, BD-06, DM-02, and WS-24. Total uranium activity in wells DM-02 (143.5 to 244.8 pCi/L) and WS-24 (77.5 to 130.8 pCi/L) remained above 20 pCi/L for the duration of the monitoring period. Total uranium activity in samples not exceeding 20 pCi/L averaged 1.44 pCi/L with a standard deviation of 1.95 pCi/L.
Groundwater in the Jefferson City Formation continues to be impacted by source areas on the Hematite Facility and from the migration of VOCs through the upper Jefferson City bedrock. Concentrations of VOCs in monitoring wells located on the periphery of the investigation area and in wells PW-06-JC, BR-07-JC, and PW-16-JC located in the private well area southeast of Joachim Creek were below USEPA MCLs. Consistent with the decline or absence of VOCs in the peripheral Jefferson City monitoring wells, VOCs detected in paired Roubidoux Formation wells PW-06-RB and PW-16-RB were also below USEPA MCLs. However, concentrations of VOCs in the remaining plume wells continued to exceed drinking water criteria and MCLs. Contaminant concentrations in well PW-19-JC represent the leading edge of the VOC plume in the Jefferson City bedrock to the southeast. Well PW-19-RB is collocated with PW-19-JC in an area of historical groundwater production that (combined with production from the Festus
Jefferson City Formation
Interim Groundwater Monitoring Plan
EO-06-003 6 Revision 3
production wells) may have impacted plume development in the deeper bedrock formations as a result of pumping from open borehole supply wells that cross-connected the Jefferson City and Roubidoux Formations.
Concentrations of PCE, TCE, and vinyl chloride exceed USEPA drinking water and MCL criteria in well PW-03-RB located approximately 1,100 feet northeast of the Hematite Facility. The detection of contaminants in the downgradient (from the Hematite Facility) Roubidoux well is consistent with the easterly groundwater flow direction from the Facility but is inconsistent with the absence of contaminants in proximal wells BR-04-RB, BR-05-RB, and in co-located well PW-03-JC.
Gross alpha activity in wells exceeding 15 pCi/L was detected in widely separated wells BR-01-JC, BR-04-JC, PW-06, and PW-16-JC. Gross beta activity exceeding 50 pCi/L was detected in Facility well BR-01-JC and in well BR-04-JC northeast of the Facility during sampling in 2007. These detections are anomalous and have been below 50 pCi/L since 2007.
Positive Tc-99 activity was reported in widely separated bedrock wells PZ-03, BR-01-JC, BR-03-JC, and BR-08-JC. Two of the wells (BR-01-JC and PZ-03) are located on the Hematite Facility and the remaining wells (BR-03-JC, BR-08-JC) are located on the Joachim Creek floodplain south of the Facility. The overall trend for Tc-99 activity in these wells is within the range of MDC (1.2 to 13.4 pCi/L). The June 2007 Tc-99 activity in well BR-01-JC is anomalous based on the activity measured before and after the June 2007 sampling event; and not Site-related based on the hydraulically upgradient well location; the depth of the well screen (97 to 107 feet below ground surface [ft-bgs]); and the lack of detected activity in the adjacent overburden wells (CB-02, RR-05, OB-01, SW-07, and WS-34). The well has been sampled seven times since June 2007 with no reported Tc-99 activity above the MDC. Tc-99 activity in PZ-03 also declined within the range of the MDC over time; however, positive activity (3.7 and 2.5 pCi/L) was reported during consecutive sampling events in December 2008 and March 2009. The positive activity is approximately three orders of magnitude less than the activity observed in the overburden.
Wells BR-03-JC and BR-08-JC monitor shallow bedrock in the Jefferson City Formation underlying the floodplain of Joachim Creek. The wells are clustered with overburden (BR-03-OB, BR-08-OB) and deeper bedrock (BR-03-RB, BR-08-RB) wells at each location. Tc-99 activity was below the MDC in the clustered overburden and deeper bedrock wells. Each of the wells showed no activity during eight prior sampling events. The reported activity is oscillatory around zero and is not indicative of radiologic groundwater contamination in the Jefferson City bedrock. Total uranium activity in the Jefferson City Formation wells was below 6 pCi/L and is below the USEPA MCL of 20 pCi/L for total uranium compounds.
Concentrations of organic constituents were reported in the Roubidoux bedrock groundwater between June 2007 and June 2009, however, the majority of the reported compounds represented either isolated detections that were not repeated between sampling events or compounds that were detected in laboratory method blank samples indicating that the results are not Site-related.
Roubidoux Formation
Interim Groundwater Monitoring Plan
EO-06-003 7 Revision 3
Consistent with the decline or absence of organic contamination in the peripheral Jefferson City monitoring wells, VOCs detected in paired Roubidoux Formation wells PW-06-RB and PW-16-RB were also below USEPA MCLs. However, the detection of VOCs exceeding MCLs in Roubidoux well PW-03-RB is inconsistent with monitoring results obtained from the Sentry Wells. Well PW-19-RB is collocated with well PW-19-JC, which represents the leading edge of the VOC plume affecting the overlying Jefferson City Formation. The detection of contaminants in Roubidoux well PW-03-RB is inconsistent with the absence of contaminants in surrounding wells BR-04-RB, BR-05-RB, and in co-located well PW-03-JC. The detection of organic constituents in the Roubidoux Formation at wells PW-03-RB and PW-19-RB may be attributable to the historic migration of these constituents from the Jefferson City-Cotter Formation to the Roubidoux Formation through open borehole private wells. The open borehole private wells at these locations have since been converted to two collocated monitoring wells.
Reported radiological activity in the Roubidoux Formation wells indicates isolated gross alpha activity (15.2 to 17.5 pCi/L) exceeding the MCL was detected in wells BR-06-RB, BR-10-RB, and PW-19-RB. The detected activity was within the range of statistical uncertainty for the measurements and was not reproduced between sampling events. Gross beta activity in the Roubidoux wells was below 50 pCi/L.
1.4 ANALYTICAL APPROACH FOR IGMP Based on the RI and IGMP, the principal COCs for groundwater are VOCs, most notably PCE and TCE. As the VOCs are leading indicators of groundwater contamination, the IGMP is focused on VOC monitoring in the overburden and bedrock. The IGMP also includes periodic analysis of groundwater samples from monitoring wells for radiological contaminants associated with U-234, U-235, U-238, and Tc-99. As general water quality can affect the migration of COCs, the following water quality parameters will also be measured in the field:
• Temperature; • Turbidity; • pH; • Specific conductance; • Oxidation/reduction potential; and • Dissolved oxygen.
The IGMP sampling also includes surface water samples to be collected from Joachim Creek at locations that are upgradient, along the Facility boundary, and downgradient of the Facility. These samples will be analyzed for VOCs, isotopic Uranium, and Tc-99.
1.5 PLANS AND PROCEDURES Established Quality Assurance (QA) plans and procedures will be followed to ensure that field activities comply with the Project Quality Plan (HDP-PO-QA-001) (Ref. 6.4) and that all field activities are performed consistently to support comparability of analytical results. Westinghouse plans and procedures applicable for this project are listed in Section 6.0.
Interim Groundwater Monitoring Plan
EO-06-003 8 Revision 3
2.0 MONITORING WELL SAMPLING AND ANALYSIS This section identifies the monitoring wells to be sampled, the frequency of sampling, and the analytical requirements (field and laboratory) for the samples collected. The selection of specific monitoring points for the revised IGMP was based on review of the characteristics of the existing groundwater wells (i.e., well construction, location, screen interval) at the Site, with regard to the Site conceptual model described in the RI report. The data collected from these locations have been reviewed and are being used to refine the scope of this revised IGMP. This revised document is intended to focus on locations that will continue, or are anticipated to continue, to provide useful data for monitoring the effects of the OU1 remedial action on the Site groundwater.
2.1 MONITORING WELL FUNCTIONAL GROUPS AND SAMPLING PROTOCOL The monitoring well network has been divided into well groups based on function, as described in the following subsections and depicted on Figures 1 through 5. Each functional group has been assigned an appropriate sampling protocol and sampling frequency, as shown in Table 1. Note that the numbers of wells have been revised as compared to Revision 2 of the IGMP (Table 2). These revisions to the numbers of wells take into account the well abandonment activities performed in January and February 2012. Additional sampling or analyses may be performed at the direction of the Radiation Safety Officer (RSO) or Environmental Manager.
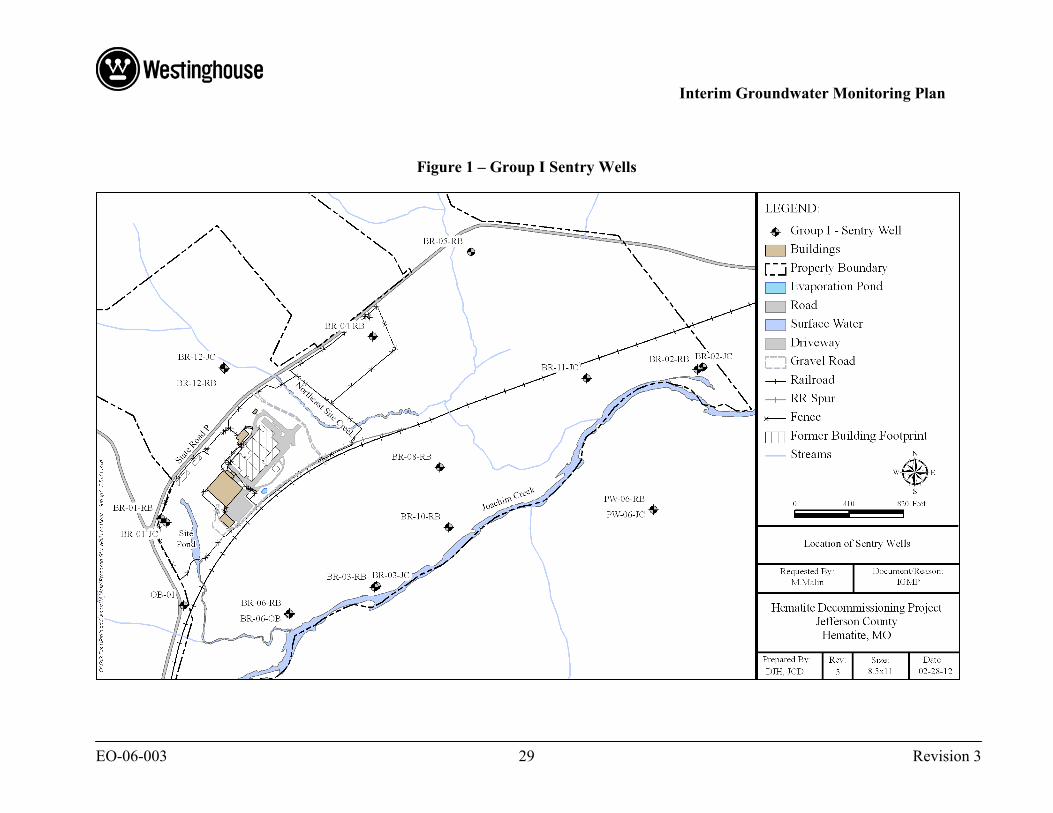
2.1.1 Group I: Sentry Wells The Group I wells are shown on Figure 1 and function as sentry wells. The function of the sentry well monitoring is to assess the potential for offsite migration of COCs at select locations in the overburden and in the bedrock aquifers (Jefferson City and Roubidoux Formations). The RI determined that there were no Site impacts to the Roubidoux aquifer, except where open boreholes previously provided a direct migration pathway from shallower units in the vicinity of the Site. These open boreholes have either been properly abandoned or reconstructed into dual-completion monitoring wells and no longer provide a direct migration pathway. The Group I monitoring protocol is designed to provide data over time to confirm that there are no impacts to the Jefferson City or Roubidoux aquifers.
Of the Group I wells, nine wells (BR-01-RB, BR-02-RB, BR-03-RB, BR-04-RB, BR-05-RB, BR-06-RB, BR-08-RB, BR-10-RB, and BR-12-RB) are designated Sentry Wells in the original IGMP. These monitoring locations serve the objective of the sentry well sampling by providing well locations screened in the Roubidoux Formation and allowing for sampling of locations upgradient, cross-gradient, downgradient, or beneath the identified impacted groundwater areas.
Four of the five sentry wells chosen within the Jefferson City Formation are wells that were included in the original IGMP as either groundwater flow wells or plume wells. These wells have shown no indication of contamination and were added to the sentry wells list in Revision 2 of the IGMP (BR-01-JC, BR-03-JC, BR-11-JC and BR-12-JC). BR-02-JC was not included in the original IGMP but was added as a Sentry Well in Revision 2 of the IGMP.
Interim Groundwater Monitoring Plan
EO-06-003 9 Revision 3
Two sentry wells (BR-06-OB and OB-01) are located in the overburden. These wells were chosen as Sentry Wells to assess the migration of the contaminant plume in the overburden and validate the groundwater migration in the overburden is to the south toward Joachim Creek.
In addition, two bedrock wells south of Joachim creek have been selected as Sentry Wells. These wells (PW-06-JC and PW-06-RB) are located in a former private well that has been reconstructed to monitor groundwater within the Jefferson City-Cotter and the Roubidoux zones, respectively.
As shown on Table 1, water levels at the sentry wells are measured quarterly, and samples are collected quarterly and analyzed for field parameters, VOCs, isotopic uranium, and Tc-99.
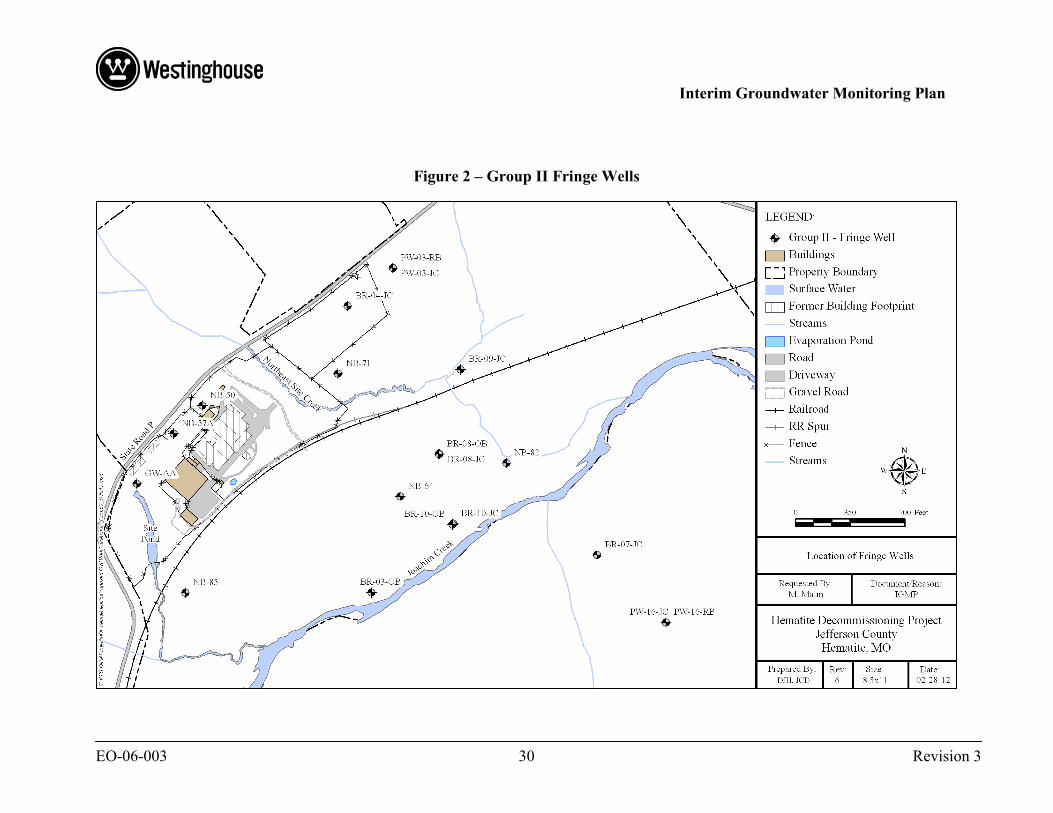
2.1.2 Group II: Fringe Wells The Group II wells are shown on Figure 2. These nine bedrock wells and 10 overburden wells will be utilized to obtain routine water level measurements to assist in evaluating potential movement of the groundwater plume. Seven of the bedrock wells will provide data points for the Jefferson City-Cotter Formation and two for the deeper Roubidoux Formation. The remaining ten monitoring points are within the overburden. The overburden wells are located in areas chosen to evaluate the leading edge of the volatile plume. These points were selected to evaluate the potential for temporal changes in contaminant concentrations at the edge of the plume identified in the overburden in the vicinity of the Site.
The data from these locations will be used to assess the plume for expansion or changes in the mass contaminant loading in the groundwater. The bedrock wells, both in the Jefferson City-Cotter and the Roubidoux, will continue to be monitored to ensure the VOCs are not spreading or expanding beyond the known boundaries.
As shown on Table 1, water levels at the fringe wells are measured quarterly and samples are collected quarterly and analyzed for field parameters, VOCs, isotopic uranium and Tc-99.
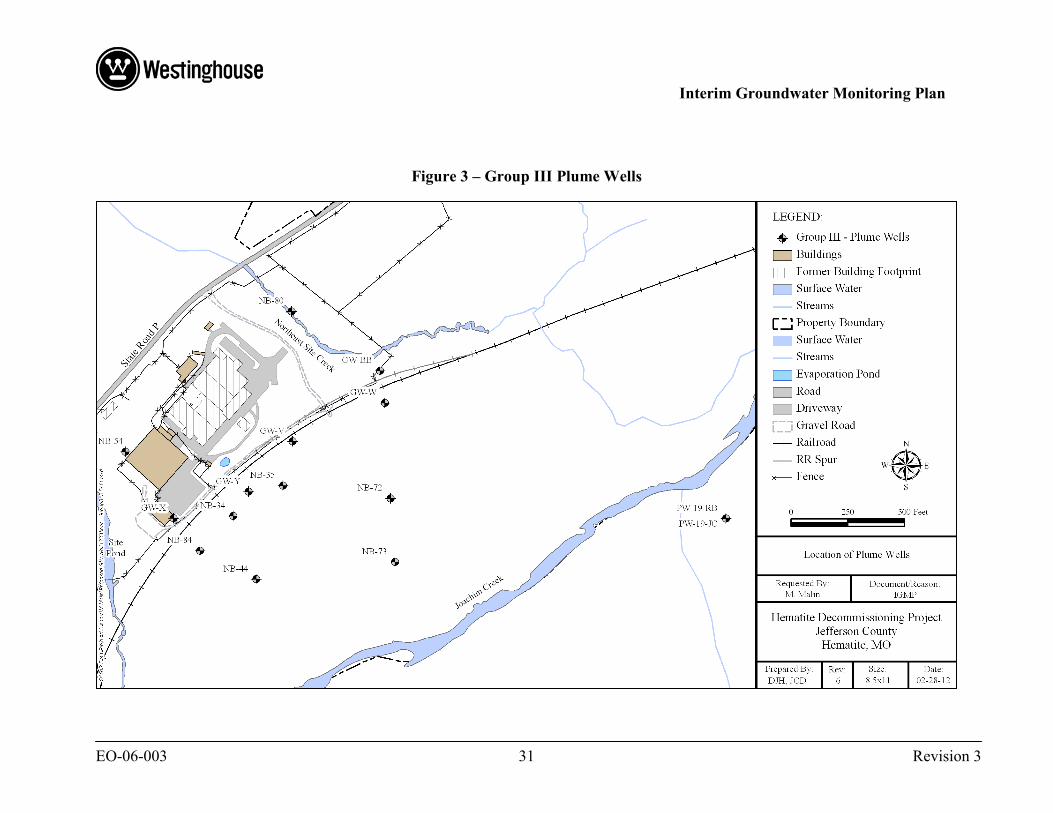
2.1.3 Groups III: Plume Wells The Group III wells have been identified to serve as groundwater monitoring points to assess potential changes in contaminant concentrations within the identified plume in the overburden. The Group III wells are situated to assess COCs associated with the Facility. Of the 15 wells, 13 are screened in the overburden. The construction of these wells varies with depth. Where some of the wells penetrate through the overburden clay and into the sand and gravel that overlies the bedrock, others were constructed so the screen is only within the sand/gravel layer.
A review of the well construction diagrams for several of the wells indicated that the screened interval was within the clay and the sand/gravel layer. For these wells, it was recommended that new wells be placed adjacent to the hybrid well. Within the plume areas, new wells (designated as GW- wells) were installed next to the hybrid wells to determine interconnection between the overburden clay and the sand/gravel layer. The new wells were constructed with the screened interval in the sand and gravel only. Initial results from these well pairs indicate that the

Interim Groundwater Monitoring Plan
EO-06-003 10 Revision 3
groundwater collected from the sand/gravel has not been impacted in the same manner as the water collected from the hybrid wells. Following review of historical data from the paired hybrid wells and the new wells screened in the sand/gravel, four of the plume wells (NB-31, NB-33, NB-81, and PL-06) were abandoned in April 2011.
The two Group III wells located southeast of the Facility, which are shown on Figure 3, assess the VOC bedrock plume component specifically in relation to contamination detected in former private wells located to the southeast of Joachim Creek (PW-19-JC and PW-19-RB). These wells have been reconstructed from an open-hole private well into dual-completion monitoring wells screened across the Jefferson City-Cotter and Roubidoux Formations, respectively. Data obtained from these wells (both contaminant concentrations and water levels) will assist in evaluating changes in water levels due to groundwater withdrawal from the Roubidoux Formation and contaminant migration via downward flow in open hole wells. In addition, these wells have shown the highest concentration of VOCs within the bedrock wells south of Joachim creek and will serve as an indication of contaminant movement within the bedrock zones.
Water levels at the plume wells are measured quarterly at the Group III wells, and samples from these wells will be analyzed for field parameters, VOCs, isotopic uranium, and Tc-99. The frequency of sampling for these wells is quarterly or semi-annually, as shown in Table 1. The Group III wells are shown on Figures 3, and the analytical requirements are summarized in Table 1.
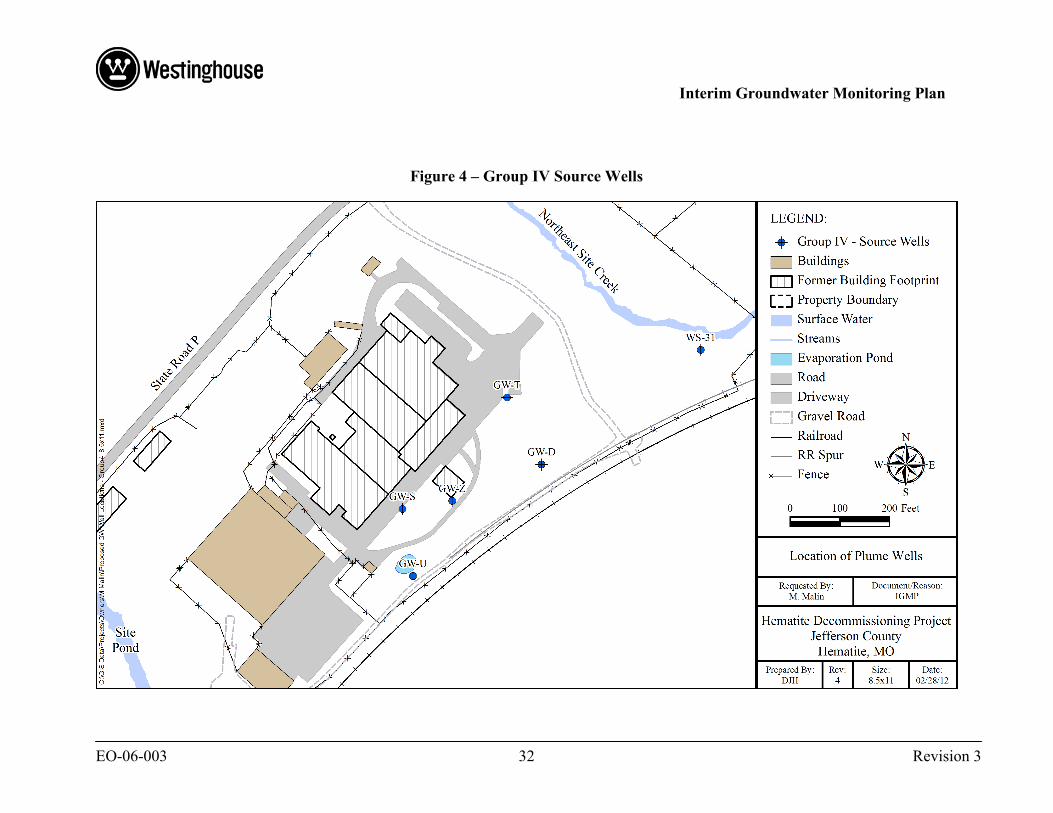
2.1.4 Group IV: Source Wells The 6 wells designated as source monitoring wells (Group IV) are shown on Figure 4. These wells are located in the overburden and bedrock at locations around the Site that correspond to potential source areas. Sampling and analytical requirements are identified to provide data for assessment of potential changes in concentration of identified contaminant sources (i.e., beneath buildings, Evaporation Ponds, Burial Pit Area), over time for both VOCs and radiological components.
A review of the well construction diagrams for several of the original source wells identified in the IGMP (Revision 0) indicated that the screened interval was within the clay and the sand/gravel layer. For these wells, it was recommended that new wells be placed adjacent to the hybrid well. Within the source areas, new wells (designated as GW- wells) were installed next to the hybrid wells to determine interconnection between the overburden clay and the sand/gravel layer. The new wells were constructed with the screened interval in the sand and gravel only. Initial results from these well pairs indicate that the groundwater collected from the sand/gravel has not been impacted in the same manner as the water collected from the hybrid wells. Following review of historical data from the paired hybrid wells and the new wells screened in the sand/gravel, five of the original source wells (BD-14, DM-02, EP-20, WS-13, and WS-17B) were abandoned in April 2011. Sixteen additional source wells were abandoned in January and February 2012 based on their locations within or in close proximity to the proposed excavation activities for the remediation of Operable Unit 1 (OU1).
Interim Groundwater Monitoring Plan
EO-06-003 11 Revision 3
Groundwater conditions related to potential migration in the bedrock below the Burial Pits area is monitored by source well WS-31. This well provides an assessment point for monitoring bedrock conditions to the southeast of the Burial Pits.
Five wells are positioned to assess potential changes in groundwater conditions related to the Evaporation Pond and downgradient of the former process buildings footprint. These source wells include GW-D, GW-S, GW-T, GW-U, and GW-Z which are installed in the overburden material. These wells provide data to evaluate changes in VOC and Tc-99 concentrations in this area.
All Group IV wells will have water level measurements obtained quarterly. The frequency of water sampling for these wells is quarterly, as shown in Table 1 and includes analysis for field parameters, VOCs, isotopic uranium, and Tc-99.
The designated Source Wells, and other wells located within planned excavation areas, will be removed as part of OU1. Plans for replacement of these wells will be addressed in the IGMP or other groundwater program that will address post-OU1 Site conditions.
2.1.5 Current NRC License Sampling Wells Currently, there are eleven wells monitored quarterly for isotopic uranium and Tc-99 in support of the NRC License SNM-33. These wells are listed in Table 1. Seven of these wells are 2-inch diameter and screened in the overburden materials, two of these wells are 1-inch diameter and screened in the overburden materials. One well is a 2-inch diameter well screened in the Jefferson City formation and the remaining well is a drinking water well located off-Site. Two of the current license wells (BR-04-JC and NB-71) are incorporated into the Group II: Fringe Wells functional group described in Section 2.1.2. Four of the current license wells (GW-BB, GW-W, GW-Y, and NB-34) are incorporated into the Group III: Plume Wells functional group described in Section 2.1.3. Four of the current license wells (GW-S, GW-T, GW-U and GW-Z) are incorporated into the Group IV: Source Wells functional group described in Section 2.1.4. Water levels will be measured in the remaining on-site wells, on a quarterly basis, as part of the IGMP.
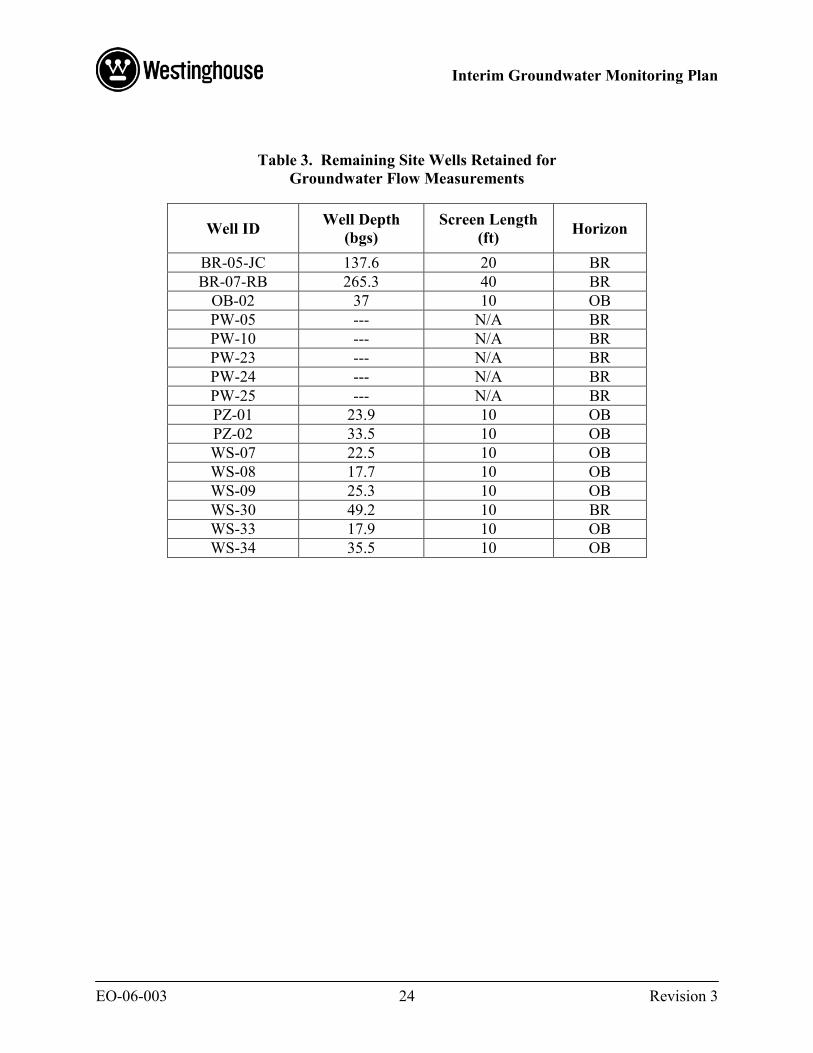
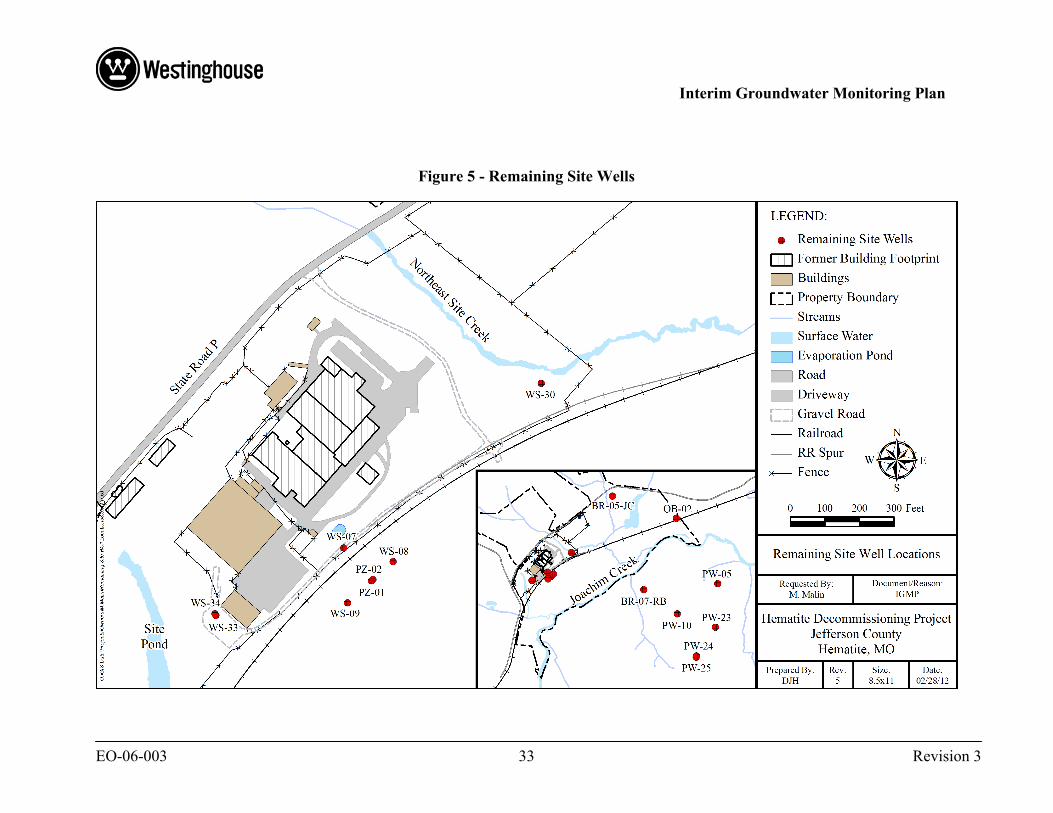
2.1.6 Remaining Site Wells There are eight overburden wells and three bedrock wells (all 2-inch diameter) located on the Site that were installed in support of previous investigations (1998 and earlier, with the exception of OB-02 installed in 2002). These wells are listed in Table 3. In addition, five former private wells (PW-05, PW-10, PW-23, PW-24, and PW-25) are included in Table 3. Based on a review of physical location and analytical data results, monitoring of these wells is not necessary to achieve the goals of the IGMP. One of the 16 wells (WS-30) is located on the downgradient edge of the Burial Pit Area. Three wells (WS-33, WS-34, and OB-02) are located west of Building 231 and on the far eastern boundary of the Hematite property. The other wells are located south and east of the site. These wells will be utilized for quarterly groundwater level measurements. The annual report will evaluate the necessity of retaining these locations.
Interim Groundwater Monitoring Plan
EO-06-003 12 Revision 3
2.2 SAMPLING ACTIVITIES Prior to sampling, each well will be visually examined for damage or other circumstances that could affect the integrity of the well or sample (i.e., evidence of tampering, vandalism, or weather-related damage). Any conditions that could affect the integrity of the well or well sample will be noted in the field log.
Surface completions for monitoring wells shall be maintained in accordance with 10 CSR 23-4, Monitoring Well Construction Code (Ref. 6.10).
2.2.1 Field Measurements Measurements collected in the field, such as water temperature, dissolved oxygen, oxidation-reduction potential, specific conductance, pH, and turbidity will be performed using standard field instruments. Procedure HDP-PR-EM-012, Water Quality Field Measurements (Ref. 6.8), includes specific steps for instrument calibration. Field measurements will be recorded on the form provided in HDP-PR-EM-012 or on the form provided in HDP-PR-EM-011, Low Flow Well Sampling (Ref. 6.7), when performed in conjunction with a low flow sampling event.
Water level measurements will be obtained prior to groundwater sampling activities at each well. Measurements will be taken from the top of the well casing to the nearest 0.01 foot (ft) of static water level. Well volume will also be calculated and recorded as specified in HDP-PR-EM-011.
2.2.2 Groundwater Sampling The monitoring wells included in the IGMP consist of a variety of different screen lengths, depths, and diameters. This variation necessitates a range of sampling techniques. As such, monitoring wells 2 inch and greater in diameter will generally be sampled using submersible or bladder pumps placed at the approximate center of the screened interval. Smaller diameter wells (i.e., one-inch diameter monitoring wells) will typically be sampled with a peristaltic pump where the end of the tubing is placed at the approximate center of the screened interval, however, deeper overburden wells may require use of bladder pumps or bailers to collect the sample. Westinghouse will evaluate potential use of dedicated sampling equipment where warranted. If sampling equipment is not dedicated, it will be decontaminated in accordance with the referenced procedures.
Sampling will be performed using low-flow procedures where applicable. If well stabilization has not occurred before the well is pumped dry, purging of one well volume will be sufficient for sampling. Conversely, if three well volumes have been purged and indicator parameters have not stabilized, sampling may proceed. All purge water will be collected in designated containers and managed under HDP-PO-WM-900, Waste Management and Transportation Plan (Ref. 6.6).
In accordance with USEPA recommendations for the order of sample collection, VOC samples will be collected first, followed by radiological samples. Samples will not be filtered. Sample analytical methods, sample containers, and preservation requirements are presented in Table 4. The analytical parameters, methods, and detection limits are specified in Table 6.
Interim Groundwater Monitoring Plan
EO-06-003 13 Revision 3
After collection, all samples requiring storage at 4° Celsius will be placed in a cooler with ice. Chain-of-custody forms shall be completed and the samples and appropriate chain-of-custody forms shall be submitted for shipment to an off-site laboratory, pursuant to HDP-PR-QA-006, Chain of Custody (Ref. 6.9).
2.2.3 Additional Data On a quarterly basis, pumping records for the Festus municipal water production wells and water level records for the U.S. Geological Survey well located approximately 3 miles northeast of the Site will be obtained. These data will be used in conjunction with the development of groundwater flow maps for evaluation of potential impacts on regional flow in the local bedrock units.
2.3 SAMPLE DESIGNATION Each sample will be given a unique designation to identify it as a groundwater or surface water sample and to differentiate between well locations.
Groundwater and surface water samples will be labeled according to the following scheme: GW-OB01-MMDDYY, where the first field (GW) identifies the sample by media, the second field (OB01) corresponds to the well location number or surface water sampling location number, and the third field (MMDDYY) represents the date the sample was collected. Sample label designations for applicable samples are as follows:
Groundwater GW-##-###### Surface Water SW-##-######
2.4 QUALITY CONTROL Quality Control (QC) samples will be collected concurrently with the groundwater samples and submitted to the off-site analytical laboratory to provide a means to assess the quality of the data resulting from the field sampling program. Table 4 lists the sample collection requirements (e.g., container, minimum volume) for the QC samples. Table 5 summarizes the quality control samples that will be collected to support the IGMP.
The QC samples will be further identified by a two or three character suffix added to the sample identification number. The quality control samples will be identified based on their purpose:
• FD – field duplicate; • MS/MSD– matrix spike/matrix spike duplicate; • RB – rinsate blank (for non-dedicated equipment); and • TB – trip blank.
Interim Groundwater Monitoring Plan
EO-06-003 14 Revision 3
2.5 MANAGEMENT OF WASTE Solid and liquid wastes are expected to be generated during the implementation of this IGMP. Solid wastes may consist of tubing associated with groundwater sampling activities and personal protective equipment. Liquid wastes may consist of decontamination water used to rinse sampling equipment and purge water generated during groundwater sampling activities.
Waste generated during the performance of field activities associated with this IGMP will be managed in accordance with HDP-PO-WM-900.
Interim Groundwater Monitoring Plan
EO-06-003 15 Revision 3
3.0 SURFACE WATER LEVEL MEASUREMENTS As presented in the RI Report (SAIC, 2005), historical base flow recession data indicates that Joachim Creek is a gaining stream, and therefore receives shallow (i.e., overburden) groundwater discharge from the overburden in the vicinity of the Site. During the RI field effort, surveyed surface water measurements were taken at several points along Joachim Creek in conjunction with water level measurements in nearby overburden monitoring wells (BR-06-OB and BR-10-OB). The data was used to assist in further evaluation of the interaction between overburden groundwater and Joachim Creek. The results from this evaluation confirmed discharge of overburden groundwater into Joachim Creek.
In support of the IGMP objective to further define such interactions, staff gages were placed in Joachim Creek proximal to the following groundwater monitoring well locations: BR-03-OB, BR-06-OB, and BR-10-OB. Surface water level measurements will be obtained quarterly in conjunction with the quarterly groundwater elevation measurement activity. Measurements will be taken by visual readings on the staff gage markings to 0.2 ft or by direct measurements of the water level by survey instruments. It should be noted that obtaining surface water measurements may be precluded by seasonal weather conditions (i.e., ice) or physical obstructions (i.e., debris in the creek) that are carried by the variable flow within the Joachim Creek. In addition to surface water elevations collected from Joachim Creek, the inlet elevation of the spring that feeds the Site pond will be measured on a quarterly basis.
Surface water samples will be collected at three locations along the Joachim Creek to evaluate potential impacts of the Site. One location is upgradient of the Site creek outfall, one is at the confluence of the Site creek with the Joachim Creek, and the third is downgradient of the Site. These samples will be analyzed for VOCs, isotopic uranium, and Tc-99. The results of these samples will be used to assess the effect of the Site on the Joachim Creek. Additional sampling may be conducted at the discretion of the Westinghouse Environmental Manager or the Radiation Safety Officer.
Interim Groundwater Monitoring Plan
EO-06-003 16 Revision 3
4.0 DATA ASSESSMENT AND REPORTING
4.1 DATA QUALITY Field and laboratory data will be reviewed for completeness and quality. Data generated by off-site laboratories will undergo a data usability evaluation. This evaluation will be based on the results of data review, as specified in the RI/FS Quality Assurance Project Plan (PO-QA-003) (Ref. 6.5). The contract laboratory will assess all QC data with regard to precision and accuracy. Individual data points will be flagged with data qualifiers where appropriate based on the results of the QC review. These qualifiers will assist in determination of subsequent data usability.
Data packages will be reviewed by Westinghouse for completeness and verification that data quality requirements (e.g., laboratory method detection and reporting limits, precision and accuracy requirements) are consistent with those specified in PO-QA-003. The data from duplicate samples will be evaluated to determine if there is a problem with reproducibility of results. Data from matrix spike/matrix spike duplicates will be evaluated to determine if the matrix introduces a bias in sample results. Results from rinsate blanks (if taken) and trip blanks will be evaluated to determine if contamination from outside the Site was introduced in the samples.
4.2 DATA REPORTING Data from the quarterly sampling events will be compiled and submitted electronically to the MDNR within 20 days of receipt. The data will be entered into the Site database. The transmittal will include a preliminary review of the data, including completeness and a comparison to existing groundwater quality standards.
Data gathered as a result of implementation of this IGMP will be used to prepare an annual groundwater evaluation report. The annual report will document sampling activities conducted over the past year and present analytical data results by functional group. Specific topics to be evaluated include the following:
• Data Quality;
• Potential trends in data that may indicate changes in plume geometry;
• Comparison of data to existing water quality standards;
• Water level data and presentation of groundwater flow maps for each sample period;
• Potential seasonal variations in water levels;
• Potential fluctuations in water levels due to groundwater withdrawal from the Roubidoux aquifer;
• Surface water/groundwater interactions along the Joachim Creek;
Interim Groundwater Monitoring Plan
EO-06-003 17 Revision 3
• Recommendations for additional data and/or sampling; and
• Recommendations for modifications to the IGMP.
Quarterly report data will be submitted to MDNR in an electronic format that will be used to document sampling activities completed during that sampling period. The annual report will be submitted, in duplicate to MDNR within 90 days of completion of the fourth quarterly monitoring event. Subsequent annual reports will be submitted within 90 days of completion of the fourth successive quarterly sampling event.
Interim Groundwater Monitoring Plan
EO-06-003 18 Revision 3
5.0 HEALTH AND SAFETY All field operations will be performed in conjunction with the Health and Safety Plan, HDP-PO-EHS-001 (Ref. 6.2) and the Radiation Protection Plan (HDP-PO-HP-100) (Ref. 6.3).
Hazards of particular concern at the Hematite Site during groundwater sampling activities include the following:
• Heat/cold stress, • Hazards associated with sampling equipment, and • Biological hazards.
An Activity Hazard Analyses (AHA) will be prepared for groundwater sampling activities. Generally, an AHA is prepared for all field operations other than routine surveillance and inspection of field activities. If Radiation Work Permits are deemed necessary, the permit will also be prepared and requirements implemented prior to conducting groundwater sampling.
Interim Groundwater Monitoring Plan
EO-06-003 19 Revision 3
6.0 REFERENCES
6.1 EO-05-002, Remedial Investigation Report for the Westinghouse Hematite Site, Revision 1, January 2007, Science Applications International Corporation
6.2 HDP-PO-EHS-001, Health and Safety Plan, Westinghouse Electric Company LLC
6.3 HDP-PO-HP-100, Radiation Protection Plan, Westinghouse Electric Company LLC
6.4 HDP-PO-QA-001, Project Quality Plan, Westinghouse Electric Company LLC
6.5 PO-QA-003, RI/FS Quality Assurance Project Plan, Westinghouse Electric Company LLC
6.6 HDP-PO-WM-900, Waste Management and Transportation Plan, Westinghouse Electric Company LLC
6.7 HDP-PR-EM-011, Low Flow Well Sampling, Westinghouse Electric Company LLC
6.8 HDP-PR-EM-012, Water Quality Field Measurements, Westinghouse Electric Company LLC
6.9 HDP-PR-QA-006, Chain of Custody, Westinghouse Electric Company LLC
6.10 10 CSR 23-4, Monitoring Well Construction Code, Missouri Well Construction Rules, Missouri Department of Natural Resources
Interim Groundwater Monitoring Plan
EO-06-003 20 Revision 3
TABLES
Interim Groundwater Monitoring Plan
EO-06-003 21 Revision 3
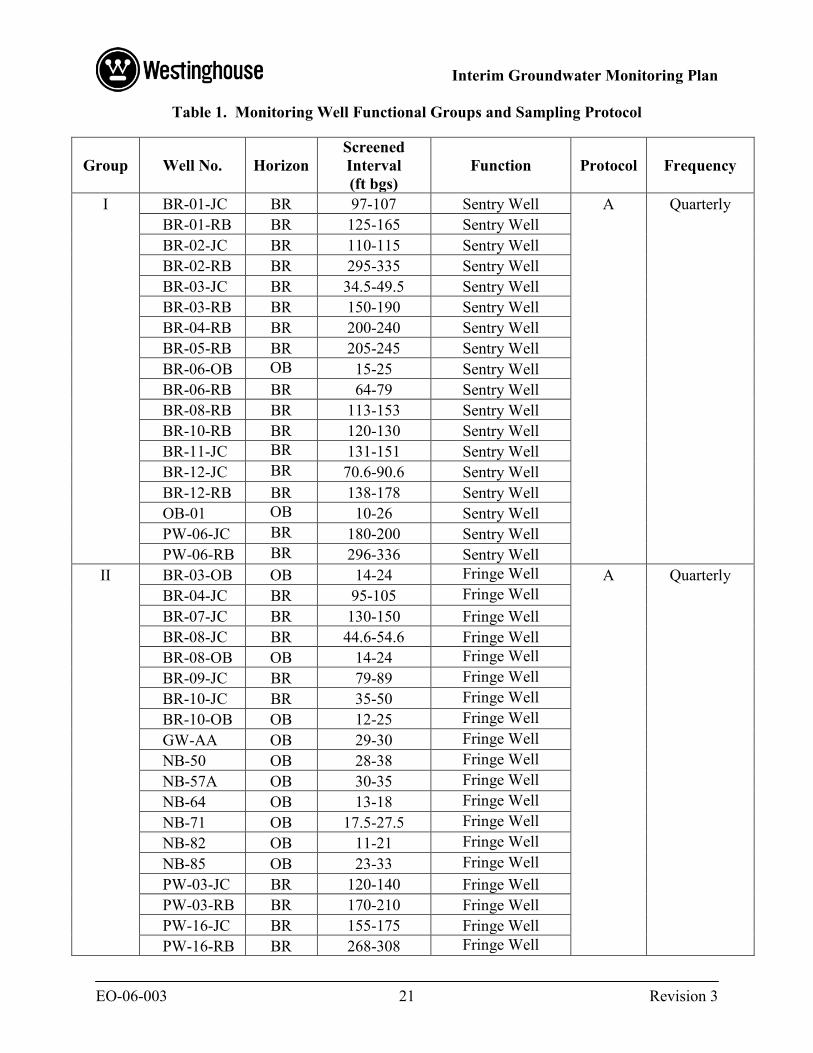
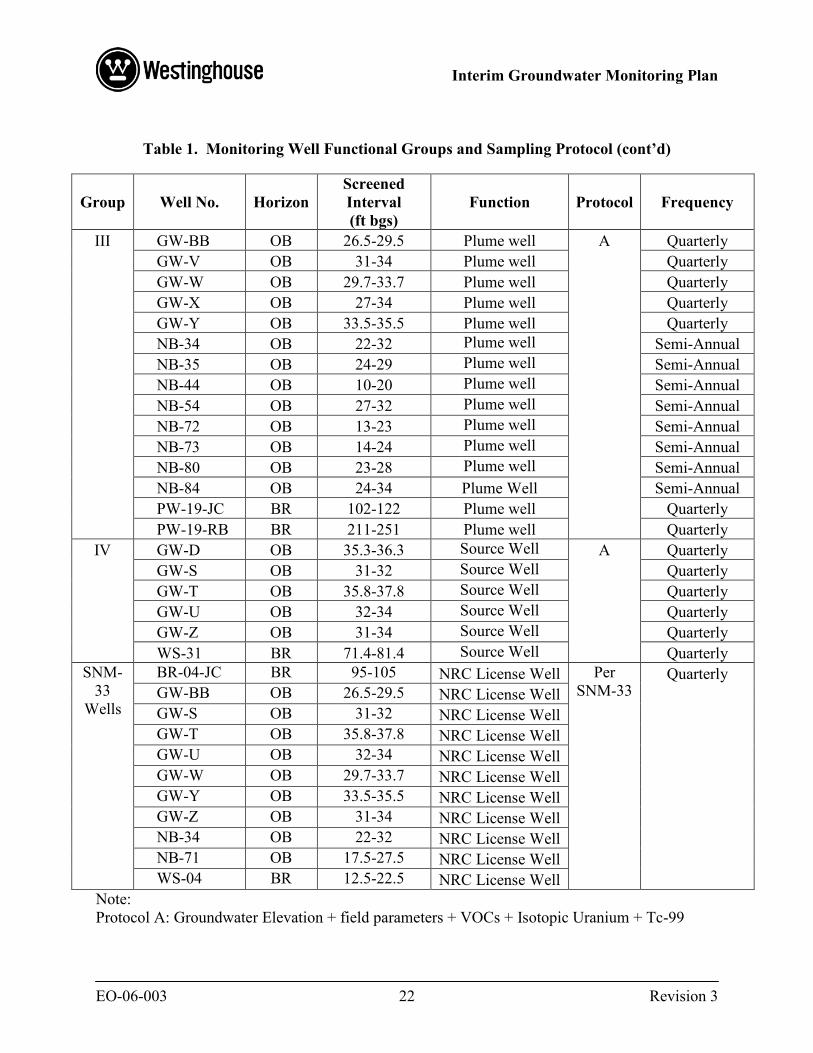
Table 1. Monitoring Well Functional Groups and Sampling Protocol
Group Well No. Horizon Screened Interval (ft bgs)
Function Protocol Frequency
I BR-01-JC BR 97-107 Sentry Well A Quarterly BR-01-RB BR 125-165 Sentry Well BR-02-JC BR 110-115 Sentry Well BR-02-RB BR 295-335 Sentry Well BR-03-JC BR 34.5-49.5 Sentry Well BR-03-RB BR 150-190 Sentry Well BR-04-RB BR 200-240 Sentry Well BR-05-RB BR 205-245 Sentry Well BR-06-OB OB 15-25 Sentry Well BR-06-RB BR 64-79 Sentry Well BR-08-RB BR 113-153 Sentry Well BR-10-RB BR 120-130 Sentry Well BR-11-JC BR 131-151 Sentry Well BR-12-JC BR 70.6-90.6 Sentry Well BR-12-RB BR 138-178 Sentry Well OB-01 OB 10-26 Sentry Well PW-06-JC BR 180-200 Sentry Well PW-06-RB BR 296-336 Sentry Well
II BR-03-OB OB 14-24 Fringe Well A Quarterly BR-04-JC BR 95-105 Fringe Well BR-07-JC BR 130-150 Fringe Well BR-08-JC BR 44.6-54.6 Fringe Well BR-08-OB OB 14-24 Fringe Well BR-09-JC BR 79-89 Fringe Well BR-10-JC BR 35-50 Fringe Well BR-10-OB OB 12-25 Fringe Well GW-AA OB 29-30 Fringe Well NB-50 OB 28-38 Fringe Well NB-57A OB 30-35 Fringe Well NB-64 OB 13-18 Fringe Well NB-71 OB 17.5-27.5 Fringe Well NB-82 OB 11-21 Fringe Well NB-85 OB 23-33 Fringe Well PW-03-JC BR 120-140 Fringe Well PW-03-RB BR 170-210 Fringe Well PW-16-JC BR 155-175 Fringe Well PW-16-RB BR 268-308 Fringe Well
Interim Groundwater Monitoring Plan
EO-06-003 22 Revision 3
Table 1. Monitoring Well Functional Groups and Sampling Protocol (cont’d)
Group Well No. Horizon Screened Interval (ft bgs)
Function Protocol Frequency
III GW-BB OB 26.5-29.5 Plume well A Quarterly GW-V OB 31-34 Plume well Quarterly GW-W OB 29.7-33.7 Plume well Quarterly GW-X OB 27-34 Plume well Quarterly GW-Y OB 33.5-35.5 Plume well Quarterly NB-34 OB 22-32 Plume well Semi-Annual NB-35 OB 24-29 Plume well Semi-Annual NB-44 OB 10-20 Plume well Semi-Annual NB-54 OB 27-32 Plume well Semi-Annual NB-72 OB 13-23 Plume well Semi-Annual NB-73 OB 14-24 Plume well Semi-Annual NB-80 OB 23-28 Plume well Semi-Annual NB-84 OB 24-34 Plume Well Semi-Annual PW-19-JC BR 102-122 Plume well Quarterly PW-19-RB BR 211-251 Plume well Quarterly
IV GW-D OB 35.3-36.3 Source Well A Quarterly GW-S OB 31-32 Source Well Quarterly GW-T OB 35.8-37.8 Source Well Quarterly GW-U OB 32-34 Source Well Quarterly GW-Z OB 31-34 Source Well Quarterly WS-31 BR 71.4-81.4 Source Well Quarterly
SNM-33
Wells
BR-04-JC BR 95-105 NRC License Well Per SNM-33
Quarterly GW-BB OB 26.5-29.5 NRC License Well GW-S OB 31-32 NRC License Well GW-T OB 35.8-37.8 NRC License Well GW-U OB 32-34 NRC License Well GW-W OB 29.7-33.7 NRC License Well GW-Y OB 33.5-35.5 NRC License Well GW-Z OB 31-34 NRC License Well NB-34 OB 22-32 NRC License Well NB-71 OB 17.5-27.5 NRC License Well WS-04 BR 12.5-22.5 NRC License Well
Note: Protocol A: Groundwater Elevation + field parameters + VOCs + Isotopic Uranium + Tc-99
Interim Groundwater Monitoring Plan
EO-06-003 23 Revision 3
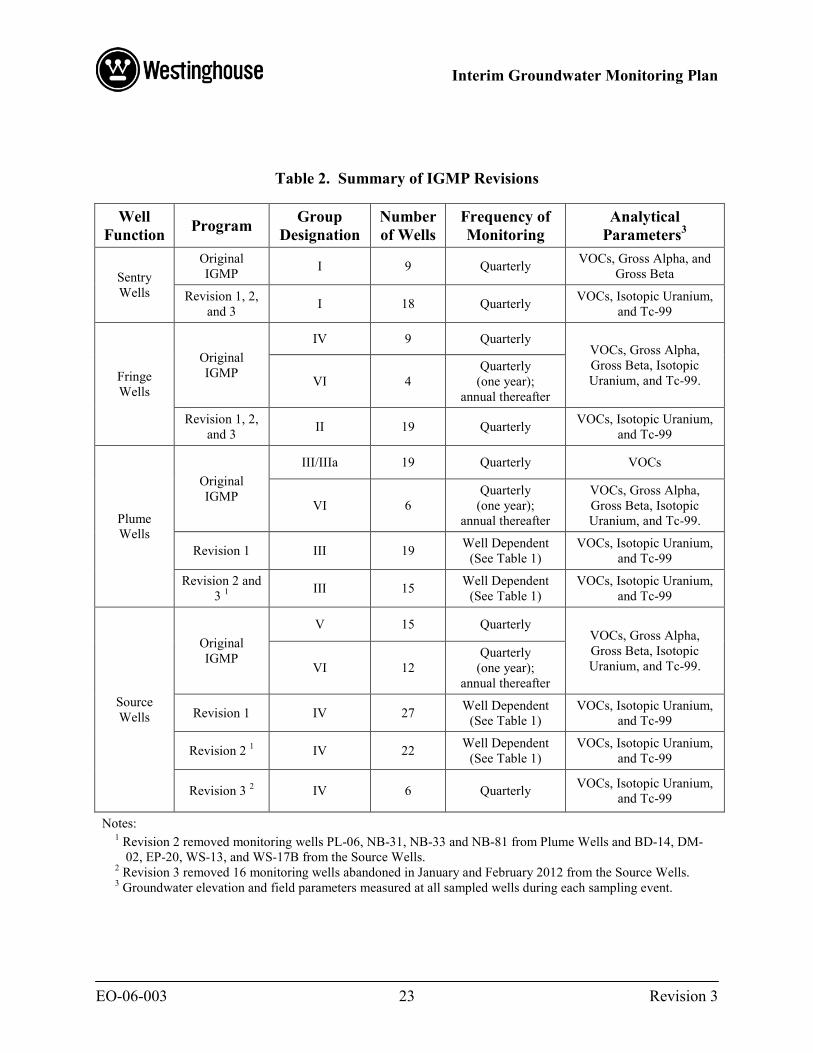
Table 2. Summary of IGMP Revisions
Well Function Program Group
Designation Number of Wells
Frequency of Monitoring
Analytical Parameters3
Sentry Wells
Original IGMP I 9 Quarterly VOCs, Gross Alpha, and
Gross Beta
Revision 1, 2, and 3 I 18 Quarterly VOCs, Isotopic Uranium,
and Tc-99
Fringe Wells
Original IGMP
IV 9 Quarterly VOCs, Gross Alpha, Gross Beta, Isotopic Uranium, and Tc-99. VI 4
Quarterly (one year);
annual thereafter
Revision 1, 2, and 3 II 19 Quarterly VOCs, Isotopic Uranium,
and Tc-99
Plume Wells
Original IGMP
III/IIIa 19 Quarterly VOCs
VI 6 Quarterly
(one year); annual thereafter
VOCs, Gross Alpha, Gross Beta, Isotopic Uranium, and Tc-99.
Revision 1 III 19 Well Dependent (See Table 1)
VOCs, Isotopic Uranium, and Tc-99
Revision 2 and 3 1 III 15 Well Dependent
(See Table 1) VOCs, Isotopic Uranium,
and Tc-99
Source Wells
Original IGMP
V 15 Quarterly VOCs, Gross Alpha, Gross Beta, Isotopic Uranium, and Tc-99. VI 12
Quarterly (one year);
annual thereafter
Revision 1 IV 27 Well Dependent (See Table 1)
VOCs, Isotopic Uranium, and Tc-99
Revision 2 1 IV 22 Well Dependent (See Table 1)
VOCs, Isotopic Uranium, and Tc-99
Revision 3 2 IV 6 Quarterly VOCs, Isotopic Uranium, and Tc-99
Notes: 1 Revision 2 removed monitoring wells PL-06, NB-31, NB-33 and NB-81 from Plume Wells and BD-14, DM-
02, EP-20, WS-13, and WS-17B from the Source Wells. 2 Revision 3 removed 16 monitoring wells abandoned in January and February 2012 from the Source Wells. 3 Groundwater elevation and field parameters measured at all sampled wells during each sampling event.
Interim Groundwater Monitoring Plan
EO-06-003 24 Revision 3
Table 3. Remaining Site Wells Retained for Groundwater Flow Measurements
Well ID Well Depth (bgs)
Screen Length (ft) Horizon
BR-05-JC 137.6 20 BR BR-07-RB 265.3 40 BR
OB-02 37 10 OB PW-05 --- N/A BR PW-10 --- N/A BR PW-23 --- N/A BR PW-24 --- N/A BR PW-25 --- N/A BR PZ-01 23.9 10 OB PZ-02 33.5 10 OB WS-07 22.5 10 OB WS-08 17.7 10 OB WS-09 25.3 10 OB WS-30 49.2 10 BR WS-33 17.9 10 OB WS-34 35.5 10 OB
Interim Groundwater Monitoring Plan
EO-06-003 25 Revision 3
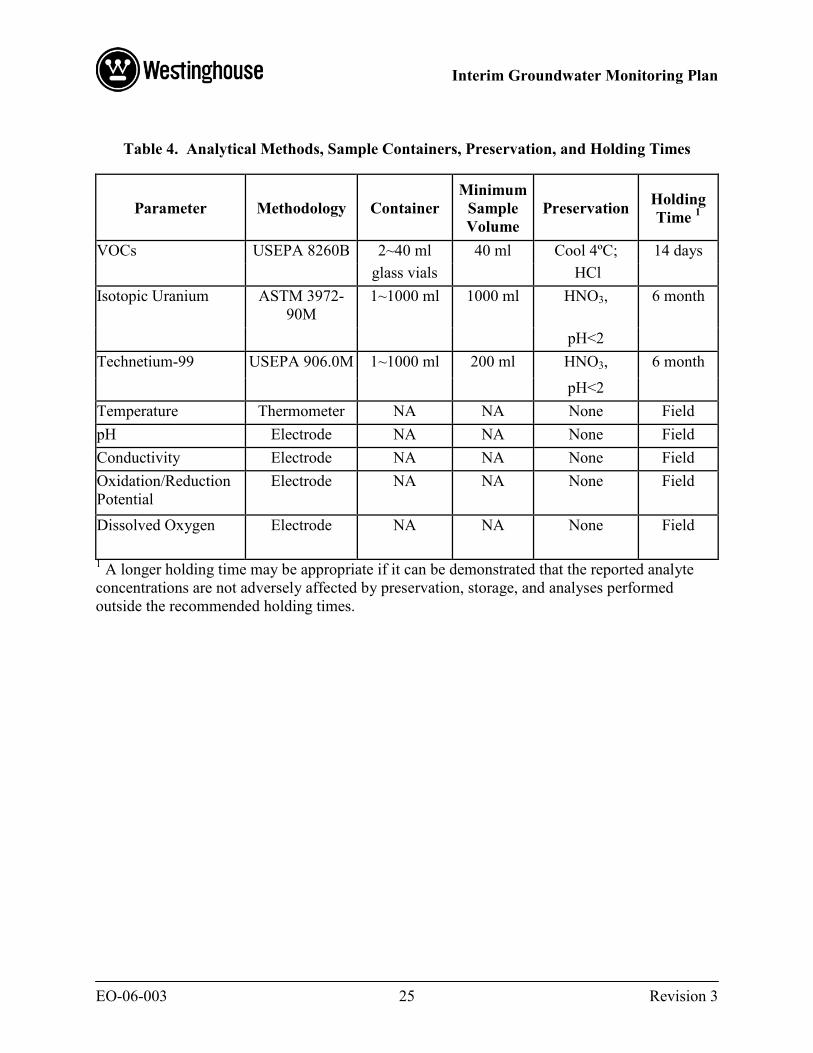
Table 4. Analytical Methods, Sample Containers, Preservation, and Holding Times
Parameter Methodology Container Minimum
Sample Volume
Preservation Holding Time 1
VOCs USEPA 8260B 2~40 ml 40 ml Cool 4ºC; 14 days glass vials HCl
Isotopic Uranium ASTM 3972-90M
1~1000 ml 1000 ml HNO3, 6 month
pH<2 Technetium-99 USEPA 906.0M 1~1000 ml 200 ml HNO3, 6 month
pH<2 Temperature Thermometer NA NA None Field pH Electrode NA NA None Field Conductivity Electrode NA NA None Field Oxidation/Reduction Potential
Electrode NA NA None Field
Dissolved Oxygen Electrode NA NA None Field
1 A longer holding time may be appropriate if it can be demonstrated that the reported analyte concentrations are not adversely affected by preservation, storage, and analyses performed outside the recommended holding times.
Interim Groundwater Monitoring Plan
EO-06-003 26 Revision 3
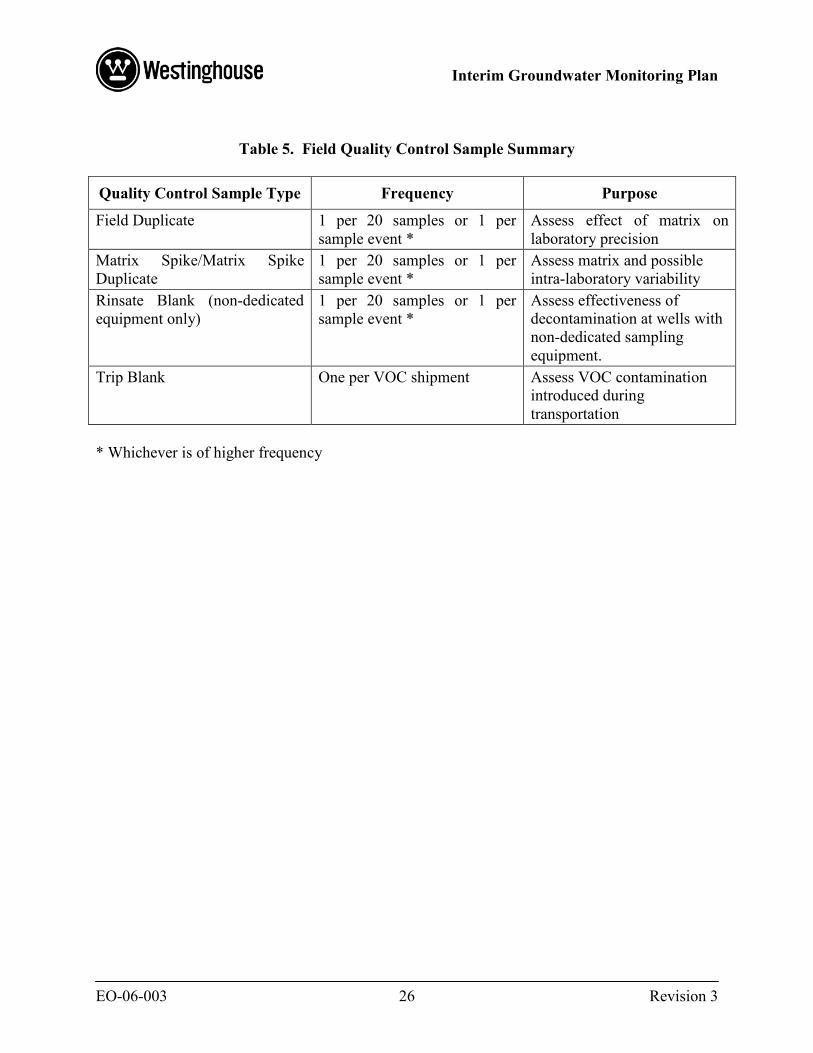
Table 5. Field Quality Control Sample Summary
Quality Control Sample Type Frequency Purpose
Field Duplicate 1 per 20 samples or 1 per sample event *
Assess effect of matrix on laboratory precision
Matrix Spike/Matrix Spike Duplicate
1 per 20 samples or 1 per sample event *
Assess matrix and possible intra-laboratory variability
Rinsate Blank (non-dedicated equipment only)
1 per 20 samples or 1 per sample event *
Assess effectiveness of decontamination at wells with non-dedicated sampling equipment.
Trip Blank One per VOC shipment Assess VOC contamination introduced during transportation
* Whichever is of higher frequency
Interim Groundwater Monitoring Plan
EO-06-003 27 Revision 3
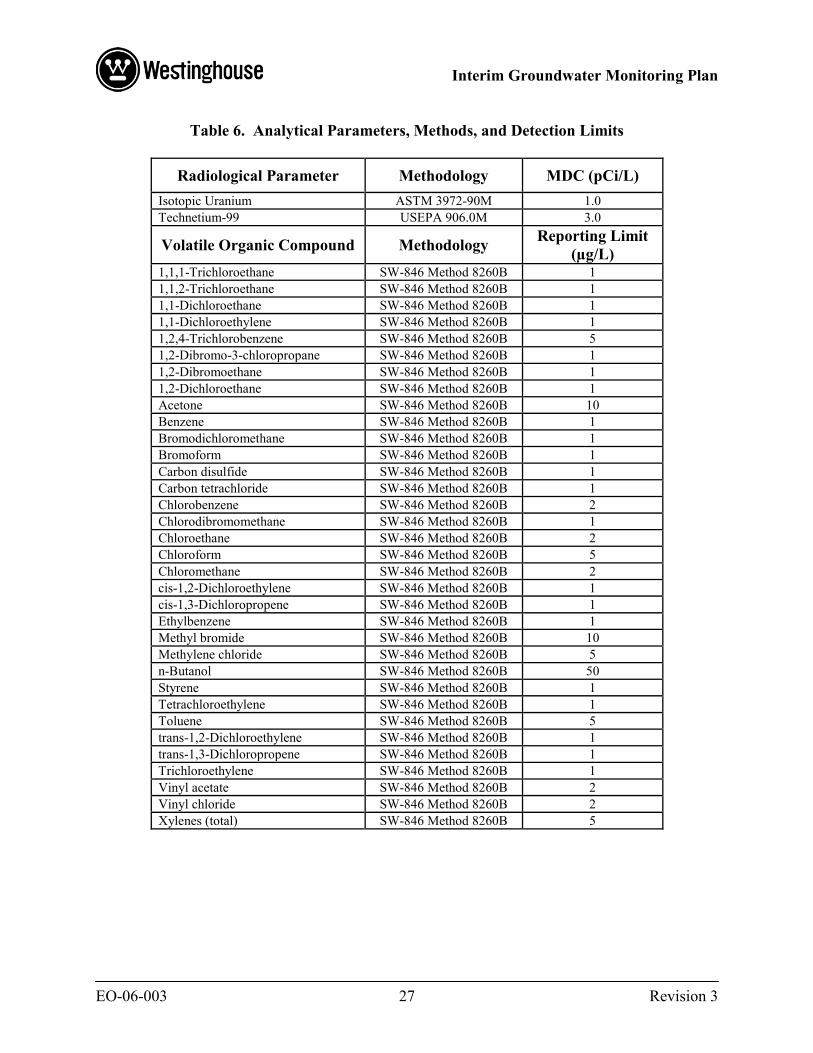
Table 6. Analytical Parameters, Methods, and Detection Limits
Radiological Parameter Methodology MDC (pCi/L) Isotopic Uranium ASTM 3972-90M 1.0 Technetium-99 USEPA 906.0M 3.0
Volatile Organic Compound Methodology Reporting Limit (µg/L)
1,1,1-Trichloroethane SW-846 Method 8260B 1 1,1,2-Trichloroethane SW-846 Method 8260B 1 1,1-Dichloroethane SW-846 Method 8260B 1 1,1-Dichloroethylene SW-846 Method 8260B 1 1,2,4-Trichlorobenzene SW-846 Method 8260B 5 1,2-Dibromo-3-chloropropane SW-846 Method 8260B 1 1,2-Dibromoethane SW-846 Method 8260B 1 1,2-Dichloroethane SW-846 Method 8260B 1 Acetone SW-846 Method 8260B 10 Benzene SW-846 Method 8260B 1 Bromodichloromethane SW-846 Method 8260B 1 Bromoform SW-846 Method 8260B 1 Carbon disulfide SW-846 Method 8260B 1 Carbon tetrachloride SW-846 Method 8260B 1 Chlorobenzene SW-846 Method 8260B 2 Chlorodibromomethane SW-846 Method 8260B 1 Chloroethane SW-846 Method 8260B 2 Chloroform SW-846 Method 8260B 5 Chloromethane SW-846 Method 8260B 2 cis-1,2-Dichloroethylene SW-846 Method 8260B 1 cis-1,3-Dichloropropene SW-846 Method 8260B 1 Ethylbenzene SW-846 Method 8260B 1 Methyl bromide SW-846 Method 8260B 10 Methylene chloride SW-846 Method 8260B 5 n-Butanol SW-846 Method 8260B 50 Styrene SW-846 Method 8260B 1 Tetrachloroethylene SW-846 Method 8260B 1 Toluene SW-846 Method 8260B 5 trans-1,2-Dichloroethylene SW-846 Method 8260B 1 trans-1,3-Dichloropropene SW-846 Method 8260B 1 Trichloroethylene SW-846 Method 8260B 1 Vinyl acetate SW-846 Method 8260B 2 Vinyl chloride SW-846 Method 8260B 2 Xylenes (total) SW-846 Method 8260B 5
Interim Groundwater Monitoring Plan
EO-06-003 28 Revision 3
FIGURES
Interim Groundwater Monitoring Plan
EO-06-003 29 Revision 3
Figure 1 – Group I Sentry Wells
Interim Groundwater Monitoring Plan
EO-06-003 30 Revision 3
Figure 2 – Group II Fringe Wells
Interim Groundwater Monitoring Plan
EO-06-003 31 Revision 3
Figure 3 – Group III Plume Wells
Interim Groundwater Monitoring Plan
EO-06-003 32 Revision 3
Figure 4 – Group IV Source Wells
Interim Groundwater Monitoring Plan
EO-06-003 33 Revision 3
Figure 5 - Remaining Site Wells