Electoral Cycles, Partisan Effects and U.S. Naturalization ... · contested states and for...
39
ifo WORKING PAPERS 239 2017 August 2017 Electoral Cycles, Partisan Effects and U.S. Naturalization Policies Marcus Drometer and Romuald Méango
Transcript of Electoral Cycles, Partisan Effects and U.S. Naturalization ... · contested states and for...

ifo WORKING PAPERS
2392017
August 2017
Electoral Cycles, Partisan Effects and U.S. Naturalization Policies Marcus Drometer and Romuald Méango

Impressum:
ifo Working Papers Publisher and distributor: ifo Institute – Leibniz Institute for Economic Research at the University of Munich Poschingerstr. 5, 81679 Munich, Germany Telephone +49(0)89 9224 0, Telefax +49(0)89 985369, email [email protected] www.cesifo-group.de
An electronic version of the paper may be downloaded from the ifo website: www.cesifo-group.de

ifo Working Paper No. 239
Electoral Cycles, Partisan Effects and U.S. Naturalization Policies*
Abstract
Using a panel of naturalizations in U.S. states from 1965 to 2012, we empirically analyze the impact of elections on naturalization policy. Our results indicate that naturalization policy is (partly) driven by national elections: there are more natur-alizations in presidential election years and during the terms of Democratic incum-bents. We then investigate the dynamics of an incumbent’s behavior over the course of the his term in detail, finding that the effects are more pronounced in politically contested states and for immigrants originating from Latin America.
JEL Code: H11, D72, F22. Keywords: Electoral cycles, naturalization policy.
Marcus Drometer** ifo Institute – Leibniz Institute for
Economic Research at the University of Munich
Poschingerstr. 5 81679 Munich, Germany
T +49-89-9224-1355 [email protected]
Romuald Méango Munich Center for the Economics
of Aging (MEA) at the Max-Planck Institute for Social Law and Social Policy
Amalienstr. 3 80799 Munich, Germany
T +49-89-38602-327 [email protected]
* We would like to thank Jesús Fernández-Moraga, Gordon Dahl, Thomas Stratmann, MaxSteinhardt,Michael Dorsch, and Panu Poutvaara, as well as participants of the Congress of the IIPF in Cambridge, the Jahrestagung des Vereins für Socialpolitik in Münster, the Annual Conference of the European Association of Law & Economics in Bologna, the European Public Choice Society Meeting in Budapest, the Silvaplana Workshop on Political Economy, the Public Economics Seminar at the University of Munich and the ifo lunchtime seminar for their many helpful comments and suggestions. Financial support by the Leibniz Association (SAW-2012-ifo-3) is gratefully acknowledged. ** Corresponding author.

1 Introduction
On June 18, 1798, the U.S. Congress, under the influence of the Federalist political party,
passed the Naturalization Act, which increased the period of residence required be-
fore immigrants were eligible to become naturalized and obtain citizenship from 5 to
14 years.1 Both contemporary witnesses and present historians agree that the law was
intended to decrease the number of voters, mostly Irish and French immigrants, who
supported Thomas Jefferson and the Democratic-Republicans, the Federalists’ major po-
litical rival at that time.2 Nevertheless, Jefferson won the upcoming election and during
his term the Naturalization Act of 1798 was repealed by the Naturalization Law of 1802,
which restored the five-year waiting period for naturalization. Almost 200 years later,
the Clinton Administration was accused of various manipulations prior to the 1996 pres-
idential elections, all of which were aimed at streamlining the naturalization process so
as to collect thousands of ‘newly created’ votes in key states. Critics estimate that more
than 200,000 applications were anomalously treated by the federal immigration agency
(see, e.g., Schippers and Henry (2000)). These two events illustrate the interaction be-
tween elections and naturalization policies that is at the heart of this paper.
In this paper, we analyze the impact of presidential elections and the incumbent pres-
ident’s party on the level and pattern of naturalizations across U.S. states for the period
1965 to 2012. Our results indicate that naturalization policy is (partly) driven by na-
tional elections: there are more naturalizations in presidential election years and during
the terms of Democratic incumbents. We then investigate the dynamics of an incum-
bent’s behavior over the course of his term in detail. We show that Democratic incum-
bents always favor high levels of naturalization, whereas Republican incumbents seem to
adjust naturalization policy only during election years. To disentangle the effect of gov-
ernment policies from changes in the demand for naturalizations, we examine how the
acceptance rate of naturalization petitions is affected by elections. This analysis reveals
that both parties pursue different naturalization policies, however, the electoral cycle re-
mains relevant only for Democratic incumbents. Further results indicate that the effects
are more pronounced in politically contested states and for immigrants originating from
Latin America. In light of this evidence, we argue that the incumbent strategically uses
naturalization policies to improve his (or his party’s) chances of reelection by speeding
up the naturalization process in contested states prior to a presidential election, espe-
cially in regard to immigrant groups with a clearly predictable voting pattern.
As in most developed countries, immigration policy is a highly contentious top issue
1Naturalization is the acquisition of host-country citizenship by legal immigrants, which confers uponthem the right to vote and to hold elective office.
2The alliance between the Democratic-Republican Party and the Irish immigrants developed over timedue to a number of policy issues. For example, the Irish immigrants disapproved of Federalist openness totrade with England, which they regarded as their native country’s oppressor. For further details, see, e.g.,Carter (1970) and Watkins (2004).
1

in the United States and the two major parties clearly differ in their attitudes towards
migration levels, legalization, and citizenship.3 At the same moment, the country con-
tains a huge and growing number of potential voters with immigration backgrounds.
These are, first, legal immigrants who are entitled to citizenship, but have not made any
efforts to obtain naturalization and, second, naturalized immigrants who exhibit little
political participation.4 Taylor et al. (2012) estimate that the Hispanic electorate in the
United States could double by 2030 if Hispanics’ relatively low voter participation and
naturalization rates were to rise to the levels of comparable groups. Thus, naturalization
policies are a salient factor in election politics - for at least two reasons. First, natural-
ization policies might be used by the incumbent party to shape the electorate in a way
favorable to it, as suggested in the above-mentioned anecdotes.5 If ‘newly created’ voters
have a clear tendency to support (oppose) the incumbent party, the government might
pressure the federal administration to increase (decrease) the number of naturalizations.
Second, naturalization policies reveal an incumbent’s stance on immigration for existing
voters. If supporters of the party in power prefer strict (lenient) immigration policies,
the incumbent might try to reduce (increase) naturalizations above average levels. Such
effects are likely to be more pronounced in election years when incumbents try to sig-
nal their policy stance with the intent of securing the continued allegiance of their core
supporters.
In the case of the United States, naturalization policies shape the electorate by cre-
ating new voters who (for the period considered here) show a clear tendency to support
the Democratic Party.6 At the same time, the core voters for the Democratic Party tend
to favor increased legal immigration levels and the granting of full citizenship to im-
migrants. In this context, the Democrats would seem to profit from an increase in the
number of naturalizations. In accordance with this reasoning, Mayda et al. (2016) show
that an increase of the share of naturalized migrants in the voting population decreases
votes for the Republican Party. Thus Democratic incumbents should have an incentive to
pursue more lenient naturalization policies, for example, by speeding-up the workflow
of the relevant federal agency, the U.S. Citizenship and Immigration Services (USCIS)
(as was conjectured to occur in the Clinton case prior to the 1996 presidential elections),
especially in states that are likely to be important in the presidential election and for im-
migrant groups that are clearly pro-Democratic. For Republican incumbents the case is
less clear-cut: traditionally, its supporters have been skeptical of migration-friendly poli-
cies and only a minority of naturalized immigrants vote Republican; only recently has
3According to a Gallup survey, 20 percent of U.S. registered voters say they will only vote for a candidatewho shares their views on immigration, with another 60percent responding that this issue will be one ofmany important they take into account. See Jones (2015).
4For detailed figures see Gonzalez-Barrera et al. (2013) and Section 2.2.5For an overview of naturalization policies, see Mariani (2013). A detailed account of Hispanic immi-
grants in the U.S. context is provided by DeSipio (2013).6For detailed evidence, see Section 2.2.
2
the party begun to target the growing Hispanic population, which has become too im-
portant to ignore. Against this backdrop, we expect higher levels of naturalization under
Democratic incumbents and a more clearly pronounced election-cycle under Republican
incumbents.
Our results provide strong evidence of a relationship between presidential elections
and naturalization policies. When investigating the numbers of naturalizations granted,
we find clear evidence of a partisan effect (higher under Democratic incumbents) and
an electoral cycle (higher in election years). Further investigation of the acceptance rate
that is intended to control for demand-side factors, indicates that the electoral cycle is
mainly driven by variations in the number of petitions filed, whereas the partisan effect
remains considerable in this analysis. Our analysis of the dynamics of an incumbent’s
behavior over the course of his term confirms that Democratic incumbents are always
associated with higher levels of naturalizations. In line with our prediction, we find less-
clear-cut results for Republican incumbents: they seem to vary their behavior over the
term and pursue a more liberal naturalization policy only during election periods - but
at a lower average level than is the case for Democrat incumbents. When considering
the acceptance rate, our finding of a partisan effect is confirmed, whereas - if anything
- there is an electoral cycle under Democratic incumbents, that is, there is an increase
in the acceptance rate as the (presidential) election year approaches. Two other find-
ings support our hypothesis that the pattern of naturalization observed stems from the
incumbent’s efforts to improve his (or his party’s) chances of reelection and not from a
general increase in government efficiency prior to elections. First, we show that the dy-
namics over the course of the president’s term is driven by politically contested states
which are highly valuable in terms of Electoral College votes. Second, we find that for
Democratic incumbents the pattern observed is more pronounced for naturalized citi-
zens originating from Latin American countries, who are more likely than, for example,
immigrants from Asia to vote for the Democratic Party. For the naturalization of im-
migrants from Vietnam and Laos, who are known to be pro-Republican, there are even
fewer naturalizations under Democratic incumbents. Finally, robustness checks indicate
that more naturalizations occur in states with a large share of immigrants and that our
results do not depend on individual, especially influential, presidencies such as those of
Nixon, Reagan, or Clinton.
The main hypothesis of this paper is inspired by the political budget cycle literature
following Nordhaus (1975), which argues that incumbent politicians have strong incen-
tives to distort public policies in order to increase approval rates whenever elections are
pending.7 There is ample evidence suggesting that electoral cycles occur in many, if not
all, advanced democracies, but differ substantially across countries depending on the
7Partisan drivers have been studied in the political business cycles literature since Hibbs (1977). Forempirical evidence on partisan cycles, see Alesina et al. (1997).
3

country’s fiscal transparency and its experience with democracy.8 Analogously, we argue
that the incumbent government influences federal agencies to speed up (slow down) the
naturalization process9 and take into account the relative importance of states based on
the Electoral College system as well as the expected voting behavior of naturalized cit-
izens. The literature so far has mainly applied the median voter framework to explain
immigration policies, under which the current voters weigh the economic benefits of mi-
grants against their (future) political influence (e.g., Dolmas and Huffmann 2004; Ortega
2005). The same framework is used by Mariani (2013) to explain the optimal timing of
naturalization. Bertocchi and Strozzi (2010) find evidence that countries with a jus soli
regime tend to implement more restrictive naturalization policies when facing increasing
immigration - compared to countries with a jus sanguinis regime. Other related studies
examine how immigration policies are shaped by the importance of business interest
groups and labor unions (Facchini et al. 2011) or the intention of US representatives to
protect their home district’s labor force (Facchini and Steinhardt 2011).
Our paper is structured as follows. Section 2 describes the institutional background.
Section 3 presents the methods employed to empirically test the above hypotheses, as
well as the data used. Section 4 presents the results of the empirical analysis and Section
5 several robustness checks. Section 6 concludes.
2 Background and Determinants of Naturalization
2.1 Naturalization Process
U.S. citizenship regulations are based on federal law and entitle an immigrant who has
been a permanent resident in the United States for at least five years to apply for citizen-
ship. Applicants are required to pass a simple test of their English and civics knowledge,
and the vast majority of applicants do. Moreover, they need to prove their good moral
character (i.e., no (serious) criminal record). It takes roughly five to eight months from
the submission of an application until the final decision. The naturalization process is
implemented by the U.S. Citizenship and Immigration Service (USCIS), a federal agency
under the jurisdiction of the Department of Homeland Security (DHS). The key func-
tions of the USCIS are processing naturalization applications, overseeing the immigra-
tion of family members, granting work allowances (temporarily or permanently with a
green card), and processing asylum and refugee applications. Prior to March 1, 2003,
the functions now performed by the USCIS were carried out by the former Immigration
and Naturalization Service (INS), which was restructured in the course of the major re-
organization of most federal services related to homeland security in the aftermath of
8See, e.g., Brender and Drazen (2005) and Alt and Lassen (2006).9Drazen and Eslava (2010) argue similarly in a game-theoretical framework where the incumbent ad-
justs the composition of government spending in election periods to gain the approval of swing voters.
4

September 11, 2001.
2.2 Immigration and Naturalization in the Political Debate
The shift in the composition of the U.S. population away from the former white majority
to a greater proportion of nonwhite groups has put migration and naturalization policies
at the forefront of political debate for two reasons. Legal migrants from Asia and Latin
America are currently the fastest-growing ethnic groups in the United States.10 Foreign-
born citizens represent a significant pool of potential voters, even though their political
participation rates are traditionally lower than those of average natives.11 Moreover,
many legal permanent immigrants are not U.S. citizens even though most of them meet
the qualifications: a third of eligible immigrants from Mexico have not (yet) filed a pe-
tition for citizenship. Finally, the median age of immigrants is much younger than that
of natives. In 2012, 17.6 million Hispanics were under the age of 18 and will automat-
ically become eligible to vote once they turn 18 as most of them are U.S.-born. In total,
Gonzalez-Barrera et al. (2013) estimate that the Hispanic electorate will double by 2030
if their participation and naturalization rates reach average levels.
Both parties generally exhibit positive attitudes toward immigration in general.12
However, Republicans are perceived as campaigning for stricter rules to prioritize le-
gal migration and discourage and stop illegal migration. An important point of divide
is the conditions for obtaining citizenship, as exemplified by the debate on immigration
reform under the Obama Administration. Republicanviews.org reports that:13
[D]espite believing that there is a possibility it will reward and encourage
illegal behavior, 70% of Republicans actually believe that the country could
benefit from having illegal immigrants join the workforce as legal workers.
The difference is in whether or not they should be given an opportunity to
become full citizens, with Democrats saying yes and Republicans saying no.
The core electorate of the Republican Party consists of non-Hispanic white citizens,
who are traditionally skeptical about migration. Hispanic and other groups with migra-
tion backgrounds lean toward the Democratic Party.14 For these groups, immigration
10See, e.g., DeSipio (2013) and Gonzalez-Barrera et al. (2013) for a detailed analysis.11Xu (2005) argues that registration requirements are an important factor in explaining the lower
turnout rates among Asian Americans and Hispanics.12This statement refers to the period analyzed in our paper. In contrast, the 2016 elections
were characterized by a fundamental divide between the two major parties on immigration issues.See, for example, http://www.bloomberg.com/politics/articles/2016-03-14/two-parties-two-radically-different-visions-on-immigration, accessed November 5, 2016.
13See http://www.republicanviews.org/republican-views-on-immigration/ accessed 20 October 2016.14Currently, 86 percent of Republican and Republican-leaning registered voters are non-Hispanic
whites, compared with 57 percent of all Democratic and Democratic-leaning registered voters. Over time,the gap between the share of white voters in the Republican and Democratic parties has increased, goingfrom 17 percent in 1992 to 29 percent in 2016. See http://www.people-press.org/2016/09/13/the-parties-on-the-eve-of-the-2016-election-two-coalitions-moving-further-apart/, accessed November 5, 2016.
5

policies are clearly a threshold issue, that is, these voters are particularly sensitive to
candidates’ stance on immigration policies, and mostly regard this as the fundamental
issue.15 Thus, an incumbent can both signal his political stance on migration policies
and influence the composition of the electorate by tightening or softening the natural-
ization process. This in turn generates political incentives to manipulate immigration
policies, usually more subtly than that demonstrated by the 1798 Naturalization Act.
2.3 Naturalization and the Electoral Cycle
In the following empirical analysis, we investigate two possible effects of politics on nat-
uralization rates. First, we will say that there is a partisan effect if naturalization levels
are consistently higher under a specific incumbent party. Second, we will say that there
is an electoral cycle if naturalization levels (or rates) are higher in election years. In gen-
eral, the number of immigrants who obtain citizenship depends on various factors, but
we distinguish two main channels through which the electoral cycle can affect natural-
ization. The first one is the “demand” for naturalization, that is, the decision by lawfully
eligible immigrants to apply for citizenship. The second one is the “supply” of natural-
ization, that is, the actions of the federal agency or the incumbent party to increase or
decrease the number of naturalizations in a given period.
The demand-side effect depends on the size of the immigrant population that is eli-
gible, but also strongly on their intentions, that is, whether they decide to file a natural-
ization petition.16 As electoral campaigns or media reports might motivate eligible im-
migrants to register for citizenship ahead of elections, an approaching election is likely
to increase the demand for naturalizations (and thus, at least normally, the number of
naturalizations granted). Therefore, we disentangle the demand-side effects from the
government’s current actions by controlling for the stock of immigrants eligible for nat-
uralization and the number of applications for citizenship, as outlined in the next section
in more detail. However, the size of this demand effect is likely to be small as the entire
naturalization process takes several months and needs to be completed before the voter
registration deadline for an upcoming election.
On the supply side, the federal government can influence naturalization policies ei-
ther by creating new voters, or by signally to existing voters its stance on migration.17
This can be done in several ways. First, it can adjust the legal regulations for naturaliza-
tion and immigration. There were only minor changes to the naturalization law in the
15See, e.g., The Economist (March 14, 2015).16In an analysis of mass migration from European countries to the United States at the beginning of the
20th century, Shertzer (2016) shows that share of immigrants in the local population is relevant for theirpolitical mobilization.
17Stricter immigration policies can also be thought of as a political instrument during negotiations withthe opposition party, for example, the DREAM Act and the number of deportations under the ObamaAdministration. There is no direct example in the case of naturalization.
6

period considered in our analysis,18 but immigration requirements were adjusted fre-
quently and substantially.19 Any changes to immigration laws affect the size and com-
position of potential citizens a few years into the future. For example, amnesties for
unauthorized immigrant workers auch as the Immigration Reform and Control Act of
1986 substantially increased the pool of immigrants with a permanent residence permit.
Second, the government can actively promote citizenship among eligible immigrants
via media campaigns. For example, the Obama Administration launched a comprehen-
sive campaign targeting major media markets in 10 major states, allowed naturalization
fees to be paid by credit card, and introduced a partial fee waiver program20 on the eve of
the 2016 elections in order to remove barriers to applying for full citizenship by perma-
nent residents.21 As part of the White House’s “Stand Stronger” initiative, 70 outreach
events were planned in the first week of the campaign, as well as 200 naturalization cer-
emonies that would induct 36,000 new citizens over the same period.22 Republican pol-
icymakers have criticized these measures, expressing concern that they allow (mainly)
new Democratic voters to register.23
Third, an incumbent president might be inclined to influence the workflow of the
federal agency, the USCIS (previously the INS), in order to improve his own and/or his
party’s chance of reelection. The USCIS has a certain amount of discretion in regard to
the speed (or lack thereof) of the decision process, the level of information dissemination
about the naturalization process, and where, that is, which states and immigrant groups,
to focus its efforts. Frequent complaints about serious backlogs and related policy in-
terventions by the government support the view that the USCIS (previously the INS) has
exhibited considerable variation in the speed of processing applications.24 This hypothe-
sis is substantiated by a number of well-documented cases where the federal government
was criticized for having pressured the USCIS (formerly the INS). Most prominently, the
Clinton Administration was accused of having put pressure on INS offices to expedite
their work and to rapidly clear the backlog of applications pending review (see Coutin
18Strozzi (2016) documents that citizenship requirements are changing globally, but no general conver-gence is observed.
19The PEW Research Center lists 11 major changes between 1965 and 2012. See pewre-search.org at http://www.pewresearch.org/fact-tank/2015/09/30/how-u-s-immigration-laws-and-rules-have-changed-through-history/, accessed September 29, 2016.
20A nationwide survey of Hispanic immigrants by the Pew Hispanic Center in 2012 found that 18 per-cent of those who have not yet naturalized identified administrative barriers as a reason for not doing so,such as the financial cost of naturalization. See: http://www.pewhispanic.org/2013/02/04/the-path-not-taken/, accessed September 29, 2016.
21C.f., Memorandum “Policies to Promote and Increase Access to U.S. Citizenship” athttps://www.dhs.gov/sites/default/files/publications/14_1120_memo_naturalization.pdf, accessedFebruary 20, 2017.
22See Politico.com at http://www.politico.com/story/2015/09/obama-citizenship-immigrants-naturalization-democrats-213810#ixzz3oS6y4e6N, accessed on October 13, 2015.
23See Fox News on http://www.foxnews.com/politics/2014/12/20/new-citizens-push, accessed onApril 29, 2015.
24For example, the Migration Policy Institute (2005) describes the persistent backlog in naturalizationprocessing. We also find evidence of a congestion effect in our empirical analysis (see Section 4).
7

2006, p.513f). In particular, the vice president’s office is thought to have been engaged in
various types of manipulation prior to the 1996 presidential elections, all of which were
aimed at streamlining the naturalization process so as to collect thousands of new vot-
ers in key states. For example, new leaders (known as “reinventors”) were appointed to
many INS offices, replacing leaders who were not as efficient as the Clinton Administra-
tion required.25 Finally, the INS also seems to have been pressured to lower its standards.
In particular, it allowed for an insufficient screening of fingerprints, which are necessary
to check the criminal record of applicants.26
In the case of CUSA, it is reported that special attention was given to California,
Florida, Illinois, New York, New Jersey, and Texas, which hold a combined total of 181
electoral votes. Whereas changes in federal naturalization and immigration laws by def-
inition affect all states in the same way, both campaigning via media and influencing the
workflow of a federal agency can be targeted. Our prior is that the incumbent party can
exploit this discretionary power by focusing on states that are more valuable in regard to
Electoral College votes. This should be reflected by a higher number of naturalizations
in states that are contested and have many electoral votes.
3 Estimation Approach and Data
3.1 Specification
To discover whether there is an electoral cycle and/or a partisan effect in the evolution of
naturalization across U.S. states, we start with a basic regression analysis of the following
form:
Ys,t = α0 +αYs,t−1 + β1P residential_election_yeart
+β2P residential_incumbent_partyt
+γSecond_termt + ΓXs,t +θs + es,t,
(1)
where P residential_election_yeart represents an indicator variable that equals 1 in ev-
ery presidential election year and P residential_incumbent_partyt an indicator variable
that equals 1 if the incumbent president belongs to the Democratic Party. The indicator
Second_termit takes the value 1 when the president is in his second term.
Ys,t, the dependent variable, stands for the main outcome of interest in state s and
year t. First, we investigate the existence of an electoral cycle and a partisan effect in
25Schippers and Henry (2000) contains a detailed account of the accusations against the Clinton Admin-istration following the “Citizenship USA” (CUSA) initiative from August 1995 through September 1996.
26According to the Los Angeles Times (February 10, 1998)), processing errors were found in 90.8 per-cent of the cases handled during the CUSA initiative, resulting in 75,000 applicants with arrest recordsbecoming new U.S. citizens, in addition to 166,000 whose fingerprints were unclassifiable or not evensubmitted.
8

the (log) number of naturalizations.27 To avoid the potentially disproportionate influence
of state-year observations with a very small number of naturalizations, we restrict our
attention to those with more than 50 naturalizations (affecting 39 out of 2,304 observa-
tions). Following the literature on electoral cycles, we specify Equation (1) as a dynamic
panel to capture the persistent nature of policy choices.
Xs,t groups a set of state-year characteristics that are likely to influence the number
of naturalizations, for instance, average income, population size, urbanization rate, and
average education. Furthermore, the size of the stock of migrants in a state, in particular
the stock of immigrants who can lawfully apply for U.S. citizenship, might be relevant as
it determines the potential for naturalization.28 Therefore, we approximate the number
of these “eligible” immigrants, Es,t, by calculating the stock of immigrants who received
a permanent residence permit in state s between the years t−15 and t−5 minus the num-
ber of naturalized immigrants between the years t − 10 and t.29 In some specifications
(not shown), we also include a time trend to account for the possibility that our results
are driven by a general upward trend in naturalizations. We account for unobserved het-
erogeneity using state fixed effects, θs, capturing all time-invariant state characteristics.
Finally, es,t represents an error term with standard errors clustered by state.
Our basic results indicate that there is indeed an electoral cycle as well as partisan
effects in naturalization policies. To decompose the driving forces behind this aggregate
effect, we analyze the dynamics of presidential incumbents’ behavior over the course of
their terms by estimating variants of the following equation:
Ys,t = α0 +αYs,t−1 + βrep2 Rep_secondt + . . .+ βrep4 Rep_f ourtht
+βdem1 Dem_f irstt + . . .+ βdem4 Dem_f ourtht
+γSecond_termt + ΓXs,t +θs + es,t,
(2)
where, for example, the variable Rep_secondt is a dummy variable that equals 1 if the
incumbent president is from the Republican Party and is in the second year of his term.
The specification of the set of dummies
(Rep_f irstt, . . . ,Rep_f ourtht,Dem_f irstt, . . . ,Dem_f ourtht)
allows capturing dynamic effects over one presidential term, the reference period being
the first year of a Republican incumbent.30
As noted earlier, the observed patterns of naturalization might be influenced by both
27The alternative specification log(naturalizationsit/populationit) yields very similar results.28Our regression results show that this factor is relevant for explaining the number of naturalizations,
but is not crucial for our main results.29Additionally, we normalized all values to avoid negative numbers.30We experimented with dummies up to the eighth year to flexibly differentiate between first and second
term effects. However, the coefficient estimates were sensitive to outliers.
9

the demand and the supply side. To isolate the supply-side effect, that is, legal changes
by the federal government and changes in the behavior of the USCIS, we investigate the
effect of the electoral cycle on the proportion of naturalization petitions that are suc-
cessful by state and year (the acceptance rate). In comparison to our fist specification,
there is less concern that demand-side effects, for example, an increase in the number of
applications due to the electoral campaign, directly translate into changes of the depen-
dent variable. One challenge to this analysis is that data on the number of petitions filed
are available only at the aggregate (federal) level.31 To approximate the number of peti-
tions filed in each state in a given year, we distribute the aggregate number of petitions
filed in this year between states according to the relative size of the eligible immigrant
population.32 That is, if Et is the aggregate number of eligible immigrants, Es,t the num-
ber of eligible immigrants in state s and P Ft the number of petitions filed in year t, we
approximate the number of petitions filed in state s and year t, P Fs,t, by :
P Fs,t :=Es,tEtP Ft
Then, in Equation (2), Ys,t is defined as the ratio between the number of naturalizations
and the number of petitions filed P Fs,t in state s and year t. In this specification, instead
of the stock of eligible migrants, we control for the aggregate number of petitions filed
as well as for the estimated number of petitions filed at the state-year level.
3.2 Estimation Procedure
We first report the results of the pooled OLS estimator. The fixed effects estimator (FE)
improves on it by controlling for the unobserved state-specific effects. However, the
presence of serial correlation in the residuals and the decrease in the estimated coef-
ficient pertaining to the lagged dependent variable, Ys,t−1, indicate that the FE might
also suffer from a bias (see Nickell 1981; Kiviet 1995). To account for this issue we re-
port estimates based on the system GMM estimator developed for dynamic panel data
by Blundell and Bond (1998) as a robustness test.33 In this framework, we define the
following variables as endogenous:34 Ys,t,Ys,t−1 and the number of eligible migrants in
state s at time t. When estimating the effect of the electoral cycle on the proportion of
petitions that are successful, we consider the number of petitions filed at the state level
31The dis-aggregated series are available only for very recent years. Despite several attempts, we couldnot obtain the long series of petitions filed at the state level.
32Thus the approximation of the acceptance rate rests on assumptions that are not necessary when as-sessing the number of naturalizations. In particular, migration of immigrants across states needs to besufficiently low as well as the probability of applying for citizenship after having been entitled to do so for10 years.
33We also tried the first-difference estimator based on Arellano and Bond (1991). However, this sufferedfrom the weak instrument problem.
34Our results are robust to specifications that define the number of eligible migrants and the number ofpetitions filed at the state level as exogenous.
10

as endogenous. The lagged values of these variables are used as instruments to create
moment conditions. For example, for the main dependent variable Ys,t, the Blundell and
Bond (1998) estimator combines the moment conditions for the “differenced model”:
E((es,t − es,t−1)Ys,t−i
)= 0 for some integer i ≥ 1.
with those for the “level model”:
E((θs + es,t)(Ys,t−i −Ys,t−i−1))
)= 0 for some integer i ≥ 1.
As the serial correlation test suggests an AR(1) (or sometimes AR(2)) model for the er-
rors, we use the lags up to the period t − 2 (or sometimes t − 3). We report results based
on a collapsed set of instruments as proposed by Roodman (2009) and limit the number
of lags further to reduce the number of instruments close to√nobs. We also tried dif-
ferent lag specifications as instruments which yielded very similar results. In all GMM
specifications we assume that the election indicator is strictly exogenous.
3.3 Data
To analyze how the number of naturalizations granted by the USCIC differs across time
and states, we use data for the 48 contiguous U.S. states from 1965 to 2012. In the course
of U.S. history, the parties’ stance on immigration issues have undergone a number of
substantial changes. In particular, the parties changed their positions on racial issues,
with the Democratic Party becoming most popular among black voters in the U.S. South
in the early 1960s. Carmines and Stimson (1989) argue that the 1964 presidential elec-
tions marked the most important recent issue-based realignment of parties and voters.
Moreover, in 1965, the landmark Immigration and Nationality Act, which replaced the
system of country quotas with one that favored family reunification and skilled immi-
grants, was enacted. The Act had the result of changing the dominant immigration pat-
tern from one where most immigrants were people born in Europe to one in which most
are from Asia and Latin America. Therefore, we restrict attention to the post-1964 period
in our analysis and use the data from 1950 on to approximate the stock of immigrants
eligible for citizenship, as described in Section 3.1.35
Data on naturalization and permanent residences are available from the StatisticalYearbook of the Immigration and Naturalization Service issued by the U.S. Department of
Homeland Security. The naturalization figures refer to the U.S. government fiscal year
starting October 1. As the registration period for presidential elections also ends around
that date (one month before the election takes place), the data are suitable for capturing
an electoral cycle.36 The data include only those persons who were lawful permanent
35The results do not change qualitatively when using the entire sample.36The number of permanent residences by state of intended residence was not available for 1980, 1981,
11

residents (“green card” holders), 18 years old or over, filed an N-400 Application for
naturalization and were subsequently granted U.S. citizenship.37 Table 1 reveals that,
on average, more than 11,000 immigrants obtain citizenship per state and year. There
is large variation across states, with high numbers of naturalizations in states with large
immigrant populations, such as California, Florida, and New York. The data on perma-
nent residencies arestem from the same source.
The data on election dates and outcomes were gathered from the Federal Election
Commission and Beyle et al. (2002). Based on these data, we constructed indicators for
presidential elections as well as for the party of the incumbent president. Table 1 shows
that there were slightly more Republican presidents during the time period considered.
Finally, we use data on population, educational attainment (percentage of total popula-
tion 25 years and over with a high school diploma or a higher degree), and the stock of
migrants from the U.S. Bureau of the Census (Statistical Abstracts). Data on per capita
income (measured in 2000 dollars) were collected from the U.S. Bureau of Economic
Analysis.
[Table 1 about here.]
4 Results
In the first set of regressions, we look for the existence of an electoral cycle and a parti-
san effect in the number of naturalizations by state and year based on our basic Equation
(1). For each of the outcomes, Table 2 reports the estimation results using a pooled OLS
(Column (1)), a fixed effects (Column (2)), and a GMM estimation (Column (3)). We find
clear evidence of an electoral cycle in the number of naturalizations across all specifica-
tions that amounts to an increase of roughly 5 percent in presidential election years. At
the same time, our findings indicate that the identity of the party in power is relevant:
the number of naturalizations is around 3 to 6 percent higher under Democratic govern-
ments. Additionally, we find that the number of naturalizations is lower in a president’s
first term in office. As expected, in areas with larger eligible migrant pools, the num-
ber of naturalizations is higher. Furthermore, there is a strong and highly significant
relationship between size of the population and naturalizations. Equally, our estimates
suggest that more immigrants obtain citizenship in states with higher income growth. In
contrast, differences in educational attainment do not seem to matter in our context.
As discussed in Section 2.3, there are two ways to interpret these results, depend-
ing on whether one focuses on the demand side or the supply side. A “demand-side”
or 1987, but was interpolated after ensuring that there were no major changes at the aggregated nationallevel.
37By law, only lawful permanent residents who are age 18 or over can apply for citizenship. However,those under the age 18 can obtain “derivative citizenship” when his/her parent naturalizes.
12

driven interpretation explains the observed electoral cycle by a higher petition rate dur-
ing election years: the electoral campaign might induce eligible migrants to natural-
ize in election years. Along the same lines, the partisan effect could be explained by
a higher propensity for eligible migrants to obtain U.S. citizenship under a Democrat
president.38 A “supply-side” driven interpretation emphasizes the role of the incum-
bent president (party). The finding of an electoral cycle suggests that the incumbent
president makes use of his power to influence the naturalization process to improve his
chances of reelection. Equally, the evidence of partisan effects confirms the hypothesis of
a pronounced difference between the underlying incentives of the two major parties to
grant citizenship: a Democratic incumbent both gains new (on average) favorable voters
without threatening the support from his core voters; a Republican incumbent, however,
face various trade-offs: new voters tend to lean toward the opponent party and his core
voters are skeptical towards immigration, but at the same time it is more and more costly
to ignore the growing number of foreign born voters.
Both interpretations might be valid concomitantly. To isolate the supply-side effect,
we investigate the existence of an electoral cycle and a partisan effect on the propor-
tion of naturalization petitions that are successful by state and year (acceptance rate), as
explained in Section 3.1. In contrast to the number of applications, which might me-
chanically drive the consequent number of naturalizations, the acceptance rate is based
on (implicit or explicit) decisions by the government agency. Columns (4) to (6) of Ta-
ble 2 reports the results. The presidential election year effect becomes smaller (around
3 percent) and remains statistically significant only in the GMM specification. In con-
trast, partisan effects seem to be highly relevant for the acceptance rate (around percent
and highly significant throughout all specifications). Interestingly, the acceptance rate
declines with the number of petitions filed. This indicates that the USCIS’s capacity is
constrained, as suggested by policy reports and anecdotal evidence (see Section 2.3).
[Table 2 about here.]
To analyze our findings in more detail, we investigate the dynamics of an incumbent’s
behavior over the course of his term. To this end, we introduce a set of dummy variables,
as specified in Equation (2), that allow capturing the behavior of an incumbent of party
p ∈D,R in a specific year of the term y ∈ 1,2,3,4 relative to the behavior of a Republican
incumbent in his first term. With this notation, the presidential election occurs during
year 4, and the mid-term election during year 2. We start with investigating the dynamics
of an incumbent’s behavior with respect to the number of naturalizations by state and year.
Table 3 displays the results using a pooled OLS (Column (1)), fixed effects estimation
(Column (2)), and GMM estimation (Column (3)). The main coefficients of interest, those
38Economic incentives are less of a concern as the impact of naturalization on labor market outcomesis very limited for new citizens who have already been permanent residents for a number of years. For adiscussion, see, e.g., Mariani (2013).
13

pertaining to the set of dummies identifying the incumbent party and the corresponding
year of the term, are illustrated in Figure 1(a).39
[Table 3 about here.]
[Figure 1 about here.]
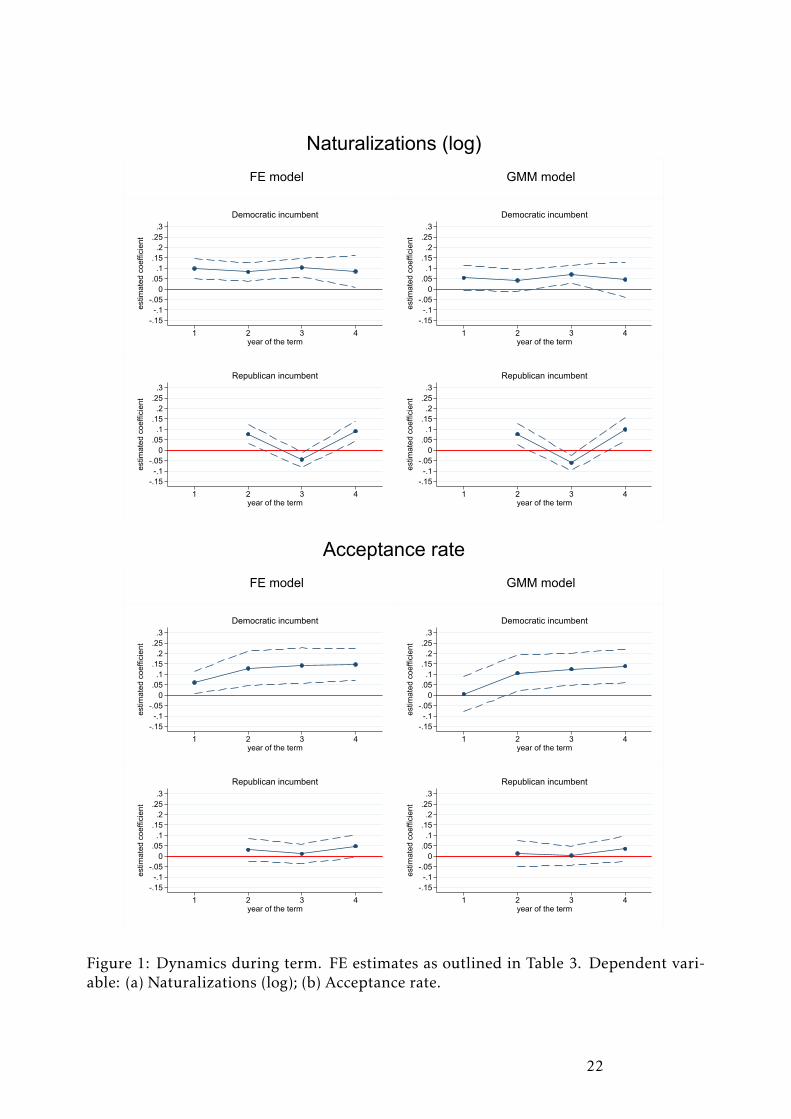
As evident from Figure 1(a), the behavior of Democratic incumbents is rather stable
throughout the presidential term. According to the FE model, the absolute number of
naturalizations under a Democratic incumbent is about 8 to 10 percent higher compared
to the first year of a Republican incumbent. With GMM, this finding is less pronounced,
with only two coefficients being significant. Under a Republican president, there are
considerable variations: the number of naturalizations is highest (7 to 10 percent higher)
in the second and fourth years of the term, which correspond to the mid-term election
and presidential election, and zero otherwise. In total, our results suggest that Demo-
cratic incumbents are associated with high levels of naturalizations throughout the term
(constituting the partisan effect). Under Republican incumbents, however, the number
of naturalizations only increases during election years (constituting the electoral cycle).
In total, Republican incumbents seem to vary their behavior over the course of the term,
adjusting naturalization policies in response to the conflicting incentives they face.
While these findings are consistent with a strategic usage of naturalization policies by
the incumbent government, the potential contamination by demand-side effects needs to
be examined further. Thus, we investigate the dynamics of an incumbent’s behavior over
the course of the term with respect to the acceptance rate. Columns (4) to (6) of Table
3 report the results. The estimates of our main coefficients of interest are illustrated
graphically in Figure 1(b). Our estimates indicate that the acceptance rate is higher under
Democratic incumbents. Compared to the first year of a Republican incumbent, the
acceptance rate is between 6 and 15 percent higher under a Democrat incumbent, which
hints at a strong partisan effect stemming from the supply side. Moreover, the increase
is strongest during the years that are closer to the next presidential election. In contrast,
there is (almost) no variation under a Republican incumbent. Thus the electoral cycle
observed for Republican incumbents with regard to the number of naturalizations seems
to be driven by demand-side effects.
If the incumbent president (or party) is able to influence naturalization procedures, it
is likely that - given the Electoral College - such efforts are focused on politically salient
states.40 To test whether this mechanism partly explains the pattern of naturalization
39The GMM results are robust to the specification of the endogenous variables, instruments, and mo-ment conditions. Moreover, we included a linear time trend, a dummy for the restructuring of U.S. immi-gration administration after September 11 as well as the stock of immigrants per states and year. All thesevariants have no qualitative and very little quantitative impact on our results.
40Strömberg (2008) shows that the number presidential campaign visits can be explained by the states’number of electoral votes and the election outcome forecasts.
14
across states (and presidential election years), we split the states in presidential election
years into a contested group and a safe group. We rank the states according to their polit-
ical salience in each presidential election approximated by the number of electoral votes
divided by the corresponding (absolute) winning margin and carry the corresponding
value forward for the entire term.41 The contested (safe) group consists of states in the
upper (lower) half of the corresponding distribution. Then, we repeat the estimation
procedure for each group.
[Table 4 about here.]
[Figure 2 about here.]
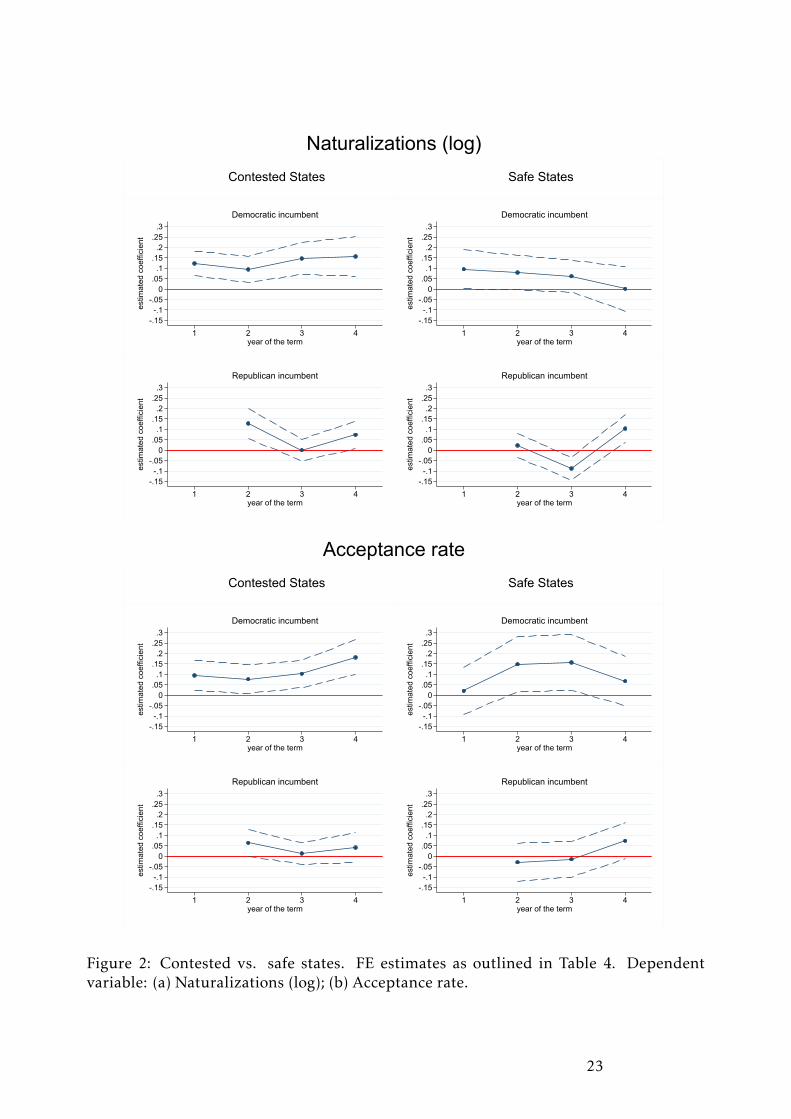
Table 4 reports the estimation results, which are illustrated in Figures 2(a) and 2(b).
There is strong evidence that the partisan effect and the electoral cycle in the level of
naturalization are mainly driven by contested states (Columns (1) and (2)). Compared
to the first year of a Republican incumbent, the number of naturalizations is between
15 and 18 percent larger and statistically highly significant under a Democrat incum-
bent in the contested group. In the safe states, however, no such effect can be observed.
For the Republican incumbents, the differences across the two groups of states are less
pronounced. Looking at the acceptance rate, the picture is very similar for the Demo-
cratic incumbents, with acceptance rates between 13 percent and 25 percent higher in
contested states and zero effects in the safe states. Equally, any effects under Republican
incumbents seem to be driven by the contested states. While the partisan effect is highly
obvious, the only potential electoral cycle consists in the tendency of a higher acceptance
rate under Democratic incumbents as the election year approaches, in particular when
comparing the estimated coefficients across the contested and safe states.
There is ample evidence that the voting behavior of naturalized immigrants differs
depending on their origin country. Voters originating from Latin America (apart from
the Cuban immigrants) strongly favor the Democrats. The democratic advantage of the
Democratic candidate among voters of Latin American origin in the presidential elec-
tions between 1980 and 2013 ranges from 18 percent to 51 percent.42 The Republican
Party has historically been favored only by those who fled communism during the Cold
War, for example, former immigrants from Vietnam and Laos (and Cuba).43 The Re-
publican Party’s vocal anti-communism has been especially attractive to older and first-
generation Vietnamese Americans; 51 percent of voters with Vietnamese origin voted for
the Republican candidate in the 2008 election.44 Unfortunately, there is no systematic
41We obtain very similar results when using the value calculated for the next presidential election todefine whether a state is contested or safe.
42See Lopez and Taylor (2012).43Laos was also affected by the Vietnam War and was under a communist government in the years
thereafter.44C.f. Junn et al. (2008). For a detailed discussion, see Kuo et al. (forthcoming).
15

evidence over time and the data on naturalizations by origin country are highly lim-
ited. We obtained the number of naturalizations for the main source countries only from
1982 onward and no information on the number of applications filed per origin country.
Consequently, we focus on two regions of origin (Latin America and Asia) as well as a
number of selected countries in the following.
[Table 5 about here.]
[Figure 3 about here.]
[Figure 4 about here.]
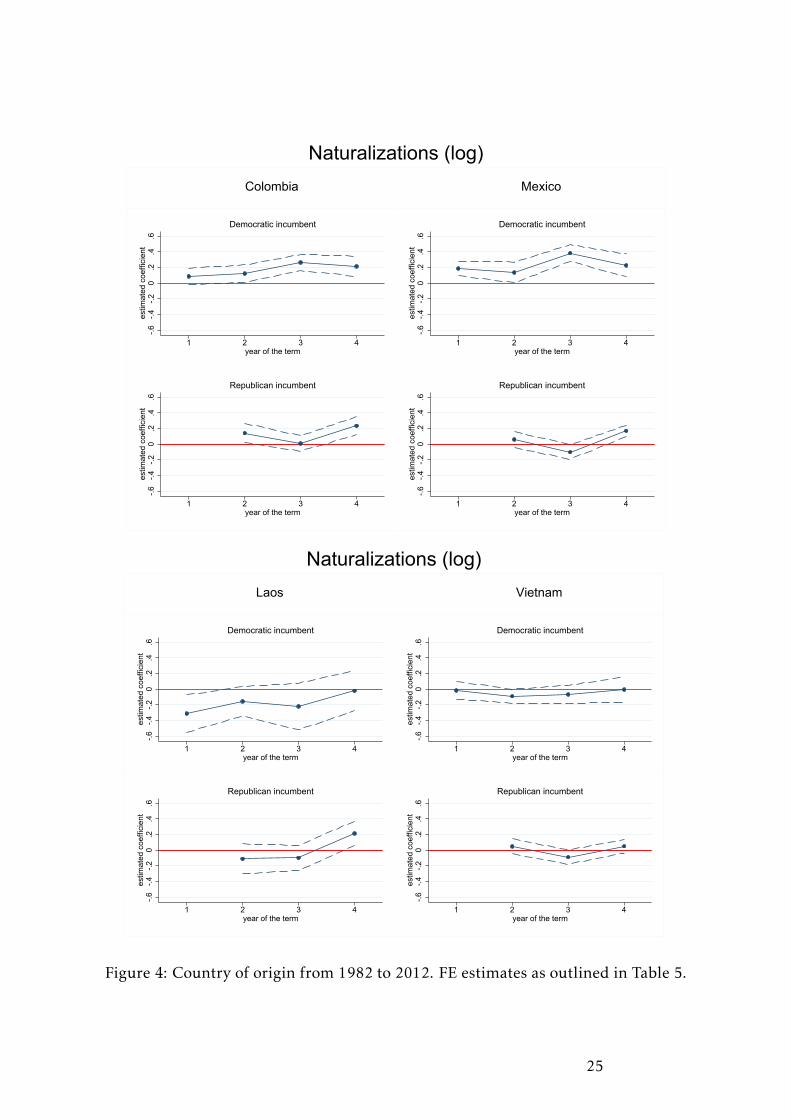
The results for the three regions of origin are presented in Table 5, Columns (1) and
(2) and graphically illustrated in Figure 3(a). As expected, we find a particularly strong
partisan effect for voters of Latin American origin (up to 38 percent more naturalizations
under Democratic incumbents), which is much less pronounced or clear-cut for Asian
origin voters. At the same time, there is evidence of a substantial presidential election
effect under Republican incumbents in all three groups. Columns (3) to (6) of Table 5
and Figures 4(a) and 4(b) show the results for a selected number of origin countries. The
results for naturalized immigrants originating from Columbia represents the model case
of our analysis with a very strong partisan effect that is present throughout the entire
term and an equally strong electoral cycle under Republican incumbents. The outcome
is similar for Mexico as the most important origin country for the period considered
here. Interestingly, we observe a very different pattern for countries such as Vietnam and
Laos where we do not find any evidence of a partisan effect. If anything, there are less
naturalizations under Democratic incumbents. This result is consistent with the voting
behavior of Vietnamese and Laotian immigrants, who sympathized with the Republican
Party for its strictly anti-communist stance.
5 Robustness
Immigration policies are expected to play a more important role, and thus also be more
affected by electoral incentives, in high immigration states such as California, Florida,
and New York. Thus we rank states along the yearly distribution of the stock of immi-
grants and repeat the estimation once for states in the upper tercile and once those in the
lower tercile of this distribution.45
[Table 6 about here.]
45When spitting the sample as before, the results are less pronounced.
16

Table 6 reports the results separately for high and low immigration states. The results
indicate that the partisan effect and the electoral cycle in the number of naturalizations
are mainly observed in states with a high level of immigration (Columns (1) and (2)). In
these states, naturalizations are from 8 to 21 percent higher than in states with less im-
migration. Equally, the cycle observed for Republican incumbents seems to be a bit more
pronounced in the high immigration states. However, when focusing on the acceptance
rate (Columns (3) and (4)), the evidence is less clear-cut, especially when the sample is
split into two (not shown).
Finally, we test whether our results are driven by exceptional presidencies rather than
by the two major U.S. parties in general. For example, the events discussed in Section 2
might suggest that naturalization policies were especially used for electoral purposes
by the Clinton Administration. Similar arguments apply to the Reagan Administration.
Finally, the only case in our sample where a president did not finish his term was Nixon’s
second term. To check whether these particular presidencies are crucial for our findings,
we estimate our basic specifications while excluding Nixon’s second term in office and
the entire Reagan and Clinton presidencies. The results, shown in Tables 7 and 8, are
very much in line with our previous findings.
[Table 7 about here.]
[Table 8 about here.]
6 Conclusion
Naturalization is an important element of U.S. immigration policy, and an issue over
which the two major parties are clearly in disagreement. Using a panel of naturalizations
in U.S. states from 1965 to 2012, we empirically analyze the impact of presidential elec-
tions on the number of migrants acquiring U.S. citizenship. We find a strong presidential
election year effect as well as substantial partisan effects. The number of naturalizations
is considerably larger in presidential election years and under Democratic presidents.
Moreover, the evidence indicates that the partisan effect is mainly driven by politically
salient contested states.
Our results strongly suggests that the incumbent president makes use of his power to
influence the working of federal (immigration) agencies to improve his chances of reelec-
tion. We interpret these effects as the outcome of the incumbent government’s efforts to
improve its chances of reelection by increasing the number of (likely) supporters. While
there is ample evidence of electoral cycle and partisan effects in government spending,
this is one of the few papers to provide evidence that governments directly intervene in
the working of (federal) agencies for their own purposes. Our findings thus suggest that
focusing on de jure institutional provisions, such as existing laws, is not sufficient when
analyzing changes in government activities such as immigration policies.
17

References
Alesina, A., Roubini, N., and Cohen, G.: Political cycles and the macroeconomy, MIT Press,
1997.
Alt, J. E., and Lassen, D. D.: Transparency, political polarization, and political budget
cycles in OECD countries, American Journal of Political Science, 50(3), (2006), 530–550.
Arellano, M., and Bond, S.: Some tests of specification for panel data: Monte carlo evi-
dence and an application to employment equations, Review of Economic Studies, 58(2),
(1991), 277–297.
Bertocchi, G., and Strozzi, C.: The evolution of citizenship: Economic and institutional
determinants, Journal of Law and Economics, 53(1), (2010), 95–136.
Beyle, T., Niemi, R. G., and Sigelman, L.: Gubernatorial, senatorial, and state-level presi-
dential job approval: The US officials job approval ratings (jar) collection, State Politicsand Policy Quarterly, 2(3), (2002), 215–229.
Blundell, R., and Bond, S.: Initial conditions and moment restrictions in dynamic panel
data models, Journal of Econometrics, 87(1), (1998), 115–143.
Brender, A., and Drazen, A.: Political budget cycles in new versus established democra-
cies, Journal of Monetary Economics, 52(7), (2005), 1271–1295.
Bureau of Economic Analysis: Personal income statistics, Washington D.C.: BEA.
Carmines, E. G., and Stimson, J. A.: Issue evolution: Race and the transformation of Ameri-can politics, Princeton University Press, 1989.
Carter, E. C.: A" wild Irishman" under every federalist’s bed: Naturalization in Philadel-
phia, 1789-1806, Pennsylvania Magazine of History and Biography, (1970), 331–346.
Coutin, S. B.: Cultural logics of belonging and movement: Transnationalism, naturaliza-
tion, and U.S. immigration politics, Anthropology of the State: A Reader, 30(4), (2006),
310.
DeSipio, L.: From naturalized citizen to voter: Context of naturalization and electoral
participation in Latino communities, in D. L. Leal, and J. E. Limón (Eds.), Immigrationand the border politics and policy in the new Latino century (pp. 149–181), University of
Notre Dame Press, 2013.
Dolmas, J., and Huffman, G. W.: On the political economy of immigration and income
redistribution, International Economic Review, 45(4), (2004), 1129–1168.
18

Drazen, A., and Eslava, M.: Electoral manipulation via voter-friendly spending: Theory
and evidence, Journal of Development Economics, 92(1), (2010), 39–52.
Facchini, G., Mayda, A. M., and Mishra, P.: Do interest groups affect US immigration
policy? Journal of International Economics, 85(1), (2011), 114–128.
Facchini, G., and Steinhardt, M. F.: What drives US immigration policy? Evidence from
congressional roll call votes, Journal of Public Economics, 95(7), (2011), 734–743.
Gonzalez-Barrera, A., Lopez, M. H., Passel, J. S., and Taylor, P.: The path not taken, Pew
Research Center, 2013, available at http://www.pewhispanic.org/2013/02/04/the-
path-not-taken/, accessed July 10, 2017.
Hibbs, D. A.: Political parties and macroeconomic policy, American Political Science Re-view, 71(04), (1977), 1467–1487.
Jones, J. M.: One in five voters say immigration stance critical to vote, Gallup, 2015, avail-
able at http://www.gallup.com/poll/185381/one-five-voters-say-immigration-stance-
critical-vote.aspx?version=print, accessed July 10, 2017.
Junn, J., Lee, T., Ramakrishnan, S. K., and Wong, J.: National Asian American Survey,
2008.
Kiviet, J. F.: On bias, inconsistency, and efficiency of various estimators in dynamic panel
data models, Journal of Econometrics, 68(1), (1995), 53–78.
Kuo, A., Malhotra, N., and Mo, C. H.: Why do Asian Americans identify as Democrats?
Testing theories of social exclusion and intergroup commonality, Journal of Politics,forthcoming.
Lopez, M. H., and Taylor, P.: Latino voters in the 2012 election, Pew Research Cen-
ter, 2012, available at http://www.pewhispanic.org/2012/11/07/latino-voters-in-the-
2012-election/, accessed July 10, 2017.
Mariani, F.: The political economy of naturalization, Canadian Journal of Economics/Revuecanadienne d’économique, 46(2), (2013), 656–688.
Mayda, A. M., Peri, G., and Steingress, W.: Immigration to the U.S.: A problem for the Re-
publicans or the Democrats?, National Bureau of Economic Research, 2016, Working
paper no. 21941.
Migration Policy Institute: Immigration facts, backlogs in immigration process-
ing persist, 2005, available at http://www.migrationpolicy.org/research/backlogs-
immigration-processing-persist, accessed July 10, 2017.
19

Nickell, S.: Biases in dynamic models with fixed effects, Econometrica, 49, (1981), 1417–
1426.
Nordhaus, W. D.: The political business cycle, Review of Economic Studies, 42(2), (1975),
169–190.
Ortega, F.: Immigration quotas and skill upgrading, Journal of Public Economics, 89(9),
(2005), 1841–1863.
Roodman, D.: A note on the theme of too many instruments, Oxford Bulletin of Economicsand Statistics, 71(1), (2009), 135–158.
Schippers, D. P., and Henry, A. P.: Sellout: The inside story of President Clinton’s impeach-ment, Regnery Publishing, 2000.
Shertzer, A.: Immigrant group size and political mobilization: Evidence from European
migration to the United States, Journal of Public Economics, 139, (2016), 1-12.
Strömberg, D.: How the Electoral College influences campaigns and policy: The proba-
bility of being Florida, American Economic Review, 98(3), (2008), 769–807.
Strozzi, C.: The changing nature of citizenship legislation, IZA World of Labor, Institute
for the Study of Labor (IZA), 2016.
Taylor, P., Gonzalez-Barrera, A., Passel, J., and Lopez, M. H.: An awakened gi-
ant: The Hispanic electorate is likely to double by 2030, Pew Research Center,
2012, available at http://www.pewhispanic.org/2012/11/14/an-awakened-giant-the-
hispanic-electorate-is-likely-to-double-by-2030/, accessed July 10, 2017.
United States Bureau of the Census: Statistical abstract of the United States, Washington,
DC.
Watkins, W.: Reclaiming the American Revolution: The Kentucky and Virginia Resolutionsand their legacy, Macmillan, 2004.
Xu, J.: Why do minorities participate less? The effects of immigration, education, and
electoral process on Asian American voter registration and turnout, Social Science Re-search, 34(4), (2005), 682–702.
20

List of Figures
1 Dynamics during term . . . . . . . . . . . . . . . . . . . . . . . . . . . . . . 222 Contested vs. safe states . . . . . . . . . . . . . . . . . . . . . . . . . . . . . 233 Region of origin . . . . . . . . . . . . . . . . . . . . . . . . . . . . . . . . . . 244 Country of origin . . . . . . . . . . . . . . . . . . . . . . . . . . . . . . . . . 25
21
FE model GMM model
-.15-.1
-.050
.05.1
.15.2
.25.3
estim
ated
coe
ffici
ent
1 2 3 4year of the term
Democratic incumbent
-.15-.1
-.050
.05.1
.15.2
.25.3
estim
ated
coe
ffici
ent
1 2 3 4year of the term
Republican incumbent
-.15-.1
-.050
.05.1
.15.2
.25.3
estim
ated
coe
ffici
ent
1 2 3 4year of the term
Democratic incumbent
-.15-.1
-.050
.05.1
.15.2
.25.3
estim
ated
coe
ffici
ent
1 2 3 4year of the term
Republican incumbent
Naturalizations (log)
FE model GMM model
-.15-.1
-.050
.05.1
.15.2
.25.3
estim
ated
coe
ffici
ent
1 2 3 4year of the term
Democratic incumbent
-.15-.1
-.050
.05.1
.15.2
.25.3
estim
ated
coe
ffici
ent
1 2 3 4year of the term
Republican incumbent
-.15-.1
-.050
.05.1
.15.2
.25.3
estim
ated
coe
ffici
ent
1 2 3 4year of the term
Democratic incumbent
-.15-.1
-.050
.05.1
.15.2
.25.3
estim
ated
coe
ffici
ent
1 2 3 4year of the term
Republican incumbent
Acceptance rate
Figure 1: Dynamics during term. FE estimates as outlined in Table 3. Dependent vari-able: (a) Naturalizations (log); (b) Acceptance rate.
22
Contested States Safe States
-.15-.1
-.050
.05.1
.15.2
.25.3
estim
ated
coe
ffici
ent
1 2 3 4year of the term
Democratic incumbent
-.15-.1
-.050
.05.1
.15.2
.25.3
estim
ated
coe
ffici
ent
1 2 3 4year of the term
Republican incumbent
-.15-.1
-.050
.05.1
.15.2
.25.3
estim
ated
coe
ffici
ent
1 2 3 4year of the term
Democratic incumbent
-.15-.1
-.050
.05.1
.15.2
.25.3
estim
ated
coe
ffici
ent
1 2 3 4year of the term
Republican incumbent
Naturalizations (log)
Contested States Safe States
-.15-.1
-.050
.05.1
.15.2
.25.3
estim
ated
coe
ffici
ent
1 2 3 4year of the term
Democratic incumbent
-.15-.1
-.050
.05.1
.15.2
.25.3
estim
ated
coe
ffici
ent
1 2 3 4year of the term
Republican incumbent
-.15-.1
-.050
.05.1
.15.2
.25.3
estim
ated
coe
ffici
ent
1 2 3 4year of the term
Democratic incumbent
-.15-.1
-.050
.05.1
.15.2
.25.3
estim
ated
coe
ffici
ent
1 2 3 4year of the term
Republican incumbent
Acceptance rate
Figure 2: Contested vs. safe states. FE estimates as outlined in Table 4. Dependentvariable: (a) Naturalizations (log); (b) Acceptance rate.
23

Latin America Asia
-.2-.1
0.1
.2.3
.4.5
.6es
timat
ed c
oeffi
cien
t
1 2 3 4year of the term
Democratic incumbent
-.2-.1
0.1
.2.3
.4.5
.6es
timat
ed c
oeffi
cien
t
1 2 3 4year of the term
Republican incumbent
-.2-.1
0.1
.2.3
.4.5
.6es
timat
ed c
oeffi
cien
t
1 2 3 4year of the term
Democratic incumbent
-.2-.1
0.1
.2.3
.4.5
.6es
timat
ed c
oeffi
cien
t
1 2 3 4year of the term
Republican incumbent
Naturalizations (log)
Figure 3: Region of origin from 1982 to 2012. FE estimates as outlined in Table 5. De-pendent variable: Naturalizations (log). Latin America includes observations for Cuba,Colombia, the Dominican Republic, El Salvador, Haiti, Jamaica, Haiti, and Mexico. Asiaincludes observations for China, India, Iran, South Korea, Laos, the Philippines, Taiwan,and Vietnam.
24
Colombia Mexico
-.6-.4
-.20
.2.4
.6es
timat
ed c
oeffi
cien
t
1 2 3 4year of the term
Democratic incumbent
-.6-.4
-.20
.2.4
.6es
timat
ed c
oeffi
cien
t
1 2 3 4year of the term
Republican incumbent
-.6-.4
-.20
.2.4
.6es
timat
ed c
oeffi
cien
t
1 2 3 4year of the term
Democratic incumbent
-.6-.4
-.20
.2.4
.6es
timat
ed c
oeffi
cien
t
1 2 3 4year of the term
Republican incumbent
Naturalizations (log)
Laos Vietnam
-.6-.4
-.20
.2.4
.6es
timat
ed c
oeffi
cien
t
1 2 3 4year of the term
Democratic incumbent
-.6-.4
-.20
.2.4
.6es
timat
ed c
oeffi
cien
t
1 2 3 4year of the term
Republican incumbent
-.6-.4
-.20
.2.4
.6es
timat
ed c
oeffi
cien
t
1 2 3 4year of the term
Democratic incumbent
-.6-.4
-.20
.2.4
.6es
timat
ed c
oeffi
cien
t
1 2 3 4year of the term
Republican incumbent
Naturalizations (log)
Figure 4: Country of origin from 1982 to 2012. FE estimates as outlined in Table 5.
25

List of Tables
1 Descriptive statistics . . . . . . . . . . . . . . . . . . . . . . . . . . . . . . . 272 Basic results . . . . . . . . . . . . . . . . . . . . . . . . . . . . . . . . . . . . 283 Dynamics during term . . . . . . . . . . . . . . . . . . . . . . . . . . . . . . 294 Contested vs. safe states . . . . . . . . . . . . . . . . . . . . . . . . . . . . . 305 Region and country of origin . . . . . . . . . . . . . . . . . . . . . . . . . . . 316 High vs. low immigration states . . . . . . . . . . . . . . . . . . . . . . . . . 327 Basic results without Nixon, Reagan, or Clinton . . . . . . . . . . . . . . . . 338 Basic dynamics without Nixon, Reagan, or Clinton . . . . . . . . . . . . . . 34
26

Table 1: Descriptive statistics
Variable Obs Mean Std. Dev. Min MaxNaturalizations 2265 7484.003 22745.51 50 378014Acceptance rate 2265 .897 .631 .025 18.037Pres. elect. year 2265 .242 .429 0 1Pres. incumb. party 2265 .411 .492 0 1Democrat in 1st year 2265 .105 .307 0 1Democrat in 2nd year 2265 .106 .307 0 1Democrat in 3rd year 2265 .105 .307 0 1Democrat in 4th year 2265 .095 .294 0 1Republican in 1st year 2265 .147 .355 0 1Republican in 2nd year 2265 .147 .354 0 1Republican in 3rd year 2265 .147 .355 0 1Republican in 4th year 2265 .147 .354 0 1First term 2265 .642 .48 0 1Stock of migrants 2265 456189.1 1113707 7250.8 1.02e+07Income 2265 23608.56 6181.516 9123.866 46391.57Population 2265 5212939 5555900 322000 3.80e+07Urbanization 2265 3974301 4981567 142889 3.54e+07Education 2265 71.495 13.602 33.05 92.3
Note: U.S. states between 1986 and 2012.
27

Table 2: Basic results
(1) (2) (3) (4) (5) (6)Dependent variable: Naturalizations (log) Acceptance ratePresidential 0.0530*** 0.0450** 0.0498** 0.0362 0.0331 0.0354*election year (3.14) (2.28) (2.36) (1.57) (1.46) (1.72)
Presidential 0.0371** 0.0625*** 0.0318** 0.105*** 0.100*** 0.100***incumbent party (2.44) (4.68) (2.13) (4.80) (3.65) (3.23)
First term -0.0353** -0.0581***-0.0325***-0.158***-0.146***-0.148***(-2.26) (-4.68) (-3.00) (-7.23) (-6.16) (-4.28)
Population (log) 0.173*** 0.690*** 0.321*** 0.197*** 0.669*** 0.181*(10.35) (8.97) (3.68) (8.97) (5.97) (1.78)
Income (log) 0.720*** 0.831*** 0.920*** 0.666*** 0.631** 0.672(10.25) (7.18) (4.28) (7.01) (2.57) (1.55)
Education (log) -0.130* 0.0520 -0.171 0.175 0.114 0.148(-1.77) (0.48) (-0.98) (1.58) (1.01) (0.75)
Eligible immigrants (log) 0.228*** 0.153*** 0.0793(15.26) (5.52) (1.49)
Petitions filed total (log) -0.164***0.0302 -0.180**(-6.75) (0.24) (-1.97)
Petitions filed per state (log) -0.155***-0.424***-0.138*(-9.59) (-6.81) (-1.88)
Method OLS FE GMM OLS FE GMMAB test, 1st - - 0.000 - - 0.058AB test, 2nd - - 0.050 - - 0.425AB test, 3rd - - 0.347 - - 0.207Hansen test - - 0.257 - - 0.169No. of instruments - - 47 - - 48Observations 2179 2179 2179 2179 2179 2179
Note: FE: Fixed effects model including a constant term and a set of state-year character-istics. GMM: GMM model (one-step systems GMM model based on Blundell and Bond1998). Robust standard errors clustered by state. t-statistics reported in parentheses andp-values for the AB and Hansen test. Significance levels: ??? 1%; ?? 5%; ? 10%.
28

Table 3: Dynamics during term
(1) (2) (3) (4) (5) (6)Dependent variable: Naturalizations (log) Acceptance rateDemocrat in 1st year 0.0748** 0.0983*** 0.0535* 0.0354 0.0602** 0.00543
(2.28) (4.06) (1.69) (0.76) (2.26) (0.13)
Democrat in 2nd year 0.0569** 0.0822*** 0.0423 0.133*** 0.128*** 0.106**(1.97) (3.83) (1.61) (3.25) (3.12) (2.41)
Democrat in 3rd year 0.0803*** 0.103*** 0.0706*** 0.148*** 0.142*** 0.125***(2.78) (4.66) (3.15) (3.61) (3.38) (3.19)
Democrat in 4th year 0.0579* 0.0853** 0.0453 0.155*** 0.147*** 0.139***(1.94) (2.27) (1.05) (3.73) (3.85) (3.38)
Republican in 2nd year 0.0768*** 0.0771*** 0.0772*** 0.0220 0.0306 0.0127(2.91) (3.34) (2.91) (0.60) (1.15) (0.40)
Republican in 3rd year -0.0557** -0.0458** -0.0611***0.00993 0.0115 0.00279(-2.11) (-2.59) (-3.31) (0.27) (0.49) (0.12)
Republican in 4th year 0.103*** 0.0908*** 0.0998*** 0.0431 0.0480* 0.0354(3.89) (3.84) (3.53) (1.18) (1.75) (1.16)
First term -0.0393** -0.0618***-0.0343*** -0.152*** -0.143*** -0.143***(-2.50) (-4.99) (-3.26) (-6.86) (-6.30) (-4.17)
Population (log) 0.170*** 0.685*** 0.251*** 0.196*** 0.666*** 0.0992(10.24) (8.97) (2.71) (8.94) (5.95) (0.67)
Income (log) 0.704*** 0.808*** 0.747*** 0.662*** 0.631** 0.477(10.08) (7.07) (3.44) (6.96) (2.53) (0.86)
Education (log) -0.126* 0.0602 -0.129 0.186* 0.130 0.165(-1.72) (0.57) (-0.89) (1.68) (1.13) (0.83)
Eligible immigrants (log) 0.225*** 0.151*** 0.0882(15.15) (5.53) (1.59)
Petitions filed total (log) -0.163*** 0.0244 -0.181**(-6.71) (0.20) (-2.02)
Petitions filed per state (log) -0.154*** -0.420***-0.0675Method OLS FE GMM OLS FE GMMAB test, 1st - - 0.000 - - 0.068AB test, 2nd - - 0.043 - - 0.424AB test, 3rd - - 0.359 - - 0.180Hansen test - - 0.231 - - 0.082No. of instruments - - 48 - - 49Observations 2179 2179 2179 2179 2179 2179
Note: FE: Fixed effects model including a constant term and a set of state-year characteristics.GMM: GMM model (one-step systems GMM model based on Blundell and Bond 1998). Ro-bust standard errors clustered by state. t-statistics reported in parentheses and p-values forthe AB and Hansen test. Significance levels: ??? 1%; ?? 5%; ? 10%.
29

Table 4: Contested vs. safe states
(1) (2) (3) (4)Dependent variable: Naturalizations (log) Acceptance rate
Contested state Safe state Contested state Safe stateDemocrat in 1st year 0.123*** 0.0960** 0.0951** 0.0201
(4.22) (2.06) (2.64) (0.36)
Democrat in 2nd year 0.0952*** 0.0793* 0.0770** 0.148**(3.02) (1.94) (2.25) (2.27)
Democrat in 3rd year 0.147*** 0.0622 0.103*** 0.157**(3.86) (1.62) (3.17) (2.37)
Democrat in 4th year 0.157*** 0.00128 0.182*** 0.0678(3.34) (0.02) (4.37) (1.16)
Republican in 2nd year 0.128*** 0.0231 0.0634* -0.0287(3.51) (0.79) (1.96) (-0.64)
Republican in 3rd year 0.000551 -0.0882*** 0.0133 -0.0143(0.02) (-3.33) (0.52) (-0.34)
Republican in 4th year 0.0736** 0.103*** 0.0409 0.0737*(2.21) (3.15) (1.15) (1.73)
First term -0.0550** -0.0483** -0.123*** -0.128***(-2.56) (-2.59) (-4.57) (-4.18)
Eligible immigrants (log) 0.170*** 0.131***(4.15) (3.60)
Petitions filed total (log) -0.0651 0.102(-0.91) (0.63)
Petitions filed per state (log) -0.493*** -0.334***(-7.30) (-4.73)
Observations 1096 1083 1096 1083
Note: FE: Fixed effects model including a constant term. Further time-varying control vari-ables included as in Table 2. Robust standard errors clustered by state. t-statistics reportedin parentheses. Significance levels: ??? 1%; ?? 5%; ? 10%.
30

Table 5: Region and country of origin
(1) (2) (3) (4) (5) (6)Lat. Am. Asia Colombia Mexico Vietnam Laos
Democrat in 1st year 0.0987* 0.0526 0.0870 0.186*** -0.314** -0.0160(2.00) (1.34) (1.65) (4.16) (-2.63) (-0.29)
Democrat in 2nd year 0.121*** 0.0645 0.121** 0.136** -0.156* -0.0906**(2.74) (1.62) (2.18) (2.06) (-1.69) (-2.03)
Democrat in 3rd year 0.285*** 0.0610 0.264*** 0.384*** -0.220 -0.0672(5.09) (1.55) (5.13) (7.36) (-1.48) (-1.18)
Democrat in 4th year 0.137* 0.0514 0.215*** 0.227*** -0.0205 -0.00680(1.83) (0.73) (3.34) (3.12) (-0.16) (-0.08)
Republican in 2nd year 0.000725 0.0803* 0.142** 0.0594 -0.112 0.0486(0.01) (1.82) (2.28) (1.15) (-1.17) (1.03)
Republican in 3rd year -0.114*** -0.0236 0.00766 -0.101** -0.0995 -0.0882*(-2.72) (-0.65) (0.16) (-2.23) (-1.24) (-1.96)
Republican in 4th year 0.144*** 0.167*** 0.233*** 0.169*** 0.214*** 0.0499(4.09) (4.48) (4.04) (4.60) (2.76) (1.15)
First term -0.154*** -0.0922*** -0.0361 -0.276*** -0.138*** -0.179***(-4.86) (-3.86) (-1.38) (-6.56) (-2.88) (-5.76)
Eligible immigrants (log) 0.240*** -0.0442 0.0222 0.271*** 0.125 0.259***(3.45) (-0.59) (0.27) (3.11) (1.56) (2.94)
Observations 1229 1229 1139 1205 550 1162
Note: FE: Fixed effects model including a constant term. Further time-varying control variablesincluded as in Table 2. Robust standard errors clustered by state. t-statistics reported in paren-theses. Significance levels: ??? 1%; ?? 5%; ? 10%.
31

Table 6: High vs. low immigration states
(1) (2) (3) (4)Dependent variable: Naturalizations (log) Acceptance rate
High immi- Low immi- High immi- Low immi-gration states gration states gration states gration states
Democrat in 1st year 0.0984* 0.142*** 0.176*** 0.0614(1.73) (2.83) (2.96) (0.93)
Democrat in 2nd year 0.0984** 0.0157 0.120*** 0.000812(2.45) (0.40) (3.18) (0.03)
Democrat in 3rd year 0.201*** 0.0112 0.190*** -0.00946(5.60) (0.29) (4.47) (-0.40)
Democrat in 4th year 0.119 0.0439 0.236*** 0.0365(1.62) (0.98) (3.71) (0.99)
Republican in 2nd year 0.0998** 0.0503* 0.0782* 0.0141(2.23) (1.95) (1.84) (0.57)
Republican in 3rd year -0.0361 -0.0602 0.0144 0.0158(-1.17) (-1.48) (0.45) (0.26)
Republican in 4th year 0.142*** 0.0198 0.187*** -0.0832***(3.44) (0.64) (4.35) (-3.17)
First term -0.0502* -0.0851*** -0.148*** -0.0414**(-1.84) (-4.68) (-4.81) (-2.23)
Eligible immigrants (log) 0.126** 0.219***(2.08) (2.92)
Petitions filed total (log) -0.0911 -0.0422(-1.26) (-0.60)
Petitions filed per state (log) -0.552*** -0.374***(-7.36) (-3.66)
Observations 762 758 762 758
Note: FE: Fixed effects model including a constant term. Further time-varying control variablesincluded as in Table 2. Robust standard errors clustered by state. t-statistics reported in paren-theses. Significance levels: ??? 1%; ?? 5%; ? 10%.
32

Table 7: Basic results without Nixon, Reagan, or Clinton
(1) (2) (3) (4) (5) (6)Dependent variable: Naturalizations (log) Acceptance rate
w/o Nixon w/o Reagan w/o Clinton w/o Nixon w/o Reagan w/o ClintonPresidential 0.0423** 0.0452** 0.0585*** 0.0304 0.0548** 0.00842election year (2.10) (2.18) (3.54) (1.31) (2.15) (0.49)
Presidential 0.0602*** 0.0621*** 0.0989*** 0.0989*** 0.0861*** 0.0710***incumb. party (4.33) (5.18) (8.29) (3.43) (3.85) (5.95)
First term -0.0592*** -0.0787*** -0.114*** -0.150*** -0.199*** -0.125***(-4.59) (-5.33) (-9.14) (-6.58) (-6.65) (-7.28)
Eligible immi- 0.149*** 0.168*** 0.188***grants (log) (5.26) (6.22) (6.14)
Petitions filed 0.0330 0.0110 -0.0721total (log) (0.25) (0.08) (-1.29)
Petitions filed -0.435*** -0.420*** -0.405***per state (log) (-6.72) (-6.89) (-6.96)
Observations 2087 1801 1849 2087 1801 1849
Note: The specification without Nixon excludes his second term (1973 and 1974), the specification withoutReagan 1981 to 1988 and the specification without Clinton 1993 to 2000. Fixed effects model including a con-stant term. Further time-varying control variables included as in Table 2. Robust standard errors clustered bystate. t-statistics reported in parentheses. Significance levels: ??? 1%; ?? 5%; ? 10%.
33

Table 8: Basic dynamics without Nixon, Reagan, or Clinton
(1) (2) (3) (4) (5) (6)Dependent variable: Naturalizations (log) Acceptance rate
w/o Nixon w/o Reagan w/o Clinton w/o Nixon w/o Reagan w/o ClintonDemocrat 0.0965*** 0.138*** 0.158*** 0.0573** 0.101*** 0.115***in 1st year (3.85) (5.04) (5.16) (2.11) (3.34) (3.29)
Democrat 0.0788*** 0.115*** 0.127*** 0.122** 0.159*** 0.0960***in 2nd year (3.30) (5.35) (5.28) (2.61) (3.42) (3.81)
Democrat 0.0998*** 0.136*** 0.124*** 0.136*** 0.172*** 0.0844***in 3rd year (4.39) (6.12) (6.86) (2.93) (3.89) (4.82)
Democrat 0.0825** 0.115*** 0.138*** 0.140*** 0.172*** 0.0737***in 4th year (2.11) (3.00) (6.01) (3.54) (4.23) (3.60)
Republican 0.0889*** 0.0977*** 0.0839*** 0.0273 0.0510* 0.0350in 2nd year (3.38) (3.46) (3.62) (0.98) (1.75) (1.68)
Republican -0.0489*** 0.0230 -0.0390** 0.00490 0.0816*** 0.00345in 3rd year (-2.70) (1.03) (-2.22) (0.22) (2.74) (0.14)
Republican 0.0869*** 0.138*** 0.0969*** 0.0412 0.127*** 0.0344in 4th year (3.47) (5.49) (4.13) (1.38) (3.15) (1.56)
First term -0.0594*** -0.0882*** -0.120*** -0.145*** -0.204*** -0.130***(-4.61) (-6.02) (-9.42) (-6.52) (-6.80) (-7.64)
Eligible immi- 0.148*** 0.169*** 0.187***grants (log) (5.28) (6.26) (6.08)
Petitions filed 0.0281 -0.00215 -0.0708total (log) (0.22) (-0.02) (-1.26)
Petitions filed -0.431*** -0.418*** -0.410***per state (log) (-6.70) (-6.94) (-6.95)
Observations 2087 1801 1849 2087 1801 1849
Note: The specification without Nixon excludes his second term (1973 and 1974), the specification withoutReagan 1981 to 1988 and the specification without Clinton 1993 to 2000. Fixed effects model including a con-stant term. Further time-varying control variables included as in Table 2. Robust standard errors clustered bystate. t-statistics reported in parentheses. Significance levels: ??? 1%; ?? 5%; ? 10%.
34

ifo Working Papers No. 238 Sen, S. and M.-T. von Schickfus, Will Assets be Stranded or Bailed Out? Expectations of
Investors in the Face of Climate Policy, August 2017.
No. 237 Giesing, Y. and A. Music, Household behaviour in times of political change: Evidence from Egypt, July 2017.
No. 236 Hayo, B. and F. Neumeier, Explaining Central Bank Trust in an Inflation Targeting
Country: The Case of the Reserve Bank of New Zealand, June 2017. No. 235 Buettner, T. und M. Krause, Föderalismus im Wunderland: Zur Steuerautonomie bei
der Grunderwerbsteuer, März 2017. No. 234 Blesse, S. und F. Rösel, Gebietsreformen: Hoffnungen, Risiken und Alternativen,
Januar 2017.
No. 233 Hayo, B. and F. Neumeier, The (In)Validity of the Ricardian Equivalence Theorem –
Findings from a Representative German Population Survey, December 2016.
No. 232 Fritzsche, C. and L. Vandrei, The German Real Estate Transfer Tax: Evidence for Single-Family Home Transactions, November 2016.
No. 231 Nagl, W. and M. Weber, Stuck in a trap? Long-term unemployment under two-tier
unemployment compensation schemes, November 2016. No. 230 Neumeier, F., Do Businessmen Make Good Governors?, November 2016.
No. 229 Gutmann, J., M. Neuenkirch and F. Neumeier, Precision-Guided or Blunt? The Effects of US Economic Sanctions on Human Rights, November 2016.
No. 228 Felbermayr, G., R. Aichele, I. Heiland, A. Melchior and M. Steininger, TTIP – Potential
Effects on Norway, (November 2016) revised version December 2016.

No. 227 Schueler, R., Educational inputs and economic development in end-of-nineteenth-century Prussia, October 2016.
No. 226 Riem, M., Does political uncertainty influence firm owners‘ business perceptions?, October 2016.
No. 225 Enzi, B. and B. Siegler, The Impact of the Bologna Reform on Student Outcomes –
Evidence from Exogenous Variation in Regional Supply of Bachelor Programs in Germany, October 2016.
No. 224 Roesel, F., Do mergers of large local governments reduce expenditures? – Evidence from Germany using the synthetic control method, October 2016.
No. 223 Schueler, R., Centralized Monitoring, Resistance, and Reform Outcomes: Evidence from
School Inspections in Prussia, October 2016. No. 222 Battisti, M., R. Michaels and C. Park, Labor supply within the firm, October 2016.
No. 221 Riem, M., Corporate investment decisions under political uncertainty, October 2016. No. 220 Aichele, R., I. Heiland and G. Felbermayr, TTIP and intra-European trade: boon or
bane?, September 2016. No. 219 Aichele, R., G. Felbermayr and I. Heiland, Going Deep: The Trade and Welfare Effects of
TTIP Revised, July 2016.
No. 218 Fischer, M., B. Kauder, N. Potrafke and H.W. Ursprung, Support for free-market policies
and reforms: Does the field of study influence students’ political attitudes?, July 2016.
No. 217 Battisti, M., G. Felbermayr and S. Lehwald, Inequality in Germany: Myths, Facts, and Policy Implications, June 2016.
No. 216 Baumgarten, D., G. Felbermayr and S. Lehwald, Dissecting between-plant and within-
plant wage dispersion – Evidence from Germany, April 2016. No. 215 Felbermayr, G., Economic Analysis of TTIP, April 2016.