ELECTORAL ACCOUNTABILITY IN A FEDERAL … · ELECTORAL ACCOUNTABILITY IN A FEDERAL SYSTEM: NATIONAL...
24
ELECTORAL ACCOUNTABILITY IN A FEDERAL SYSTEM: NATIONAL AND PROVINCIAL ECONOMIC VOTING IN CANADA François Gélineau Department of Political Science Université de Montréal Éric Bélanger Department of Political Science Université de Montréal Paper prepared for delivery at the annual meeting of the Canadian Political Science Association Winnipeg, June 3-5, 2004
Transcript of ELECTORAL ACCOUNTABILITY IN A FEDERAL … · ELECTORAL ACCOUNTABILITY IN A FEDERAL SYSTEM: NATIONAL...

ELECTORAL ACCOUNTABILITY IN A FEDERAL SYSTEM:
NATIONAL AND PROVINCIAL ECONOMIC VOTING IN CANADA
François Gélineau Department of Political Science
Université de Montréal
Éric Bélanger Department of Political Science
Université de Montréal
Paper prepared for delivery at the annual meeting of the Canadian Political Science Association Winnipeg, June 3-5, 2004
ELECTORAL ACCOUNTABILITY IN A FEDERAL SYSTEM:
NATIONAL AND PROVINCIAL ECONOMIC VOTING IN CANADA
SUMMARY
This paper explores the effect of macroeconomic conditions on aggregate-level
incumbent vote in Canadian federal and provincial elections during the 1953-2001 period. As
such, it investigates the extent to which federal and provincial incumbents in Canada are held
accountable for the state of the economy. Our pooled cross-sectional time-series analysis
reveals that federal incumbents would not gain much votes by claiming credit for the economic
prosperity of any particular province when, on average, national economic conditions are
deteriorating. The results further suggest that provincial incumbents are not held accountable
for economic conditions in their province, but are rather punished for national economic
deterioration when the incumbent federal government is of the same partisan family.

ELECTORAL ACCOUNTABILITY IN A FEDERAL SYSTEM:
NATIONAL AND PROVINCIAL ECONOMIC VOTING IN CANADA
While the extant political economy literature has consistently demonstrated that
presidents and prime ministers are blamed and rewarded for national economic conditions,
empirical work on subnational economic voting remains divided. Whereas some scholars
suggest that subnational electoral outcomes reflect swings in the national economy and/or the
popularity of the central government, others contend that voters take subnational-level
economic performance into account when casting their ballots for subnational offices.
Along the same line, it is not clear whether it is the national or the provincial economy
that matters in the Canadian federal context. While some aggregate-level studies link federal
election results to national macroeconomic conditions, others present evidence of federal
economic voting using provincial economic measures. What is more, nearly no study so far
has attempted to determine the extent to which economic conditions might affect provincial
election outcomes in Canada.
The purpose of this paper is to address these issues by testing and comparing models of
economic voting for Canadian federal and provincial elections in the period 1953-2001. The
current analysis uses aggregate-level electoral outcomes and macroeconomic data to estimate
the effect of macroeconomic conditions on the federal and provincial incumbent vote. Our
analysis thus offers a systematic test to help determine whether Canadian incumbents at the
two levels are affected mostly by national or provincial economic conditions.
Whether the electoral success of provincial and federal politicians is affected by
economic conditions offers us insight into general patterns of electoral accountability.
Whether it is affected by provincial or national economic conditions is central to our

2
understanding of accountability schemes in federal systems. In such political regimes, the
distribution of economic resources is often at the center of disputes among the subnational
units and between the different levels of government. While each subnational unit wants to
increase its share of the pie, the central government is often resilient to let go its spending
power. Drawing upon the theory of economic voting, one would believe that with more
spending power, each level of government can improve its policy delivery and hence, create
more favorable economic conditions that increase its chances of getting re-elected. Whether
this is the case or not remains open to debate.
Theoretical Framework
Are federal incumbents punished for national and/or provincial economic
performance? And, are provincial incumbents held accountable for the state of the provincial
and/or national economy? To address these questions, we develop a model of economic voting
that draws upon the expectations of the extant literature.
The theoretical basis for the model is straightforward. In Canada, as in other countries,
inflation, unemployment and disposable income are believed to play a central role in shaping
the electoral performance of incumbents. Because inflation has a direct effect on the
purchasing power of individuals, it is expected to have a negative impact on the vote. Hence,
the incumbent party should be hurt by higher levels of inflation. Because voters feel
threatened by the possibility of being unemployed and thus losing their source of income,
higher rates of unemployment should also be hurtful to the incumbent party. Likewise, it is
also expected that as disposable income increases, the incumbent government is rewarded by
the electorate.

3
Prior work on aggregate vote functions for Canada has broadly confirmed the effect of
these macroeconomic factors on incumbency vote in federal elections (see Bélanger and
Gélineau 2004; Carmichael 1990; Happy 1986; 1989; 1992; Nadeau and Blais 1993; 1995).
However, a central question is left unanswered by those studies and has to do with the target
of economic voting. It is not clear whether federal electoral outcomes are a function of
national rather than provincial economic performance. Carmichael (1990), Nadeau and Blais
(1993; 1995) as well as Bélanger and Gélineau (2004) only introduce measures of the national
economy in their vote functions, while Happy (1986; 1989; 1992) uses indicators of the
provincial economy in his models. Yet, none of these studies compares the relative impact of
national and provincial economic conditions on the federal vote, thus leaving this issue
entirely unresolved.
Entangling this issue is crucial because attribution of responsibility for national and
provincial economic performance is an important factor that might affect the basic relationship
between the economy and the vote in federal regimes. The division of powers in the Canadian
federal system is such that the federal government is responsible for questions of national
prosperity whereas provincial governments are responsible for local economic issues (Mallory
1971; Black 1975; Smiley 1987). In theory, the federal government should be held
accountable for national economic performance, but not necessarily for provincial economic
conditions. Nonetheless, many federal policy programs, while striving for national economic
prosperity, focus on specific regions or provinces as they aim at reducing disparities in
regional economies (Sitwell and Seifried 1984; Savoie 1992). For this reason, and as Cutler
(2002) recently argued, the local impact of federal economic policies may also have a
substantial effect on federal voting behavior.

4
A second, and related, question that is left unanswered in the literature is the extent to
which the Canadian electorate holds provincial incumbents accountable for macroeconomic
conditions. The sole study of provincial economic voting in Canada is by Crête and Simard
(1984). Analyzing Quebec provincial electoral outcomes between 1931 and 1981, they
concluded that incumbent support was significantly affected by provincial real disposable
income. Their results also suggested that the economic situation has a stronger effect on
provincial than on federal election outcomes in Quebec, despite the fact that the federal
government is the prime manager of the economy.
Most of the extant literature on the economic determinants of subnational electoral
outcomes has studied the U.S. case and has been marked by a certain level of confusion. Some
scholars suggest that state electoral outcomes reflect swings in the national economy and/or
presidential popularity (Peltzman 1987; Holbrook-Provow 1987; Piereson 1975; Chubb 1988;
Simon, Ostrom, and Marra 1991). For example, Holbrook-Provow (1987: p. 481) finds that
“despite the fact that American governors are not national policymakers, gubernatorial
elections are not insulated from the national political and economic climate.” Accordingly,
“when the sitting president is unpopular, or when the economy is in a slump, the incumbent
party will suffer great losses of power in the American states” (p. 481). Others contend that
voters take state-level economic performance into account when casting their ballots for
subnational officials (Atkeson and Partin 1995; Partin 1995; Lowry, Alt, and Ferree 1998).
Lowry et al. (1998: p. 771) find that voters “expect governors to carry out Democratic and
Republican budgets as appropriate, and they penalize the governor’s party in the legislature if
the budget is mismanaged.”

5
The model we propose in this paper assesses the relative impact of national and
provincial economic conditions on federal and provincial election outcomes in an attempt to
shed light on those issues. Because of the federal division of powers, we expect federal
incumbency voting in a province to be more affected by the general state of the national
economy than by the particular economic circumstances within that province. For the same
theoretical reason, we expect incumbent voting in provincial elections to be affected by the
province’s economic situation. And, based on the referendum voting argument, we also expect
provincial election outcomes to be affected by national economic conditions when the party
seeking re-election at the provincial level is of the same family as the party in office at the
federal level.
Data and Methodology
Our data analysis is based on a pooled cross-sectional time-series design. The analysis
is performed using two separate datasets. The first includes all 16 Canadian federal elections
held between 1953 and 2000. The dependent variable is the percentage of the vote received by
the incumbent party in each province for each federal election (N=160). The second dataset
includes all 132 provincial elections held in Canada between 1953 and 2001. The dependent
variable in this dataset is the percentage of the vote received by the incumbent party in each
provincial election (N=132). This research design approximates the models used by the classic
aggregate-level economic voting literature at the federal level in Canada. The use of a pooled
cross-sectional time-series design has two advantages. From a statistical standpoint, it allows
for more degrees of freedom in the model estimation. In addition, it allows us to evaluate the
extent to which the provincial economic performance has an effect on the federal incumbent

6
vote in each province. Federal election data were obtained from Elections Canada, whereas
provincial election data were compiled from Feigert (1989), the Canadian Parliamentary
Guide, and the Reports of the Chief Electoral Officer from each province.
The independent variables are aggregate measures of inter-election economic
performance at the national and provincial levels. As in previous studies, we look at the three
most conventional economic indicators: unemployment (seasonally adjusted percentage),
annual percentage change in the consumer price index, and annual percentage change in real
personal disposable income per capita. Since quarterly or monthly time-series national data for
these three indicators are available on a systematic basis only for the post-1960s period, we
decided to rely on annual data. In doing so, we can extend our analysis as far back as the early
1950s. Each macroeconomic indicator was weighted for the month in which the specific
federal or provincial election occurred.1 The time horizon is the year prior to the election. All
economic data were obtained from Statistics Canada.
The statistical analysis relies upon ordinary least squares (OLS) regressions with
robust standard errors, using the Huber-White sandwich estimator of variance to address
potential problems of heteroskedasticity. Because of the cross-sectional nature of the dataset,
residuals cannot be assumed to be independent across provinces. For this reason, a cluster
specification of the error term identifying the province to which each observation belongs is
introduced in each estimation. Note that separate analyses for federal and provincial elections
are performed, so that the determinants of electoral outcomes can easily be compared between
the two levels of government.
1 The weighted indicators were calculated on the basis of the following formula: ρ = [ρ(t-1) * (12-σ(t))/12] + [ρ(t) * (σ (t)/12)], whereas “ρ” is the annual economic indicator, “σ” the month of the election, and “t” the election year. For example, if an election was held in March of 1997, we would multiply the 1996 annual indicator by 9/12 and add it to the 1997 annual indicator multiplied by 3/12.

7
In addition to the macroeconomic indicators, all our federal and provincial vote models
include two control variables. First, a lag of the dependent variable is included on the right-
hand side of the equations as a proxy for party identification and as a control for aggregate
vote stability between elections. Second, a variable is introduced to control for the length of
mandate. The variable is the logarithmic transformation of the actual number of months the
incumbent party spent in government since the last election. It is expected that the coefficient
associated with this variable be negative, as shorter governments usually perform better during
subsequent elections. Short-lived governments are usually minority governments.2 The
electorate may thus be risk-averse and use the subsequent election as a means to grant
majority to a minority government (Strom 1990; Powell and Whitten 1993; Whitten and
Palmer 1999). The logarithmic transformation of the variable introduces the assumption that
the marginal effect of time diminishes as mandates grow longer.
Two additional controls are included in the federal vote models. First, we introduce
variables that control for the presence of strong regional parties in recent federal elections. Not
only do these parties reduce the incumbent party’s vote share by their mere presence on the
ballot, but they also tend to inhibit the expression of an economic vote by appealing to voters
on the basis of non-economic issues or grievances (Godbout and Bélanger 2002).
Consequently, a dummy variable for the Reform Party/Canadian Alliance is included in the
four Western provinces for the 1993, 1997 and 2000 elections. Another dummy variable is
introduced to control for the strong performance of the Bloc Québécois in Quebec during the
1993 election (the two following elections are not considered because the incumbent Liberals
2 During the period under study, 6 federal elections out of 16 produced minority governments. On average, these governments lasted 18 months (minimum 9, maximum 31) whereas majority governments lasted 51 months (minimum 41, maximum 59). In the provincial elections sample, 10 elections out of 132 produced minority governments (lasting 25 months on average, compared to 45 months on average for majority governments).

8
were as electorally strong in Quebec as the Bloc Québécois). Finally, the second control
variable identifies federal governments formed by the Liberal party. It is included to control
for the fact that federal Liberals, on average, perform better at the polls than Conservatives,
the only other party to have formed governments at the federal level during the period under
study.
Results
Our analysis is performed in two stages. We begin by estimating the effect of the
economy on electoral outcomes at the federal level. We then move on to analyzing the nature
and extent of economic voting in provincial elections. Completing our analysis in this fashion
allows us to assess the impact of national and/or provincial economic conditions on the vote
by comparing elections at the two levels of government.
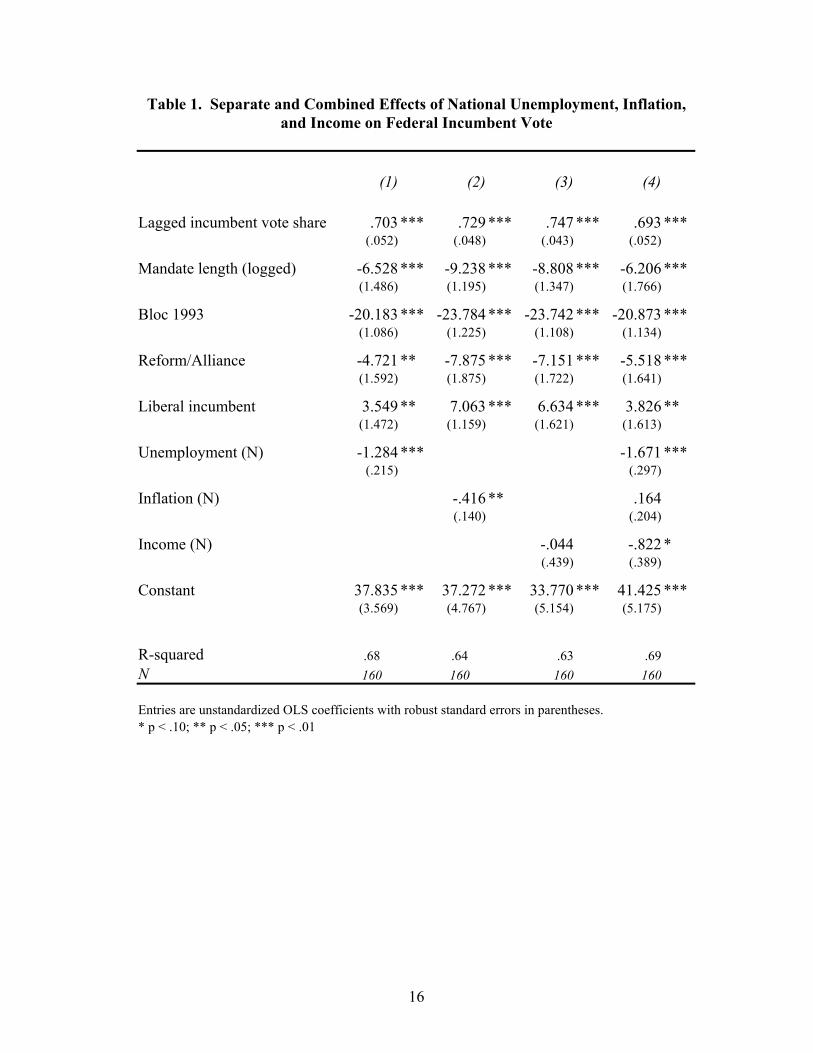
Table 1 presents the results from a basic model of economic voting in Canadian federal
elections. The first three columns introduce each national macroeconomic indicator
individually to assess the separate effect of unemployment, inflation, and real disposable
income on the vote. The fourth model incorporates the three indicators simultaneously.
[TABLE 1 ABOUT HERE]
As illustrated by Table 1 (columns 1 thru 3), unemployment and inflation have a
statistically significant and separate effect on incumbency vote at the federal level for the
period 1953-2000, but not real disposable income. Like in Nadeau and Blais’s (1993; 1995)
prior work, we find that a one point increase in the national unemployment rate translates into
a loss of nearly two points in the federal incumbent’s share of the vote (columns 1 and 4). The
impact of national inflation appears substantial as well, with a one percentage point increase in

9
inflation resulting in a little less than half a point loss in incumbent support in federal elections
(column 2). The effect of inflation, however, is no longer significant when the variable is
included along with unemployment and income growth in the same equation (column 4).
Curiously, national disposable income appears to have a significant negative effect when
entered with unemployment and inflation (column 4). This finding is counterintuitive, but not
surprising given that unemployment and income are closely correlated (Pearson’s R = -.54).
This phenomenon is probably a product of Okun’s law which states that increases in
unemployment always induce losses of income growth (see Hibbs 1987). Thus, this
preliminary model of federal economic voting indicates that, in general, unemployment and, to
a lesser extent, inflation seem to matter to federal election outcomes in Canada.
In order to verify whether provincial economic performance has any effect on the
federal vote, we compare the effect of the national measures of the economy with that of
provincial measures. Table 2 first shows that macroeconomic indicators measured at the
provincial level are as much correlated to the federal vote as national measures, except for
provincial unemployment (Pearson’s R of -.09 compared to -.47 for national unemployment).
The correlation statistics also indicate that national and provincial measures of unemployment
and of real disposable income are moderatly correlated with one another (Pearson’s R of .66
and .64 respectively), suggesting that provincial economic performance may possibly have an
independent effect on federal incumbent voting.
[TABLE 2 ABOUT HERE]
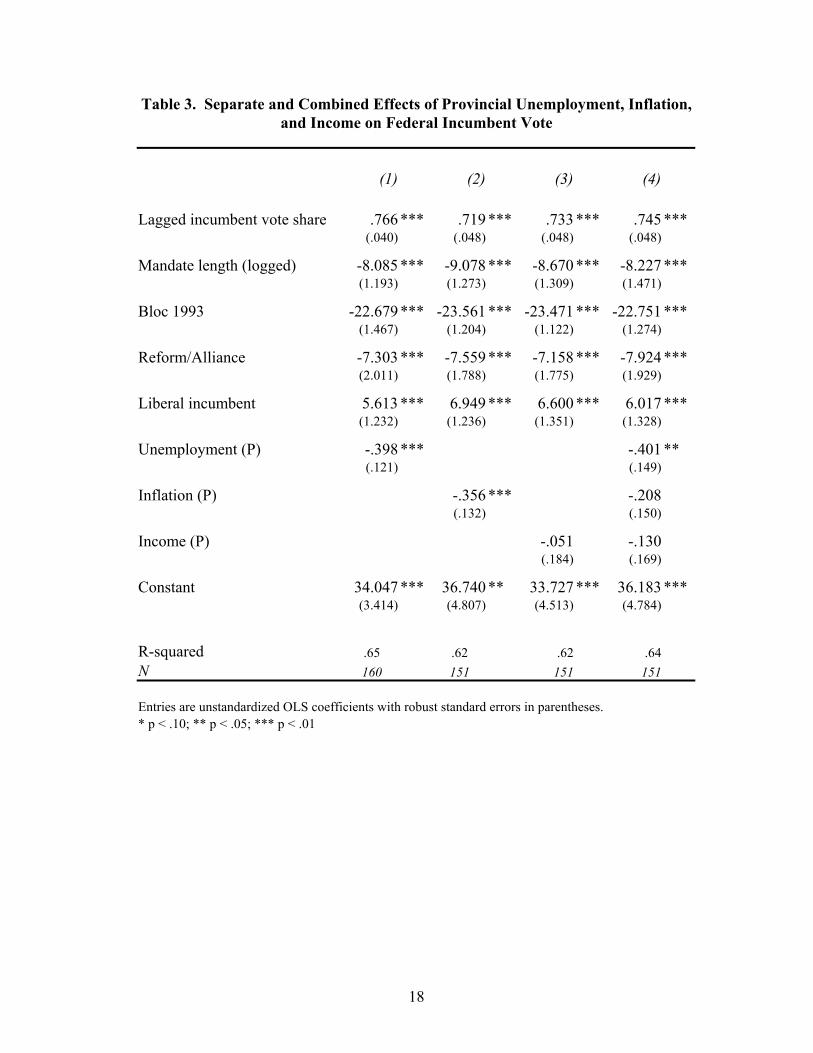
Table 3 presents new estimations of our basic federal vote model (presented in Table
1), in which we substitute national economic indicators for provincial ones. Interestingly, the
results presented in Table 3 are virtually identical to those presented in Table 1, with the

10
exception that the magnitude of the coefficients is smaller in the provincial economy models.
As expected, provincial unemployment and inflation both have a significant impact on the
vote share of the federal incumbent. But, as with national economic measures, unemployment
seems to exert the single most influence on the vote (column 4, Table 3). Note that the total
sample size drops to 151 in columns 2 thru 4 of Table 3 because inflation and real disposable
income data were not available for Prince Edward Island for the period 1953-1974.
[TABLE 3 ABOUT HERE]
Further indication that national economics seem to matter more to federal election
outcomes than provincial economic conditions comes from Table 4. Results presented in this
model suggest that when including both provincial and national unemployment into the same
equation, the significant effect of provincial unemployment found in Table 3 disappears.3
What is more, the inclusion of both provincial and national unemployment measures in the
equation does not substantially affect the significant impact of the national unemployment rate
on federal incumbency voting (compared to results found in Table 1), thus leading us to
believe that national economic performance has a stronger effect on the federal vote than
provincial performance.
[TABLE 4 ABOUT HERE]
In order to explore the effect of economic conditions on the electoral success of
provincial incumbents, we adopt the same strategy as in Table 1, whereas we introduce each
provincial macroeconomic indicator individually to assess the separate effect of
unemployment, inflation, and real disposable income on the vote. The fourth model
3 Provincial inflation is not included in the model because it correlates too highly with the national inflation rate (see Table 2). Real disposable income at the provincial level is not included because it is not found to have any significant effect on the federal vote (see Table 3).

11
incorporates the three indicators simultaneously. The results shown in Table 5 suggest that
provincial economics have no statistically significant effect on the vote for provincial
incumbents. Note that six elections are lost from the sample in colums 2 thru 4, due again to
the unavailability of some macroeconomic measures for PEI.
[TABLE 5 ABOUT HERE]
To assess the possibility that voters refer to the national economy when evaluating
their provincial incumbent, we replace the provincial economic data by the national-level
measures used in Table 1. Interestingly, Table 6 suggests that both national unemployment
and national income have a significant effect on provincial incumbent vote. Both variables
affect provincial election outcomes in the expected direction. Also interesting is the fact that
the two indicators appear significant when included separately in the analysis, but not when
introduced jointly, which appears to confirm the existence of an inverse relationship between
unemployment and income levels, as was already observed in Table 1.
[TABLE 6 ABOUT HERE]
The remaining question, then, is whether these surprising provincial findings reflect a
real pattern of referendum voting or simply result from a spurious relationship in the data. In
other words, are provincial incumbents really evaluated on the basis of the national economic
performance? In order to test this possibility, we split the sample into those provincial
incumbents who are of the same partisan family as the incumbent federal government
(hereafter identified as “in-party” incumbents) and provincial incumbents from opposition
parties at the federal level. If provincial voting patterns reflect a referendum on the federal
incumbent, we should find that national economic deterioration is associated with a loss of
votes in in-party provinces, and with a gain of votes in provinces controlled by the opposition.
12
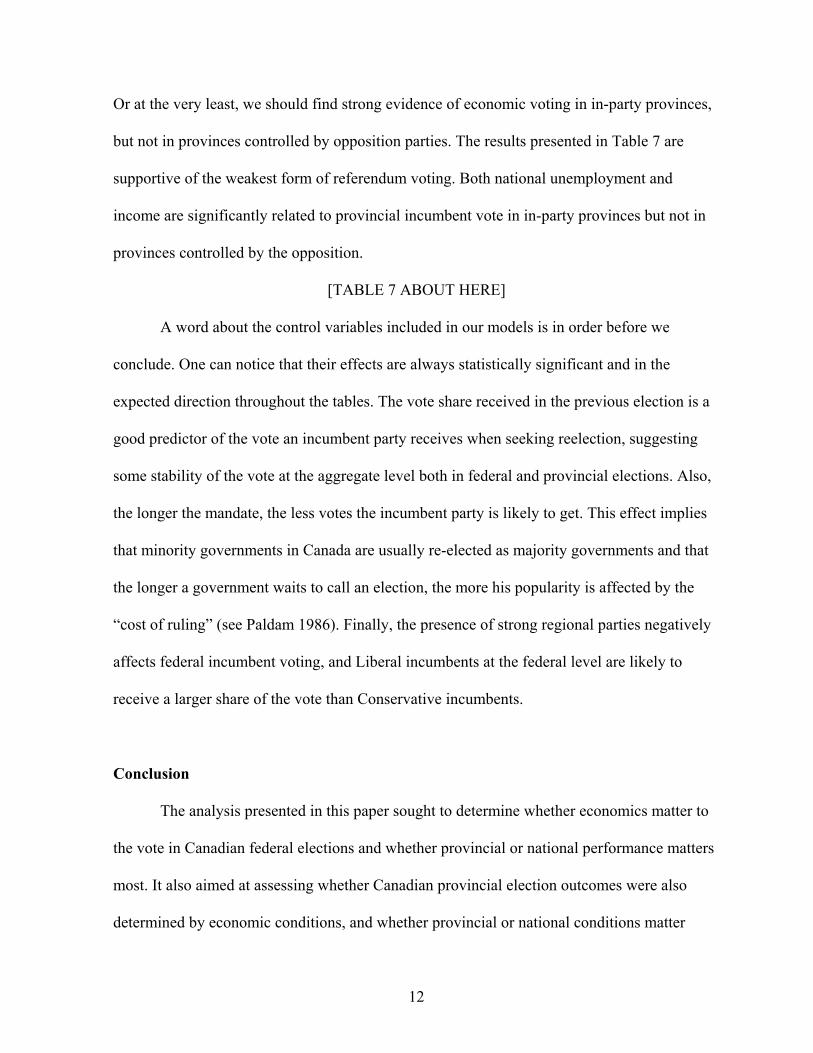
Or at the very least, we should find strong evidence of economic voting in in-party provinces,
but not in provinces controlled by opposition parties. The results presented in Table 7 are
supportive of the weakest form of referendum voting. Both national unemployment and
income are significantly related to provincial incumbent vote in in-party provinces but not in
provinces controlled by the opposition.
[TABLE 7 ABOUT HERE]
A word about the control variables included in our models is in order before we
conclude. One can notice that their effects are always statistically significant and in the
expected direction throughout the tables. The vote share received in the previous election is a
good predictor of the vote an incumbent party receives when seeking reelection, suggesting
some stability of the vote at the aggregate level both in federal and provincial elections. Also,
the longer the mandate, the less votes the incumbent party is likely to get. This effect implies
that minority governments in Canada are usually re-elected as majority governments and that
the longer a government waits to call an election, the more his popularity is affected by the
“cost of ruling” (see Paldam 1986). Finally, the presence of strong regional parties negatively
affects federal incumbent voting, and Liberal incumbents at the federal level are likely to
receive a larger share of the vote than Conservative incumbents.
Conclusion
The analysis presented in this paper sought to determine whether economics matter to
the vote in Canadian federal elections and whether provincial or national performance matters
most. It also aimed at assessing whether Canadian provincial election outcomes were also
determined by economic conditions, and whether provincial or national conditions matter

13
most. In doing so, the paper addressed the larger debate about the peculiarities of electoral
accountability in a federal context.
Our analysis first showed that provincial economic conditions only have a limited
impact on the federal vote in Canada. More precisely, the results suggested that provincial
economics did not have much of an independent effect on federal electoral outcomes.
Canadians seem to hold the federal incumbent responsible for national economic conditions,
more so than for provincial conditions. As a result, it seems that federal incumbents do not
gain much votes by claiming credit for the economic prosperity of any particular province
when, on average, national economic conditions are deteriorating.
Second, we demonstrated that provincial incumbents are held accountable for the
national economic performance, but not for provincial performance. More precisely, the
analysis allowed us to conclude that economic voting in the Canadian provinces seems to
function as a referendum on the federal government. Accordingly, provincial governments
formed by the Liberal or Conservative parties appear to be affected by the state of the national
economy when their party is also in power at the federal level. By contrast, provincial
governments formed by the NDP, the Social Credit or the Parti Québécois appear shielded
from voter dissatisfaction with the federal government’s handling of the national economy.

14
References
Atkeson, Lonna Rae, and Randall W. Partin. 1995. “Economic and Referendum Voting: A Comparison of Gubernatorial and Senatorial Elections.” American Political Science Review 89: 99-107.
Bélanger, Éric, and François Gélineau. 2004. “Economic Voting in Canadian Federal Elections.” Paper presented at the annual meeting of the Midwest Political Science Association, Chicago, April 15-18.
Black, Edwin R. 1975. Divided Loyalties: Canadian Concepts of Federalism, Montreal:
McGill-Queen’s University Press. Carmichael, Calum M. 1990. “Economic Conditions and the Popularity of the Incumbent
Party in Canada,” Canadian Journal of Political Science 23: 713-726. Chubb, John E. 1988. “Institutions, the Economy, and the Dynamics of State Elections.”
American Political Science Review 82: 133-154.
Crête, Jean, and Johanne Simard. 1984. “Conjoncture économique et élections: une étude des élections au Québec,” in Jean Crête (ed.), Comportement électoral au Québec, Chicoutimi: Gaëtan Morin Éditeur, p.165-197.
Cutler, Fred. 2002. “Local Economies, Local Policy Impacts and Federal Electoral Behaviour
in Canada,” Canadian Journal of Political Science 35: 347-382. Feigert, Frank. 1989. Canada Votes: 1935-1988, Durham & London: Duke University Press. Godbout, Jean-François, and Éric Bélanger. 2002. “La dimension régionale du vote
économique canadien aux élections fédérales de 1988 à 2000,” Canadian Journal of Political Science 35: 567-588.
Happy, J. R. 1986. “Voter Sensitivity to Economic Conditions: A Canadian-American
Comparison,” Comparative Politics 19: 45-56. Happy, J. R. 1989. “Economic Performance and Retrospective Voting in Canadian Federal
Elections,” Canadian Journal of Political Science 22: 377-387. Happy, J. R. 1992. “The Effect of Economic and Fiscal Performance on Incumbency Voting:
The Canadian Case,” British Journal of Political Science 22: 117-130. Hibbs, Douglas A., Jr. 1987. The American Political Economy: Macroeconomics and
Electoral Politics in the United States, Cambridge: Harvard University Press. Holbrook-Provow, Thomas M. 1987. “National Factors in Gubernatorial Elections.” American
Politics Quarterly 15: 471-483.

15
Lowry, Robert C., James E. Alt and Karen E. Ferree. 1998. “Fiscal Policy Outcomes and Electoral Accountability in American States.” American Political Science Review 92: 759-774.
Mallory, James R. 1971. The Structure of Canadian Government, Toronto: Macmillan. Nadeau, Richard, and André Blais. 1993. “Explaining Election Outcomes in Canada:
Economy and Politics,” Canadian Journal of Political Science 26: 775-790. Nadeau, Richard, and André Blais. 1995. “Economic Conditions, Leader Evaluations and
Election Outcomes in Canada,” Canadian Public Policy 21: 212-218. Paldam, Martin. 1986. “The Distribution of Election Results and the Two Explanations of the
Cost of Ruling,” European Journal of Political Economy 2: 5-24. Partin, Randall W. 1995. “Economic Conditions and Gubernatorial Elections: Is the State
Executive Held Accountable?” American Politics Quarterly 23: 81-95.
Peltzman, Sam. 1987. “Economic Conditions and Gubernatorial Elections.” American Economic Review 77: 293-297.
Piereson, James E. 1975. “Presidential Popularity and Midterm Voting at Different Electoral Levels.” American Journal of Political Science 19: 683-694.
Powell, G. Bingham, Jr., and Guy D. Whitten. 1993. “A Cross-National Analysis of Economic Voting: Taking Account of the Political Context,” American Journal of Political Science 37: 391-414.
Savoie, Donald J. 1992. Regional Economic Development, 2nd ed., Toronto: University of
Toronto Press. Simon, Dennis M., Charles W. Ostrom, Jr., and Robin F. Marra. 1991. “The President,
Referendum Voting, and Subnational Elections in the United States.” American Political Science Review 85: 1177-1192.
Sitwell, O.F.G., and N.R.M. Seifried. 1984. The Regional Structure of the Canadian Economy, Toronto: Methuen.
Smiley, Donald V. 1987. The Federal Condition in Canada, Toronto: McGraw-Hill Ryerson. Strom, Kaare. 1990. Minority Governments and Majority Rule, Cambridge: Cambridge
University Press. Whitten, Guy D., and Harvey D. Palmer. 1999. “Cross-National Analyses of Economic
Voting,” Electoral Studies 18: 49-67.
16
Table 1. Separate and Combined Effects of National Unemployment, Inflation, and Income on Federal Incumbent Vote
(1) (2) (3) (4) Lagged incumbent vote share .703 *** .729 *** .747 *** .693 *** (.052) (.048) (.043) (.052)
Mandate length (logged) -6.528 *** -9.238 *** -8.808 *** -6.206 *** (1.486) (1.195) (1.347) (1.766)
Bloc 1993 -20.183 *** -23.784 *** -23.742 *** -20.873 *** (1.086) (1.225) (1.108) (1.134)
Reform/Alliance -4.721 ** -7.875 *** -7.151 *** -5.518 *** (1.592) (1.875) (1.722) (1.641)
Liberal incumbent 3.549 ** 7.063 *** 6.634 *** 3.826 ** (1.472) (1.159) (1.621) (1.613)
Unemployment (N) -1.284 *** -1.671 *** (.215) (.297)
Inflation (N) -.416 ** .164 (.140) (.204)
Income (N) -.044 -.822 * (.439) (.389)
Constant 37.835 *** 37.272 *** 33.770 *** 41.425 *** (3.569) (4.767) (5.154) (5.175)
R-squared .68 .64 .63 .69 N 160 160 160 160 Entries are unstandardized OLS coefficients with robust standard errors in parentheses. * p < .10; ** p < .05; *** p < .01

17
Table 2. Correlations Between National and Provincial Measures of the Economy at the Time of Federal Elections
Vote Une (N) Infla (N) Inc (N) Une (P) Infla (P) Inc (P)
Vote 1.000
-.474 Une (N) (.000) 1.000
-.060 .012 Infla (N) (.455) (.880) 1.000
.139 -.535 .205 Inc (N) (.080) (.000) (.009) 1.000
-.086 .663 .083 -.359 Une (P) (.277) (.000) (.297) (.000) 1.000
-.035 .171 .983 .186 .092 Infla (P) (.671) (.036) (.000) (.022) (.262) 1.000
.140 -.297 .168 .642 -.236 .129 Inc (P) (.086) (.000) (.039) (.000) (.004) (.114) 1.000
Entries are Pearson's R correlation coefficients with the significance level in parentheses.
18
Table 3. Separate and Combined Effects of Provincial Unemployment, Inflation, and Income on Federal Incumbent Vote
(1) (2) (3) (4) Lagged incumbent vote share .766 *** .719 *** .733 *** .745 *** (.040) (.048) (.048) (.048)
Mandate length (logged) -8.085 *** -9.078 *** -8.670 *** -8.227 *** (1.193) (1.273) (1.309) (1.471)
Bloc 1993 -22.679 *** -23.561 *** -23.471 *** -22.751 *** (1.467) (1.204) (1.122) (1.274)
Reform/Alliance -7.303 *** -7.559 *** -7.158 *** -7.924 *** (2.011) (1.788) (1.775) (1.929)
Liberal incumbent 5.613 *** 6.949 *** 6.600 *** 6.017 *** (1.232) (1.236) (1.351) (1.328)
Unemployment (P) -.398 *** -.401 ** (.121) (.149)
Inflation (P) -.356 *** -.208 (.132) (.150)
Income (P) -.051 -.130 (.184) (.169)
Constant 34.047 *** 36.740 ** 33.727 *** 36.183 *** (3.414) (4.807) (4.513) (4.784)
R-squared .65 .62 .62 .64 N 160 151 151 151 Entries are unstandardized OLS coefficients with robust standard errors in parentheses. * p < .10; ** p < .05; *** p < .01

19
Table 4. Comparing the Effect of National and Provincial Unemployment on Federal Election Outcomes
Lagged incumbent vote share .686 *** (.056)
Mandate length (logged) -6.449 *** (1.526)
Bloc 1993 -20.014 *** (1.019)
Reform/Alliance -4.173 ** (1.652)
Liberal incumbent 3.453 ** (1.503)
Unemployment (N) -1.520 *** (.228)
Unemployment (P) .192 (.113)
Constant 38.386 *** (3.673)
R-squared .68 N 160 Entries are unstandardized OLS coefficients with robust standard errors in parentheses. * p < .10; ** p < .05; *** p < .01

20
Table 5. Separate and Combined Effects of Provincial Unemployment, Inflation, and Income on Provincial Incumbent Vote
(1) (2) (3) (4) Lagged incumbent vote share .737 *** .710 *** .703 *** .718 *** (.067) (.057) (.047) (.058)
Mandate length (logged) -5.849 ** -5.979 ** -5.904 ** -5.953 ** (2.046) (2.030) (2.053) (2.088)
Unemployment (P) -.082 -.070 (.161) (.192)
Inflation (P) .142 .144 (.142) (.161)
Income (P) .077 .035 (.205) (.204)
Constant 32.465 *** 32.843 *** 33.229 *** 32.778 *** (8.156) (8.223) (8.303) (8.490)
R-squared .30 .30 .30 .30 N 132 126 126 126 Entries are unstandardized OLS coefficients with robust standard errors in parentheses. * p < .10; ** p < .05; *** p < .01

21
Table 6. Separate and Combined Effects of National Unemployment, Inflation,
and Income on Provincial Incumbent Vote
(1) (2) (3) (4) Lagged incumbent vote share .722 *** .724 *** .706 *** .712 *** (.058) (.058) (.061) (.061)
Mandate length (logged) -5.355 ** -5.827 ** -5.185 ** -5.121 ** (1.785) (2.084) (1.805) (1.779)
Unemployment (N) -.553 ** -.350 (.180) (.240)
Inflation (N) .061 .100 (.127) (.129)
Income (N) .665 ** .409 (.168) (.240)
Constant 34.611 *** 32.133 ** 29.238 ** 31.402 ** (7.573) (8.303) (7.421) (7.507)
R-squared .32 .30 .32 .33 N 132 132 132 132 Entries are unstandardized OLS coefficients with robust standard errors in parentheses. * p < .10; ** p < .05; *** p < .01

22
Table 7. Effect of National Unemployment and Income on Provincial Incumbent Vote With Provincial and Federal Incumbent Parties of the Same Partisan Family
Unemployment Income In-party Other In-party Other Lagged incumbent vote share .646 ** .752 *** .574 ** .756 *** (.152) (.088) (.151) (.093)
Mandate length (logged) -2.803 -7.591 ** -2.020 -7.111 ** (2.479) (2.551) (2.533) (2.549)
Unemployment (N) -1.193 ** .016 (.267) (.281)
Income (N) 1.145 ** .390 (.372) (.261)
Constant 32.882 ** 37.996 ** 22.090 * 35.174 ** (7.275) (10.433) (9.927) (10.705)
R-squared .39 .39 .34 .34 N 50 82 50 82 Entries are unstandardized OLS coefficients with robust standard errors in parentheses. * p < .10; ** p < .05; *** p < .01