
Elastography
127
SHER-I-KASHMIR INSTITUTE OF MEDICAL SCIENCES SOURA DEPARTMENT OF RADIODIAGNOSIS & IMAGING
-
Upload
sameer-peer -
Category
Health & Medicine
-
view
425 -
download
1
Transcript of Elastography

SHER-I-KASHMIR INSTITUTE OF MEDICAL SCIENCESSOURA
DEPARTMENT OF RADIODIAGNOSIS & IMAGING

PRESENTATION BY
Dr SAMEER PEER
1ST YEAR PG STUDENT


CONTENTS
• Introduction• Basic principles of elastography• Methods and Types of elastography• Applications of elastography• Pitfalls and limitations• Recent Advances and future prospects• Conclusion• References and further reading

INTRODUCTION
Ever since Hippocrates, physicians have used palpation todetect differences in tissue stiffness as an aid to diagnosis.
Elastography is a novel imaging modality which depends onthe same differences in mechanical properties betweenhealthy and abnormal tissues but uses imaging to detectthese differences at depths not reachable by manualpalpation.
Elastography techniques have been developed for bothultrasound and MR imaging.
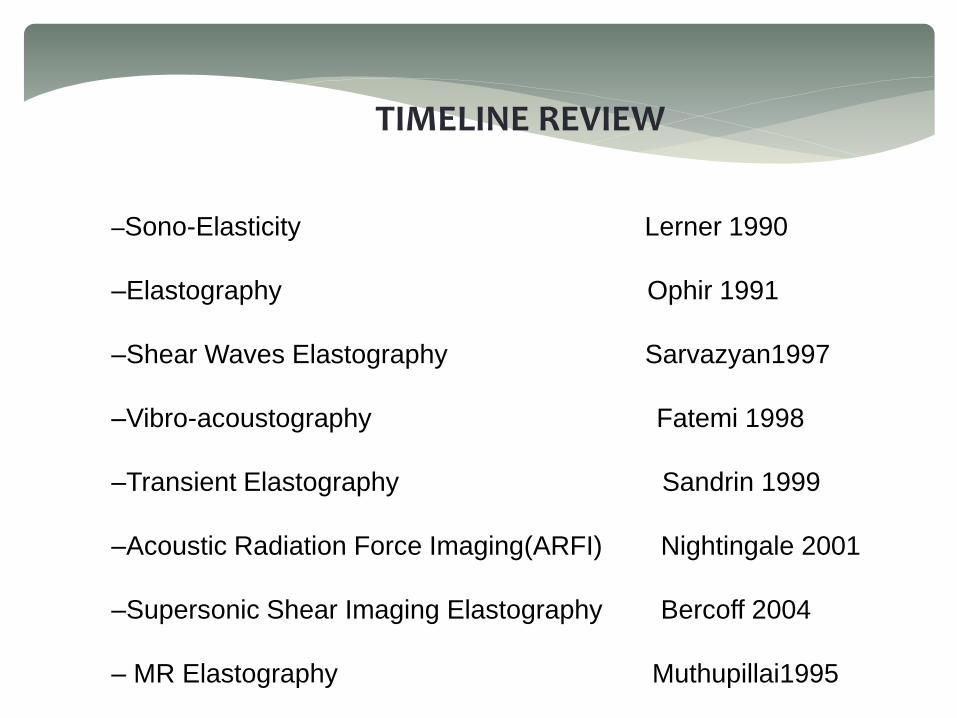
–Sono-Elasticity Lerner 1990
–Elastography Ophir 1991
–Shear Waves Elastography Sarvazyan1997
–Vibro-acoustography Fatemi 1998
–Transient Elastography Sandrin 1999
–Acoustic Radiation Force Imaging(ARFI) Nightingale 2001
–Supersonic Shear Imaging Elastography Bercoff 2004
– MR Elastography Muthupillai1995
TIMELINE REVIEW

BASIC PRINCIPLES OF ELASTOGRAPHY
Elastogarphy is a tissue elasticity imaging, hence it is importantto understand the general principles which govern thebehaviour of an elastic material when acted upon by an externalforce.
When external forces are applied to objects made up of elasticmaterials, they undergo a change in shape and size.
STRAIN is a relative change in shape or size of an object due toexternally applied forces.STRESS is the internal force ( per unit area) associated withstrainHOOK’S LAW states that strain is directly proportional to stressfor a linearly isotropic elastic material

e= (h-ho)/ho
Strain = Change in length/original length
e= / E
e = Strain (dimensionless)
= Stress (Pascal) = Force / Area
E = Young’s Modulus (Pascal)
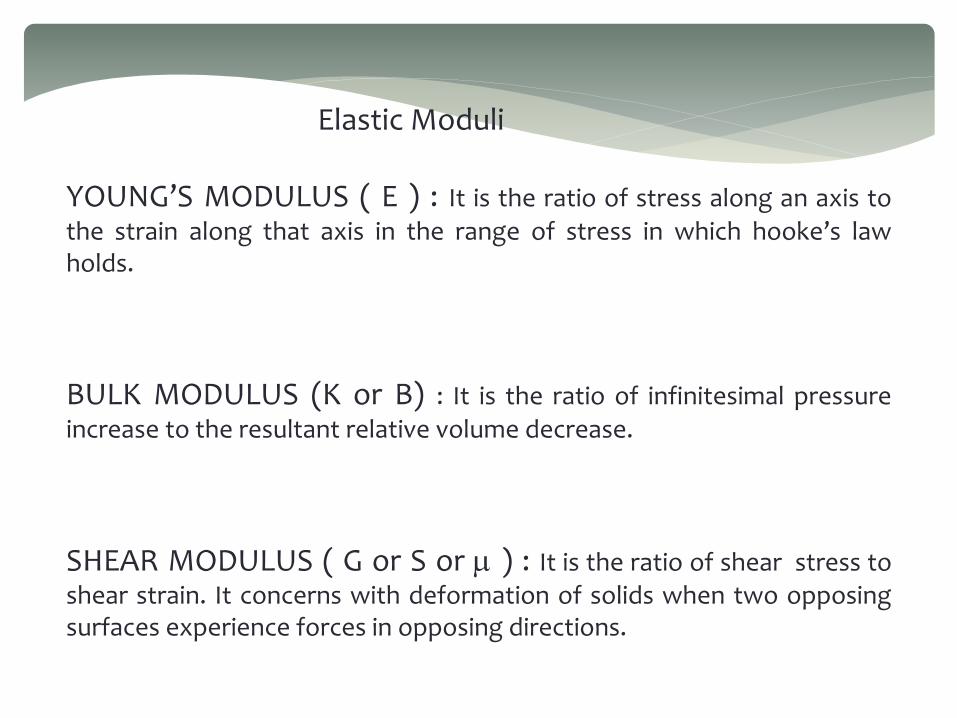
Elastic Moduli
YOUNG’S MODULUS ( E ) : It is the ratio of stress along an axis to
the strain along that axis in the range of stress in which hooke’s lawholds.
BULK MODULUS (K or B) : It is the ratio of infinitesimal pressure
increase to the resultant relative volume decrease.
SHEAR MODULUS ( G or S or m ) : It is the ratio of shear stress toshear strain. It concerns with deformation of solids when two opposingsurfaces experience forces in opposing directions.

YOUNG’S MODULUS (E) BULK MODULUS ( K OR B)
SHEAR MODULUS ( G or m)
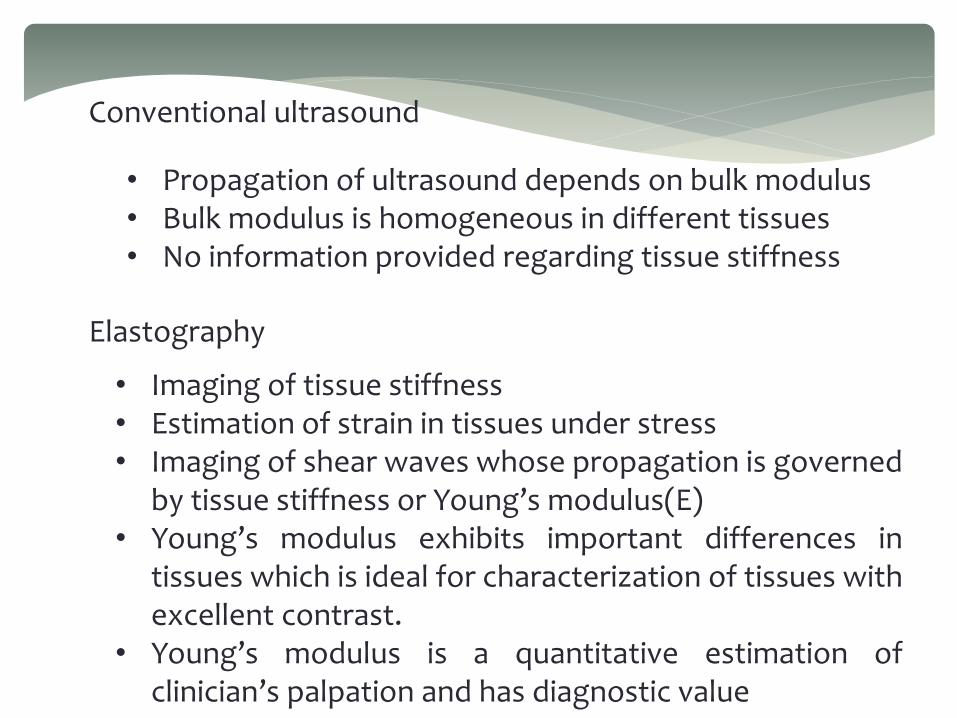
Conventional ultrasound
• Propagation of ultrasound depends on bulk modulus• Bulk modulus is homogeneous in different tissues• No information provided regarding tissue stiffness
Elastography
• Imaging of tissue stiffness• Estimation of strain in tissues under stress• Imaging of shear waves whose propagation is governed
by tissue stiffness or Young’s modulus(E)• Young’s modulus exhibits important differences in
tissues which is ideal for characterization of tissues withexcellent contrast.
• Young’s modulus is a quantitative estimation ofclinician’s palpation and has diagnostic value

ILLUSTRATIVE EXAMPLE

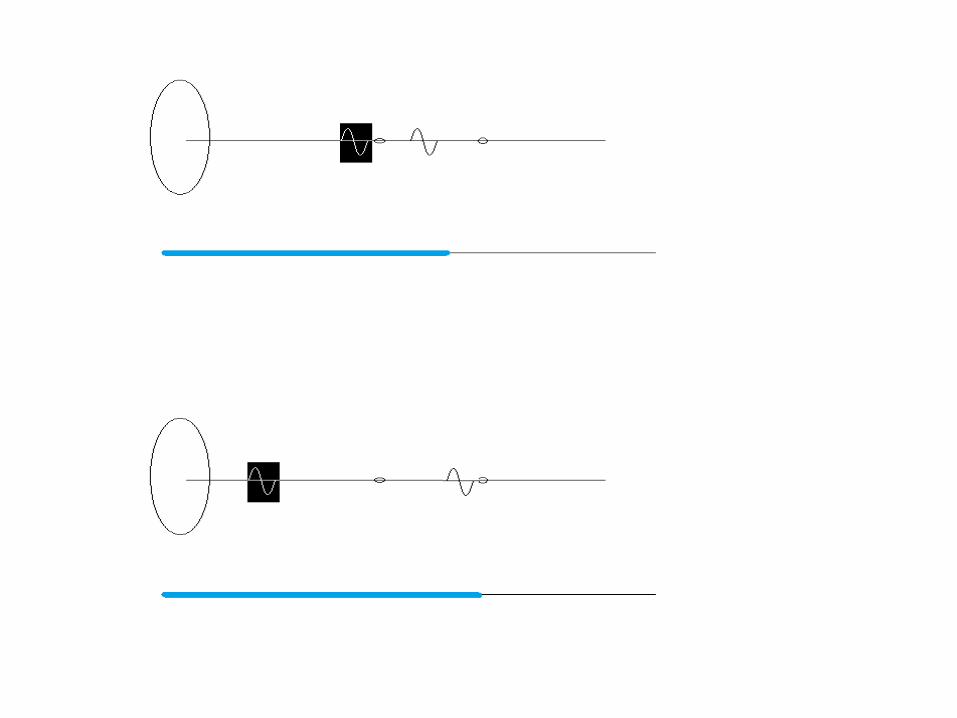


dA dB
tA= 2dA/ c tB= 2dB/ c
c = Speed of sound

Displacement ( d) = dB – dA = c ( t B-t A)/2
d = c/2 ( = t B – t A )
METHODS AND TYPES OF ELASTOGRAPHY
Two established methods of elastography
• ULTRASOUND ELASTOGRAPHY• MAGNETIC RESONANCE ELASTOGRAPHY


ULTRASOUND ELASTOGRAPHY
METHODS
• QUASI-STATIC • DYNAMIC

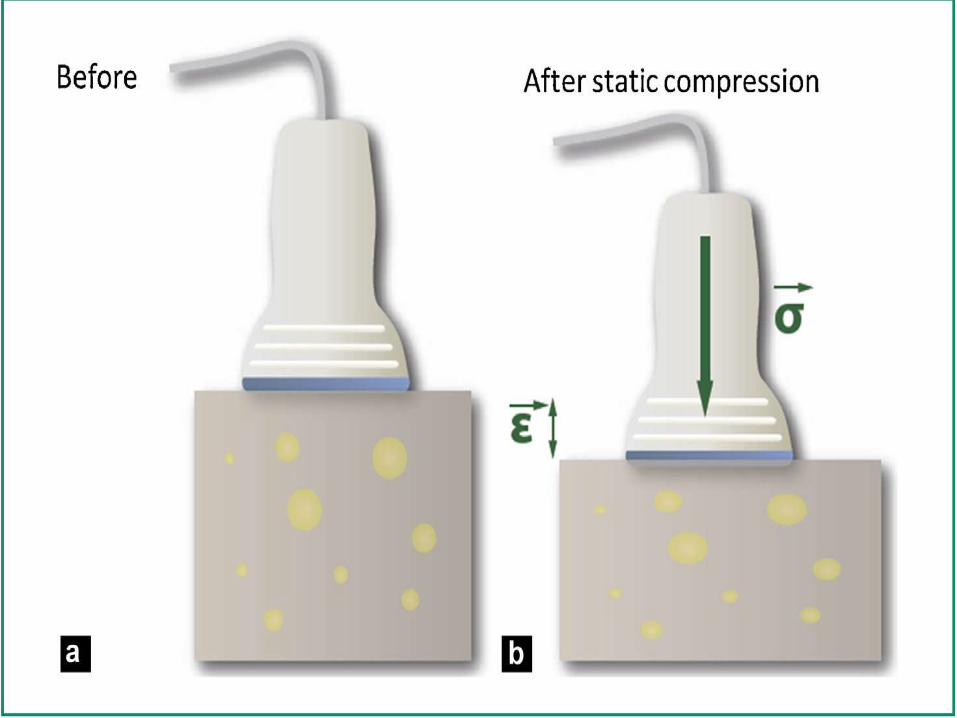
QUASI-STATIC METHODS
In the case of quasi-static elastography, a constant stress is applied to
the tissue. The displacement and the generated strain are then
estimated using two-dimensional correlation of ultrasound images. The
Young’s modulus is then given via the Hooke’s law , which links stress
and strain in a purely elastic medium.
In practice, since the applied stress is unknown, only the strain is
displayed, this strain map is sometimes called the elastogram.
This was the first elastography technique, developed by the Ophir Group
at the beginning of the 1990s. Today, the technique is being tested in
breast lesion characterization with interesting results.


The main limitations of this technique are
• the control of the stress applied, which remains operator
dependent,
• the absence of a specific quantification.
• the use of a stress applied by the operator limits the technique to
superficial organs, mainly the breast or the thyroid.
This technique is simple to implement and is widely spread in the
world of radiology, and has been mainly validated for breast lesionsclassification

DYNAMIC METHODS
In dynamic methods, a time-varying force is applied to the tissue, it can
either be a short transient mechanical force or an oscillatory force with a
fixed frequency.
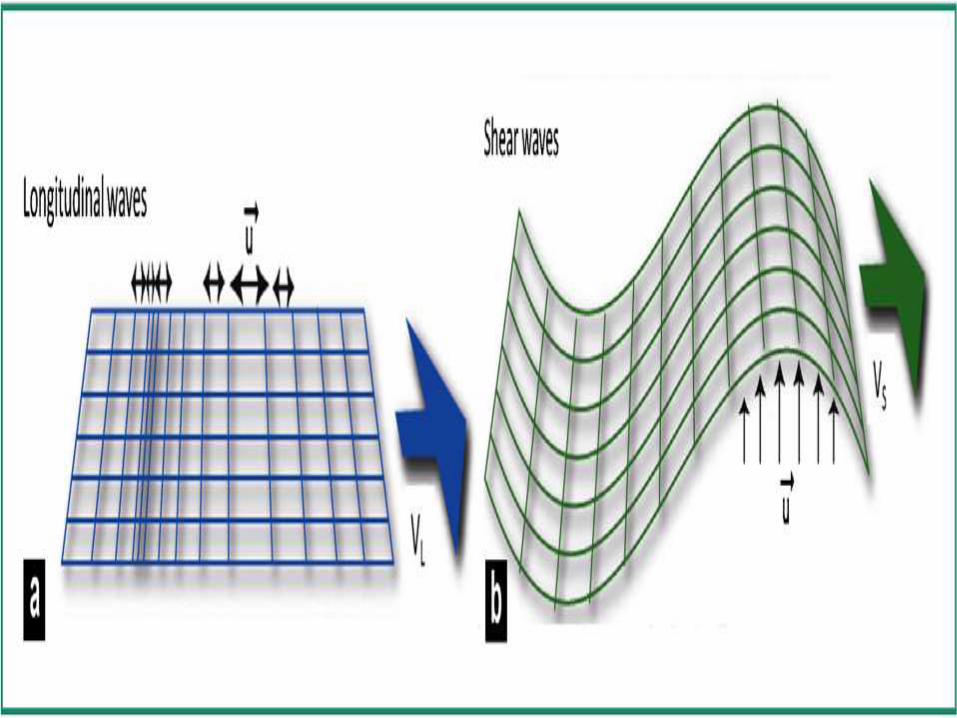
A time-varying mechanical perturbation will propagate as mechanical
waves which in a solid body can be compressional waves or shear
waves.
The compressional waves propagate very quickly in the human body
(∼1500 m/s), and at high frequencies, these waves, also known as
ultrasounds, can be used to image the body.
Shear waves, which are only generated at low frequencies (10 Hz to
2000 Hz) due to absorption at higher frequencies, propagate more
slowly, and their speed (∼1—50 m/s) is directly related to the medium
shear modulus.

In biological tissues, which are almost incompressible, the Young’s
modulus can be approximated as three times the shear modulus. The
shear wave propagation speed can thus be used to map the Young’s
modulus quantitatively.
Dynamic elastography techniques, which rely on shear waves
propagation, can produce quantitative and higher resolution Young’s
modulus map compared to quasi-static methods.
The use of shear waves, however, requires a more complex system,
able to generate the shear wave (mechanical vibrator or ultrasound
radiation pressure) and to image the small displacements induced by theshear wave (ultrafast or stroboscopic ultrasound).

VIBRO-ACOUSTOGRAPHY
Vibro-acoustography is a dynamic elastography method based on
the ultrasound radiation pressure and developed by the American
Group of James Greenleaf
The radiation pressure is a volumic force created by transfer of
momentum within the medium This momentum is related to the
absorption of the ultrasound wave.
Vibro-accoustography uses two confocal ultrasound beams with
slightly different frequencies w and w0 + w. It results in beats at the
frequency w , which give rise to a modulated force at frequency w,
only at the focal spot. Therefore, everything looks like if
the target vibrates at the frequency w.
It is then sufficient to listen to the sound produced by this excitation
to deduce the mechanical properties of the target, particularly its stiffness.

For this, one can place a hydrophone that records the response of
the target at the frequency w . In order to create an image, the
entire area is swept by moving the focal spot and listening to the response for each point of the image.
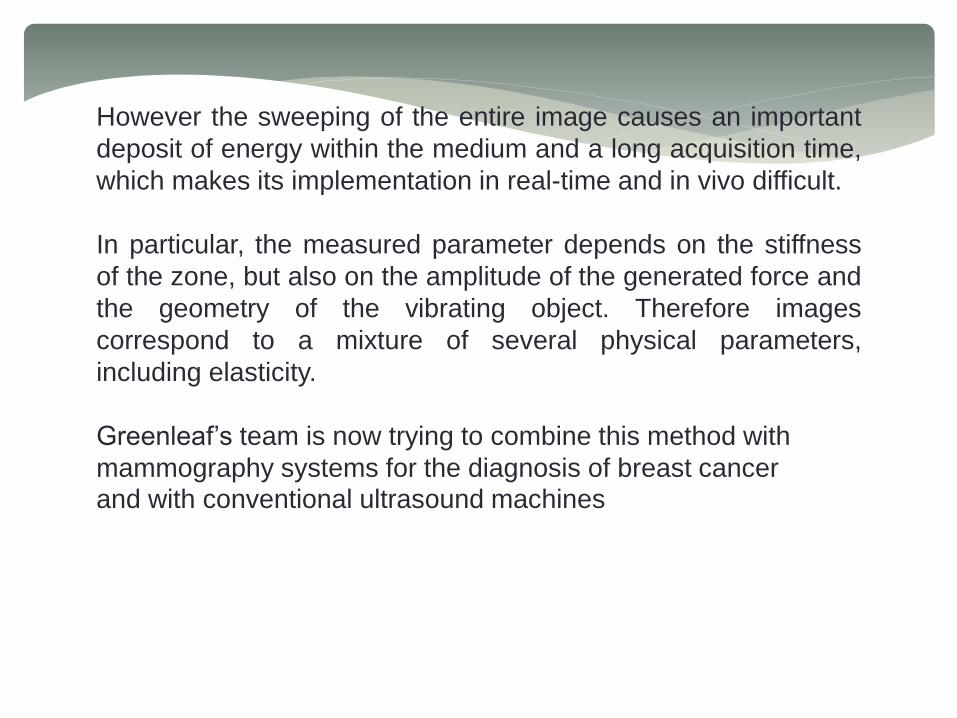
However the sweeping of the entire image causes an important
deposit of energy within the medium and a long acquisition time,
which makes its implementation in real-time and in vivo difficult.
In particular, the measured parameter depends on the stiffness
of the zone, but also on the amplitude of the generated force and
the geometry of the vibrating object. Therefore images
correspond to a mixture of several physical parameters,
including elasticity.
Greenleaf’s team is now trying to combine this method with
mammography systems for the diagnosis of breast cancerand with conventional ultrasound machines

TRANSIENT ELASTOGRAPHY METHODS
Acoustic Radiation Force Impulse Imaging (ARFI) or ‘‘Acoustic Radiation
Force Imaging’’, is a method developed by the American team of Kathy
Nightingale.
This technique uses the acoustic radiation force but, unlike vibro -
acoustography, ARFI only uses one focalized ultrasound beam.
The radiation force slightly displaces the tissue at the focal spot according
to Hooke’s law. Then the transducer switches into imaging mode and
detect displacements of the focal spot by tracking of the ultrasound signal
(called ‘‘speckle’’). The ultrasound speckle-tracking , already used in static
elastography, allows to correlate the ultrasound signal window by window
in order to detect the displacement of a tissue with sensitivity of less than amicrometer. By window, I mean a piece of an ultrasound signal.

Today, Nightingale’s team is interested in the propagation of shear
waves generated by the radiation force and has recently proposed a
new ARFI model called ‘‘ARFI-SWS’’.
Based on this concept, it allows to quantitatively measure the Young’s
modulus in a small region of interest. This variation is currently being
evaluated for the liver staging and is available on commercial ultrasound systems, such as the Siemens Acuson S2000.
1D transient elastography: the 1D shear elasticity probe
The 1D transient elastography probe was first developed at the Institut
Langevin in 1995 by Catheline et al.
It consists of generating a transient impulse (little shock) on the medium
and recording the shear wave that propagates within the medium by using
an ultrasound transducer.
First, the front face of the transducer acting as a piston gives a slight
mechanical impulse on the surface of medium, which generates a
spherical compression wave as well as a spherical shear wave.
The displacement generated, which is a function of depth and of time, is
thus estimated by correlations of retro-diffused echoes (via ultrasound
speckle) recorded at a framerate higher than one thousand time per
second with a mono-dimensional ultrasound transducer (5 MHz).
This device was the first to use the principle of ultrafast imaging in one
dimension to visualize in a transient manner the propagation of shearwaves.
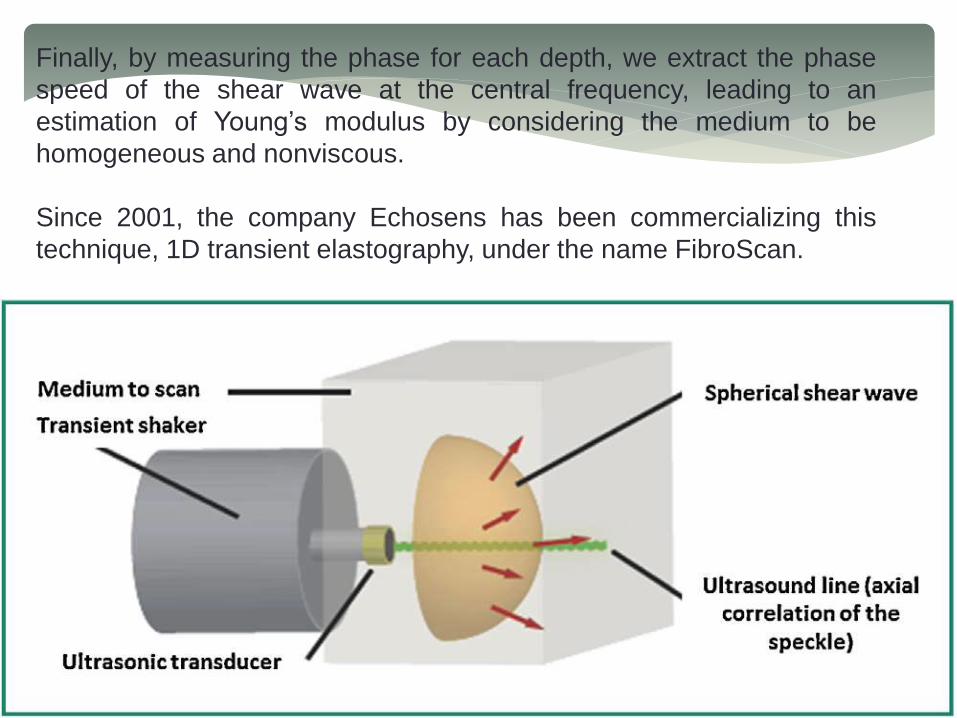
Finally, by measuring the phase for each depth, we extract the phase
speed of the shear wave at the central frequency, leading to an
estimation of Young’s modulus by considering the medium to be
homogeneous and nonviscous.
Since 2001, the company Echosens has been commercializing this
technique, 1D transient elastography, under the name FibroScan.

2D transient elastography
In 1997, at the ‘‘Institut Langevin’’, the 1D transient elastography
technique was extended to 2D, allowing the creation of elasticity maps of
biological tissues.
A programmable ultrasound electronic device used for time reversal
experiments (process of refocalizing acoustic waves) was modified to be
able to perform ultrafast imaging based on ultrasound plane wave
emission.
It allowed storing raw data acquired with a frame rate of more than 5000
images per second. A vibrator was fixed to the ultrasound imaging array,
which is then used as an impactor to generate a quasi-plane shear wave.
Once the movie of the propagating shear wave is reconstructed, the wave
equation is inverted to recover a map of Young’s modulus.
The first in vivo tests were carried out in 2003 with volunteers at Institut
Curie, the results were encouraging, but the device was bulky, heavy anddifficult to use in practice.


The study of shear wave by using ultrafast imaging
The Supersonic Shear Imaging technique is the outcome of researches at
the Institute Langevin in transient elastography.
The idea of combining radiation pressure or acoustic radiation force and the
study of shear waves generated comes from Armen Sarvazyan, which can
be considered as a precursor of elastography techniques based on
ultrasonic radiation pressure via its technique: Shear Wave Elasticity
Imaging.
In 2004, two fundamental ideas are developed to overcome the limitations
of 2D elastography technique:
• acoustic radiation force
• ultrasound ultrafast imaging.
These two concepts described below are at the heart of the SupersonicShear Imaging technique

• a Mach cone: ultrasound beams are successively focused at different
depths. The different spherical waves generated for each focal beam
interfere like a Mach cone in which the source propagates more quickly
than the generated shear wave and creates a quasi-plane wave front in
the imaging plane (cylindrical in three dimensions).
The use of constructive interfaces makes it possible to increase the
amplitude of the wave and thus the signal to noise ratio of the
displacement field.
The generated quasi-plane shear wave in the imaging plane allows also
simplifying the propagation hypotheses, which is of great interesting to
solve inverse problems.
Finally, only one Mach cone allows illuminating almost all of the medium
with one plane shear wave; shear wave being generated, the propagation
equation of the waves is inverted to rebuild a map of Young’s modulus;
• ultrafast imaging: complete acquisition all at once. Ultrafast imaging
allows scanning the entire imaging plane with very good temporal
resolution in one single acquisition, typically with a frame rate of 5000
images per second, and up to 30,000 images per second in the case
of tissues such as the peripheral arteries or the eye.
Therefore there is no need to repeat the acquisition several times by
stroboscopy to acquire the entire displacement field. This allows, not
only imaging in real-time, which makes the examination easier, but
also averaging the very rapidly acquired images to improve imagequality.

Therefore, the Supersonic Shear Imaging technique uses the technology of
the 2D transient elastography, but substitutes vibrator by the acoustic
radiation pressure.
The whole excitation-imaging method is then integrated onto one single
component: the ultrasound imaging transducer array. Amplified by the Mach
cone, the generated shear wave has amplitude of tens of microns. This latter
is detectable with a good signal to noise ratio by ultrasound speckletracking
algorithm and ultrafast imaging.
Thanks to ultrafast imaging, the acquisition of the shear wave propagation can
be carried out all at once in less than 30 milliseconds. The technique is
therefore slightly sensitive to patient movements (as an example breathing)
and can be displayed in real-time, like a conventional ultrasound image.
The Young’s modulus maps are then reconstructed by estimating the speed
of the shear wave between two points of the image, using a time of flight
algorithm.
The first in vivo experiences with this technique were conducted at the Institut
Curie where, in approximately 50 patients, the use of the technique todifferentiate benign tissue from malignant tissue was demonstrated
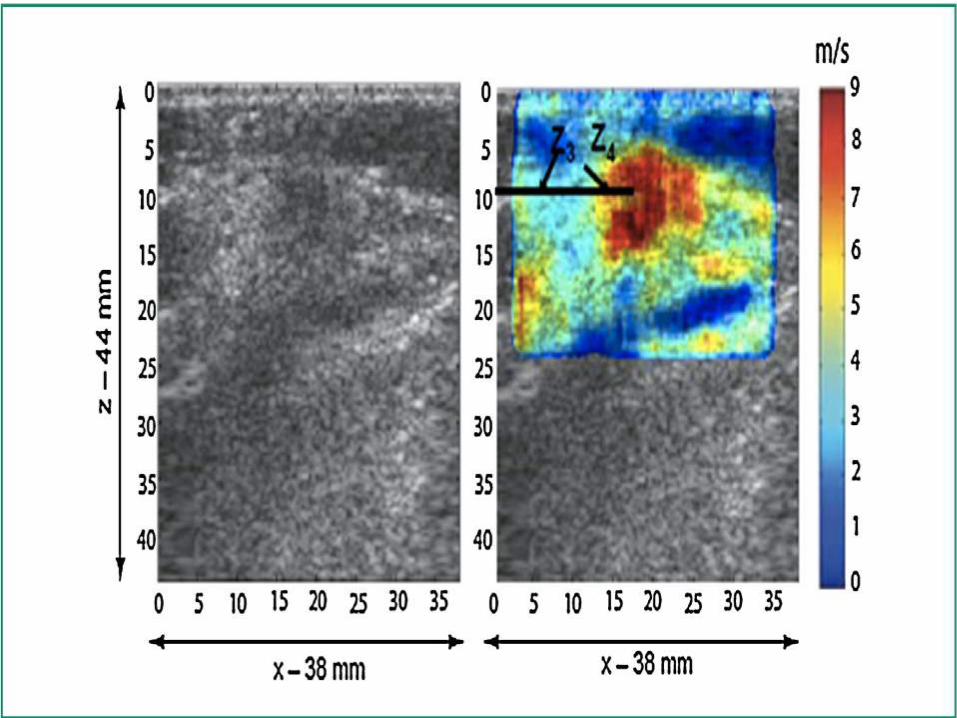
This technique was implemented on an ultrasound diagnostic imaging
device called, the Aixplorer (Supersonic Imagine, Aix-en-Provence,
France) and its diagnosis performance as well as its reproducibility were
demonstrated in several organs, and more particularly in the breast withthe addition of the elasticity parameters to the classical BIRADs criteria
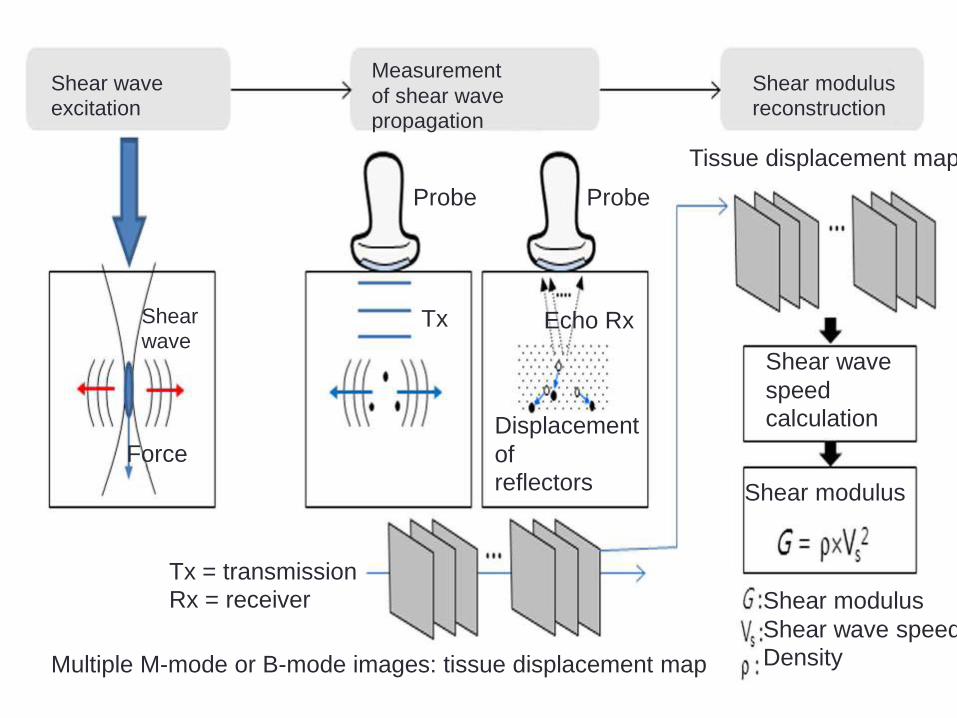
Shear wave
excitation
Measurement
of shear wave
propagation
Shear modulus
reconstruction
Shear
wave
Force
Probe Probe
Tx Echo Rx
Displacement
of
reflectors
Tissue displacement map
Shear wave
speed
calculation
Shear modulus
Shear modulus
Shear wave speed
Density
Tx = transmission
Rx = receiver
Multiple M-mode or B-mode images: tissue displacement map
MAGNETIC RESONANCE ELASTOGRAPHY
Magnetic Resonance Elastography (MRE) is a rapidly developing technology
for quantitatively assessing the mechanical properties of tissue.
MRE obtains information about the stiffness of tissue by assessing the
propagation of mechanical waves through the tissue with a special magnetic
resonance imaging (MRI) technique. The technique essentially involves three
steps:
1. generating shear waves in the tissue,
2. acquiring MR images depicting the propagation of the induced shear waves
and
3. processing the images of the shear waves to generate quantitative maps of
tissue stiffness, called elastograms.
Generating Mechanical Waves in Tissue
MRE typically uses vibrations of a single frequency (within the audio frequency
range) generated by external driver devices. The electrical signal for these devices
is created by a signal generator triggered by and synchronized to the MR pulse
sequence and is amplified by an audio amplifier before being fed into the
mechanical driver
Over the years, several driving mechanisms have been developed, each with their
own advantages and limitations. Three of the most commonly used driver
systems are:
• an electromechanical driver that works via the Lorentz force and
utilizes the magnetic field of the main MRI magnet.
• A piezoelectric stack driver system where the motion created is based
on the piezoelectric property of certain materials. Focused-ultrasound-based
(FUSbased) radiation force has also been investigated as a means to create
mechanical motion for various elasticity imaging strategies including MRE,
where shear waves are created directly within tissue with externally placed
ultrasound transducers.
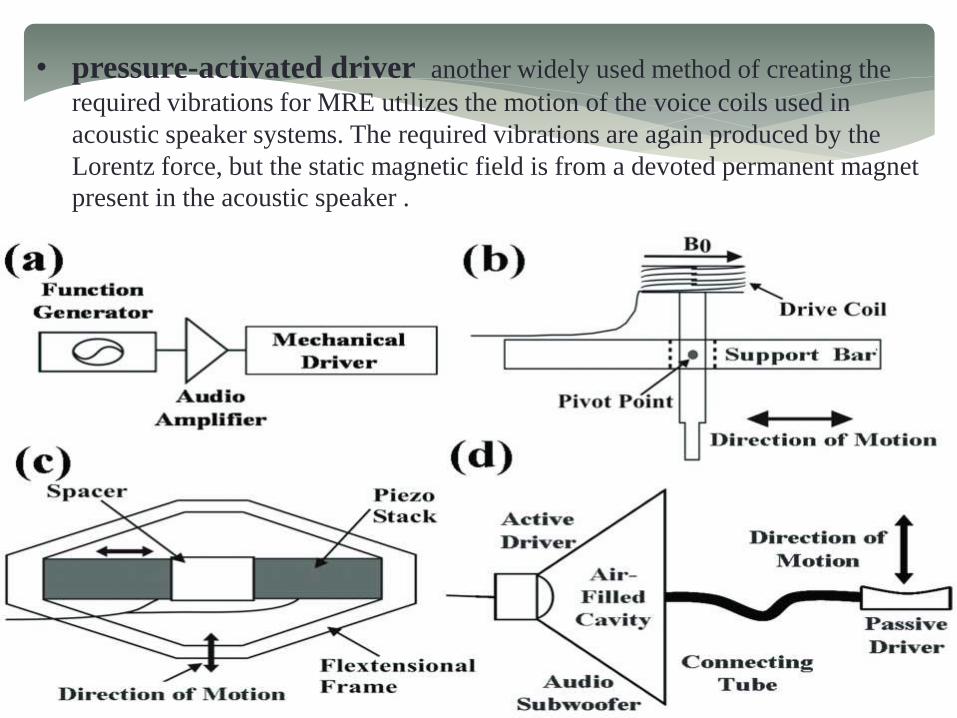
• pressure-activated driver another widely used method of creating the
required vibrations for MRE utilizes the motion of the voice coils used in
acoustic speaker systems. The required vibrations are again produced by the
Lorentz force, but the static magnetic field is from a devoted permanent magnet
present in the acoustic speaker .

Imaging the Propagating Waves
Measuring the tissue motion produced by a driver with MRE is based on an MR
imaging technique called phase-contrast MRI.
Muthupillai et al. developed the technique of dynamic phase-contrast MRE
where propagating shear waves in tissue are encoded into the phase of the MR
images with the help of motion encoding gradient (MEG) pair.
After continuous harmonic motion is induced in the tissue, a MEG oscillating at
the same frequency as the motion is applied and conventional MR imaging is
performed. The phase contribution to the MR image ϕ due to the motion and the
applied magnetic field gradient at a given position vector r⃗ and phase offset θ
between the motion and the MEG can be written as.
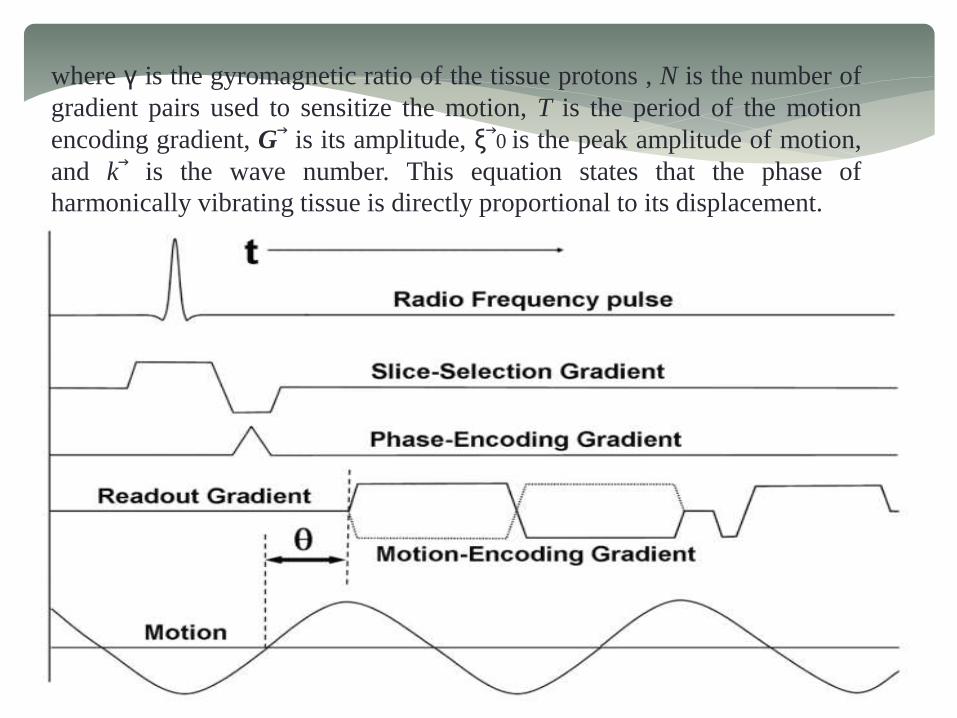
where γ is the gyromagnetic ratio of the tissue protons , N is the number of
gradient pairs used to sensitize the motion, T is the period of the motion
encoding gradient, G⃗ is its amplitude, ξ⃗0 is the peak amplitude of motion,
and k⃗ is the wave number. This equation states that the phase of
harmonically vibrating tissue is directly proportional to its displacement.

Figure shows a typical MRE pulse sequence using a gradient-recalled echo with
the conventional radiofrequency (RF) pulse waveform, slice-selection gradient,
phase-encoding gradient and frequency-encoding gradient.
The motion-encoding gradient (shown here only in the frequency-encoding
direction) is placed after the RF excitation of the sample and before the
measurement of the induced signal.
Motion occurring in any direction can be encoded into the phase of the MR
image by manipulating the axes on which the MEGs are placed. In this example,
only the motion occurring in the frequency-encoding direction will be sensitized
to and encoded into the image phase.
The motion-encoding capability of this technique is very sensitive and can detect
motion on the order of 100’s of nanometers.
An MR image thus obtained containing information about the propagating wave
in its phase is called a wave image. Typically two such wave images are collected
with opposite polarity of the MEG and a phase-difference image is calculated to
remove non-motion-related phase information.
Since the motion-encoding gradients necessary for MRE are inserted into
conventional MR pulse sequences, MRE can be implemented with many MR
imaging sequences, each with its own advantages and limitations. MRE pulse
sequences based on spin echo (SE), gradient-recalled echo (GRE), balanced
steady-state free precision (bSSFP) and echo planar imaging (EPI) techniques
exist.

Mechanical Parameter Estimation
From the wave images indicating the propagation of shear waves in the tissue,
mathematical inversion algorithms based on equations of motion, with
simplifying assumptions like isotropy, homogeneity, and incompressibility, allow
for the calculation of mechanical properties like the shear modulus to be used for
clinical interpretations.
The images of the mechanical properties of tissue calculated in MRE are often
referred to as elastograms. Depending on the technique used to derive the
elastograms from the original MR images, elastograms can theoretically (e.g.,
absent any noise) have half the resolution of the native MR images (which can
range from 50 μm to 10 mm depending on the application), however they more
typically have one-third to one-fifth of the MRI resolution.
Shear wave interference can cause artifacts in the stiffness calculations using
several of the above techniques, and a preprocessing technique called
directional filtering has been developed to reduce these artifacts

MRE of an inclusion phantom
(a) MR magnitude image of an inclusion phantom with soft and stiff inclusions
seen as the hyperintense and hypointense regions, respectively.
(b) A single wave image from the MRE acquisition performed at 100 Hz. The
difference in the wavelengths in the different regions is evident.
(c) An elastogram obtained from these data showing the stiff and soft regions.

APPLICATIONS OF ELASTOGRAPHY
ULTRASOUND ELASTOGRAPHY
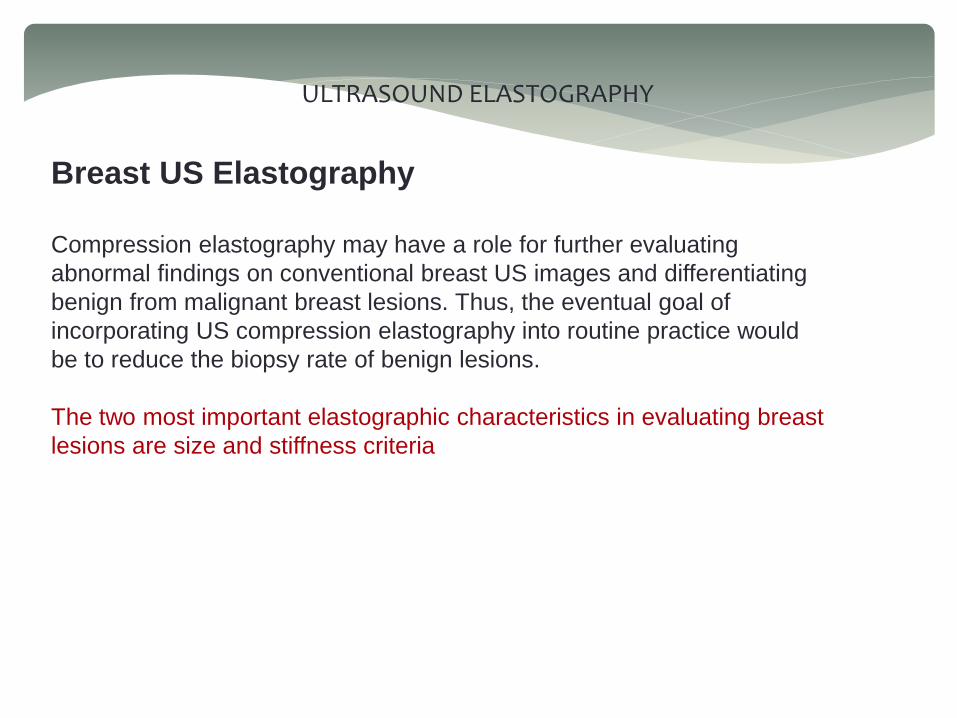
Breast US Elastography
Compression elastography may have a role for further evaluating
abnormal findings on conventional breast US images and differentiating
benign from malignant breast lesions. Thus, the eventual goal of
incorporating US compression elastography into routine practice would
be to reduce the biopsy rate of benign lesions.
The two most important elastographic characteristics in evaluating breast
lesions are size and stiffness criteria
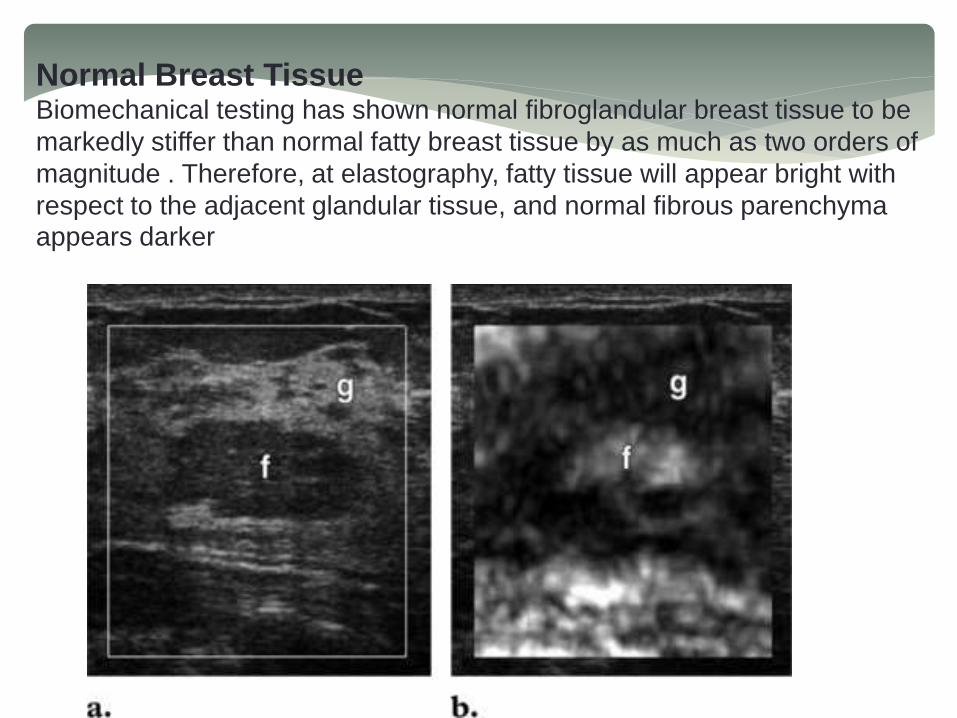
Normal Breast TissueBiomechanical testing has shown normal fibroglandular breast tissue to be
markedly stiffer than normal fatty breast tissue by as much as two orders of
magnitude . Therefore, at elastography, fatty tissue will appear bright with
respect to the adjacent glandular tissue, and normal fibrous parenchyma appears darker

(a) B-mode US image of the breast shows that a lobule of normal fatty tissue (f) is
hypoechoic with respect to the surrounding glandular tissue (g).
(b) US elastogram shows that the fatty tissue (f) surrounded by dense breast
tissue appears bright because it is appreciably “softer” than the surrounding
glandular tissue (g).

Simple cyst. (a) B-mode US image of the breast shows a classic
cyst (arrowheads). (b) US elastogram demonstrates a bull’s-eye
configuration within the lesion (arrowheads), which contains
bright compressible material (thin arrow), and a bright spot
behind the cyst (thick arrow).

Complex cyst mimicking a solid lesion at US. (a) B-mode US image
demonstrates a round hypoechoic breast lesion without associated
through transmission. (b) US elastogram shows that the lesion that
appeared “solid” on the B-mode image is a cyst. .

Fibrocystic change. (a) B-mode US image demonstrates an irregular
heterogeneous lesion in a patient who presented with a palpable mass
in the right breast. (b) On the US elastogram, the lesion appears soft
and smaller than on the B-mode image. The findings from a subsequent
biopsy showed fibrocystic change and periductal inflammation. Dotted
lines indicate measured lesion diameters: 1 = 7.16 mm; 2 = 5.55 mm; 3
= 5.02 mm; and 4 = 4.29 mm. Distance ratio was calculated as 5.02
7.16 = 0.70.

Fibroadenoma
Fibroadenoma. (a) B-mode US image of the left breast shows a
lobulated hypoechoic lesion that is taller than wide, with posterior
acoustic shadowing.
(b) US elastogram, however, shows the lesion to be smaller than on
the B-mode image. The findings from biopsy revealed a fibroadenoma.

Fibroadenoma with elasticity score of 1 in 51-year-old woman. US images were
obtained in transverse plane. Left: On conventional B-mode image, lesion was
classified as BI-RADS category 2.
Right: On elasticity image, the entire hypoechoic lesion was evenly shaded green,
as was the surrounding breast tissue.
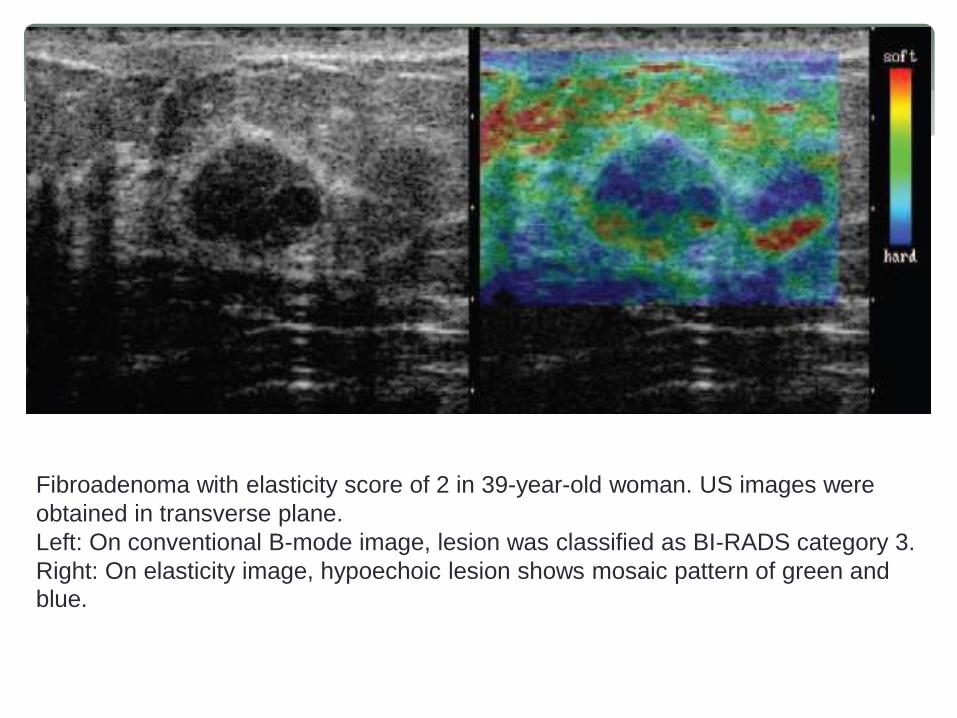
Fibroadenoma with elasticity score of 2 in 39-year-old woman. US images were
obtained in transverse plane.
Left: On conventional B-mode image, lesion was classified as BI-RADS category 3.
Right: On elasticity image, hypoechoic lesion shows mosaic pattern of green and
blue.

Invasive Ductal Carcinoma
Invasive ductal carcinoma. The breast lesion measures smaller on the B-mode
US image (a) than on the US elastogram (b) in the transverse plane. The
lesion is too large to measure accurately in the anteroposterior plane; dotted
lines indicate measurements of the lesion diameter: 21.9 34.2 mm in a and
24.9 29.6 mm in b. In addition, the lesion is stiffer than the surrounding
tissues.

invasive ductal carcinoma typically is appreciably darker than normal
tissues or benign lesions and is substantially larger on the elastogramthan on B-mode US images
Nonscirrhous type invasive ductal carcinoma with elasticity score of 4 in 29-year
old woman. US images were obtained in transverse plane.
Left: On conventional B-mode image, lesion was classified as BI-RADS category
5.
Middle: On elasticity image, the entire hypoechoic lesion was blue.
Right: Pathologic section of lesion is shown. (Hematoxylin-eosin stain; original
magnification,1.)
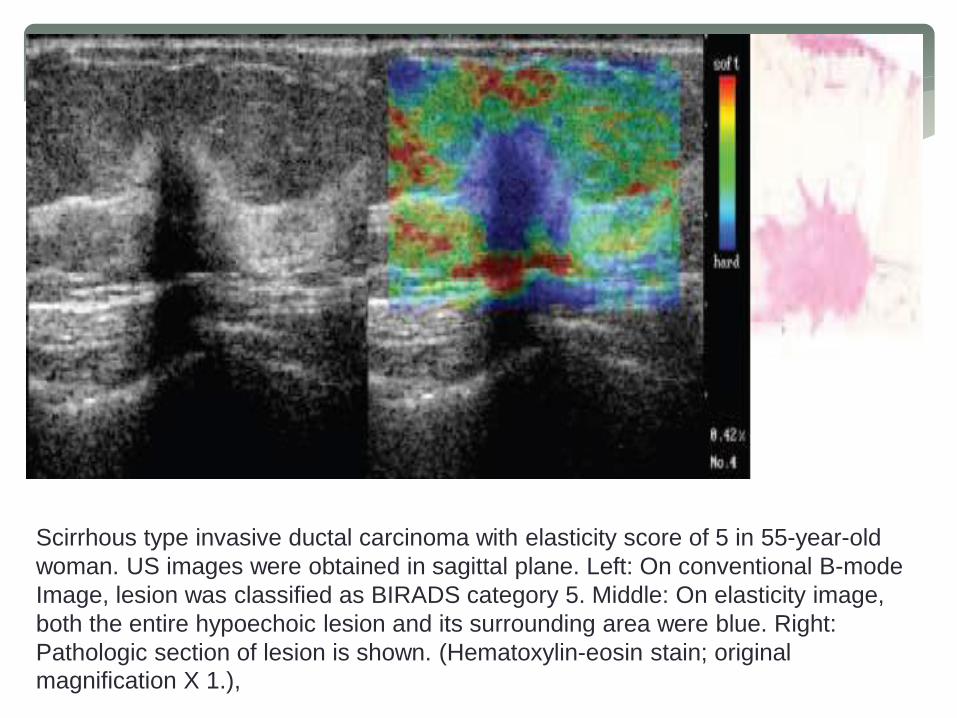
Scirrhous type invasive ductal carcinoma with elasticity score of 5 in 55-year-old
woman. US images were obtained in sagittal plane. Left: On conventional B-mode
Image, lesion was classified as BIRADS category 5. Middle: On elasticity image,
both the entire hypoechoic lesion and its surrounding area were blue. Right:
Pathologic section of lesion is shown. (Hematoxylin-eosin stain; original
magnification X 1.),

Lobular carcinoma in situ with elasticity score of 3 in 46-year-old woman. US
images were obtained in transverse plane. Left: On conventional B-mode image,
lesion was classified as BI-RADS category 3. Right: On elasticity image, the
central part of the hypoechoic lesion was blue, and the peripheral part of the lesion
was green.

Lymph node with metastatic involvement. (a) B-mode US image demonstrates a
lymph node that appears benign on the basis of its reniform shape and
echogenicity. Dotted line indicates a lesion diameter of 20.4 mm. (b)
Corresponding US elastogram, however, shows a stiff area that turned out to be
a metastatic focus (arrows). Dotted line indicates a lesion diameter of 24.0 mm.
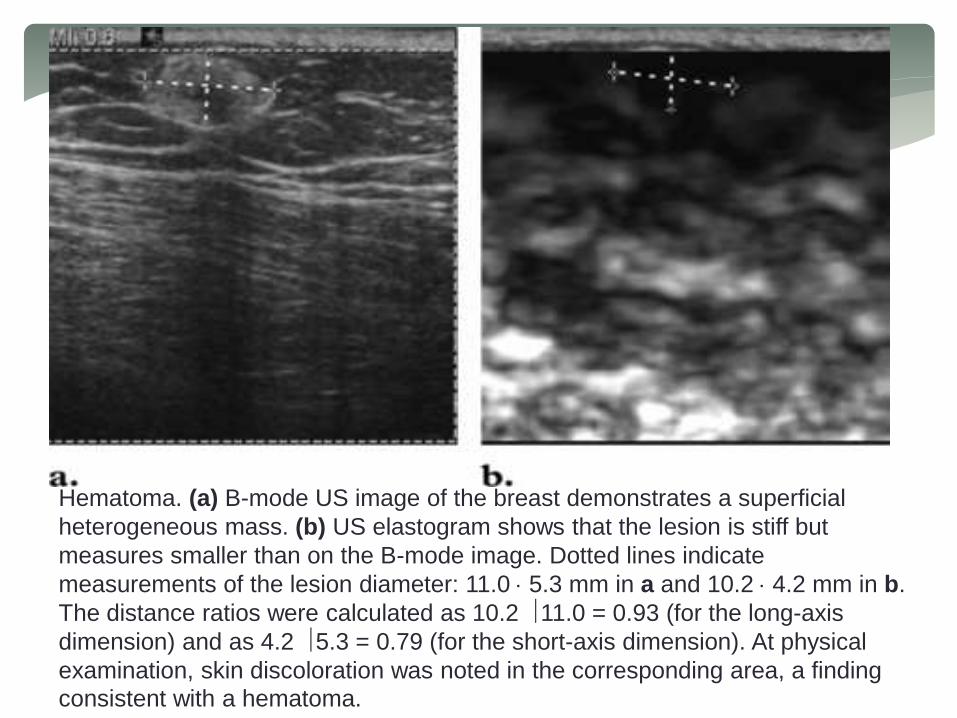
Hematoma. (a) B-mode US image of the breast demonstrates a superficial
heterogeneous mass. (b) US elastogram shows that the lesion is stiff but
measures smaller than on the B-mode image. Dotted lines indicate
measurements of the lesion diameter: 11.0 5.3 mm in a and 10.2 4.2 mm in b.
The distance ratios were calculated as 10.2 11.0 = 0.93 (for the long-axis
dimension) and as 4.2 5.3 = 0.79 (for the short-axis dimension). At physical
examination, skin discoloration was noted in the corresponding area, a finding
consistent with a hematoma.

Prostate US Elastography
Prostate Cancer
Endorectal US continues to be the most commonly used imaging modality for
assessing the prostate; however, it is relatively inaccurate for cancer
detection. Endorectal US has a role in guiding prostate biopsies. Magnetic
resonance imaging and computed tomography are mainly implemented for
staging.
At B-mode US, most prostate cancers are hypoechoic, but many are
isoechoic, and a few are hyperechoic. As a result, the overall sensitivity of
endorectal US for prostate cancer detection is about 50%. The added use of
Doppler imaging increases the detection rate by only 5%. In contrast,
endorectal real-time elastography enables the diagnosis of prostate cancer
with a reported accuracy of 76%. However, the major role of elastography is
to improve the results of image-directed biopsy and therapy, compared with
the use of endorectal US alone.

Prostate adenocarcinoma with Gleason score of 6/10. (a) Sagittal endorectal US
Image with the prostate gland outlined shows no discrete lesion (arrow). (b) Sagittal
US elastogram shows strong vibration in the normal prostate tissue and also an area
of no vibration (arrow) anteriorly from the midportion of the gland to the base. (c)
Photomicrograph (hematoxylineosin stain) of a transverse histologic section that
included the corresponding lesion (arrow) at the base shows good correlation, with
the deficit noted anteriorly on the elastogram through the selected plane of section
(dashed line in a and b) in the midportion of the gland. The smaller lesion outlined in
blue in c is outside the plane of the elastogram.

Prostate adenocarcinoma with Gleason score of 9/10, involving two of two core
samples and approximately 60% of the tissue. (a) Right parasagittal conventional
US image shows that the lesion (arrow) is mildly hypoechoic. (b) Corresponding
right parasagittal US elastogram better depicts the lesion (arrow) as a dark area of
low strain. (c) Photomicrograph (hematoxylin-eosin stain) of a transverse histologic
section (dashed line in a and b indicates the plane of section) shows that there is
good size correlation between the histologic extent of the lesion (arrow) and the
lesion extent delineated on the elastogram.

Benign Prostatic Hyperplasia
The appearance of benign prostatic hyperplasia at endorectal US is variable but
usually consists of a heterogeneous hypoechoic area or areas in the transitional
zone .
In general, foci of benign prostatic hyperplasia have elastic moduli (stiffness)
that are an order of magnitude greater than those of normal prostate tissues but
are less than those of prostate carcinomas. As a result,on elastograms, benign
prostatic hyperplasia will appear darker than normal prostate tissue.
However, the difference between benign prostatic hyperplasia and prostate
carcinoma can be difficult to discern because benign prostatic hyperplasia also
appears darker than the background tissues. Consequently, benign prostatic
hyperplasia can represent a false-positive finding for cancer .

Benign prostatic hyperplasia. (a) Transverse B-mode US image demonstrates a
mildly prominent isoechoic area (arrow) in the central zone of the prostate gland.
(b) Corresponding transverse elastogram shows that
the area of benign prostatic hyperplasia (arrow) is more conspicuous. The lesion
demonstrates greater stiffness than the surrounding normal prostate tissue.
(c) Photomicrograph (hematoxylin-eosin stain) shows that there is good
correlation between the extent of the lesion (arrow) on the histologic section
and the lesion extent on the elastogram.

Elastography of Thyroid Lesions
A thyroid lesion may have different levels of stiffness within it, depending
on the cellularity and composition of the nodule. Information from these
elastograms helps assess the relative stiffness of the lesion compared
with its surrounding tissues and within itself. However, this information
cannot be used to compare the stiffness of thyroid lesions from different
patients because strain changes with applied compression.
When pulsation of the carotid artery is used as the compression source,
strain near the carotid artery can indicate the amount of compression
applied by carotid arterial pulsation.
Because the thyroid gland is located between the trachea and the carotid
artery, lateral expansion of the carotid artery during systole compresses
the thyroid gland against the trachea. As a result, the thyroid gland
expands in the anteroposterior direction, that is, in the direction of the US
probe (beam axis).

Because US is sensitive to detecting motion along the beam axis,
deformation of the thyroid gland in this direction can be readily detected.
Because the thyroid stiffness index is a ratio between the carotid strain
and the strain in the thyroid nodule, the varying strain from change in the
blood pressure did not affect the ratio.

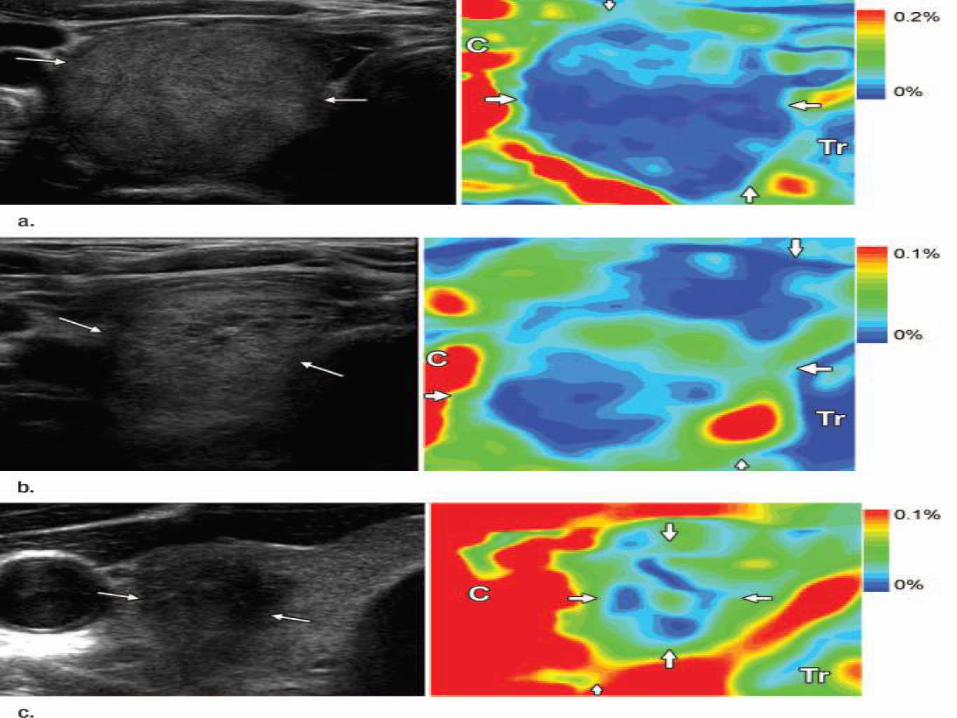
Example of selecting region of interest (ROI) to compute thyroid stiffness index
within a nodule.

(a) Transverse US image showing a nodule (arrows) within thyroid gland (Tg),
the trachea (Tr), and the carotid artery (C).
(b) Combined US image and elastogram of this nodule; average strain of
stiffest region inside a thyroid nodule (ROI #1) is used as denominator of
thyroid stiffness index.
(c) Combined US image and elastogram of this nodule with a different scale to
better visualize the areas of highest strain near the carotid artery. Average
strain of the highest-strain regions near the carotid artery (ROI #2, ROI #3) is
used as numerator of thyroid stiffness index. Range of the color map is
adjusted to better visualize ROIs.

(a) Left: Transverse US image in a 62-year-old man shows a predominantly solid
nodule (arrows) occupying entire thyroid gland. Right: Elastogram shows the
predominantly homogeneous appearance within nodule, with small areas of
decreased stiffness (blue indicates stiffer part; red indicates softer part). This was
diagnosed as a follicular lesion at FNA.
(b) Left: Transverse US image in a 60-year-old woman shows a predominantly
solid nodule with small cystic areas (arrows). Right: Elastogram shows the
heterogeneous appearance within nodule. This was diagnosed as a nodular goiter
at FNA.
(c) Left: Transverse US image in a 36-year-old woman shows a hypoechoic
nodule (arrows) with irregular borders and tiny punctate calcifications in it. Right:
Elastogram at same level shows stiff areas within lesion (blue region). This was
diagnosed as papillary carcinoma at FNA. Ccarotid artery; Trtrachea.

Ultrasound elastography for musculoskeletal applications
Disease in the musculoskeletal system results in alterations to its
biomechanical properties. Although EUS techniques have been
extensively employed for in vitro research of muscle and tendon
biomechanics since the early 1990s, the recent introduction of EUS
into commercially available ultrasound systems has driven research
activity towards potential clinical applications of this novel method in the musculoskeletal system

(a) (b)
(c) (d)

(a, b) Longitudinal and (c, d) transverse free-hand strain elastograms of the
middle third of asymptomatic Achilles tendons (T) showing the two distinct
ultrasound elastography patterns of normal tendons.
Type 1 (a, c) tendons appear homogeneously stiff, (green/blue) with no distinct
soft (red) areas.
Type 2 (b, d) tendons appear considerably inhomogeneous with soft (red) areas
(longitudinal bands or spots), which did not correspond to any changes in B-
mode ultrasound.
The retro- Achilles fat appears as a mosaic of green, red and blue. Note the red
areas at the lateral and medial sides of the tendon in the transverse plane (c, d),
corresponding to an artefact, secondary to difficulty in stabilising the hand-held
transducer.

(a) (b)
(c)

(a) Longitudinal colour Doppler ultrasound image and (b) free-hand strain
elastogram of a 23-year-old recreational runner with insertional Achilles
tendinopathy. There is hypoechogenicity and neovascularity at the tendinopathic
area [asterisk in (a)], which appears softer (red) compared with the stiff
(blue/green) normal-appearing remaining tendon (T). The retro-
Achilles fat appears as a mosaic of various levels of stiffness. (c) The
elastogram of a normal (asymptomatic) Achilles tendon calcaneal insertion is
presented for comparison. The retrocalcaneal bursa (asterisk) appears
considerably softer (red) compared with the stiffer tendon (green/yellow). Note
the presence of soft (red) foci beneath the calcaneal bone (C), which correspond
to artefacts. LT, left.

(a) (b)
(c) (d)

Longitudinal shear wave elastograms of a normal (a) Achilles and (c) patella
tendon, as well as (b, d) a case of distal patella tendinopathy in a 23-year-old
football player.
The elasticity qualitative and quantitative scale is presented at the upper right
corner of the images. Measurements (mean, minimum, maximum and
standard deviation) within the circular region of interest (ROI) are presented in
kilopascals ranging from 0 (dark blue) to 300 (dark red).
(a, c) The normal Achilles and patella tendons (T) appear as homogeneous
stiff (red) structures, as opposed to fat, which is homogeneously soft (blue).
(a) The mean stiffness of a representative area at the mid-portion of the
Achilles free tendon is 300 kPa. (d) In the case of distal patella
tendinopathy, the tendinopathic area appears hypoechoic with
neovascularity (asterisk).
(b) In the corresponding elastogram, the abnormal area appears softer (blue;
mean elasticity 40.94 kPa) compared with the stiffer normal tendon (red;
mean elasticity 261.16 kPa). The small amount of fluid in the deep infrapatella
bursa appears softer than the tendinopathic area (blue, mean elasticity 34.38
kPa).

(a) (b)
Axial free-hand strain elastograms of (a) normal relaxed calf muscles and (b) vastus
lateralis muscle.
The medial and lateral heads of gastrocnemius (M and L, respectively), as well as
the vastus lateralis (VL), appear as a mosaic of intermediate or increased stiffness
(green or blue colour, respectively), with scattered softer (red) areas near muscle
boundaries. The subcutaneous fat appears soft (red/yellow). The homogeneous stiff
appearance of soleus (S) in (a) is probably because of inadequate B-mode and
ultrasound elastography data due to increased depth.

ultrasound elastography for diffuse liver disease
Accurate assessment of the degree of liver fibrosis is important for
estimating prognosis and deciding on an appropriate course of
treatment for cases of chronic liver disease (CLD) with various
etiologies. Because of the inherent limitations of liver biopsy, there is a
great need for noninvasive and reliable tests that accurately estimate
the degree of liver fibrosis. Ultrasound (US) elastography is considered
a non-invasive, convenient, and precise technique to grade the degreeof liver fibrosis by measuring liver stiffness.

Transient elastography of a normal and a cirrhotic patient.
A

B

The displacement M-mode image located in the center of the monitor shows
axial displacement as a function of depth (y-axis) and time
(x-axis). In the healthy patient
(A), the shear wave is relatively slow and the liver stiffness is low. However,
in the patient with cirrhosis (B), the shear wave can propagate more rapidly
though a hard tissue, and the time-depth gradient is very steep. The
controlled attenuation parameter is displayed, which is known to correlate with the fatty liver severity

Acoustic radiation force impulse imaging of a normal and a cirrhotic
patient.
The cylindrical region of interest (ROI) in the middle of the
ultrasonogram was used as the sample volume for the measurement of
stiffness. Instead of Young modulus, the propagating velocity of the
shear wave is displayed. Although the grayscale ultrasonograms are
similar to each other, the propagating velocity is different: 1.2 m/sec in the healthy patient (A) and 1.6 m/sec in the patient with cirrhosis (B)
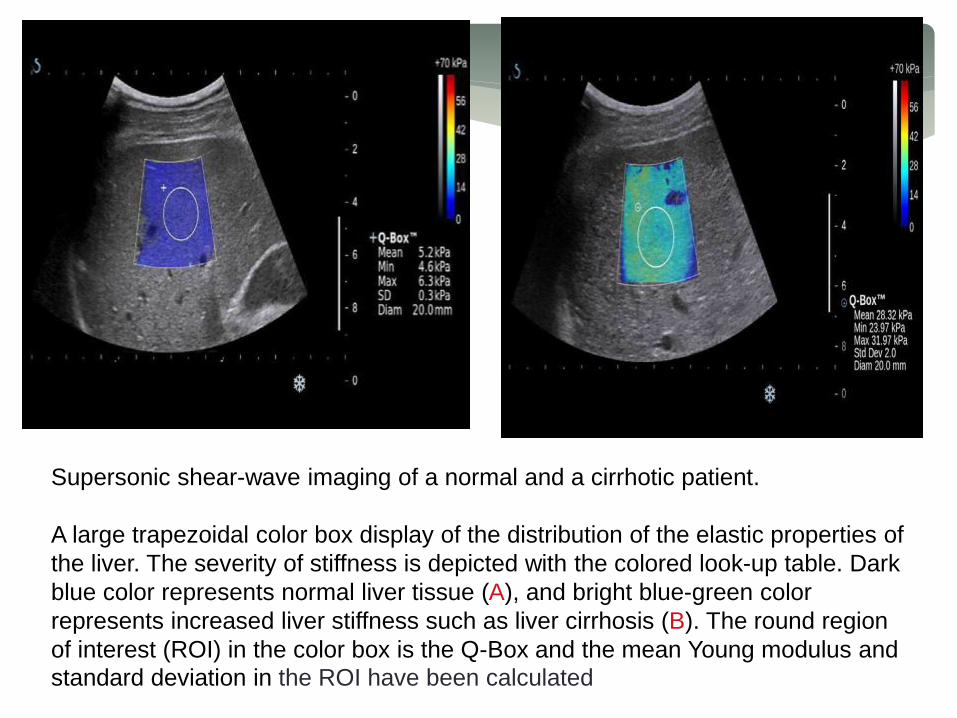
Supersonic shear-wave imaging of a normal and a cirrhotic patient.
A large trapezoidal color box display of the distribution of the elastic properties of
the liver. The severity of stiffness is depicted with the colored look-up table. Dark
blue color represents normal liver tissue (A), and bright blue-green color
represents increased liver stiffness such as liver cirrhosis (B). The round region
of interest (ROI) in the color box is the Q-Box and the mean Young modulus and
standard deviation in the ROI have been calculated

A B
C D

Acute exacerbation of hepatitis B virus-induced hepatitis.
Grayscale ultrasonography (A) shows mild parenchymal coarseness of
the liver; the liver stiffness is 10.3 kPa according to the shear wave
elastography (B). Six months later, the patients recovered from liver
function deterioration. The grayscale ultrasonographic feature (C) is
similar to the previous study, but the liver stiffness decreases to 6 kPa(D).


Elastography in the Differential Diagnosis of Enlarged Cervical Lymph Nodes
Drawings show typical diagrammatic appearance of five patterns of lymph nodes. Elastographic
patterns were determined on distribution and percentage of lymph node area having high elasticity
(hard): pattern 1, absent or small hard area; pattern 2, hard area < 45% of lymph node; pattern 3,
hard area ≥ 45%; pattern 4, peripheral hard and central soft areas; pattern 5, hard area occupying
entire lymph node. Increasing tissue hardness appears in ascending order as red, yellow, green,
and blue.
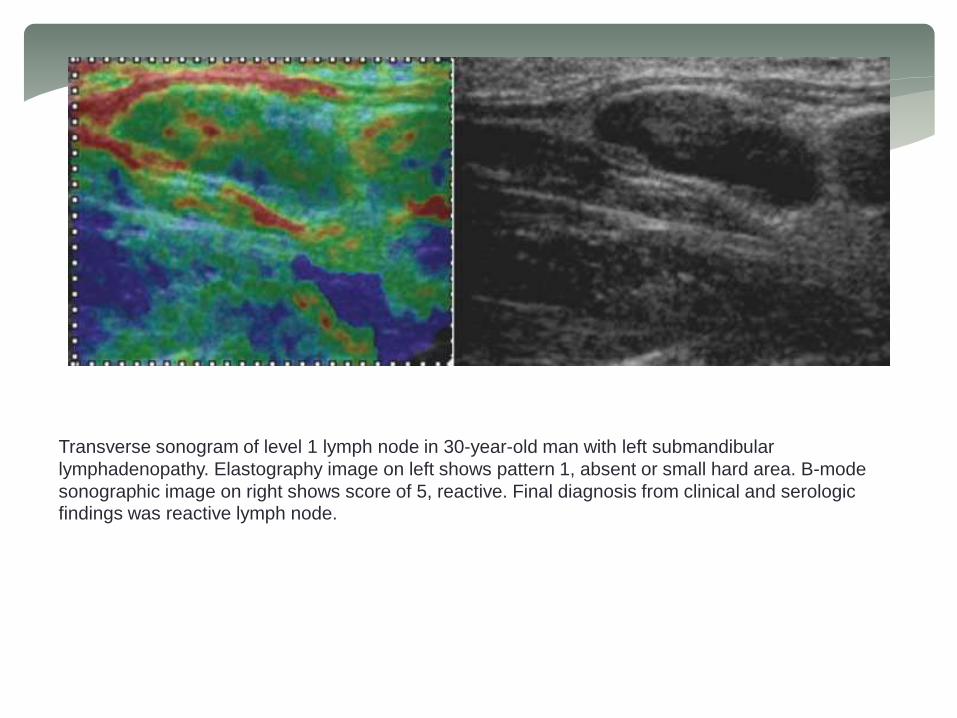
Transverse sonogram of level 1 lymph node in 30-year-old man with left submandibular
lymphadenopathy. Elastography image on left shows pattern 1, absent or small hard area. B-mode
sonographic image on right shows score of 5, reactive. Final diagnosis from clinical and serologic findings was reactive lymph node.

Longitudinal sonogram of level 2 lymph node in 33-year-old woman with left posterior
auricular lymphadenopathy. Elastography image on left shows pattern 2, hard area <
45% of node. B-mode sonographic image on right shows score 5, reactive. Final
diagnosis from clinical and serologic findings was reactive lymph node.

Transverse sonogram of level 2 lymph node in 79-year-old man with laryngeal carcinoma. Elastography image on left shows pattern 3, hard area ≥ 45%. B-mode sonographic image on right shows score 7, metastatic. Final diagnosis by histopathology was metastatic lymph node.

Longitudinal sonogram of level 5 lymph node in 52-year-old man with nasopharyngeal carcinoma. Elastography image on left shows pattern 4, peripheral hard and central soft areas. B-mode sonographic image on right shows score 7, metastatic. Final diagnosis by CT was metastatic lymph node.

MR ELASTOGRAPHY
Following are the some of the current applications of MRE which are being investigated :
Liver MR Elastography—Magnetic resonance elastography has been widely investigated for the diagnosis of hepatic diseases and is currently used in clinical practice for fibrosis and cirrhosis assessment where the stiffness of the diseased liver is significantly higher than normal liver tissue stiffness
Clinical hepatic MRE is performed at a frequency of 60 Hz using pneumatic-based pressure-activated drivers. Wave data are acquired with four phase offsets and a modified direct-inversion algorithm with multiscalecapabilities is used for the estimation of the liver stiffness.

MRE-derived stiffness of healthy liver tissue at 60 Hz compared to the stiffness of
liver tissue at various stages of fibrosis. The stiffness increases gradually with the
progression of the fibrosis. A cutoff of 2.93 kPa well differentiates the healthy and
fibrotic livers.
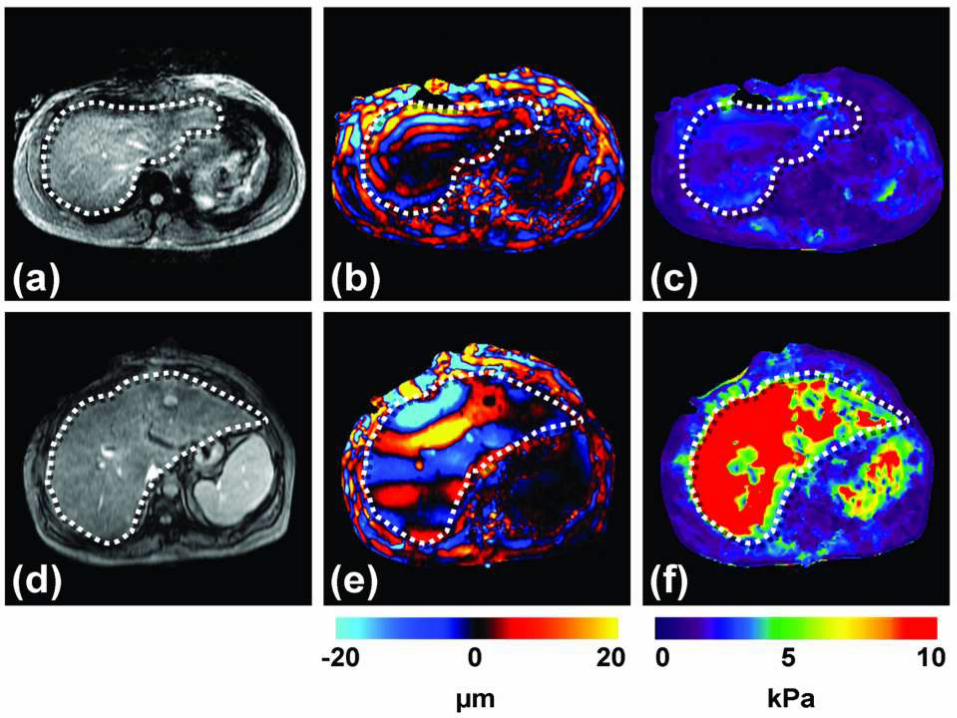

Hepatic MRE
Results are shown from clinical hepatic MRE exams of a patient with a normal
liver (top row) and a patient with a cirrhotic liver. (a,d)
Conventional abdominal MR magnitude images of the two patients, showing no
significant difference between the two livers. (b,e)
Wave images from the MRE acquisition at 60 Hz showing shear waves with a
shorter wavelength in the first patient, and a substantially longer wavelength in
the second patient. (c,f)
The corresponding elastograms indicating that the two livers were normal (1.7
kPa) and cirrhotic (18.83 kPa), respectively.

MRE is also being investigated as a means to characterize hepatic tumors and it
has been found that malignant liver tumors have significantly greater mean shear
stiffness than benign tumors and normal liver tissue and a cutoff value of 5 kPa
can differentiate malignant tumors from benign tumors and normal liver
parenchyma.
Breast MR Elastography—Another application of MRE that is being
investigated with great interest is for the assessment of breast cancer .
Breast tumors are known to be typically stiffer than benign lesions and normal
breast tissue . Manual palpation is a recommended part of routine screening for
breast cancer and helps in the detection of these hard masses.
Contrast-enhanced MR imaging (CE-MRI) has proven to have a very high
sensitivity for the detection of tumor nodules, but the specificity of the technique
can be a problem leading to numerous false positives and unnecessary biopsies.
MRE is being investigated as a complementary technique to CE-MRI to provide
additional information about these suspicious regions and the combined
technique has shown promise to increase diagnostic specificity

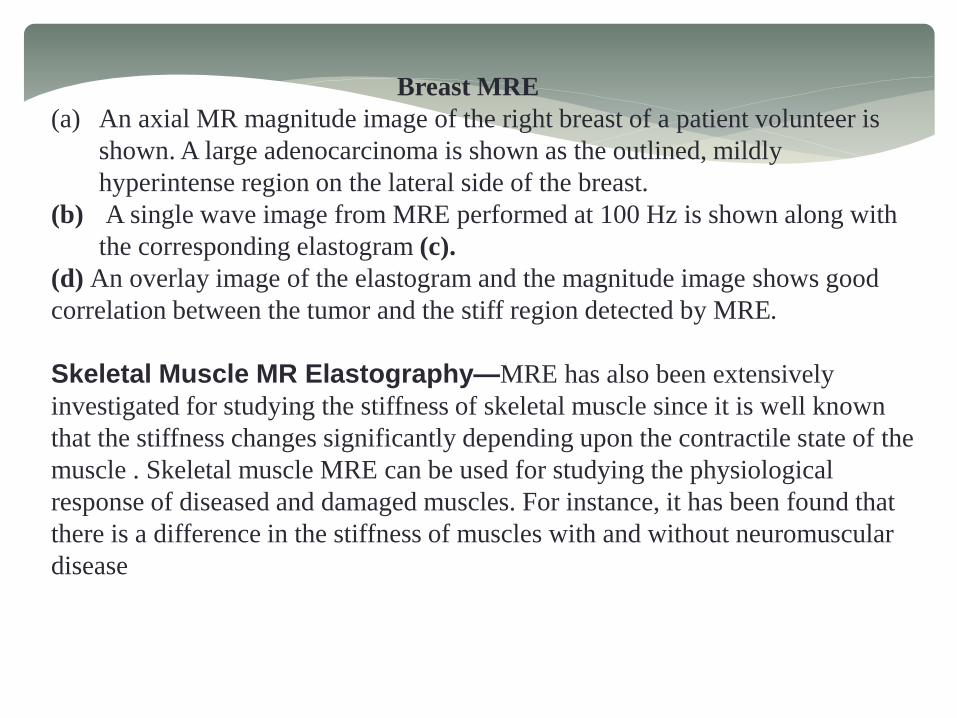
Breast MRE
(a) An axial MR magnitude image of the right breast of a patient volunteer is
shown. A large adenocarcinoma is shown as the outlined, mildly
hyperintense region on the lateral side of the breast.
(b) A single wave image from MRE performed at 100 Hz is shown along with
the corresponding elastogram (c).
(d) An overlay image of the elastogram and the magnitude image shows good
correlation between the tumor and the stiff region detected by MRE.
Skeletal Muscle MR Elastography—MRE has also been extensively
investigated for studying the stiffness of skeletal muscle since it is well known
that the stiffness changes significantly depending upon the contractile state of the
muscle . Skeletal muscle MRE can be used for studying the physiological
response of diseased and damaged muscles. For instance, it has been found that
there is a difference in the stiffness of muscles with and without neuromuscular
disease

Skeletal muscle MRE
(a) A sagittal MR image of the calf soleus muscle with the location of the
driver indicated by the arrow is shown. 100-Hz MRE wave images of the
muscle are shown while exerting 0 (b), 5 (c) and 10 N/m (d) of force.
The increase in the wavelength (and thus stiffness) with
the increase in muscle force is easily visible and is indicated by the double
sided arrows.
Brain MR Elastography—Assessment of the mechanical properties of
brain tissue with MRE is another area of significant research and clinical
interest due to the diagnostic potential of brain tissue stiffness information
as it may be related to diseases like Alzheimer’s disease, hydrocephalus, brain
cancer and multiple sclerosis. While it would be difficult to use ultrasound
based approaches to noninvasively assess brain mechanical properties, MRE is
well suited for this application.


Brain MRE
(a) Shown is an axial MR magnitude image of the brain showing white matter, gray
matter, and cerebrospinal fluid. (b) A single wave image from MRE performed
at 60 Hz. (c) The corresponding elastogram is shown and a good correlation
between the magnitude image and the stiffness estimate is evident.
MR Elastography for Visualizing Anatomy—The primary applications of
MRE that have been developed have focused on the study of the mechanical
properties of different tissues. However, the capability of MRE to measure the
displacement of tissues has also been investigated to address other clinical questions.
Such applications include a shearline imaging technique designed to investigate the
functionality of slip interfaces and a vibration imaging technique used to localize the
functional compartments of the forearm flexor muscles

As an example of these applications, the vibration imaging technique is introduced
here, the goal of which is to locate the finger-specific functional compartments of
the extrinsic forearm flexor muscles that partly control the flexion of the
interphalangeal joints of the index, middle, ring and little fingers.
Even though these flexor muscles (flexor digitorum superficialis, FDS and flexor
digitorum profundus, FDP) do not possess anatomically distinct compartments,
they can exert almost independent action on specific fingers through selective
activation of functional compartments specific for each finger.
The knowledge of the location and boundaries of these segments is useful for
localizing techniques like MR spectroscopy and biopsy, but is difficult to obtain
currently.
With the proposed vibration imaging technique based on MRE principles, this can
be achieved by vibrating a finger of interest independently of the others and
measuring the amount of motion within the forearm musculature that is transferred
through the structurally connected tendons.

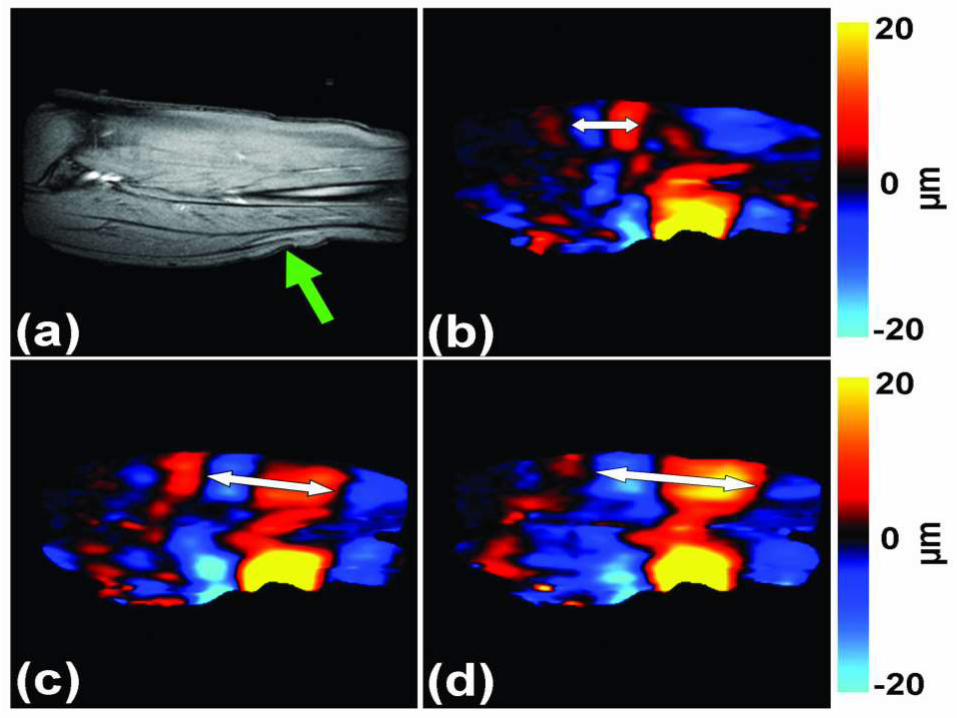
Functional compartments of the flexor muscles
(a) MR magnitude image of the right forearm of a healthy volunteer.
(b) An example wave image obtained using MRE motion encoding of tissue
vibrations in the forearm induced by selectively vibrating the ring finger at
90 Hz.
(c) An amplitude map obtained from wave images indicating localized regions
of higher displacement corresponding to the compartments of the flexor and
extensor muscles (arrows).
(d) A phase map obtained from the wave images indicating that the
compartments of the flexor and extensor muscles of the activated finger are
moving out of phase with each other.


In vivo difficulties:
•Uncontrolled Motion–Respiratory
–Cardiac
–Patient
•Requirement–Fast Acquisition
RECENT ADVANCES AND FUTURE PROSPECTS
• Intracardiac Myocardial elastography• Acute Pancreatitis risk assessment on admission• Pancreatic Masses and chronic pancreatitis• Renal elastography• Obstretics & Gynaecology e.g. Cervical stiffness, Prediction of PTL,
Gynaecological cancer etc.• Vascular imaging, Non-Invasive Vascular Elastography• Optical Coherence Elastography• Organ transplantation......and many more……

CONCLUSION
Elastography is an important research field It has also been evaluated
in the clinical field for more than 10 years. It has provided a new
feature to assess tissue stiffness and has shown that tissue elasticity
is of great value for diagnosis.
Indeed the variation of the Young’s modulus in biological tissues offers
a contrast that is potentially more interesting than conventional
ultrasound.
If the elastography techniques developed in research laboratories
start making their commercial appearance, they are not all
quantitative or operator independent, the word ‘‘elastography’’ can
hide very different physical phenomena. It is therefore important to
know how to decrypt the underlying physics of each elastography
method in order to understand their advantages and physical
limitations.
Shear wave based techniques have strong advantages over quasi-
static techniques, as they are more reproducible, quantitative, rely on
automatic shear wave generation and provide good elasticity contrast.

The availability of true quantitative numerical data allows adjustment
of the dynamic range to optimize the visualization of structures. These
advantages should certainly lead to new applications of shear wave
elasticity imaging, not only for diagnosis but also for follow-up.
The real-time capability of some of these SW techniques also allows
the development of 3D elastography imaging that should facilitate the
clinical use for detection, therapy planning and monitoring in the
routine clinical practice.
Finally, the integration of elastography techniques in conventional
ultrasound systems open the door for routine application during
ultrasound examination and will allow information fusion with other imaging techniques to strengthen their diagnostic performance.

REFERENCES AND FURTHER READING
• Ultrasound elastography: Principles and techniques BY J.-L. Gennisson∗, T. Deffieux, M. Fink, M. Tanter : Diagnostic and Interventional Imaging (2013) 94, 487—495
• Tissue Elasticity Imaging BYJean Martial Mari Department of Medical Physics and Bioengineering,University College London
• Ultrasound elastography for musculoskeletal applications BY E E DRAKONAK, G M ALLEN and D J WILSON : The British Journal of Radiology, 85 (2012), 1435–1445
• MAGNETIC RESONANCE ELASTOGRAPHY: A REVIEW BY Yogesh K Mariappan, Kevin J Glaser, and Richard L EhmanClin Anat. 2010 July ; 23(5): 497–511
• Principles and clinical application of ultrasound elastography for diffuse liver disease BY Woo KyoungJeong, Hyo K. Lim, Hyoung-Ki Lee, Jae Moon Jo, YongsooKim : Ultrasonography 2014;33:149-160

• US Elastography ofBreast and Prostate Lesions BY Daniel T. Ginat, Stamatia V. Destounis, Richard G.Barr, Benjamin Castaneda, John G. Strang,Deborah J. Rubens : RadioGraphics2009; 29:2007–2016
• Differential Diagnosis of Thyroid Nodules with US ElastographyUsing Carotid Artery Pulsation BY Manjiri Dighe, Unmin Bae, Michael L. Richardson, Theodore J. Dubinsky Satoshi Minoshima, Yongmin Kim : Radiology: Volume 248: Number 2—August 2008
• Accuracy of Sonographic Elastography in the Differential Diagnosis of Enlarged Cervical Lymph Nodes: Comparison with Conventional B-Mode Sonography BY Farzana Alam, KumikoNaito, Jun Horiguchi, Hiroshi Fukuda, Toshihiro Tachikake, Katsuhide Ito : AJR 2008; 191:604–610
• RUMAC’s Diagnostic Ultrasound 4th Edition.

HOPE WE SEE ELASTOGRAPHY BEING DONE IN OUR DEPARTMENT SOON!!!!!


![Ultrasound elastography in neuromuscular and movement ......acoustic radiation force imaging (ARFI), and transient elastography (TE) [33]. 2.1. Ultrasound strain elastography Ultrasound](https://static.fdocuments.in/doc/165x107/5f02150f7e708231d4027b6b/ultrasound-elastography-in-neuromuscular-and-movement-acoustic-radiation.jpg)


