El Metro and the Impacts of Transportation System Integration in
43
El Metro and the Impacts of Transportation System Integration in Santo Domingo, Dominican Republic A Report for the United Nations Commission for Sustainable Development CSD‐18 May 2010 Based on Research for Global Foundation for Democracy and Development (GFDD) and Fundación Global Democracia y Desarrollo (FUNGLODE) Carl Allen Master in Public Policy and Urban Planning Candidate 2010 Harvard Kennedy School Cambridge, MA
Transcript of El Metro and the Impacts of Transportation System Integration in
El Metro and the Impacts of Transportation System Integration in Santo Domingo, Dominican Republic
A Report for the
United Nations Commission for Sustainable Development
CSD‐18
May 2010
Based on Research for Global Foundation for Democracy and Development (GFDD) and Fundación Global Democracia y Desarrollo (FUNGLODE)
Carl Allen Master in Public Policy and Urban Planning Candidate 2010
Harvard Kennedy School Cambridge, MA
0
TABLE OF CONTENTS Introduction ............................................................................................................................................................................... 2
Methodology ............................................................................................................................................................................... 2
Part I: Santo Domingo and Its Transportation Issues ............................................................................................................ 3
The Maximo-Gómez Corridor .............................................................................................................................. 4
The “Master Plan” ................................................................................................................................................. 4
Planning for Los Rutas Alimentadoras ................................................................................................................ 5
Part II: Transport Integration and sustainable development ................................................................................................ 7
Part III: Analysis of Metro Line One ....................................................................................................................................... 8
System Description ................................................................................................................................................. 8
Ridership ............................................................................................................................................................... 10
Costs of the Metro System ................................................................................................................................... 12
Primary Benefits of Metro Line One .................................................................................................................. 14
Metro Benefit/Cost Analysis ............................................................................................................................... 19
Other Real (But Hard-to-Quantify) Benefits of the Metro ............................................................................... 19
Other Potential (But More Speculative) Benefits .............................................................................................. 21
Part IV: Opportunities and Risks of Feeder Bus Integration .............................................................................................. 22
Additional Primary Benefits ............................................................................................................................... 22
Other Potential Impacts ...................................................................................................................................... 24
Integration Risks .................................................................................................................................................. 25
Conclusions ............................................................................................................................................................................... 26
Appendix A: Survey Forms and Results ................................................................................................................................ 27
Appendix B: Ridership Estimation ........................................................................................................................................ 34
Sources ...................................................................................................................................................................................... 37
2
INTRODUCTION Santo Domingo’s rapid growth and largely informal public transportation system have left the city with inadequate capacity, substantial congestion, and pollution and safety problems. The city’s system inefficiencies and limited accessibility to job and population centers are typical in developing countries.
In response to these issues, the Dominican Republic is undertaking an extensive transportation infrastructure, reform and integration project with ambitious spirit and urgency. The country’s efforts are consistent with the policy guidelines set forth in Agenda 21 – to recognize the important role transportation plays in poverty alleviation while mitigating its adverse externalities on health and the environment. The country’s leadership is committed to playing its due part in international efforts to achieve the sustainability objectives the global community has set forth – while ensuring that the Dominican Republic remains on the path to growth and prosperity.
Metro Line One opened in February 2009 and is the first phase of Dominican President Leonel Fernández’s “Master Plan” for sustainable transportation in the city. The Metro offers substantial time savings and mobility to users and reduces congestion externalities in its corridor. In addition, there is a large a set of potential secondary benefits which the Metro has brought about – including pollution and accident reductions, local economic stimulus and technology transfer. But these are speculative in some cases and difficult to quantify. Generally speaking, much ridership growth is needed in the coming years for the combined benefits of the project to outweigh the tremendous costs.
The “pilot plan” of feeder bus routes currently being implemented at the northern end of Metro Line One has great potential to enhance overall system ridership – thereby adding to time-savings, accessibility and congestion reduction benefits – but there are a great many unknowns and risks inherent in the project. Besides general uncertainty about the effect on ridership, the biggest risk is unsuccessful negotiation with the existing bus operators in Santo Domingo. Existing operators have a tremendous interest in maintaining the status quo and they have the ability to greatly disrupt traffic in the city if they are provoked.
There are also risks inherent in making design changes to the existing transportation system of services and routes. Among these are a (real and perceived) degradation of service quality, imposition of transfers and indirect routing.
In the final analysis, it is clear that Metro Line One in Santo Domingo making progress towards the sustainable development aims of the Dominican Government. With careful integration of the feeder bus system and a continued focus on achieving ridership growth, the benefits of the Metro – to the people of Santo Domingo and to the environment – will surely be enhanced.
METHODOLOGY The analysis presented here relies on first-hand field work conducted in the summer of 2009 and January 2010 – including surveys of passengers, students, and local businesses –, a review of relevant transport economics literature, a review of Dominican media sources from 2004 to the present and interviews with experts and public officials.
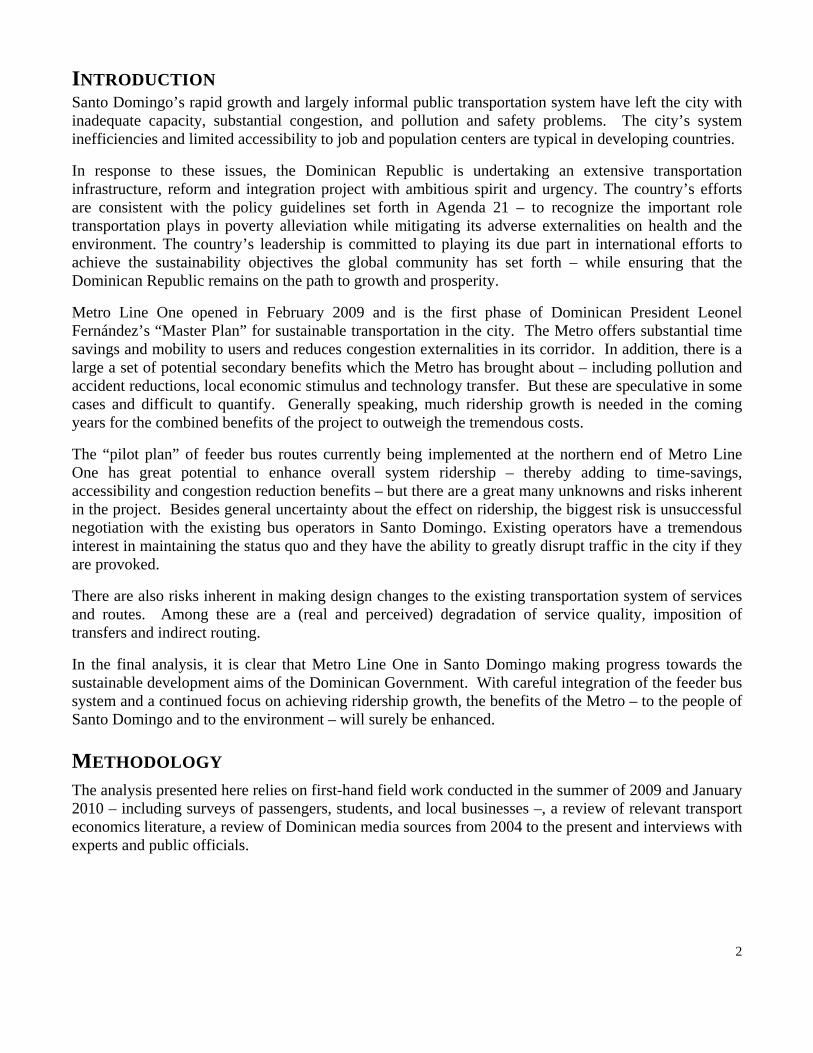
PART I: SANTO DOMINGO AND ITS TRANSPORTATION ISSUES Up until the late twentieth century, Santo Domingo was characterized by slow growth. And most of the country’s population lived in rural areas (Cajiao et al, 2008). Since 1956, the size and population of the metropolitan area have grown from about 58 km2 (22.4 mi2) and 370,000 people to an area of over 300 km2 (116 mi2) and an estimated population of just under 3 million. The population growth rate has averaged 1.9% annually since 2000 (ONE, 2010). Employment growth in Santo Domingo has also been rapid, increasing 16% from 2003 to 2008 – from 1,050,000 to 1,217,000 jobs (Cajiao et al, 2008).
IMAGE 1: SANTO DOMINGO GROWTH MAP
In addition to population growth and development sprawl, GDP growth of 7% per year from 2003 to 2007 (Geaneotes and Lansberg-Rodriguez 2009) has spurred a country-wide annual increase in private automobiles on the road of 4.5% and an annual increase in total motorized vehicles of over 8.25% from 2000 to 2008 (ONE, 2009). Physical sprawl and motorization in Santo Domingo are mutually reinforcing - causing increased numbers of trips, increased trip lengths, and further “militat[ing] against adequate public transport service supply” and generating more auto dependence (World Bank, 2002).
In Santo Domingo, there was an excess of 3 million motorized trips made every day in 2004. 280,000 of these motorized trips occurred during the peak hour – and over 70% (196,000) of these were on some form of public transit (OPRET, 2004). The existing “public” transport system in Santo Domingo is comprised of an assortment of modes, only a few of which are actually publically owned. Before the Metro was built, the national bus service, OMSA, was the only true public intra-urban system in Santo Domingo. OMSA provides service on voladores (high-capacity buses carrying around 76 passengers) for between 1.8 million and 2.9 million passengers per month (between 60,000 and 93,000 passengers per day) and keeps from 110 to 165 buses in operation each month (OMSA, 2009).
The remainder of the public transit system is based on privately-owned “micro-buses” which hold between 7 and 15 passengers, guaguas (“mini-buses”) which carry 16 to 30 and conchos or carro publicos (public cars) which fit 5 or 6 passengers.
3
Congestion is probably the most widely felt problem in the city’s transport system. It is the result of the growth in private automobiles, sprawl, and increased trips in the city, together with a public vehicle fleet that is inefficient and in over-supply.
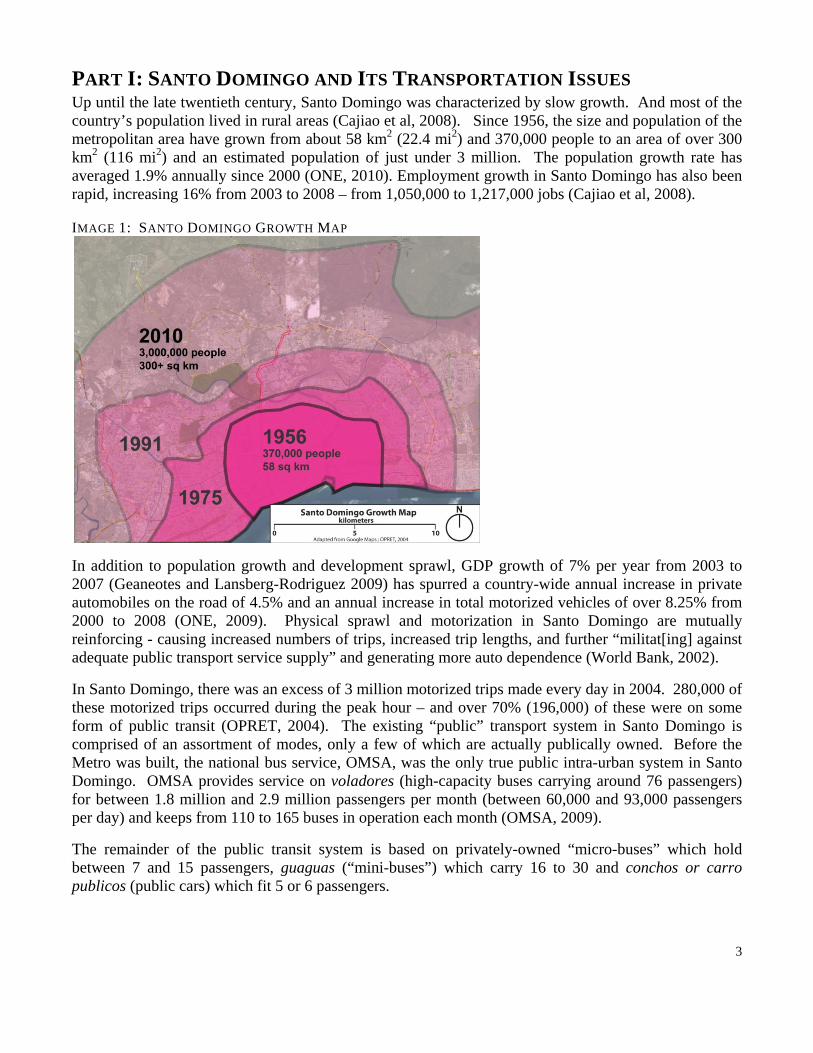
THE MAXIMO-GÓMEZ CORRIDOR At left in Image 2 is a traffic-impact analysis conducted in 2004 on the major corridors in Santo Domingo. The red lines show the volume of peak hour loads in each corridor. The Maximo-Gómez corridor is the vertical red line in the middle of the map. It runs north-south from the dense and poor neighborhood of Villa Mella, along Avenida Maximo-Gómez past a number of civic and cultural landmarks, the Universidad Autonoma de Santo Domingo (UASD) and Centro de los Heroes, a major government center. The line ends in another poor neighborhood, La Feria. The northern portion of the corridor resides in the Santo Domingo Norte District and the lower portion is in the Distrito Nacional.
The highest trip volumes on public transit, of 11,000 - 12,000 pass/hr/dir, occur during the morning peak hour just below the Rio Isabella. And the volume of total (public and private) trips in the corridor during the morning inbound peak is between 15,700 and 17,100 pass/hr/dir (OPRET, 2004; Cajiao et al, 2008). The results of an 11,000 respondent origin-destination (O/D) survey of public transport users in 2004 revealed that Villa Mella was one of the top origins in the metropolitan area and that a vast majority of trips terminated in the center of the city. A diagram of the O/D survey is shown at right in Image 2.
IMAGE 2: 2004 SANTO DOMINGO TRAFFIC AND O/D ANALYSIS
The government predicts that peak hour public transit volume along Maximo-Gómez at Rio Isabella will surpass 18,000 pass/hr/dir by 2025 (OPRET, 2004). Allport et al speculate that the maximum capacity of a four-lane “great urban road” is 15,000 - 20,000 pass/hr/dir by bus and another 5,000 pass/hr/dir in private cars. The Maximo-Gómez corridor will soon reach this limit. And given that the bridge over the Rio Isabella represents one of the only ways of getting to the city center from Santo Domingo Norte, not expanding the corridor would essentially cut off Santo Domingo Norte from any further growth.
THE “MASTER PLAN” When President Leonel Fernández was elected to his second term in 2004, he pledged to reform the transportation system in Santo Domingo. He outlined his “Master Plan,” centered on the creation of OPRET, an organizational restructuring of transportation institutions in the country and the implementation of a new Sistema Integrados de Transporte Rapido Masivo (SITRAM). Line One of the Santo Domingo Metro complete with its feeder bus system is the first step in this process.
4
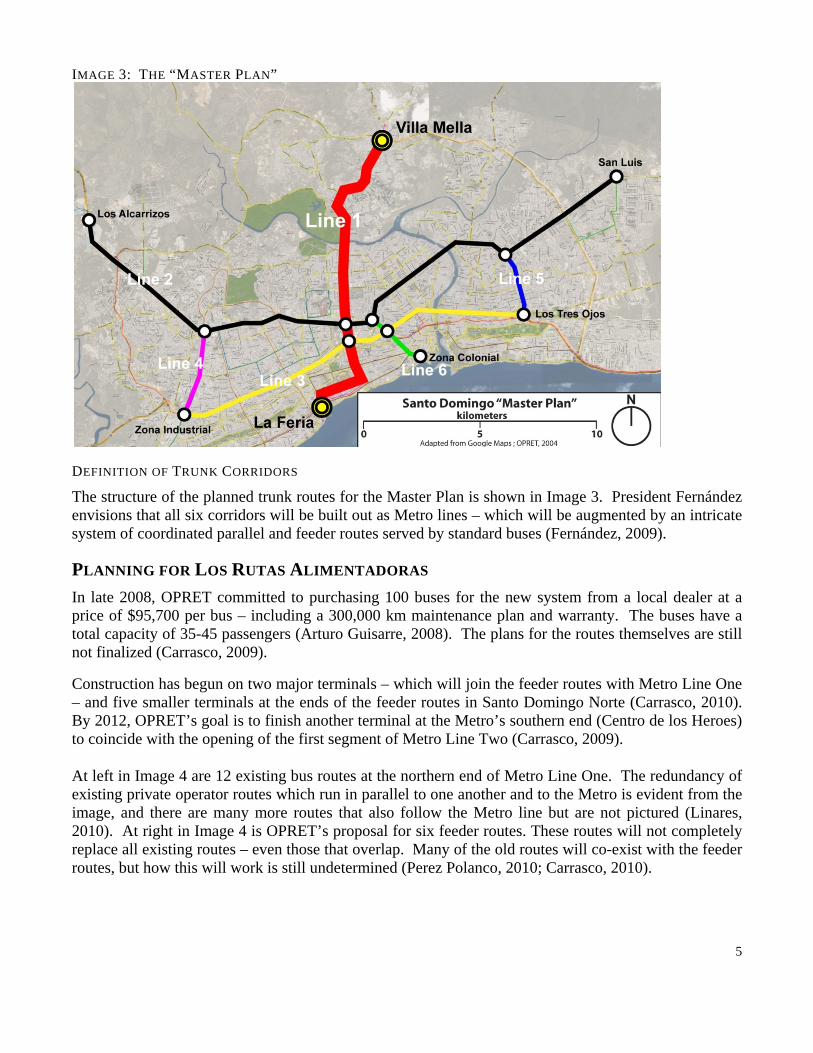
IMAGE 3: THE “MASTER PLAN”
DEFINITION OF TRUNK CORRIDORS
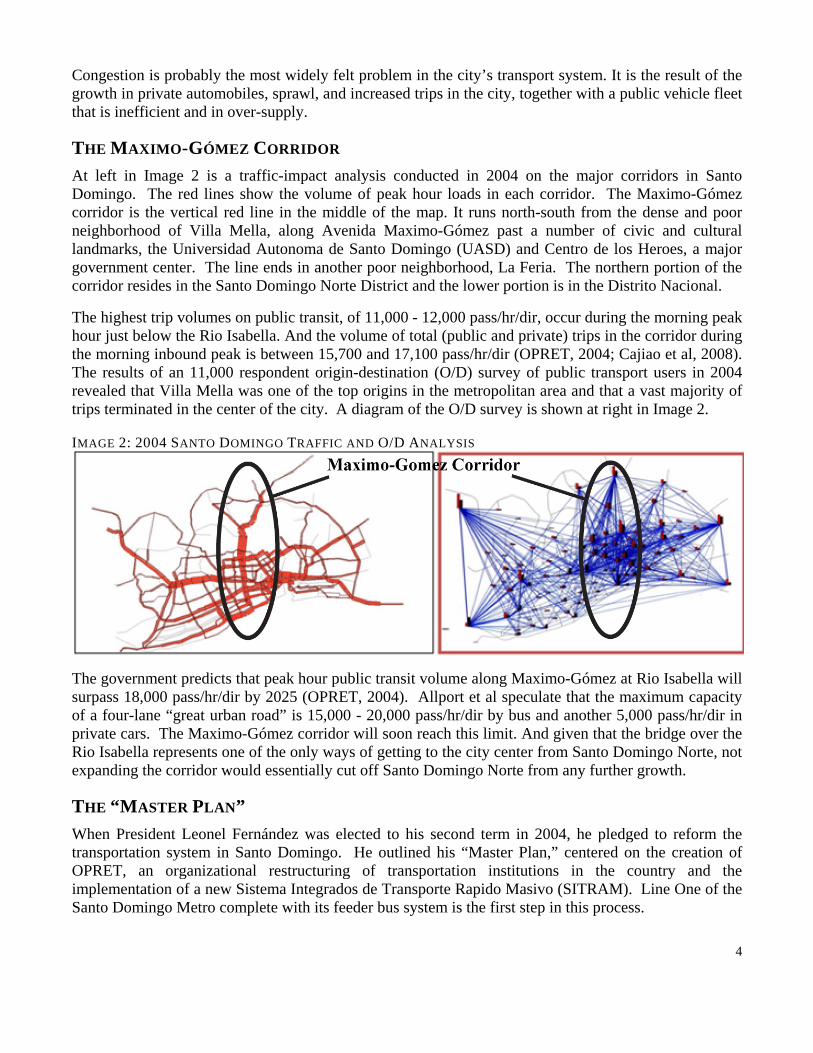
The structure of the planned trunk routes for the Master Plan is shown in Image 3. President Fernández envisions that all six corridors will be built out as Metro lines – which will be augmented by an intricate system of coordinated parallel and feeder routes served by standard buses (Fernández, 2009).
PLANNING FOR LOS RUTAS ALIMENTADORAS In late 2008, OPRET committed to purchasing 100 buses for the new system from a local dealer at a price of $95,700 per bus – including a 300,000 km maintenance plan and warranty. The buses have a total capacity of 35-45 passengers (Arturo Guisarre, 2008). The plans for the routes themselves are still not finalized (Carrasco, 2009).
Construction has begun on two major terminals – which will join the feeder routes with Metro Line One – and five smaller terminals at the ends of the feeder routes in Santo Domingo Norte (Carrasco, 2010). By 2012, OPRET’s goal is to finish another terminal at the Metro’s southern end (Centro de los Heroes) to coincide with the opening of the first segment of Metro Line Two (Carrasco, 2009).
At left in Image 4 are 12 existing bus routes at the northern end of Metro Line One. The redundancy of existing private operator routes which run in parallel to one another and to the Metro is evident from the image, and there are many more routes that also follow the Metro line but are not pictured (Linares, 2010). At right in Image 4 is OPRET’s proposal for six feeder routes. These routes will not completely replace all existing routes – even those that overlap. Many of the old routes will co-exist with the feeder routes, but how this will work is still undetermined (Perez Polanco, 2010; Carrasco, 2010).
5
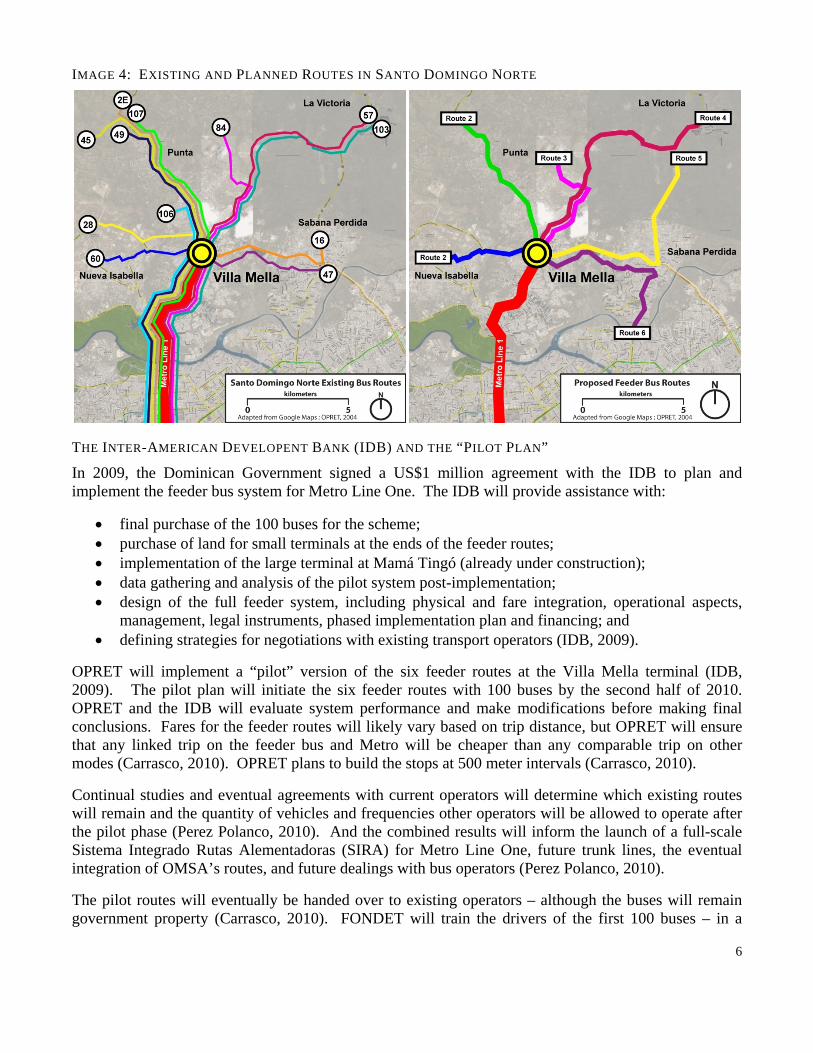
IMAGE 4: EXISTING AND PLANNED ROUTES IN SANTO DOMINGO NORTE
THE INTER-AMERICAN DEVELOPENT BANK (IDB) AND THE “PILOT PLAN”
In 2009, the Dominican Government signed a US$1 million agreement with the IDB to plan and implement the feeder bus system for Metro Line One. The IDB will provide assistance with:
• final purchase of the 100 buses for the scheme; • purchase of land for small terminals at the ends of the feeder routes; • implementation of the large terminal at Mamá Tingó (already under construction); • data gathering and analysis of the pilot system post-implementation; • design of the full feeder system, including physical and fare integration, operational aspects,
management, legal instruments, phased implementation plan and financing; and • defining strategies for negotiations with existing transport operators (IDB, 2009).
OPRET will implement a “pilot” version of the six feeder routes at the Villa Mella terminal (IDB, 2009). The pilot plan will initiate the six feeder routes with 100 buses by the second half of 2010. OPRET and the IDB will evaluate system performance and make modifications before making final conclusions. Fares for the feeder routes will likely vary based on trip distance, but OPRET will ensure that any linked trip on the feeder bus and Metro will be cheaper than any comparable trip on other modes (Carrasco, 2010). OPRET plans to build the stops at 500 meter intervals (Carrasco, 2010).
Continual studies and eventual agreements with current operators will determine which existing routes will remain and the quantity of vehicles and frequencies other operators will be allowed to operate after the pilot phase (Perez Polanco, 2010). And the combined results will inform the launch of a full-scale Sistema Integrado Rutas Alementadoras (SIRA) for Metro Line One, future trunk lines, the eventual integration of OMSA’s routes, and future dealings with bus operators (Perez Polanco, 2010).
The pilot routes will eventually be handed over to existing operators – although the buses will remain government property (Carrasco, 2010). FONDET will train the drivers of the first 100 buses – in a
6
7
special school created just for this purpose. The Escuela Nacional de Educación Vial (ENEVIAL) was inaugurated in 2009 to “create a new generation of drivers with excellent training to optimize service to users throughout the country” (Medrano, 2009). In the long run, OPRET hopes to require that all public transport drivers be educated by FONDET through ENEVIAL. And through tougher standards, enforcement and government financing, OPRET wants to eventually upgrade the entire public fleet in the city, rationalize all routes, professionalize drivers and control service levels (Carrasco, 2010).
PART II: TRANSPORT INTEGRATION AND SUSTAINABLE DEVELOPMENT The primary direct benefit of efficient transportation systems for the poor is increased mobility and accessibility (World Bank, 2002). Referring to the first MDG of reducing extreme poverty and hunger, the UN Centre for Regional Development (UNCRD) states that “increased mobility…through provision of adequate public transport and pedestrian facilities may ultimately help the poor to find employment and livelihood support” (UNCRD, 2004). While arguably not a basic human need in and of itself, transportation serves as an intermediate or complementary service. It carries people to jobs, services and amenities necessary for a good quality of life. Beyond this, transport also plays an increasing role in the global demand for energy and in production of emissions which endanger local environments and the global climate; and it has impacts on economic growth.
Physical, fare and operational integration of modes allows governments to ensure optimal social and economic benefit, equity, and sustainability. When combined with institutional and policy coordination, integration facilitates the effective coordination of transportation planning with broader development plans and goals – and therefore strengthens further the linkages between transportation and social and economic outcomes.
A purpose of the Metro and bus system integration in Santo Domingo is to provide better options to the poor in the outskirts of Santo Domingo and those “without access to private means of transportation” (Carrasco, 2009). The extension of Metro Line One into some of the visibly poorest neighborhoods in Santo Domingo (Villa Mella and La Feria) and plans to extend feeder buses deeper into these areas are evidence of this strategy.
SUSTAINABLE TRANSPORT ON THE GLOBAL AGENDA
Sustainable transportation has been high on the international agenda since the development of Agenda 21 at the Rio Summit in 1992. Transportation’s importance to global sustainable development was further emphasized by the UN General Assembly in 1997, at the ninth session of the Commission on Sustainable Development (CSD) in 2001, at the World Summit on Sustainable Development (WSSD) in Johannesburg in 2002 and finally the launch of the Marrakesh Process in 2003. This year’s CSD meeting in New York is the culmination of the Marrakesh Process, which aims to develop a 10-year framework of programs on sustainable consumption and production (SCP). In recognition of its cross-cutting significance, transport sits atop the CSD’s main “thematic cluster” along with chemicals, waste management, mining.
Originating at the Rio Summit in 1992, Agenda 21 was one of the first unified international expressions of understanding of transportation’s role in development as well as the need to curb its negative externalities to local environments and health. Both Chapter Seven on Human Settlements and Chapter Nine on Atmosphere refer explicitly to transport interventions and integration. Chapter Seven defines a “basis for action” the “pervasive air quality problems related to ozone, particulate matters and carbon monoxide…[having] much to do with technological inadequacies and with an increasing fuel
8
consumption generated by inefficiencies, high demographic and industrial concentrations and a rapid expansion in the number of motor vehicles” (UNDSD,1992:7.47).
Particular to developing countries, Chapter Seven identifies “rapid motorization and insufficient investments in urban-transport planning, traffic management and infrastructure” as “creating increasing problems in terms of accidents…health, noise, congestion and loss of productivity…” These problems are identified as having disproportionate impacts on low and no-income groups and are highly concentrated in urban settings (UNDSD,1992:7.48). Chapter Nine of the accord lists actions governments can take to mitigate environmental impacts of the transportation sector – all of which are relevant to the current work in Santo Domingo – including:
• Developing efficient, less polluting, safer and integrated mass transport systems; • Facilitating sharing of “transport technologies, particularly to the developing countries”; • Strengthening understanding of “the relationship between environment and transport; • Integrating “transport planning…and…settlement planning strategies, with a view to reducing
the environmental impacts of transport (UNDSD, 1992:9.15).
The 2002 Johannesburg Plan of Implementation (JPOI) set out to create an actionable 10-Year Framework of Programs on sustainable consumption and production (UNDESA, 2009). And the Marrakech Process and the Commission on Sustainable Development were both initiated to supports the implementation of this framework (UNCSD, 2009).
The Dominican Republic’s current extensive integration efforts are being executed with the same ambitious spirit and urgency – and are consistent with the policy guidelines set forth in Agenda 21. The remainder of this analysis examines the contributions of Metro Line One to achieving sustainable development and poverty alleviation objectives in Santo Domingo and the potential for integration of a feeder bus system to enhance the Metro’s positive effects.
PART III: ANALYSIS OF METRO LINE ONE
SYSTEM DESCRIPTION Line One of the Santo Domingo Metro is only the second metro system to be built in the Caribbean. The Metro officially opened in February, 2009. The line runs north to south, connecting the impoverished neighborhoods of Villa Mella and La Feria with Santo Domingo’s central business district. It is 14.5 kilometers long and has 16 stations. The southernmost 10 km of Line One runs underneath Avenida Maximo-Gómez and the last 4.5 km is on elevated track which runs down the central median of Avenida Hermanas Mirabal. The train is powered by overhead electric cables.
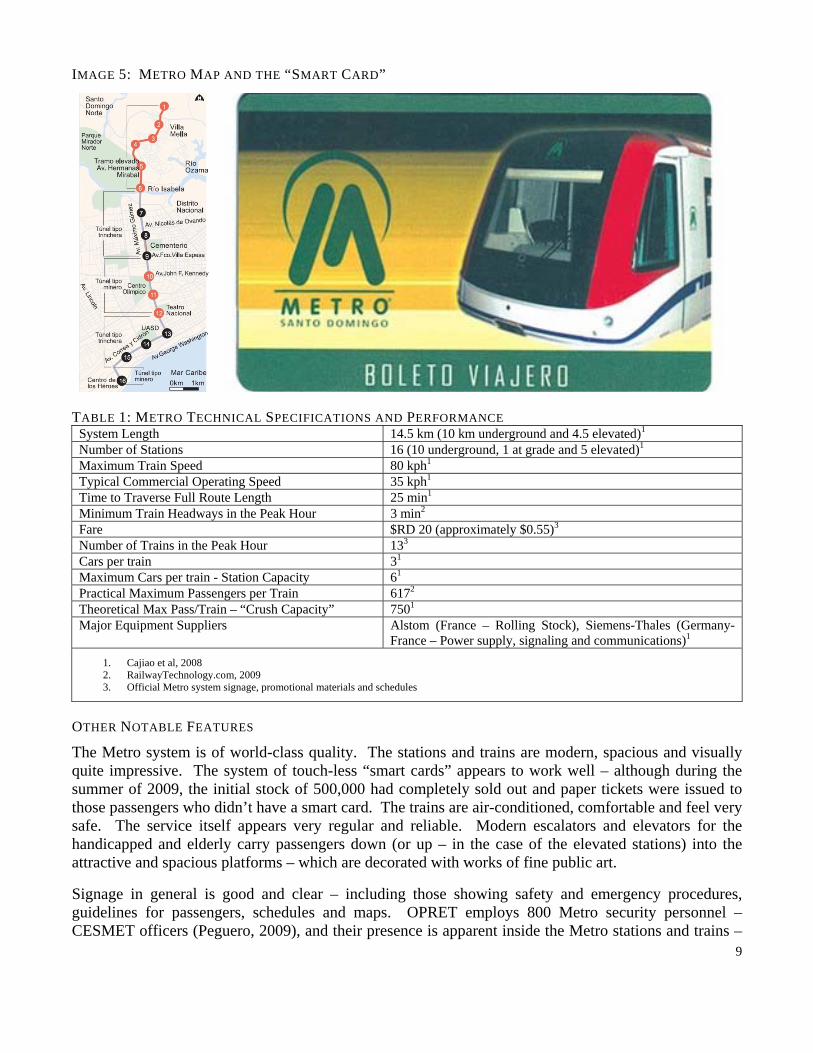
IMAGE 5: METRO MAP AND THE “SMART CARD”
TABLE 1: METRO TECHNICAL SPECIFICATIONS AND PERFORMANCE System Length 14.5 km (10 km underground and 4.5 elevated)1
Number of Stations 16 (10 underground, 1 at grade and 5 elevated)1
Maximum Train Speed 80 kph1
Typical Commercial Operating Speed 35 kph1
Time to Traverse Full Route Length 25 min1
Minimum Train Headways in the Peak Hour 3 min2
Fare $RD 20 (approximately $0.55)3
Number of Trains in the Peak Hour 133
Cars per train 31
Maximum Cars per train - Station Capacity 61
Practical Maximum Passengers per Train 6172
Theoretical Max Pass/Train – “Crush Capacity” 7501
Major Equipment Suppliers Alstom (France – Rolling Stock), Siemens-Thales (Germany-France – Power supply, signaling and communications)1
1. Cajiao et al, 2008 2. RailwayTechnology.com, 2009 3. Official Metro system signage, promotional materials and schedules
OTHER NOTABLE FEATURES
The Metro system is of world-class quality. The stations and trains are modern, spacious and visually quite impressive. The system of touch-less “smart cards” appears to work well – although during the summer of 2009, the initial stock of 500,000 had completely sold out and paper tickets were issued to those passengers who didn’t have a smart card. The trains are air-conditioned, comfortable and feel very safe. The service itself appears very regular and reliable. Modern escalators and elevators for the handicapped and elderly carry passengers down (or up – in the case of the elevated stations) into the attractive and spacious platforms – which are decorated with works of fine public art.
Signage in general is good and clear – including those showing safety and emergency procedures, guidelines for passengers, schedules and maps. OPRET employs 800 Metro security personnel – CESMET officers (Peguero, 2009), and their presence is apparent inside the Metro stations and trains –
9
and even outside station entrances. Finally, the stations are kept noticeably clean, through the manual labor of about seven cleaning staff people per station who work in shifts of three to four staff at a time (Diaz, 2009). Administrative, cleaning and security staff make salaries ranging from $RD 11,000 – 12,000 per month (about $300 – $335) – considered to be a “lower middle-class” wage (Diaz, 2009).
RIDERSHIP It was hoped that the Metro would carry over 200,000 passengers per day (RailwayTechnology.com, 2009). But after six months of operation, OPRET estimated ridership at between 50,000 and 60,000 passenger-trips per day. Now after one year, OPRET estimates that ridership is 65,000 passenger-trips per weekday and puts ridership for the whole first year of operation at 17.5 million (Carrasco, 2010).
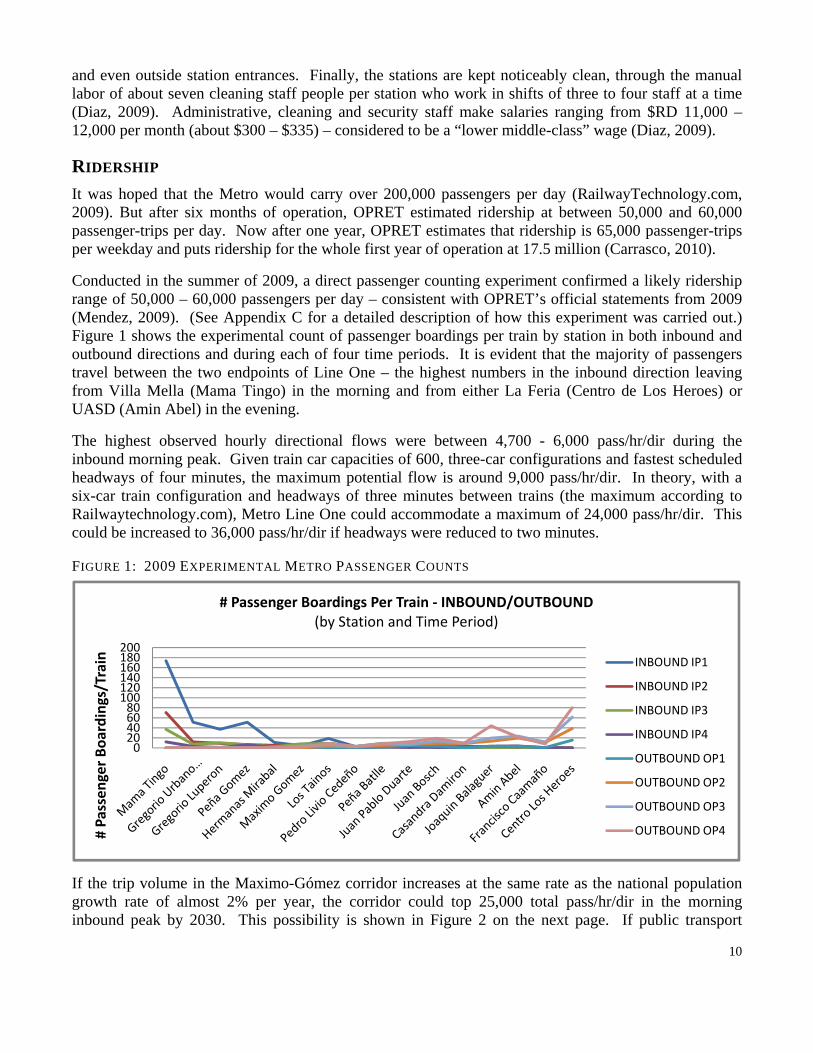
Conducted in the summer of 2009, a direct passenger counting experiment confirmed a likely ridership range of 50,000 – 60,000 passengers per day – consistent with OPRET’s official statements from 2009 (Mendez, 2009). (See Appendix C for a detailed description of how this experiment was carried out.) Figure 1 shows the experimental count of passenger boardings per train by station in both inbound and outbound directions and during each of four time periods. It is evident that the majority of passengers travel between the two endpoints of Line One – the highest numbers in the inbound direction leaving from Villa Mella (Mama Tingo) in the morning and from either La Feria (Centro de Los Heroes) or UASD (Amin Abel) in the evening.
The highest observed hourly directional flows were between 4,700 - 6,000 pass/hr/dir during the inbound morning peak. Given train car capacities of 600, three-car configurations and fastest scheduled headways of four minutes, the maximum potential flow is around 9,000 pass/hr/dir. In theory, with a six-car train configuration and headways of three minutes between trains (the maximum according to Railwaytechnology.com), Metro Line One could accommodate a maximum of 24,000 pass/hr/dir. This could be increased to 36,000 pass/hr/dir if headways were reduced to two minutes.
FIGURE 1: 2009 EXPERIMENTAL METRO PASSENGER COUNTS
020406080100120140160180200
# Passen
ger Bo
ardings/Train
# Passenger Boardings Per Train ‐ INBOUND/OUTBOUND(by Station and Time Period)
INBOUND IP1
INBOUND IP2
INBOUND IP3
INBOUND IP4
OUTBOUND OP1
OUTBOUND OP2
OUTBOUND OP3
OUTBOUND OP4
If the trip volume in the Maximo-Gómez corridor increases at the same rate as the national population growth rate of almost 2% per year, the corridor could top 25,000 total pass/hr/dir in the morning inbound peak by 2030. This possibility is shown in Figure 2 on the next page. If public transport
10
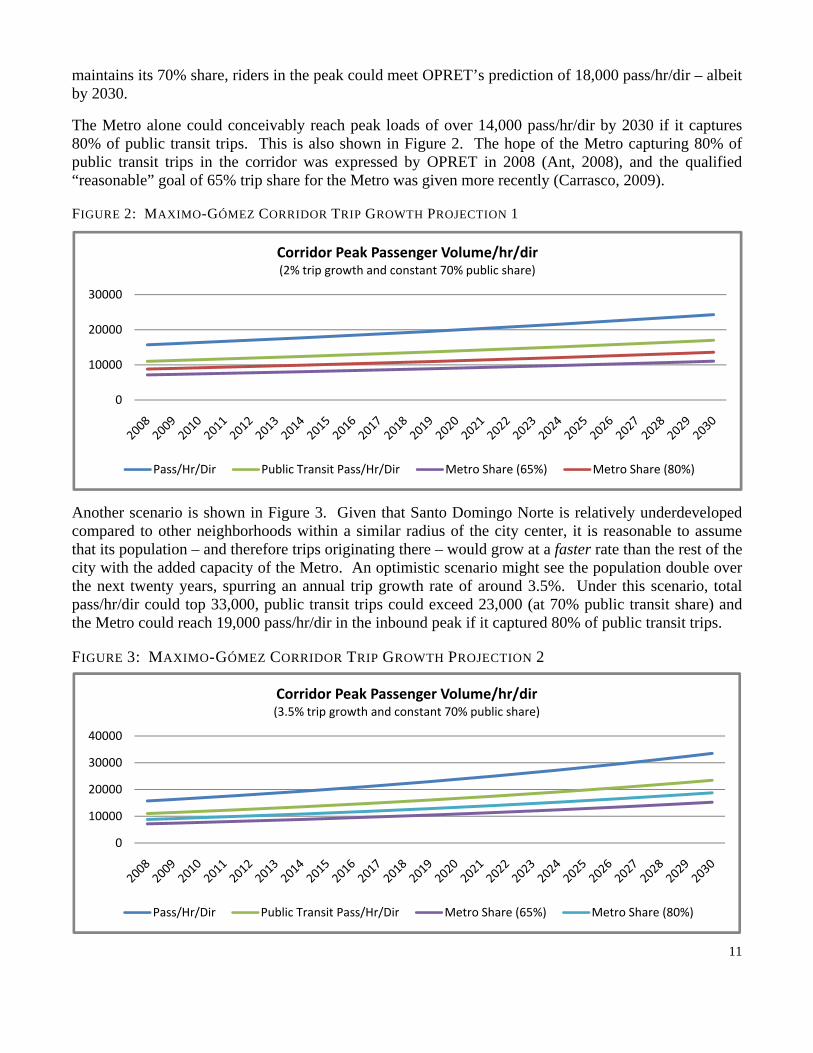
maintains its 70% share, riders in the peak could meet OPRET’s prediction of 18,000 pass/hr/dir – albeit by 2030.
The Metro alone could conceivably reach peak loads of over 14,000 pass/hr/dir by 2030 if it captures 80% of public transit trips. This is also shown in Figure 2. The hope of the Metro capturing 80% of public transit trips in the corridor was expressed by OPRET in 2008 (Ant, 2008), and the qualified “reasonable” goal of 65% trip share for the Metro was given more recently (Carrasco, 2009).
FIGURE 2: MAXIMO-GÓMEZ CORRIDOR TRIP GROWTH PROJECTION 1
0
10000
20000
30000
Corridor Peak Passenger Volume/hr/dir(2% trip growth and constant 70% public share)
Pass/Hr/Dir Public Transit Pass/Hr/Dir Metro Share (65%) Metro Share (80%)
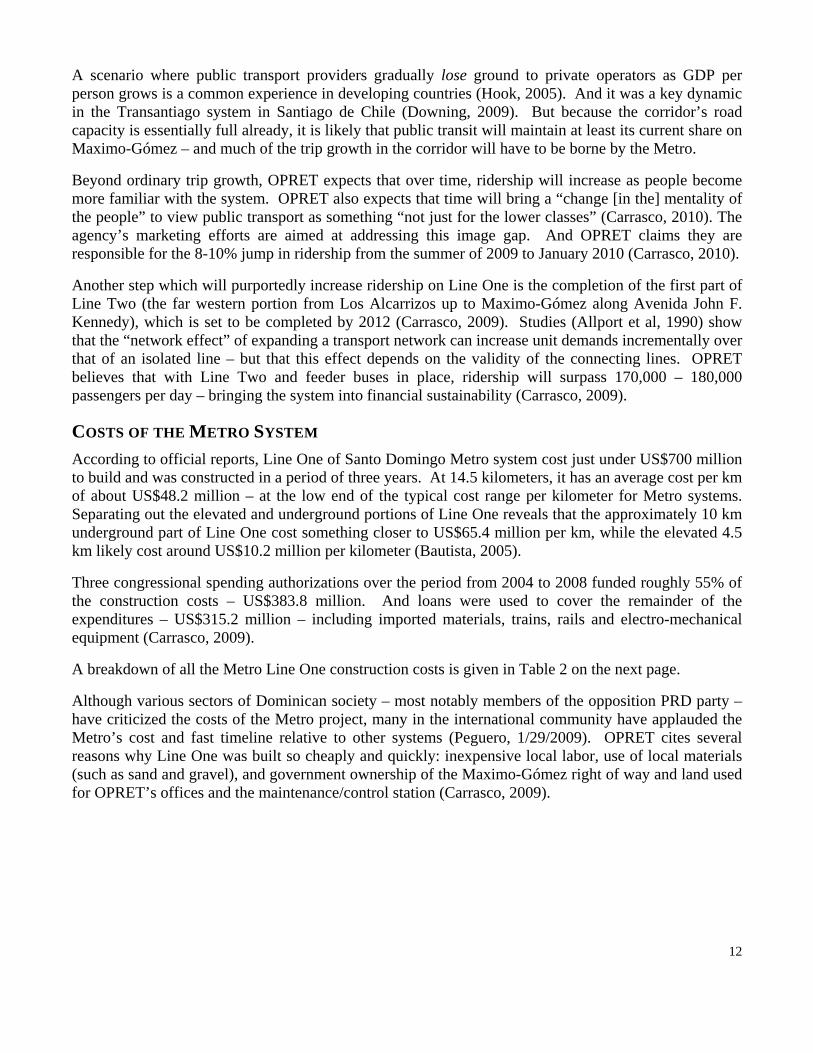
Another scenario is shown in Figure 3. Given that Santo Domingo Norte is relatively underdeveloped compared to other neighborhoods within a similar radius of the city center, it is reasonable to assume that its population – and therefore trips originating there – would grow at a faster rate than the rest of the city with the added capacity of the Metro. An optimistic scenario might see the population double over the next twenty years, spurring an annual trip growth rate of around 3.5%. Under this scenario, total pass/hr/dir could top 33,000, public transit trips could exceed 23,000 (at 70% public transit share) and the Metro could reach 19,000 pass/hr/dir in the inbound peak if it captured 80% of public transit trips.
FIGURE 3: MAXIMO-GÓMEZ CORRIDOR TRIP GROWTH PROJECTION 2
0
10000
20000
30000
40000
Corridor Peak Passenger Volume/hr/dir(3.5% trip growth and constant 70% public share)
Pass/Hr/Dir Public Transit Pass/Hr/Dir Metro Share (65%) Metro Share (80%)
11
12
A scenario where public transport providers gradually lose ground to private operators as GDP per person grows is a common experience in developing countries (Hook, 2005). And it was a key dynamic in the Transantiago system in Santiago de Chile (Downing, 2009). But because the corridor’s road capacity is essentially full already, it is likely that public transit will maintain at least its current share on Maximo-Gómez – and much of the trip growth in the corridor will have to be borne by the Metro.
Beyond ordinary trip growth, OPRET expects that over time, ridership will increase as people become more familiar with the system. OPRET also expects that time will bring a “change [in the] mentality of the people” to view public transport as something “not just for the lower classes” (Carrasco, 2010). The agency’s marketing efforts are aimed at addressing this image gap. And OPRET claims they are responsible for the 8-10% jump in ridership from the summer of 2009 to January 2010 (Carrasco, 2010).
Another step which will purportedly increase ridership on Line One is the completion of the first part of Line Two (the far western portion from Los Alcarrizos up to Maximo-Gómez along Avenida John F. Kennedy), which is set to be completed by 2012 (Carrasco, 2009). Studies (Allport et al, 1990) show that the “network effect” of expanding a transport network can increase unit demands incrementally over that of an isolated line – but that this effect depends on the validity of the connecting lines. OPRET believes that with Line Two and feeder buses in place, ridership will surpass 170,000 – 180,000 passengers per day – bringing the system into financial sustainability (Carrasco, 2009).
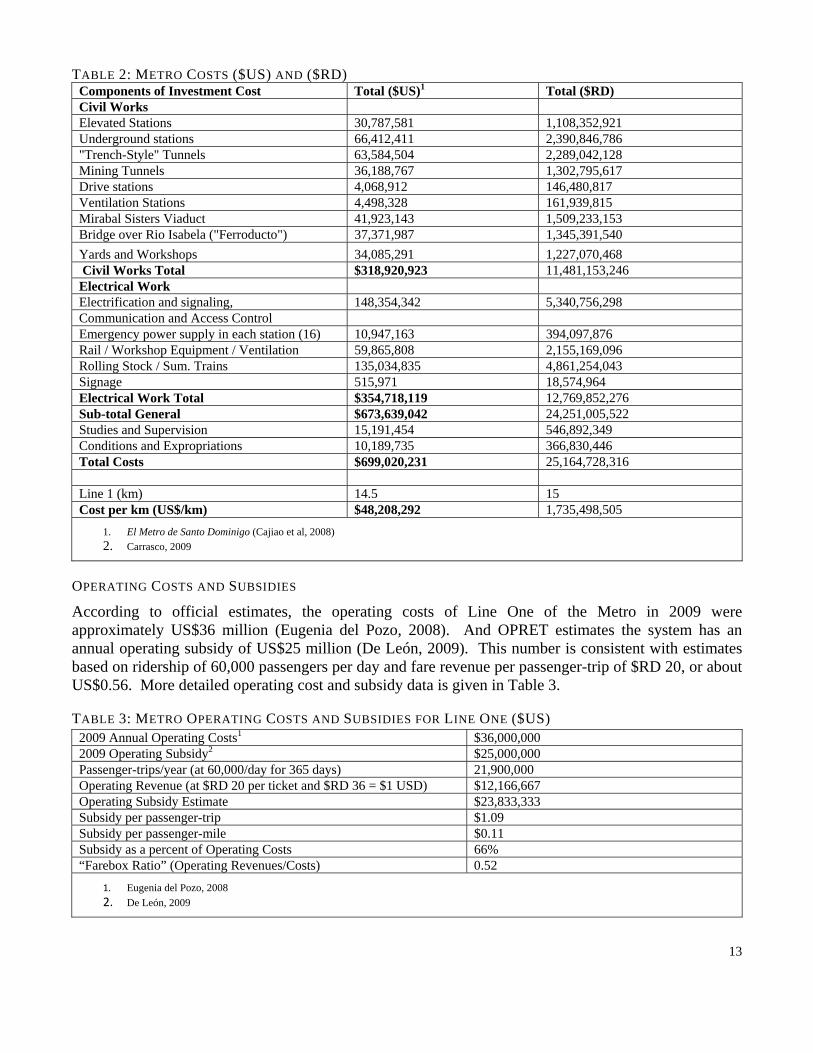
COSTS OF THE METRO SYSTEM According to official reports, Line One of Santo Domingo Metro system cost just under US$700 million to build and was constructed in a period of three years. At 14.5 kilometers, it has an average cost per km of about US$48.2 million – at the low end of the typical cost range per kilometer for Metro systems. Separating out the elevated and underground portions of Line One reveals that the approximately 10 km underground part of Line One cost something closer to US$65.4 million per km, while the elevated 4.5 km likely cost around US$10.2 million per kilometer (Bautista, 2005).
Three congressional spending authorizations over the period from 2004 to 2008 funded roughly 55% of the construction costs – US$383.8 million. And loans were used to cover the remainder of the expenditures – US$315.2 million – including imported materials, trains, rails and electro-mechanical equipment (Carrasco, 2009).
A breakdown of all the Metro Line One construction costs is given in Table 2 on the next page.
Although various sectors of Dominican society – most notably members of the opposition PRD party – have criticized the costs of the Metro project, many in the international community have applauded the Metro’s cost and fast timeline relative to other systems (Peguero, 1/29/2009). OPRET cites several reasons why Line One was built so cheaply and quickly: inexpensive local labor, use of local materials (such as sand and gravel), and government ownership of the Maximo-Gómez right of way and land used for OPRET’s offices and the maintenance/control station (Carrasco, 2009).
13
TABLE 2: METRO COSTS ($US) AND ($RD) Components of Investment Cost Total ($US)1 Total ($RD) Civil Works Elevated Stations 30,787,581 1,108,352,921 Underground stations 66,412,411 2,390,846,786 "Trench-Style" Tunnels 63,584,504 2,289,042,128 Mining Tunnels 36,188,767 1,302,795,617 Drive stations 4,068,912 146,480,817 Ventilation Stations 4,498,328 161,939,815 Mirabal Sisters Viaduct 41,923,143 1,509,233,153 Bridge over Rio Isabela ("Ferroducto") 37,371,987 1,345,391,540 Yards and Workshops 34,085,291 1,227,070,468 Civil Works Total $318,920,923 11,481,153,246 Electrical Work Electrification and signaling, 148,354,342 5,340,756,298 Communication and Access Control Emergency power supply in each station (16) 10,947,163 394,097,876 Rail / Workshop Equipment / Ventilation 59,865,808 2,155,169,096 Rolling Stock / Sum. Trains 135,034,835 4,861,254,043 Signage 515,971 18,574,964 Electrical Work Total $354,718,119 12,769,852,276 Sub-total General $673,639,042 24,251,005,522 Studies and Supervision 15,191,454 546,892,349 Conditions and Expropriations 10,189,735 366,830,446 Total Costs $699,020,231 25,164,728,316 Line 1 (km) 14.5 15 Cost per km (US$/km) $48,208,292 1,735,498,505
1. El Metro de Santo Dominigo (Cajiao et al, 2008) 2. Carrasco, 2009
OPERATING COSTS AND SUBSIDIES
According to official estimates, the operating costs of Line One of the Metro in 2009 were approximately US$36 million (Eugenia del Pozo, 2008). And OPRET estimates the system has an annual operating subsidy of US$25 million (De León, 2009). This number is consistent with estimates based on ridership of 60,000 passengers per day and fare revenue per passenger-trip of $RD 20, or about US$0.56. More detailed operating cost and subsidy data is given in Table 3.
TABLE 3: METRO OPERATING COSTS AND SUBSIDIES FOR LINE ONE ($US) 2009 Annual Operating Costs1 $36,000,000 2009 Operating Subsidy2 $25,000,000 Passenger-trips/year (at 60,000/day for 365 days) 21,900,000 Operating Revenue (at $RD 20 per ticket and $RD 36 = $1 USD) $12,166,667 Operating Subsidy Estimate $23,833,333 Subsidy per passenger-trip $1.09 Subsidy per passenger-mile $0.11 Subsidy as a percent of Operating Costs 66% “Farebox Ratio” (Operating Revenues/Costs) 0.52
1. Eugenia del Pozo, 2008 2. De León, 2009
PRIMARY BENEFITS OF METRO LINE ONE The primary benefits of the Metro are: accessibility and mobility; passenger time savings; and time savings to road users through congestion reduction. There is also a set of secondary benefits including: pollution and accident reductions, local economic stimulus and transfer of technology. But these are probably small relative to the primary benefits and are difficult to quantify.
ACCESSIBILITY AND MOBILITY
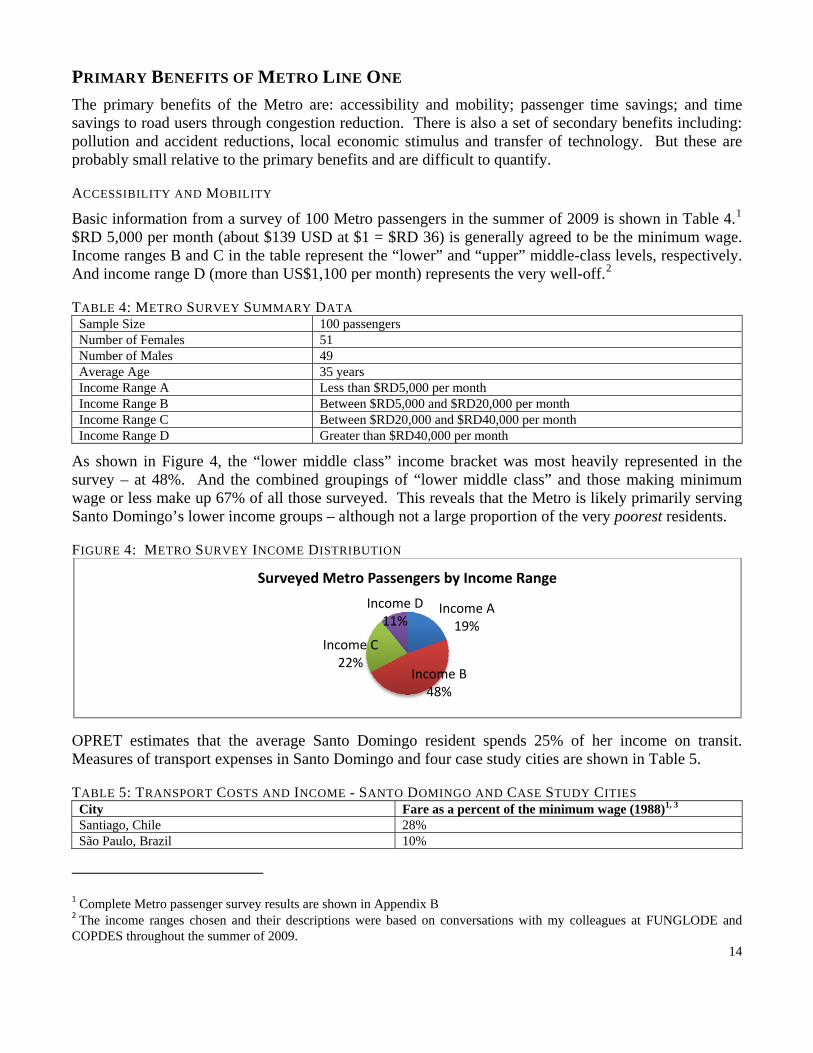
Basic information from a survey of 100 Metro passengers in the summer of 2009 is shown in Table 4.1 $RD 5,000 per month (about $139 USD at $1 = $RD 36) is generally agreed to be the minimum wage. Income ranges B and C in the table represent the “lower” and “upper” middle-class levels, respectively. And income range D (more than US$1,100 per month) represents the very well-off.2
TABLE 4: METRO SURVEY SUMMARY DATA Sample Size 100 passengers Number of Females 51 Number of Males 49 Average Age 35 years Income Range A Less than $RD5,000 per month Income Range B Between $RD5,000 and $RD20,000 per month Income Range C Between $RD20,000 and $RD40,000 per month Income Range D Greater than $RD40,000 per month
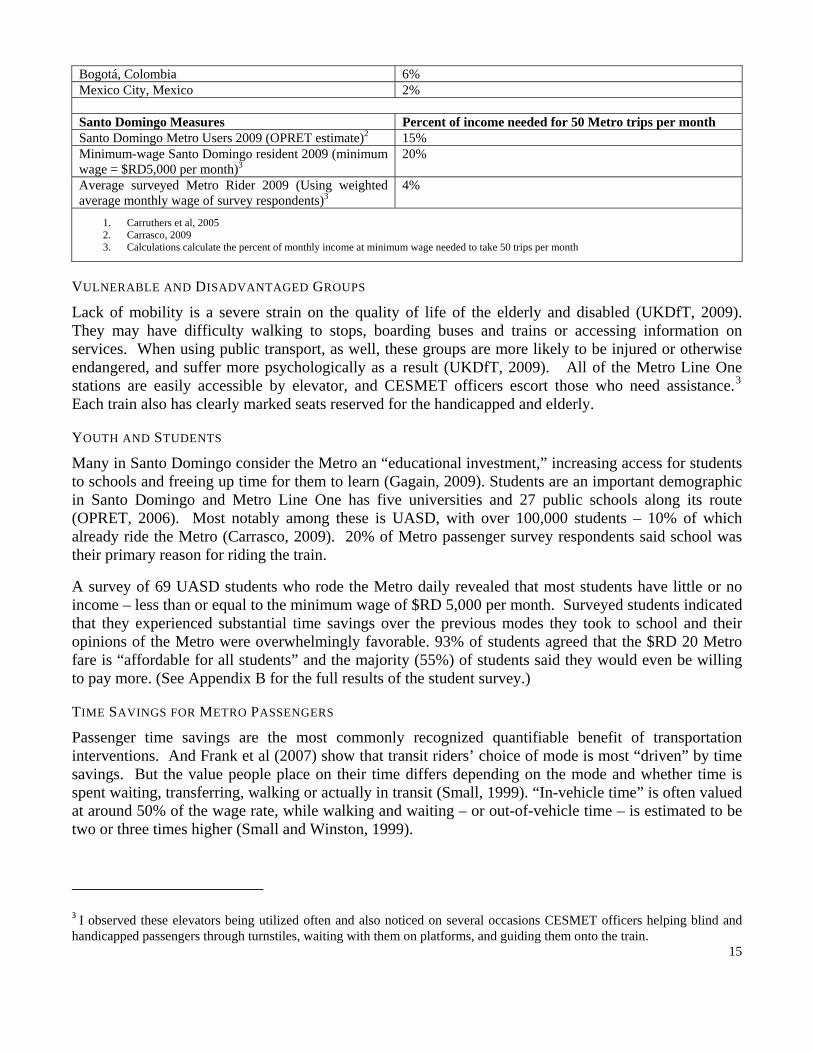
As shown in Figure 4, the “lower middle class” income bracket was most heavily represented in the survey – at 48%. And the combined groupings of “lower middle class” and those making minimum wage or less make up 67% of all those surveyed. This reveals that the Metro is likely primarily serving Santo Domingo’s lower income groups – although not a large proportion of the very poorest residents.
FIGURE 4: METRO SURVEY INCOME DISTRIBUTION
Income A19%
Income B48%
Income C22%
Income D11%
Surveyed Metro Passengers by Income Range
OPRET estimates that the average Santo Domingo resident spends 25% of her income on transit. Measures of transport expenses in Santo Domingo and four case study cities are shown in Table 5.
TABLE 5: TRANSPORT COSTS AND INCOME - SANTO DOMINGO AND CASE STUDY CITIES City Fare as a percent of the minimum wage (1988)1, 3 Santiago, Chile 28% São Paulo, Brazil 10%
1 Complete Metro passenger survey results are shown in Appendix B
14
2 The income ranges chosen and their descriptions were based on conversations with my colleagues at FUNGLODE and COPDES throughout the summer of 2009.
15
Bogotá, Colombia 6% Mexico City, Mexico 2% Santo Domingo Measures Percent of income needed for 50 Metro trips per month Santo Domingo Metro Users 2009 (OPRET estimate)2 15% Minimum-wage Santo Domingo resident 2009 (minimum wage = $RD5,000 per month)3
20%
Average surveyed Metro Rider 2009 (Using weighted average monthly wage of survey respondents)3
4%
1. Carruthers et al, 2005 2. Carrasco, 2009 3. Calculations calculate the percent of monthly income at minimum wage needed to take 50 trips per month
VULNERABLE AND DISADVANTAGED GROUPS
Lack of mobility is a severe strain on the quality of life of the elderly and disabled (UKDfT, 2009). They may have difficulty walking to stops, boarding buses and trains or accessing information on services. When using public transport, as well, these groups are more likely to be injured or otherwise endangered, and suffer more psychologically as a result (UKDfT, 2009). All of the Metro Line One stations are easily accessible by elevator, and CESMET officers escort those who need assistance.3 Each train also has clearly marked seats reserved for the handicapped and elderly.
YOUTH AND STUDENTS
Many in Santo Domingo consider the Metro an “educational investment,” increasing access for students to schools and freeing up time for them to learn (Gagain, 2009). Students are an important demographic in Santo Domingo and Metro Line One has five universities and 27 public schools along its route (OPRET, 2006). Most notably among these is UASD, with over 100,000 students – 10% of which already ride the Metro (Carrasco, 2009). 20% of Metro passenger survey respondents said school was their primary reason for riding the train.
A survey of 69 UASD students who rode the Metro daily revealed that most students have little or no income – less than or equal to the minimum wage of $RD 5,000 per month. Surveyed students indicated that they experienced substantial time savings over the previous modes they took to school and their opinions of the Metro were overwhelmingly favorable. 93% of students agreed that the $RD 20 Metro fare is “affordable for all students” and the majority (55%) of students said they would even be willing to pay more. (See Appendix B for the full results of the student survey.)
TIME SAVINGS FOR METRO PASSENGERS
Passenger time savings are the most commonly recognized quantifiable benefit of transportation interventions. And Frank et al (2007) show that transit riders’ choice of mode is most “driven” by time savings. But the value people place on their time differs depending on the mode and whether time is spent waiting, transferring, walking or actually in transit (Small, 1999). “In-vehicle time” is often valued at around 50% of the wage rate, while walking and waiting – or out-of-vehicle time – is estimated to be two or three times higher (Small and Winston, 1999).
3 I observed these elevators being utilized often and also noticed on several occasions CESMET officers helping blind and handicapped passengers through turnstiles, waiting with them on platforms, and guiding them onto the train.
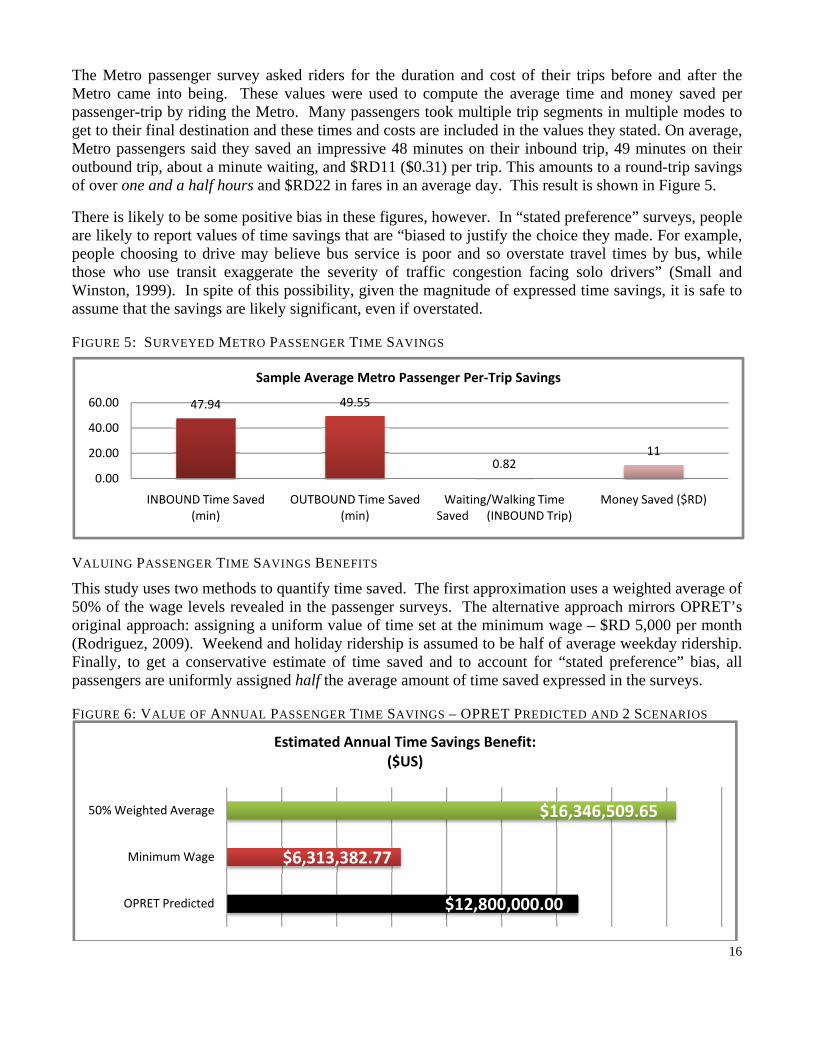
The Metro passenger survey asked riders for the duration and cost of their trips before and after the Metro came into being. These values were used to compute the average time and money saved per passenger-trip by riding the Metro. Many passengers took multiple trip segments in multiple modes to get to their final destination and these times and costs are included in the values they stated. On average, Metro passengers said they saved an impressive 48 minutes on their inbound trip, 49 minutes on their outbound trip, about a minute waiting, and $RD11 ($0.31) per trip. This amounts to a round-trip savings of over one and a half hours and $RD22 in fares in an average day. This result is shown in Figure 5.
There is likely to be some positive bias in these figures, however. In “stated preference” surveys, people are likely to report values of time savings that are “biased to justify the choice they made. For example, people choosing to drive may believe bus service is poor and so overstate travel times by bus, while those who use transit exaggerate the severity of traffic congestion facing solo drivers” (Small and Winston, 1999). In spite of this possibility, given the magnitude of expressed time savings, it is safe to assume that the savings are likely significant, even if overstated.
FIGURE 5: SURVEYED METRO PASSENGER TIME SAVINGS
47.94 49.55
0.8211
0.00
20.00
40.00
60.00
INBOUND Time Saved (min)
OUTBOUND Time Saved (min)
Waiting/Walking Time Saved (INBOUND Trip)
Money Saved ($RD)
Sample Average Metro Passenger Per‐Trip Savings
VALUING PASSENGER TIME SAVINGS BENEFITS
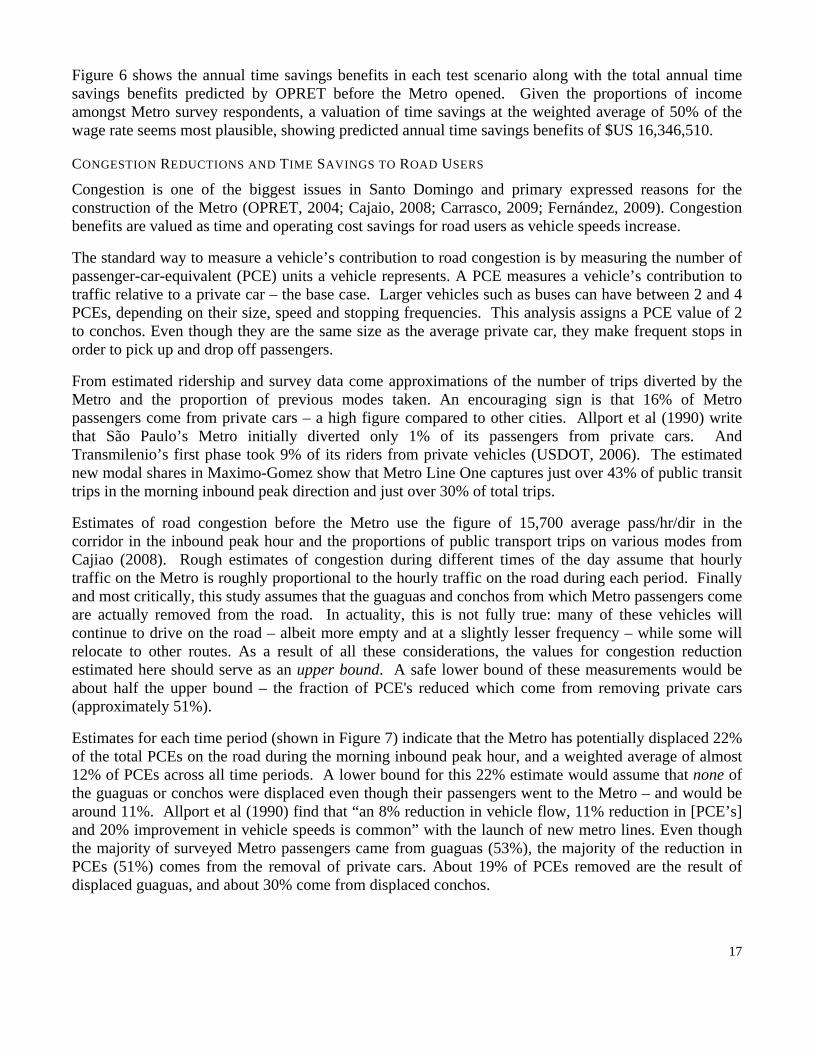
This study uses two methods to quantify time saved. The first approximation uses a weighted average of 50% of the wage levels revealed in the passenger surveys. The alternative approach mirrors OPRET’s original approach: assigning a uniform value of time set at the minimum wage – $RD 5,000 per month (Rodriguez, 2009). Weekend and holiday ridership is assumed to be half of average weekday ridership. Finally, to get a conservative estimate of time saved and to account for “stated preference” bias, all passengers are uniformly assigned half the average amount of time saved expressed in the surveys.
16
FIGURE 6: VALUE OF ANNUAL PASSENGER TIME SAVINGS – OPRET PREDICTED AND 2 SCENARIOS
$12,800,000.00
$6,313,382.77
$16,346,509.65
OPRET Predicted
Minimum Wage
50% Weighted Average
Estimated Annual Time Savings Benefit: ($US)
17
Figure 6 shows the annual time savings benefits in each test scenario along with the total annual time savings benefits predicted by OPRET before the Metro opened. Given the proportions of income amongst Metro survey respondents, a valuation of time savings at the weighted average of 50% of the wage rate seems most plausible, showing predicted annual time savings benefits of $US 16,346,510.
CONGESTION REDUCTIONS AND TIME SAVINGS TO ROAD USERS
Congestion is one of the biggest issues in Santo Domingo and primary expressed reasons for the construction of the Metro (OPRET, 2004; Cajaio, 2008; Carrasco, 2009; Fernández, 2009). Congestion benefits are valued as time and operating cost savings for road users as vehicle speeds increase.
The standard way to measure a vehicle’s contribution to road congestion is by measuring the number of passenger-car-equivalent (PCE) units a vehicle represents. A PCE measures a vehicle’s contribution to traffic relative to a private car – the base case. Larger vehicles such as buses can have between 2 and 4 PCEs, depending on their size, speed and stopping frequencies. This analysis assigns a PCE value of 2 to conchos. Even though they are the same size as the average private car, they make frequent stops in order to pick up and drop off passengers.
From estimated ridership and survey data come approximations of the number of trips diverted by the Metro and the proportion of previous modes taken. An encouraging sign is that 16% of Metro passengers come from private cars – a high figure compared to other cities. Allport et al (1990) write that São Paulo’s Metro initially diverted only 1% of its passengers from private cars. And Transmilenio’s first phase took 9% of its riders from private vehicles (USDOT, 2006). The estimated new modal shares in Maximo-Gomez show that Metro Line One captures just over 43% of public transit trips in the morning inbound peak direction and just over 30% of total trips.
Estimates of road congestion before the Metro use the figure of 15,700 average pass/hr/dir in the corridor in the inbound peak hour and the proportions of public transport trips on various modes from Cajiao (2008). Rough estimates of congestion during different times of the day assume that hourly traffic on the Metro is roughly proportional to the hourly traffic on the road during each period. Finally and most critically, this study assumes that the guaguas and conchos from which Metro passengers come are actually removed from the road. In actuality, this is not fully true: many of these vehicles will continue to drive on the road – albeit more empty and at a slightly lesser frequency – while some will relocate to other routes. As a result of all these considerations, the values for congestion reduction estimated here should serve as an upper bound. A safe lower bound of these measurements would be about half the upper bound – the fraction of PCE's reduced which come from removing private cars (approximately 51%).
Estimates for each time period (shown in Figure 7) indicate that the Metro has potentially displaced 22% of the total PCEs on the road during the morning inbound peak hour, and a weighted average of almost 12% of PCEs across all time periods. A lower bound for this 22% estimate would assume that none of the guaguas or conchos were displaced even though their passengers went to the Metro – and would be around 11%. Allport et al (1990) find that “an 8% reduction in vehicle flow, 11% reduction in [PCE’s] and 20% improvement in vehicle speeds is common” with the launch of new metro lines. Even though the majority of surveyed Metro passengers came from guaguas (53%), the majority of the reduction in PCEs (51%) comes from the removal of private cars. About 19% of PCEs removed are the result of displaced guaguas, and about 30% come from displaced conchos.
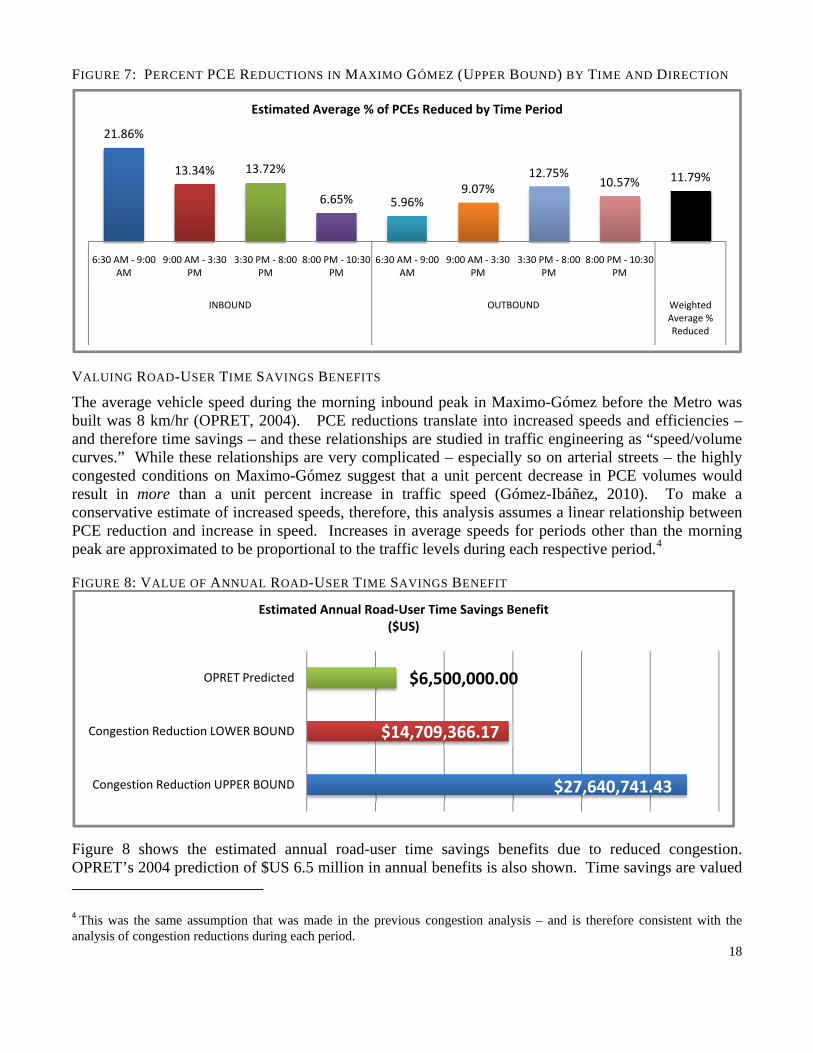
FIGURE 7: PERCENT PCE REDUCTIONS IN MAXIMO GÓMEZ (UPPER BOUND) BY TIME AND DIRECTION
21.86%
13.34% 13.72%
6.65% 5.96%9.07%
12.75%10.57% 11.79%
6:30 AM ‐ 9:00 AM
9:00 AM ‐ 3:30 PM
3:30 PM ‐ 8:00 PM
8:00 PM ‐ 10:30 PM
6:30 AM ‐ 9:00 AM
9:00 AM ‐ 3:30 PM
3:30 PM ‐ 8:00 PM
8:00 PM ‐ 10:30 PM
INBOUND OUTBOUND Weighted Average % Reduced
Estimated Average % of PCEs Reduced by Time Period
VALUING ROAD-USER TIME SAVINGS BENEFITS
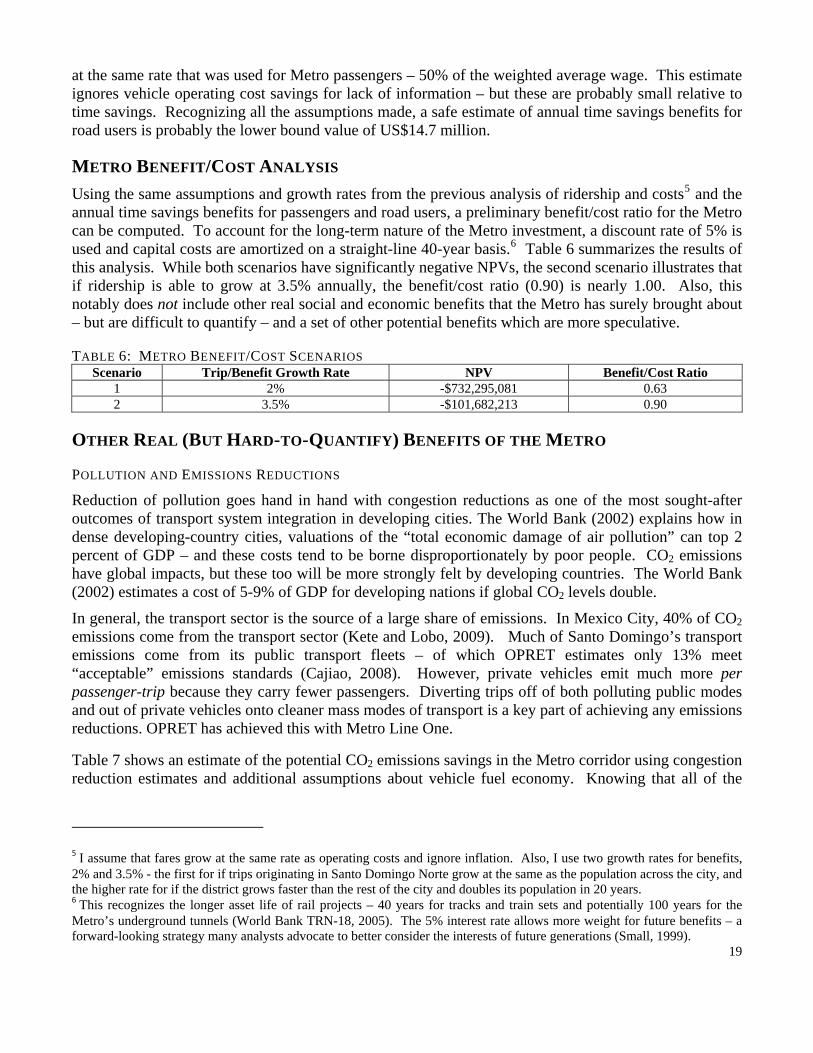
The average vehicle speed during the morning inbound peak in Maximo-Gómez before the Metro was built was 8 km/hr (OPRET, 2004). PCE reductions translate into increased speeds and efficiencies – and therefore time savings – and these relationships are studied in traffic engineering as “speed/volume curves.” While these relationships are very complicated – especially so on arterial streets – the highly congested conditions on Maximo-Gómez suggest that a unit percent decrease in PCE volumes would result in more than a unit percent increase in traffic speed (Gómez-Ibáñez, 2010). To make a conservative estimate of increased speeds, therefore, this analysis assumes a linear relationship between PCE reduction and increase in speed. Increases in average speeds for periods other than the morning peak are approximated to be proportional to the traffic levels during each respective period.4
FIGURE 8: VALUE OF ANNUAL ROAD-USER TIME SAVINGS BENEFIT
$27,640,741.43
$14,709,366.17
$6,500,000.00
Congestion Reduction UPPER BOUND
Congestion Reduction LOWER BOUND
OPRET Predicted
Estimated Annual Road‐User Time Savings Benefit($US)
Figure 8 shows the estimated annual road-user time savings benefits due to reduced congestion. OPRET’s 2004 prediction of $US 6.5 million in annual benefits is also shown. Time savings are valued
18
4 This was the same assumption that was made in the previous congestion analysis – and is therefore consistent with the analysis of congestion reductions during each period.
19
at the same rate that was used for Metro passengers – 50% of the weighted average wage. This estimate ignores vehicle operating cost savings for lack of information – but these are probably small relative to time savings. Recognizing all the assumptions made, a safe estimate of annual time savings benefits for road users is probably the lower bound value of US$14.7 million.
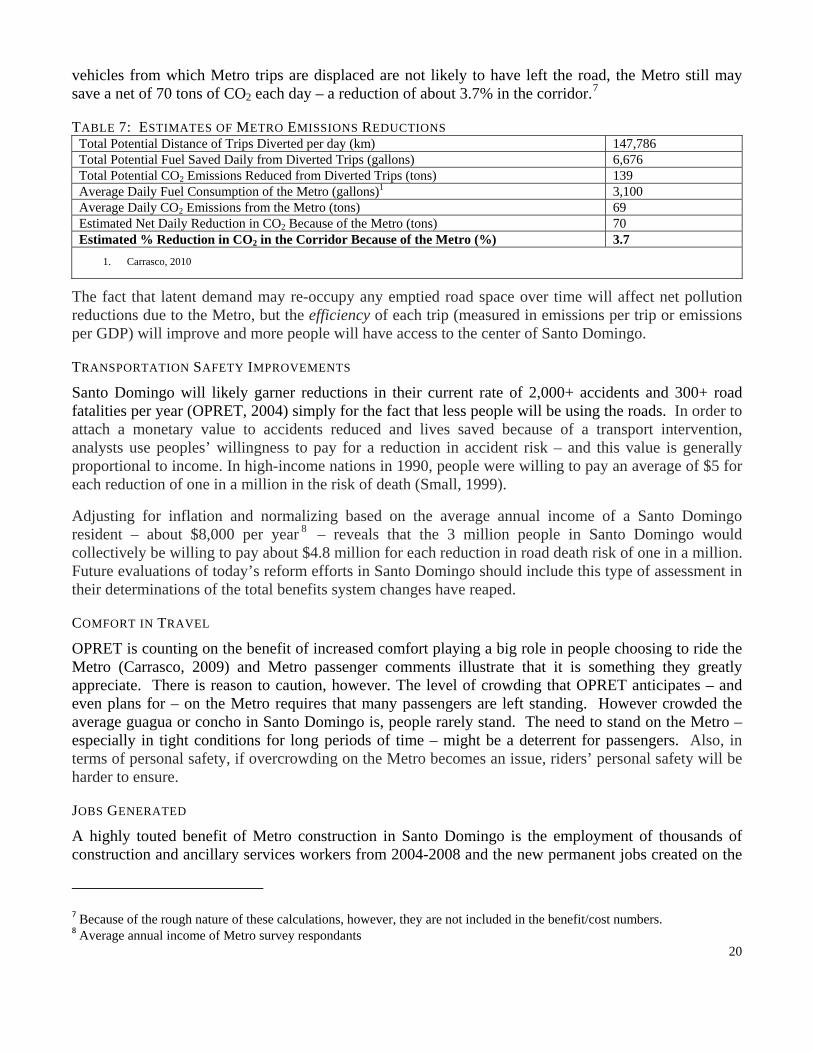
METRO BENEFIT/COST ANALYSIS Using the same assumptions and growth rates from the previous analysis of ridership and costs5 and the annual time savings benefits for passengers and road users, a preliminary benefit/cost ratio for the Metro can be computed. To account for the long-term nature of the Metro investment, a discount rate of 5% is used and capital costs are amortized on a straight-line 40-year basis.6 Table 6 summarizes the results of this analysis. While both scenarios have significantly negative NPVs, the second scenario illustrates that if ridership is able to grow at 3.5% annually, the benefit/cost ratio (0.90) is nearly 1.00. Also, this notably does not include other real social and economic benefits that the Metro has surely brought about – but are difficult to quantify – and a set of other potential benefits which are more speculative.
TABLE 6: METRO BENEFIT/COST SCENARIOS Scenario Trip/Benefit Growth Rate NPV Benefit/Cost Ratio
1 2% -$732,295,081 0.63 2 3.5% -$101,682,213 0.90
OTHER REAL (BUT HARD-TO-QUANTIFY) BENEFITS OF THE METRO
POLLUTION AND EMISSIONS REDUCTIONS
Reduction of pollution goes hand in hand with congestion reductions as one of the most sought-after outcomes of transport system integration in developing cities. The World Bank (2002) explains how in dense developing-country cities, valuations of the “total economic damage of air pollution” can top 2 percent of GDP – and these costs tend to be borne disproportionately by poor people. CO2 emissions have global impacts, but these too will be more strongly felt by developing countries. The World Bank (2002) estimates a cost of 5-9% of GDP for developing nations if global CO2 levels double.
In general, the transport sector is the source of a large share of emissions. In Mexico City, 40% of CO2 emissions come from the transport sector (Kete and Lobo, 2009). Much of Santo Domingo’s transport emissions come from its public transport fleets – of which OPRET estimates only 13% meet “acceptable” emissions standards (Cajiao, 2008). However, private vehicles emit much more per passenger-trip because they carry fewer passengers. Diverting trips off of both polluting public modes and out of private vehicles onto cleaner mass modes of transport is a key part of achieving any emissions reductions. OPRET has achieved this with Metro Line One.
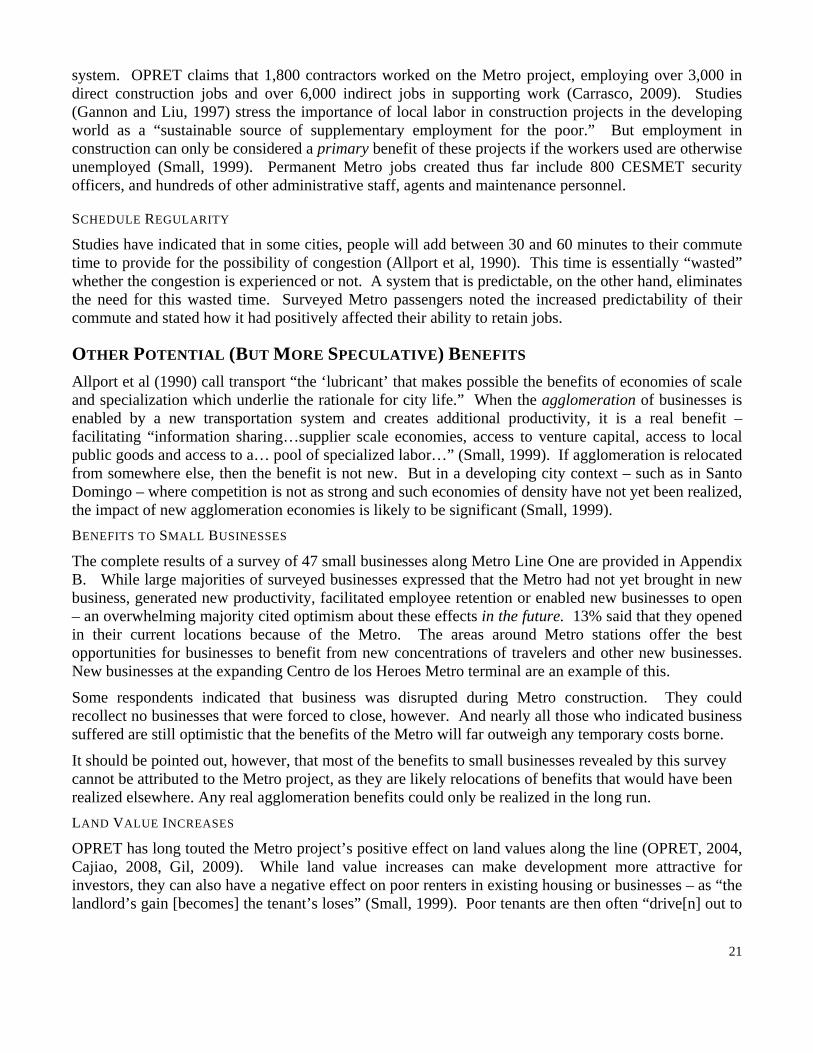
Table 7 shows an estimate of the potential CO2 emissions savings in the Metro corridor using congestion reduction estimates and additional assumptions about vehicle fuel economy. Knowing that all of the
5 I assume that fares grow at the same rate as operating costs and ignore inflation. Also, I use two growth rates for benefits, 2% and 3.5% - the first for if trips originating in Santo Domingo Norte grow at the same as the population across the city, and the higher rate for if the district grows faster than the rest of the city and doubles its population in 20 years. 6 This recognizes the longer asset life of rail projects – 40 years for tracks and train sets and potentially 100 years for the Metro’s underground tunnels (World Bank TRN-18, 2005). The 5% interest rate allows more weight for future benefits – a forward-looking strategy many analysts advocate to better consider the interests of future generations (Small, 1999).
20
vehicles from which Metro trips are displaced are not likely to have left the road, the Metro still may save a net of 70 tons of CO2 each day – a reduction of about 3.7% in the corridor.7
TABLE 7: ESTIMATES OF METRO EMISSIONS REDUCTIONS Total Potential Distance of Trips Diverted per day (km) 147,786 Total Potential Fuel Saved Daily from Diverted Trips (gallons) 6,676 Total Potential CO2 Emissions Reduced from Diverted Trips (tons) 139 Average Daily Fuel Consumption of the Metro (gallons)1 3,100 Average Daily CO2 Emissions from the Metro (tons) 69 Estimated Net Daily Reduction in CO2 Because of the Metro (tons) 70 Estimated % Reduction in CO2 in the Corridor Because of the Metro (%) 3.7
1. Carrasco, 2010
The fact that latent demand may re-occupy any emptied road space over time will affect net pollution reductions due to the Metro, but the efficiency of each trip (measured in emissions per trip or emissions per GDP) will improve and more people will have access to the center of Santo Domingo.
TRANSPORTATION SAFETY IMPROVEMENTS
Santo Domingo will likely garner reductions in their current rate of 2,000+ accidents and 300+ road fatalities per year (OPRET, 2004) simply for the fact that less people will be using the roads. In order to attach a monetary value to accidents reduced and lives saved because of a transport intervention, analysts use peoples’ willingness to pay for a reduction in accident risk – and this value is generally proportional to income. In high-income nations in 1990, people were willing to pay an average of $5 for each reduction of one in a million in the risk of death (Small, 1999).
Adjusting for inflation and normalizing based on the average annual income of a Santo Domingo resident – about $8,000 per year 8 – reveals that the 3 million people in Santo Domingo would collectively be willing to pay about $4.8 million for each reduction in road death risk of one in a million. Future evaluations of today’s reform efforts in Santo Domingo should include this type of assessment in their determinations of the total benefits system changes have reaped.
COMFORT IN TRAVEL
OPRET is counting on the benefit of increased comfort playing a big role in people choosing to ride the Metro (Carrasco, 2009) and Metro passenger comments illustrate that it is something they greatly appreciate. There is reason to caution, however. The level of crowding that OPRET anticipates – and even plans for – on the Metro requires that many passengers are left standing. However crowded the average guagua or concho in Santo Domingo is, people rarely stand. The need to stand on the Metro – especially in tight conditions for long periods of time – might be a deterrent for passengers. Also, in terms of personal safety, if overcrowding on the Metro becomes an issue, riders’ personal safety will be harder to ensure.
JOBS GENERATED
A highly touted benefit of Metro construction in Santo Domingo is the employment of thousands of construction and ancillary services workers from 2004-2008 and the new permanent jobs created on the
7 Because of the rough nature of these calculations, however, they are not included in the benefit/cost numbers. 8 Average annual income of Metro survey respondants
21
system. OPRET claims that 1,800 contractors worked on the Metro project, employing over 3,000 in direct construction jobs and over 6,000 indirect jobs in supporting work (Carrasco, 2009). Studies (Gannon and Liu, 1997) stress the importance of local labor in construction projects in the developing world as a “sustainable source of supplementary employment for the poor.” But employment in construction can only be considered a primary benefit of these projects if the workers used are otherwise unemployed (Small, 1999). Permanent Metro jobs created thus far include 800 CESMET security officers, and hundreds of other administrative staff, agents and maintenance personnel.
SCHEDULE REGULARITY
Studies have indicated that in some cities, people will add between 30 and 60 minutes to their commute time to provide for the possibility of congestion (Allport et al, 1990). This time is essentially “wasted” whether the congestion is experienced or not. A system that is predictable, on the other hand, eliminates the need for this wasted time. Surveyed Metro passengers noted the increased predictability of their commute and stated how it had positively affected their ability to retain jobs.
OTHER POTENTIAL (BUT MORE SPECULATIVE) BENEFITS Allport et al (1990) call transport “the ‘lubricant’ that makes possible the benefits of economies of scale and specialization which underlie the rationale for city life.” When the agglomeration of businesses is enabled by a new transportation system and creates additional productivity, it is a real benefit – facilitating “information sharing…supplier scale economies, access to venture capital, access to local public goods and access to a… pool of specialized labor…” (Small, 1999). If agglomeration is relocated from somewhere else, then the benefit is not new. But in a developing city context – such as in Santo Domingo – where competition is not as strong and such economies of density have not yet been realized, the impact of new agglomeration economies is likely to be significant (Small, 1999). BENEFITS TO SMALL BUSINESSES
The complete results of a survey of 47 small businesses along Metro Line One are provided in Appendix B. While large majorities of surveyed businesses expressed that the Metro had not yet brought in new business, generated new productivity, facilitated employee retention or enabled new businesses to open – an overwhelming majority cited optimism about these effects in the future. 13% said that they opened in their current locations because of the Metro. The areas around Metro stations offer the best opportunities for businesses to benefit from new concentrations of travelers and other new businesses. New businesses at the expanding Centro de los Heroes Metro terminal are an example of this.
Some respondents indicated that business was disrupted during Metro construction. They could recollect no businesses that were forced to close, however. And nearly all those who indicated business suffered are still optimistic that the benefits of the Metro will far outweigh any temporary costs borne.
It should be pointed out, however, that most of the benefits to small businesses revealed by this survey cannot be attributed to the Metro project, as they are likely relocations of benefits that would have been realized elsewhere. Any real agglomeration benefits could only be realized in the long run. LAND VALUE INCREASES
OPRET has long touted the Metro project’s positive effect on land values along the line (OPRET, 2004, Cajiao, 2008, Gil, 2009). While land value increases can make development more attractive for investors, they can also have a negative effect on poor renters in existing housing or businesses – as “the landlord’s gain [becomes] the tenant’s loses” (Small, 1999). Poor tenants are then often “drive[n] out to
22
more distant, less-expensive locations” (World Bank, 2002) and these outlying areas become concentrations of poverty – as they are in São Paulo (Hidalgo, 2009) and already are in Santo Domingo.
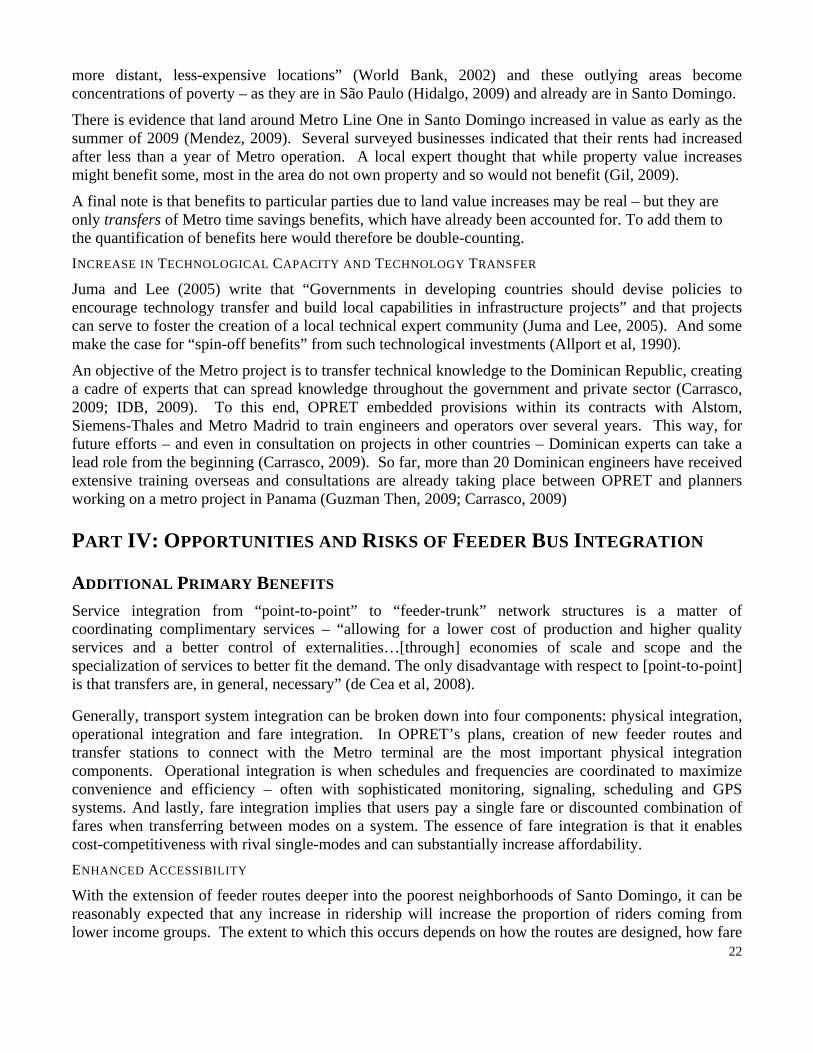
There is evidence that land around Metro Line One in Santo Domingo increased in value as early as the summer of 2009 (Mendez, 2009). Several surveyed businesses indicated that their rents had increased after less than a year of Metro operation. A local expert thought that while property value increases might benefit some, most in the area do not own property and so would not benefit (Gil, 2009).
A final note is that benefits to particular parties due to land value increases may be real – but they are only transfers of Metro time savings benefits, which have already been accounted for. To add them to the quantification of benefits here would therefore be double-counting. INCREASE IN TECHNOLOGICAL CAPACITY AND TECHNOLOGY TRANSFER
Juma and Lee (2005) write that “Governments in developing countries should devise policies to encourage technology transfer and build local capabilities in infrastructure projects” and that projects can serve to foster the creation of a local technical expert community (Juma and Lee, 2005). And some make the case for “spin-off benefits” from such technological investments (Allport et al, 1990).
An objective of the Metro project is to transfer technical knowledge to the Dominican Republic, creating a cadre of experts that can spread knowledge throughout the government and private sector (Carrasco, 2009; IDB, 2009). To this end, OPRET embedded provisions within its contracts with Alstom, Siemens-Thales and Metro Madrid to train engineers and operators over several years. This way, for future efforts – and even in consultation on projects in other countries – Dominican experts can take a lead role from the beginning (Carrasco, 2009). So far, more than 20 Dominican engineers have received extensive training overseas and consultations are already taking place between OPRET and planners working on a metro project in Panama (Guzman Then, 2009; Carrasco, 2009)
PART IV: OPPORTUNITIES AND RISKS OF FEEDER BUS INTEGRATION
ADDITIONAL PRIMARY BENEFITS Service integration from “point-to-point” to “feeder-trunk” network structures is a matter of coordinating complimentary services – “allowing for a lower cost of production and higher quality services and a better control of externalities…[through] economies of scale and scope and the specialization of services to better fit the demand. The only disadvantage with respect to [point-to-point] is that transfers are, in general, necessary” (de Cea et al, 2008).
Generally, transport system integration can be broken down into four components: physical integration, operational integration and fare integration. In OPRET’s plans, creation of new feeder routes and transfer stations to connect with the Metro terminal are the most important physical integration components. Operational integration is when schedules and frequencies are coordinated to maximize convenience and efficiency – often with sophisticated monitoring, signaling, scheduling and GPS systems. And lastly, fare integration implies that users pay a single fare or discounted combination of fares when transferring between modes on a system. The essence of fare integration is that it enables cost-competitiveness with rival single-modes and can substantially increase affordability. ENHANCED ACCESSIBILITY
With the extension of feeder routes deeper into the poorest neighborhoods of Santo Domingo, it can be reasonably expected that any increase in ridership will increase the proportion of riders coming from lower income groups. The extent to which this occurs depends on how the routes are designed, how fare
23
integration makes the trip cost-competitive with existing modes, and how much competition from existing operators is eliminated.
OPRET intends to integrate feeder bus and Metro fares such that the cost of any linked trip in the new system is cheaper than the equivalent trip on competing modes. Fares for feeder routes will vary by distance, but the precise rates have not yet been determined (Perez Polanco, 2010). Studies have shown that a very low or even free fare inducement is often necessary to induce passengers to use a system where they will have to add transfers to their journey (Allport et al, 1990). Discounted tickets for certain groups are another strategy to reduce the fare burden for some. OPRET plans to issue Metro and feeder bus fare discounts for students and the elderly, but these have not yet been instituted (Carrasco, 2009).
In the BRT systems in Bogotá and Santiago de Chile, efforts were made to accommodate the elderly and handicapped through accessible stations and platforms that enabled boarding vehicles without having to ascend any steps (Mojica, 2009; Downing, 2009). While already present on the Metro, it will be more of a challenge (and more expensive) to implement such provisions throughout the feeder bus system in Santo Domingo – through level boarding platforms, ramps, reserved seating and clear signage.
INCREASED RIDERSHIP AND TIME SAVINGS BENEFITS
OPRET expects an immediate 40% increase in Metro ridership once a feeder bus system for Line One is brought online (Carrasco, 2009). There is little or no literature on the incremental impacts of feeder system integration after a grade-separated trunk line has already been implemented. As such, this study makes no assertions as to the likelihood or magnitude of a potential ridership boost. But in order for any comparable boost to occur, the system must be implemented with great care. Service levels, frequencies and walking distance to stops must be at least at parity with existing services – especially if existing operators are not restricted from continuing to operate in the same routes. Fare integration must also ensure that linked trips on the new system are affordable. In order to accomplish this, OPRET is aiming to run the feeder buses with a 50% operating subsidy.
TIME SAVINGS FOR NEW RIDERS
Those feeder bus passengers that were already taking the Metro will likely not experience any additional time saved in transit – since feeder routes will operate in mixed traffic as the old buses did. All of the new time savings benefits will thus come from passengers who did not ride the Metro before the feeder system was put in place. Some additional wait time savings could be achieved throughout the feeder routes with careful scheduling, modeling and use of GPS monitoring (as was done effectively in Bogotá) to ensure frequencies are maintained at a superior level to the existing services. But the over-supply of buses also suggests that existing frequencies are already quite tight and wait times minimal. Time savings are thus not likely to accrue when transfers occur in the new system – the challenge for OPRET will be to ensure that transfers are not adding time to commutes and they are as painless as possible.
CONGESTION REDUCTION
With a substantial increase in Metro ridership, traffic in the in the Metro corridor could be further reduced if passengers who currently take a single bus for their entire trip are willing to endure a transfer and ride the new system. For this to occur, those buses whose former passengers have switched to the new system will have to leave the road completely. Congestion reduction will be more if some Santo Domingo Norte residents leave their private cars at home and take the feeder bus-Metro linked trip – which is a possibility, given the proportion of diverted private car trips on the Metro already.
24
On the feeder routes themselves, OPRET can expect congestion reductions only to the extent that passengers switch from either private vehicles or conchos with higher PCE per passenger values than the feeder buses themselves – again assuming that these vehicles leave the road willingly or by government restriction. If existing operators leave the feeder routes, congestion might also be reduced due to the more regular driving patterns of the buses. Putting an end to the “penny war,” feeder bus drivers would observe regular stops and schedules rather than racing dangerously for each new passenger. This change would also be likely to positively affect road safety outcomes and reduce accidents.
AFFECT OF THE FEEDER BUS SYSTEM ON THE METRO BENEFIT/COST ANALYSIS
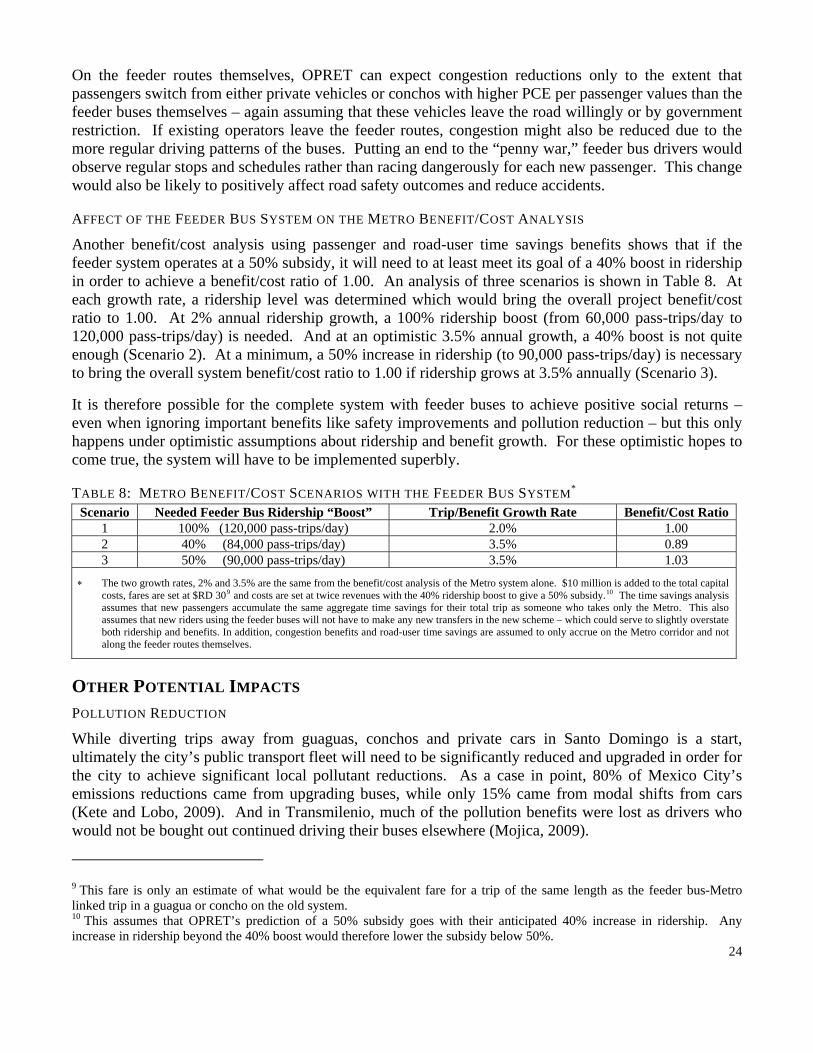
Another benefit/cost analysis using passenger and road-user time savings benefits shows that if the feeder system operates at a 50% subsidy, it will need to at least meet its goal of a 40% boost in ridership in order to achieve a benefit/cost ratio of 1.00. An analysis of three scenarios is shown in Table 8. At each growth rate, a ridership level was determined which would bring the overall project benefit/cost ratio to 1.00. At 2% annual ridership growth, a 100% ridership boost (from 60,000 pass-trips/day to 120,000 pass-trips/day) is needed. And at an optimistic 3.5% annual growth, a 40% boost is not quite enough (Scenario 2). At a minimum, a 50% increase in ridership (to 90,000 pass-trips/day) is necessary to bring the overall system benefit/cost ratio to 1.00 if ridership grows at 3.5% annually (Scenario 3).
It is therefore possible for the complete system with feeder buses to achieve positive social returns – even when ignoring important benefits like safety improvements and pollution reduction – but this only happens under optimistic assumptions about ridership and benefit growth. For these optimistic hopes to come true, the system will have to be implemented superbly.
TABLE 8: METRO BENEFIT/COST SCENARIOS WITH THE FEEDER BUS SYSTEM* Scenario Needed Feeder Bus Ridership “Boost” Trip/Benefit Growth Rate Benefit/Cost Ratio
1 100% (120,000 pass-trips/day) 2.0% 1.00 2 40% (84,000 pass-trips/day) 3.5% 0.89 3 50% (90,000 pass-trips/day) 3.5% 1.03
∗ The two growth rates, 2% and 3.5% are the same from the benefit/cost analysis of the Metro system alone. $10 million is added to the total capital costs, fares are set at $RD 309 and costs are set at twice revenues with the 40% ridership boost to give a 50% subsidy.10 The time savings analysis assumes that new passengers accumulate the same aggregate time savings for their total trip as someone who takes only the Metro. This also assumes that new riders using the feeder buses will not have to make any new transfers in the new scheme – which could serve to slightly overstate both ridership and benefits. In addition, congestion benefits and road-user time savings are assumed to only accrue on the Metro corridor and not along the feeder routes themselves.
OTHER POTENTIAL IMPACTS POLLUTION REDUCTION
While diverting trips away from guaguas, conchos and private cars in Santo Domingo is a start, ultimately the city’s public transport fleet will need to be significantly reduced and upgraded in order for the city to achieve significant local pollutant reductions. As a case in point, 80% of Mexico City’s emissions reductions came from upgrading buses, while only 15% came from modal shifts from cars (Kete and Lobo, 2009). And in Transmilenio, much of the pollution benefits were lost as drivers who would not be bought out continued driving their buses elsewhere (Mojica, 2009).
9 This fare is only an estimate of what would be the equivalent fare for a trip of the same length as the feeder bus-Metro linked trip in a guagua or concho on the old system. 10 This assumes that OPRET’s prediction of a 50% subsidy goes with their anticipated 40% increase in ridership. Any increase in ridership beyond the 40% boost would therefore lower the subsidy below 50%.
25
OPRET has not yet been able to physically remove any of its existing vehicle fleet from service, persuade operators to upgrade their fleets, or coordinate routes and schedules such that the number of vehicles necessary to provide service is reduced. For the moment, therefore, the only emissions reductions OPRET will be able to achieve will from existing buses ceasing operations on their own.
A BETTER DEAL FOR BUS DRIVERS
While many current bus drivers will lose their jobs because of eventual fleet reductions – the drivers that are hired into the new system should benefit substantially. Drivers currently often work from 4:00 AM until late at night or have other irregular schedules (Peguero, 12/30/2008). Their pay is largely dependent on the number of passengers that they pick up and given the aggressive competition – drivers struggle to get by. On top of all this, the working conditions are harsh, dirty and dangerous and drivers are often targeted for theft (Liriano, 2010). While the details have not been worked out, OPRET has assured bus operators that working conditions for the drivers of the feeder buses for Metro Line One and for future parts of the system will be substantially improved (Peguero, 12/30/2008; Carrasco, 2010).
INTEGRATION RISKS LACK OF RIDERSHIP
Low ridership is an underlying risk which relates to almost all of the other risks mentioned here. But it bears mention because it can be an issue even if every aspect of the integration is “done right” – simply because of increased incomes, motorization and changing norms. Each potential benefit of the transport system integration in Santo Domingo depends one way or another on people actually using the system. Passenger benefits will accrue to more people when more people ride, benefits to the environment and for drivers in terms of reduced congestion depend on people leaving other modes for the new system, and the financial sustainability of the system relies on riders’ fares. FAILURE OR DELAY IN NEGOTIATIONS WITH EXISTING OPERATORS
Probably the biggest risk OPRET faces is that it may be unable to reach a workable agreement with the city’s existing transport operators or that negotiations will unduly stall OPRET’s plans. Beginning the pilot plan for the feeder routes in Santo Domingo Norte without cutting a deal with operators first creates the risk of devastating protests and strikes. The federaciones have demonstrated their ability to mobilize their fleet to paralyze traffic in Santo Domingo if they are so inspired. But even if a high-level deal is struck with the federaciones, there is a danger that drivers will not accept it if many of them lose their jobs and livelihoods. Additionally, because of the complexity of the issues at hand and the number of players involved, negotiations could take months or even years to complete. REDUCTION IN SERVICE AND PERCEPTIONS OF QUALITY
There is also a risk that the new system will not achieve the same levels of service as the old system. Such an outcome in the first stages of integration in Santo Domingo would be a major setback for future efforts. Santo Domingo residents are accustomed to high frequencies, many options and vehicles that will stop for them anywhere. Some of the political risk in changing the system is unavoidable – users will have to get used to walking to bus stops rather than waving down drivers as they please. And some comfort may have to be sacrificed in order to run buses at a more efficient level of occupancy. But other aspects will depend on the technical accuracy of studies to determine frequencies and vehicle quantities. IMPOSITION OF TRANSFERS
While many existing Metro passengers likely made transfers before the Metro came into being, there are existing routes which currently enable passengers to travel long distances without a transfer. If reforms

26
restrict some of these routes from competing with the Metro and feeder routes, many users will be forced to make a transfer where they did not have to make one previously. And even though the Metro offers substantial time savings, these may not be enough to overcome transfer penalties in all cases. Such a scenario might more of a risk if operators are able to lower their fares to compete and their stops are more convenient for passengers than the new feeder bus stops. INDIRECT ROUTING
When changing from a point-to-point to a feeder-trunk network, many routes may in fact become less direct than they once were and require that passengers cover extra distance. Just as with the analysis of transfers, planners may think that time savings or comfort are enough to convince a passenger to choose a longer, more indirect route – but this can be a risky assumption. Even if one assumes that people will make rational choices about what modes to take based on time-savings, comfort and convenience, people may still perceive that the new system is irrational or inferior to the existing system if they are forced to take indirect routes. A possible example of this is route six in OPRET’s proposed layout of feeder routes – shown in Image 7. An individual commuting into the city center from La Barquita (near the end of route six) may strongly prefer to take a route that heads south and west – directly to their destination – rather than taking a feeder bus north and then west to get to the Metro.
CONCLUSIONS
As a response to Santo Domingo’s many transportation problems, the Metro and feeder bus system are a welcome change. The Metro offers its passengers substantial time savings and mobility and is shown to reduce congestion and other externalities in its corridor. There are also other benefits of the system – including pollution and accident reductions, local economic stimulus and technology transfer – which are certainly real, but are difficult to quantify. Feeder bus integration on Metro Line One has the potential to greatly enhance all of these benefits if the project is implemented well. In general, however, substantial ridership increases are also needed.
Besides lack of ridership, there is a risk of failing to come to an agreement with existing bus operators in Santo Domingo. And there are also risks in terms of the physical design of routes and services, including: potential loss of service quality, imposition of transfers and indirect routing.
In spite of many challenges and risks ahead, the transport system integration vision of President Leonel Fernández is a good one and should move forward. Paying heed to global momentum behind Agenda 21 and other multi-lateral initiatives to curb transport externalities while enabling development, the Metro and feeder bus system projects show a great deal of promise towards making a significant step forward for the Dominican Republic and its capital city.
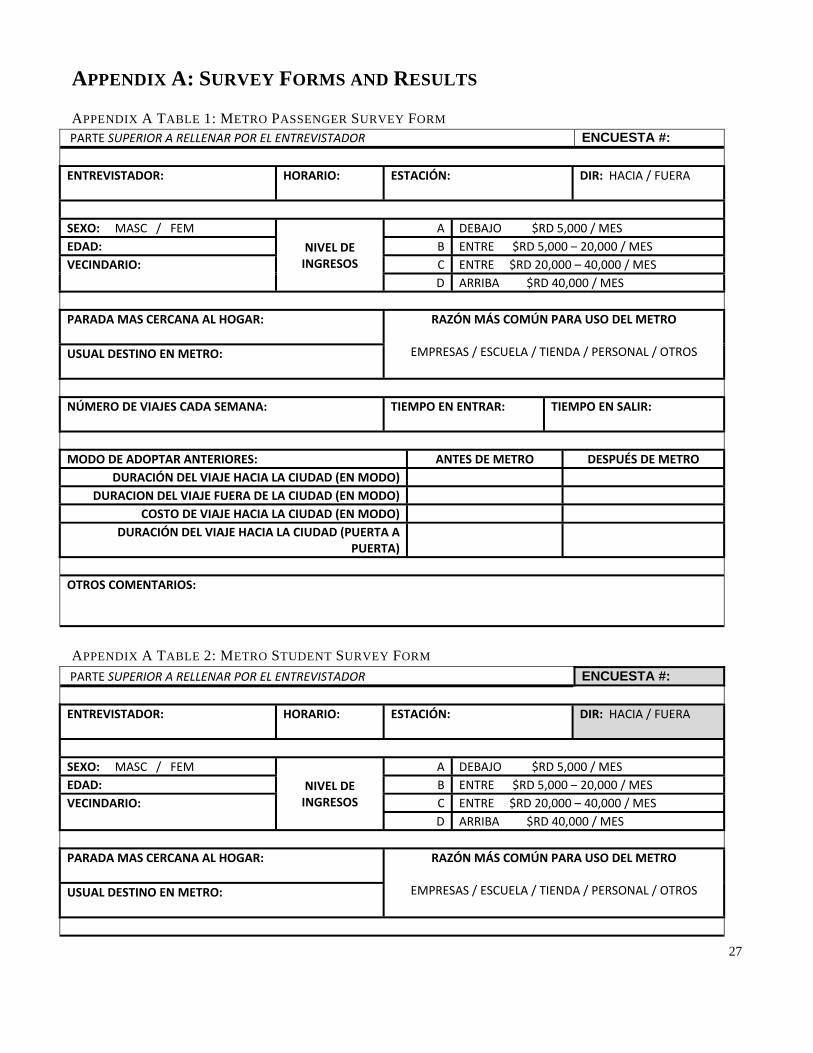
27
APPENDIX A: SURVEY FORMS AND RESULTS
APPENDIX A TABLE 1: METRO PASSENGER SURVEY FORM PARTE SUPERIOR A RELLENAR POR EL ENTREVISTADOR ENCUESTA #: ENTREVISTADOR: HORARIO: ESTACIÓN:
DIR: HACIA / FUERA
SEXO: MASC / FEM
NIVEL DE INGRESOS
A DEBAJO $RD 5,000 / MES EDAD: B ENTRE $RD 5,000 – 20,000 / MES VECINDARIO: C ENTRE $RD 20,000 – 40,000 / MES
D ARRIBA $RD 40,000 / MES
PARADA MAS CERCANA AL HOGAR:
RAZÓN MÁS COMÚN PARA USO DEL METRO
EMPRESAS / ESCUELA / TIENDA / PERSONAL / OTROS USUAL DESTINO EN METRO:
NÚMERO DE VIAJES CADA SEMANA: TIEMPO EN ENTRAR:
TIEMPO EN SALIR:
MODO DE ADOPTAR ANTERIORES: ANTES DE METRO DESPUÉS DE METRO
DURACIÓN DEL VIAJE HACIA LA CIUDAD (EN MODO) DURACION DEL VIAJE FUERA DE LA CIUDAD (EN MODO)
COSTO DE VIAJE HACIA LA CIUDAD (EN MODO) DURACIÓN DEL VIAJE HACIA LA CIUDAD (PUERTA A
PUERTA)
OTROS COMENTARIOS:
APPENDIX A TABLE 2: METRO STUDENT SURVEY FORM PARTE SUPERIOR A RELLENAR POR EL ENTREVISTADOR ENCUESTA #: ENTREVISTADOR: HORARIO: ESTACIÓN:
DIR: HACIA / FUERA
SEXO: MASC / FEM
NIVEL DE INGRESOS
A DEBAJO $RD 5,000 / MES EDAD: B ENTRE $RD 5,000 – 20,000 / MES VECINDARIO: C ENTRE $RD 20,000 – 40,000 / MES
D ARRIBA $RD 40,000 / MES
PARADA MAS CERCANA AL HOGAR:
RAZÓN MÁS COMÚN PARA USO DEL METRO
EMPRESAS / ESCUELA / TIENDA / PERSONAL / OTROS USUAL DESTINO EN METRO:
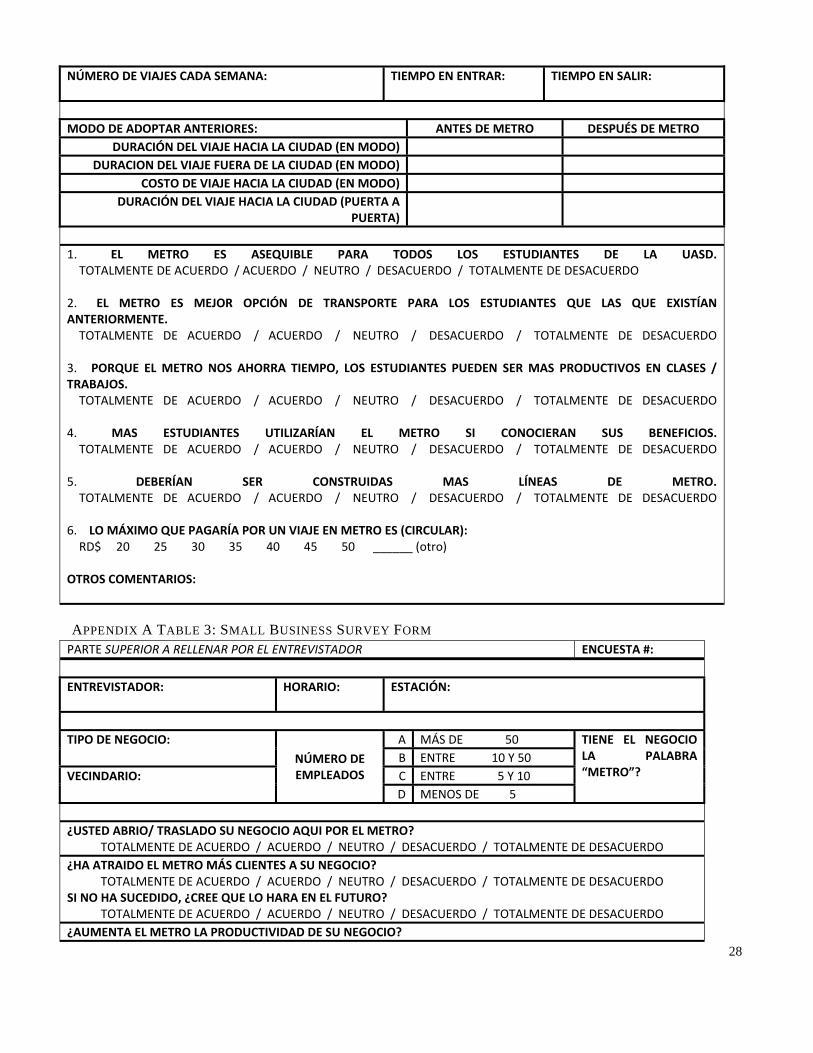
28
NÚMERO DE VIAJES CADA SEMANA: TIEMPO EN ENTRAR:
TIEMPO EN SALIR:
MODO DE ADOPTAR ANTERIORES: ANTES DE METRO DESPUÉS DE METRO
DURACIÓN DEL VIAJE HACIA LA CIUDAD (EN MODO) DURACION DEL VIAJE FUERA DE LA CIUDAD (EN MODO)
COSTO DE VIAJE HACIA LA CIUDAD (EN MODO) DURACIÓN DEL VIAJE HACIA LA CIUDAD (PUERTA A
PUERTA)
1. EL METRO ES ASEQUIBLE PARA TODOS LOS ESTUDIANTES DE LA UASD. TOTALMENTE DE ACUERDO / ACUERDO / NEUTRO / DESACUERDO / TOTALMENTE DE DESACUERDO 2. EL METRO ES MEJOR OPCIÓN DE TRANSPORTE PARA LOS ESTUDIANTES QUE LAS QUE EXISTÍAN ANTERIORMENTE. TOTALMENTE DE ACUERDO / ACUERDO / NEUTRO / DESACUERDO / TOTALMENTE DE DESACUERDO 3. PORQUE EL METRO NOS AHORRA TIEMPO, LOS ESTUDIANTES PUEDEN SER MAS PRODUCTIVOS EN CLASES / TRABAJOS. TOTALMENTE DE ACUERDO / ACUERDO / NEUTRO / DESACUERDO / TOTALMENTE DE DESACUERDO 4. MAS ESTUDIANTES UTILIZARÍAN EL METRO SI CONOCIERAN SUS BENEFICIOS. TOTALMENTE DE ACUERDO / ACUERDO / NEUTRO / DESACUERDO / TOTALMENTE DE DESACUERDO 5. DEBERÍAN SER CONSTRUIDAS MAS LÍNEAS DE METRO. TOTALMENTE DE ACUERDO / ACUERDO / NEUTRO / DESACUERDO / TOTALMENTE DE DESACUERDO 6. LO MÁXIMO QUE PAGARÍA POR UN VIAJE EN METRO ES (CIRCULAR): RD$ 20 25 30 35 40 45 50 ______ (otro)
OTROS COMENTARIOS:
APPENDIX A TABLE 3: SMALL BUSINESS SURVEY FORM PARTE SUPERIOR A RELLENAR POR EL ENTREVISTADOR ENCUESTA #:
ENTREVISTADOR:
HORARIO: ESTACIÓN:
TIPO DE NEGOCIO:
NÚMERO DE EMPLEADOS
A MÁS DE 50 TIENE EL NEGOCIO LA PALABRA “METRO”?
B ENTRE 10 Y 50VECINDARIO: C ENTRE 5 Y 10
D MENOS DE 5
¿USTED ABRIO/ TRASLADO SU NEGOCIO AQUI POR EL METRO? TOTALMENTE DE ACUERDO / ACUERDO / NEUTRO / DESACUERDO / TOTALMENTE DE DESACUERDO
¿HA ATRAIDO EL METRO MÁS CLIENTES A SU NEGOCIO? TOTALMENTE DE ACUERDO / ACUERDO / NEUTRO / DESACUERDO / TOTALMENTE DE DESACUERDO
SI NO HA SUCEDIDO, ¿CREE QUE LO HARA EN EL FUTURO? TOTALMENTE DE ACUERDO / ACUERDO / NEUTRO / DESACUERDO / TOTALMENTE DE DESACUERDO
¿AUMENTA EL METRO LA PRODUCTIVIDAD DE SU NEGOCIO?
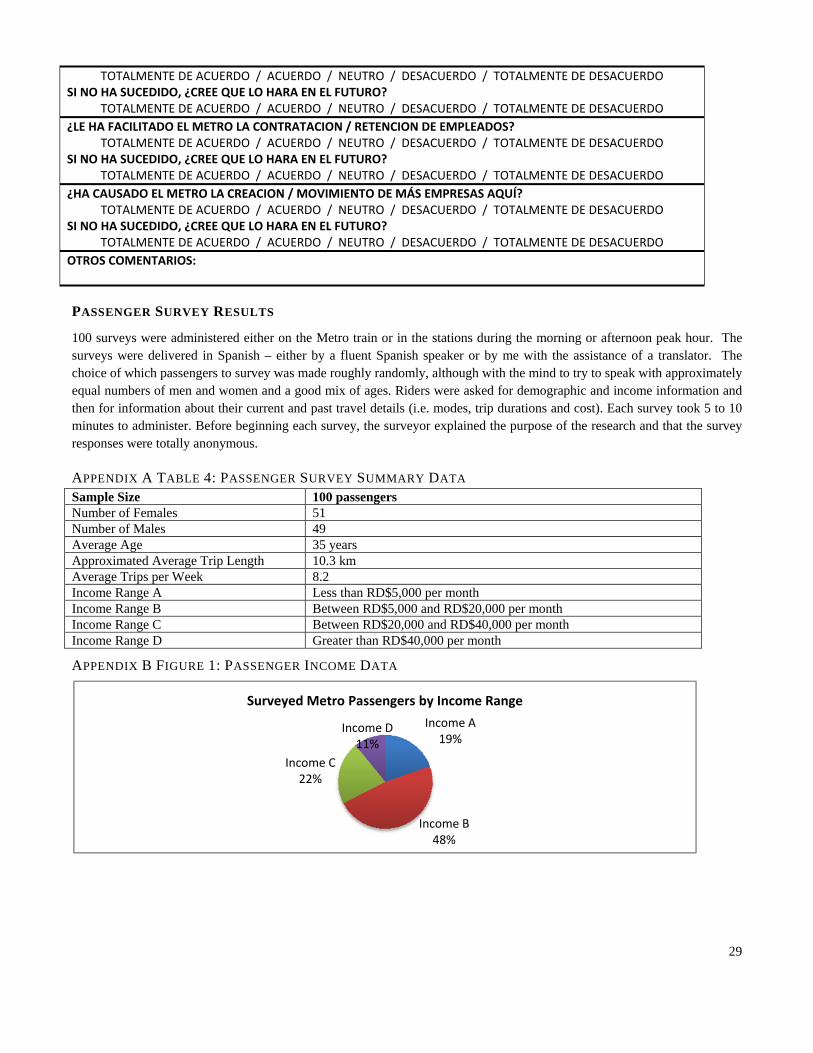
TOTALMENTE DE ACUERDO / ACUERDO / NEUTRO / DESACUERDO / TOTALMENTE DE DESACUERDOSI NO HA SUCEDIDO, ¿CREE QUE LO HARA EN EL FUTURO?
TOTALMENTE DE ACUERDO / ACUERDO / NEUTRO / DESACUERDO / TOTALMENTE DE DESACUERDO ¿LE HA FACILITADO EL METRO LA CONTRATACION / RETENCION DE EMPLEADOS?
TOTALMENTE DE ACUERDO / ACUERDO / NEUTRO / DESACUERDO / TOTALMENTE DE DESACUERDO SI NO HA SUCEDIDO, ¿CREE QUE LO HARA EN EL FUTURO?
TOTALMENTE DE ACUERDO / ACUERDO / NEUTRO / DESACUERDO / TOTALMENTE DE DESACUERDO ¿HA CAUSADO EL METRO LA CREACION / MOVIMIENTO DE MÁS EMPRESAS AQUÍ?
TOTALMENTE DE ACUERDO / ACUERDO / NEUTRO / DESACUERDO / TOTALMENTE DE DESACUERDO SI NO HA SUCEDIDO, ¿CREE QUE LO HARA EN EL FUTURO?
TOTALMENTE DE ACUERDO / ACUERDO / NEUTRO / DESACUERDO / TOTALMENTE DE DESACUERDO OTROS COMENTARIOS:
PASSENGER SURVEY RESULTS
100 surveys were administered either on the Metro train or in the stations during the morning or afternoon peak hour. The surveys were delivered in Spanish – either by a fluent Spanish speaker or by me with the assistance of a translator. The choice of which passengers to survey was made roughly randomly, although with the mind to try to speak with approximately equal numbers of men and women and a good mix of ages. Riders were asked for demographic and income information and then for information about their current and past travel details (i.e. modes, trip durations and cost). Each survey took 5 to 10 minutes to administer. Before beginning each survey, the surveyor explained the purpose of the research and that the survey responses were totally anonymous.
APPENDIX A TABLE 4: PASSENGER SURVEY SUMMARY DATA Sample Size 100 passengers Number of Females 51 Number of Males 49 Average Age 35 years Approximated Average Trip Length 10.3 km Average Trips per Week 8.2 Income Range A Less than RD$5,000 per month Income Range B Between RD$5,000 and RD$20,000 per month Income Range C Between RD$20,000 and RD$40,000 per month Income Range D Greater than RD$40,000 per month
APPENDIX B FIGURE 1: PASSENGER INCOME DATA
Income A19%
Income B48%
Income C22%
Income D11%
Surveyed Metro Passengers by Income Range
29
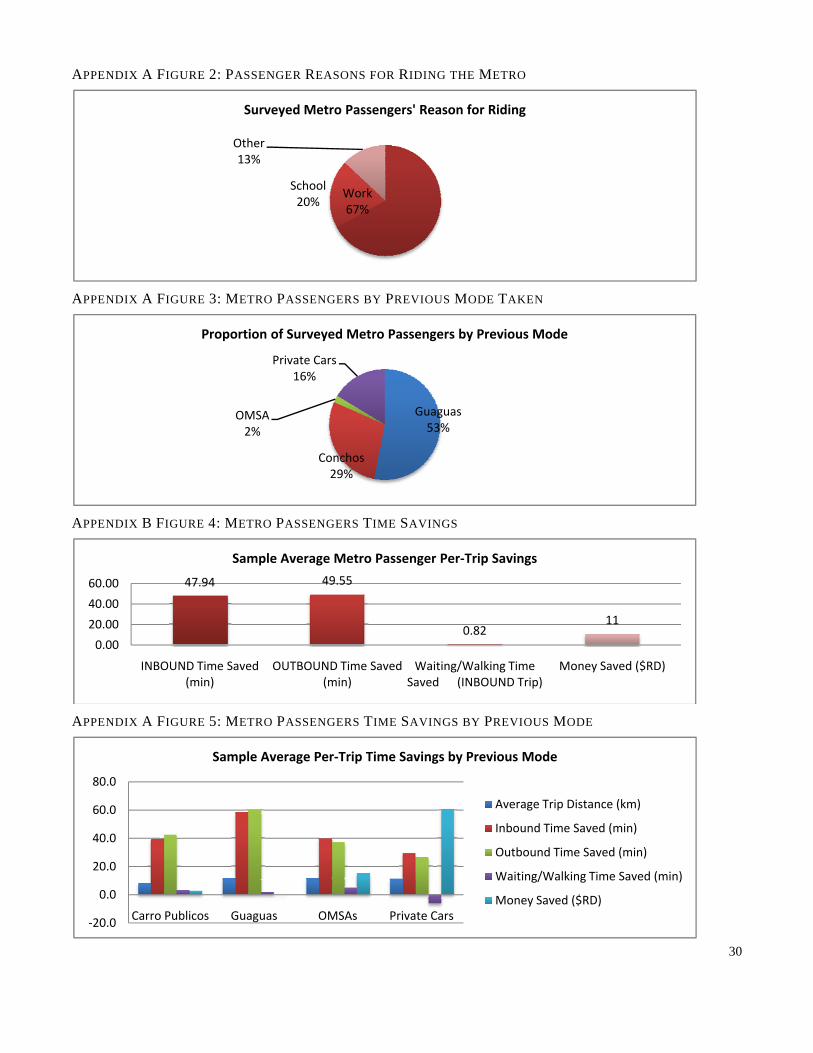
APPENDIX A FIGURE 2: PASSENGER REASONS FOR RIDING THE METRO
Work67%
School20%
Other 13%
Surveyed Metro Passengers' Reason for Riding
APPENDIX A FIGURE 3: METRO PASSENGERS BY PREVIOUS MODE TAKEN
Guaguas53%
Conchos29%
OMSA2%
Private Cars16%
Proportion of Surveyed Metro Passengers by Previous Mode
APPENDIX B FIGURE 4: METRO PASSENGERS TIME SAVINGS
47.94 49.55
0.8211
0.00
20.00
40.00
60.00
INBOUND Time Saved (min)
OUTBOUND Time Saved (min)
Waiting/Walking Time Saved (INBOUND Trip)
Money Saved ($RD)
Sample Average Metro Passenger Per‐Trip Savings
APPENDIX A FIGURE 5: METRO PASSENGERS TIME SAVINGS BY PREVIOUS MODE
‐20.0
0.0
20.0
40.0
60.0
80.0
Carro Publicos Guaguas OMSAs Private Cars
Sample Average Per‐Trip Time Savings by Previous Mode
Average Trip Distance (km)
Inbound Time Saved (min)
Outbound Time Saved (min)
Waiting/Walking Time Saved (min)
Money Saved ($RD)
30
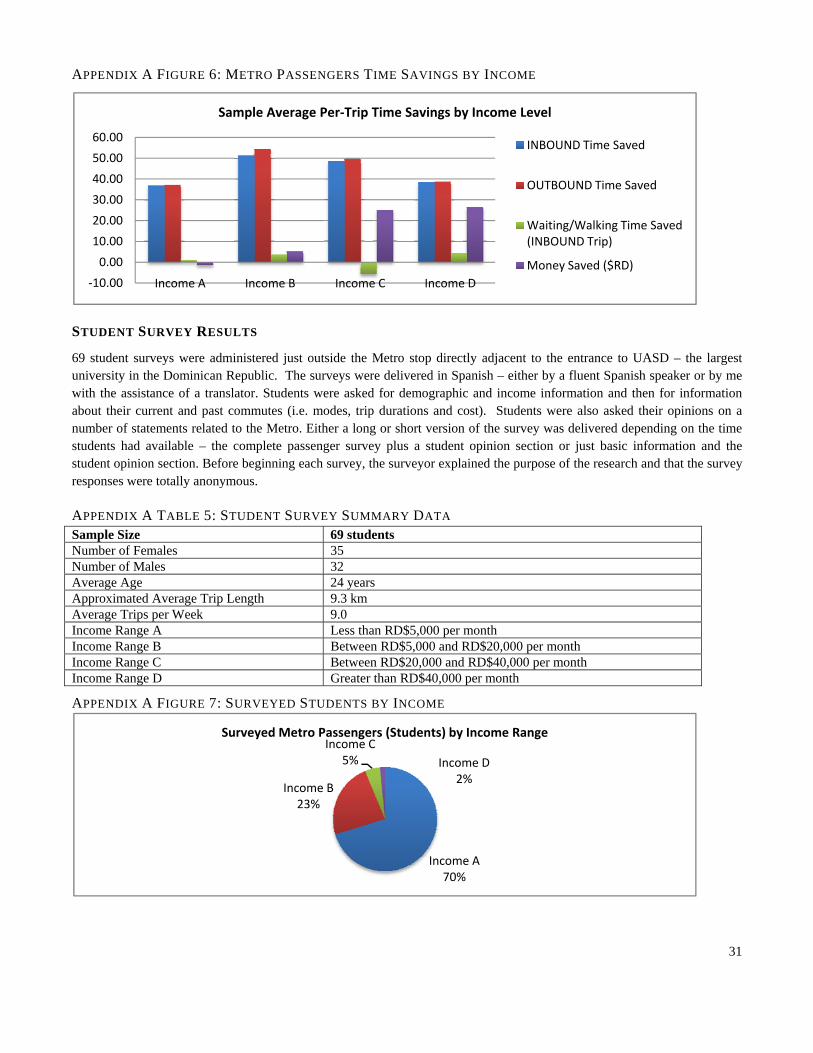
APPENDIX A FIGURE 6: METRO PASSENGERS TIME SAVINGS BY INCOME
‐10.00
0.00
10.00
20.00
30.00
40.00
50.00
60.00
Income A Income B Income C Income D
Sample Average Per‐Trip Time Savings by Income Level
INBOUND Time Saved
OUTBOUND Time Saved
Waiting/Walking Time Saved (INBOUND Trip)
Money Saved ($RD)
STUDENT SURVEY RESULTS
69 student surveys were administered just outside the Metro stop directly adjacent to the entrance to UASD – the largest university in the Dominican Republic. The surveys were delivered in Spanish – either by a fluent Spanish speaker or by me with the assistance of a translator. Students were asked for demographic and income information and then for information about their current and past commutes (i.e. modes, trip durations and cost). Students were also asked their opinions on a number of statements related to the Metro. Either a long or short version of the survey was delivered depending on the time students had available – the complete passenger survey plus a student opinion section or just basic information and the student opinion section. Before beginning each survey, the surveyor explained the purpose of the research and that the survey responses were totally anonymous.
APPENDIX A TABLE 5: STUDENT SURVEY SUMMARY DATA Sample Size 69 students Number of Females 35 Number of Males 32 Average Age 24 years Approximated Average Trip Length 9.3 km Average Trips per Week 9.0 Income Range A Less than RD$5,000 per month Income Range B Between RD$5,000 and RD$20,000 per month Income Range C Between RD$20,000 and RD$40,000 per month Income Range D Greater than RD$40,000 per month
APPENDIX A FIGURE 7: SURVEYED STUDENTS BY INCOME
Income A70%
Income B23%
Income C5% Income D
2%
Surveyed Metro Passengers (Students) by Income Range
31
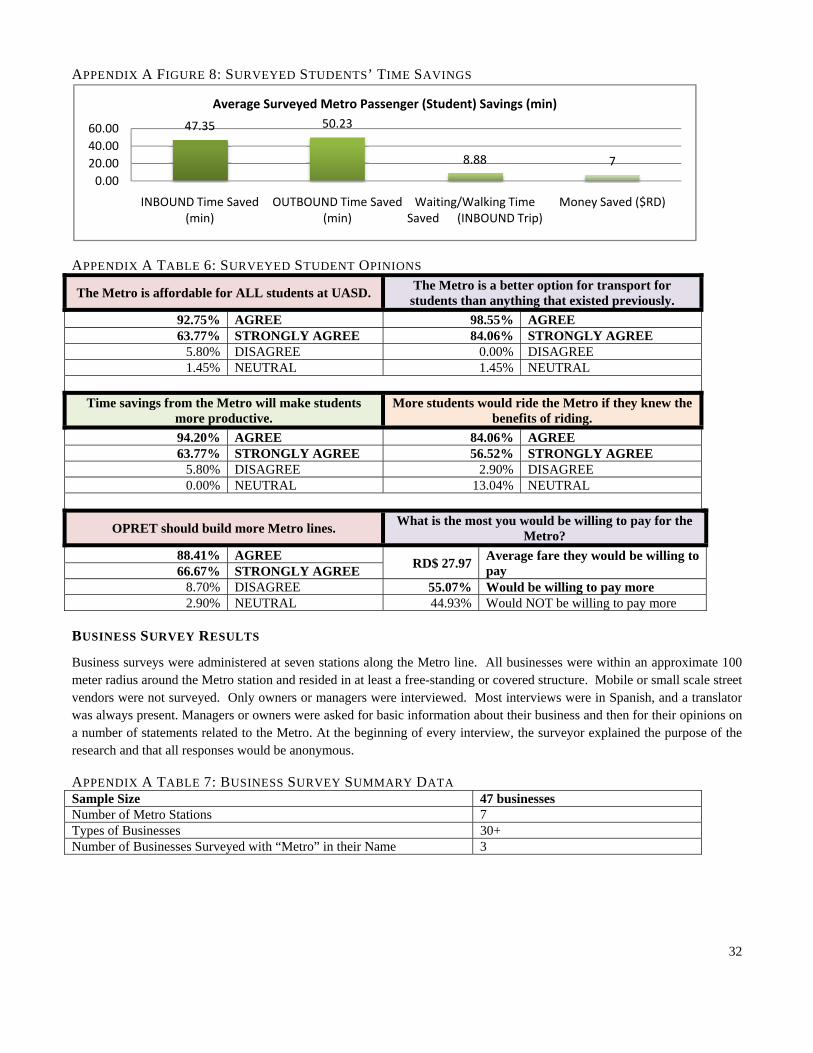
APPENDIX A FIGURE 8: SURVEYED STUDENTS’ TIME SAVINGS
47.35 50.23
8.88 7
0.0020.0040.0060.00
INBOUND Time Saved (min)
OUTBOUND Time Saved (min)
Waiting/Walking Time Saved (INBOUND Trip)
Money Saved ($RD)
Average Surveyed Metro Passenger (Student) Savings (min)
APPENDIX A TABLE 6: SURVEYED STUDENT OPINIONS
The Metro is affordable for ALL students at UASD. The Metro is a better option for transport for students than anything that existed previously.
92.75% AGREE 98.55% AGREE 63.77% STRONGLY AGREE 84.06% STRONGLY AGREE
5.80% DISAGREE 0.00% DISAGREE 1.45% NEUTRAL 1.45% NEUTRAL
Time savings from the Metro will make students
more productive. More students would ride the Metro if they knew the
benefits of riding. 94.20% AGREE 84.06% AGREE 63.77% STRONGLY AGREE 56.52% STRONGLY AGREE
5.80% DISAGREE 2.90% DISAGREE 0.00% NEUTRAL 13.04% NEUTRAL
OPRET should build more Metro lines. What is the most you would be willing to pay for the Metro?
88.41% AGREE RD$ 27.97 Average fare they would be willing to pay 66.67% STRONGLY AGREE
8.70% DISAGREE 55.07% Would be willing to pay more 2.90% NEUTRAL 44.93% Would NOT be willing to pay more
BUSINESS SURVEY RESULTS
Business surveys were administered at seven stations along the Metro line. All businesses were within an approximate 100 meter radius around the Metro station and resided in at least a free-standing or covered structure. Mobile or small scale street vendors were not surveyed. Only owners or managers were interviewed. Most interviews were in Spanish, and a translator was always present. Managers or owners were asked for basic information about their business and then for their opinions on a number of statements related to the Metro. At the beginning of every interview, the surveyor explained the purpose of the research and that all responses would be anonymous.
APPENDIX A TABLE 7: BUSINESS SURVEY SUMMARY DATA Sample Size 47 businesses Number of Metro Stations 7 Types of Businesses 30+ Number of Businesses Surveyed with “Metro” in their Name 3
32
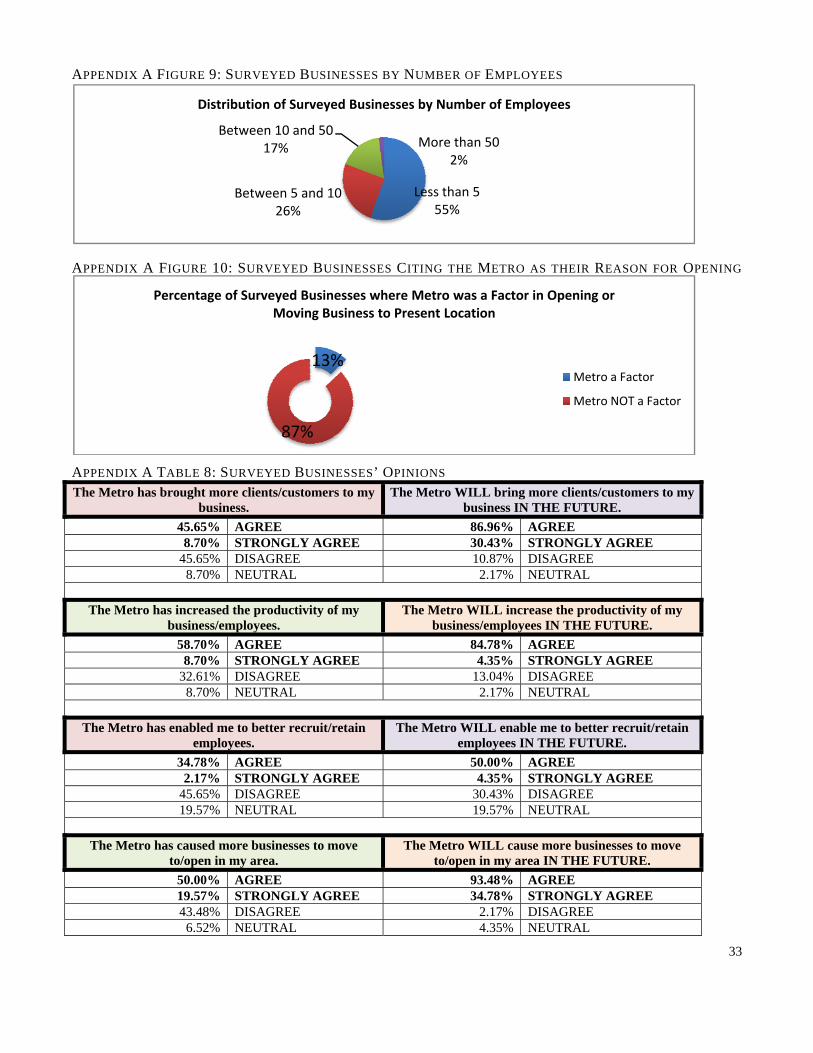
APPENDIX A FIGURE 9: SURVEYED BUSINESSES BY NUMBER OF EMPLOYEES
Less than 555%
Between 5 and 1026%
Between 10 and 5017% More than 50
2%
Distribution of Surveyed Businesses by Number of Employees
APPENDIX A FIGURE 10: SURVEYED BUSINESSES CITING THE METRO AS THEIR REASON FOR OPENING
13%
87%
Percentage of Surveyed Businesses where Metro was a Factor in Opening or Moving Business to Present Location
Metro a Factor
Metro NOT a Factor
APPENDIX A TABLE 8: SURVEYED BUSINESSES’ OPINIONS The Metro has brought more clients/customers to my
business. The Metro WILL bring more clients/customers to my
business IN THE FUTURE. 45.65% AGREE 86.96% AGREE
8.70% STRONGLY AGREE 30.43% STRONGLY AGREE 45.65% DISAGREE 10.87% DISAGREE
8.70% NEUTRAL 2.17% NEUTRAL
The Metro has increased the productivity of my business/employees.
The Metro WILL increase the productivity of my business/employees IN THE FUTURE.
58.70% AGREE 84.78% AGREE 8.70% STRONGLY AGREE 4.35% STRONGLY AGREE
32.61% DISAGREE 13.04% DISAGREE 8.70% NEUTRAL 2.17% NEUTRAL
The Metro has enabled me to better recruit/retain
employees. The Metro WILL enable me to better recruit/retain
employees IN THE FUTURE. 34.78% AGREE 50.00% AGREE
2.17% STRONGLY AGREE 4.35% STRONGLY AGREE 45.65% DISAGREE 30.43% DISAGREE 19.57% NEUTRAL 19.57% NEUTRAL
The Metro has caused more businesses to move
to/open in my area. The Metro WILL cause more businesses to move
to/open in my area IN THE FUTURE. 50.00% AGREE 93.48% AGREE 19.57% STRONGLY AGREE 34.78% STRONGLY AGREE 43.48% DISAGREE 2.17% DISAGREE
6.52% NEUTRAL 4.35% NEUTRAL
33
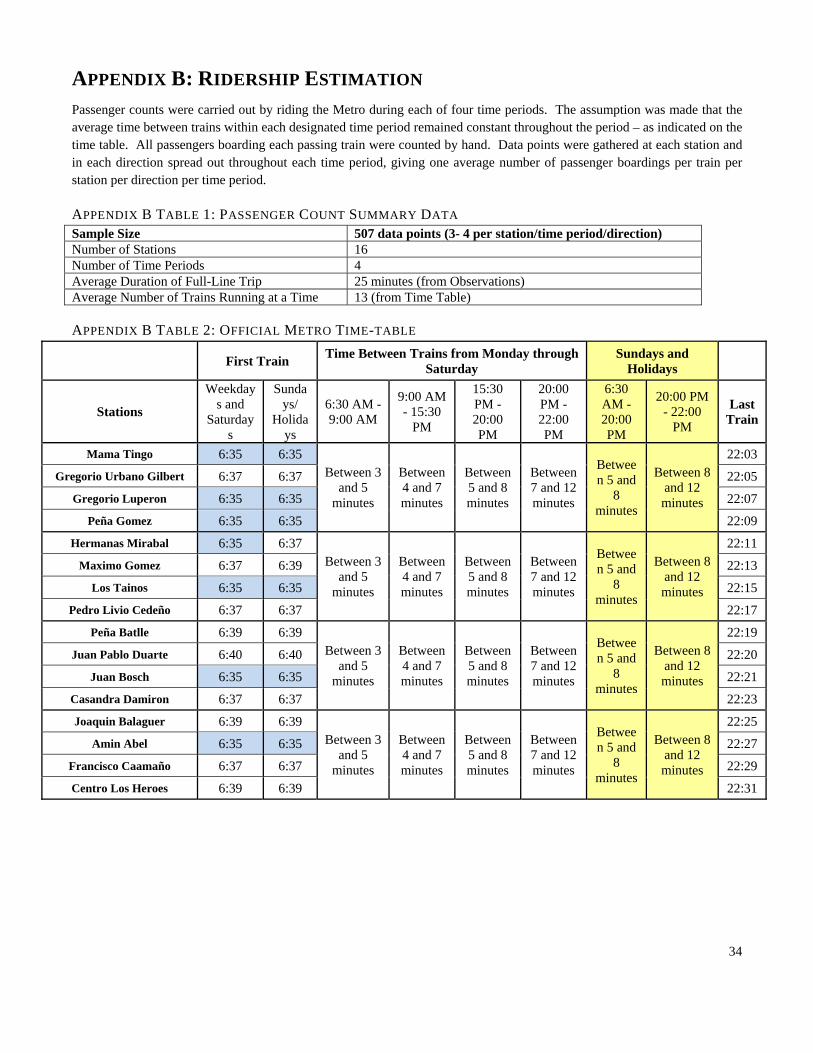
34
APPENDIX B: RIDERSHIP ESTIMATION Passenger counts were carried out by riding the Metro during each of four time periods. The assumption was made that the average time between trains within each designated time period remained constant throughout the period – as indicated on the time table. All passengers boarding each passing train were counted by hand. Data points were gathered at each station and in each direction spread out throughout each time period, giving one average number of passenger boardings per train per station per direction per time period.
APPENDIX B TABLE 1: PASSENGER COUNT SUMMARY DATA Sample Size 507 data points (3- 4 per station/time period/direction) Number of Stations 16 Number of Time Periods 4 Average Duration of Full-Line Trip 25 minutes (from Observations) Average Number of Trains Running at a Time 13 (from Time Table)
APPENDIX B TABLE 2: OFFICIAL METRO TIME-TABLE
First Train Time Between Trains from Monday through Saturday
Sundays and Holidays
Stations
Weekdays and
Saturdays
Sundays/
Holidays
6:30 AM - 9:00 AM
9:00 AM - 15:30
PM
15:30 PM - 20:00 PM
20:00 PM - 22:00 PM
6:30 AM - 20:00 PM
20:00 PM - 22:00
PM
Last Train
Mama Tingo 6:35 6:35 Between 3
and 5 minutes
Between 4 and 7 minutes
Between 5 and 8 minutes
Between 7 and 12 minutes
Between 5 and
8 minutes
Between 8 and 12 minutes
22:03
Gregorio Urbano Gilbert 6:37 6:37 22:05
Gregorio Luperon 6:35 6:35 22:07
Peña Gomez 6:35 6:35 22:09
Hermanas Mirabal 6:35 6:37 Between 3
and 5 minutes
Between 4 and 7 minutes
Between 5 and 8 minutes
Between 7 and 12 minutes
Between 5 and
8 minutes
Between 8 and 12 minutes
22:11
Maximo Gomez 6:37 6:39 22:13
Los Tainos 6:35 6:35 22:15
Pedro Livio Cedeño 6:37 6:37 22:17
Peña Batlle 6:39 6:39 Between 3
and 5 minutes
Between 4 and 7 minutes
Between 5 and 8 minutes
Between 7 and 12 minutes
Between 5 and
8 minutes
Between 8 and 12 minutes
22:19
Juan Pablo Duarte 6:40 6:40 22:20
Juan Bosch 6:35 6:35 22:21
Casandra Damiron 6:37 6:37 22:23
Joaquin Balaguer 6:39 6:39 Between 3
and 5 minutes
Between 4 and 7 minutes
Between 5 and 8 minutes
Between 7 and 12 minutes
Between 5 and
8 minutes
Between 8 and 12 minutes
22:25
Amin Abel 6:35 6:35 22:27
Francisco Caamaño 6:37 6:37 22:29
Centro Los Heroes 6:39 6:39 22:31
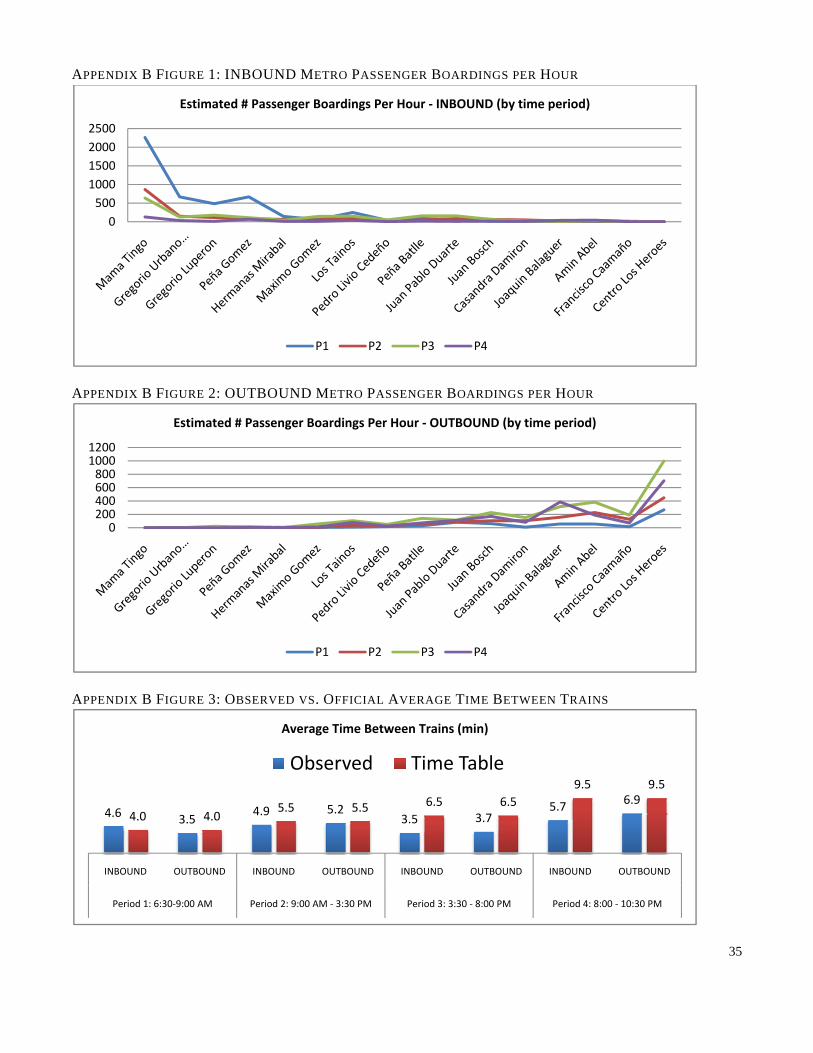
APPENDIX B FIGURE 1: INBOUND METRO PASSENGER BOARDINGS PER HOUR
05001000150020002500
Estimated # Passenger Boardings Per Hour ‐ INBOUND (by time period)
P1 P2 P3 P4
APPENDIX B FIGURE 2: OUTBOUND METRO PASSENGER BOARDINGS PER HOUR
0200400600800
10001200
Estimated # Passenger Boardings Per Hour ‐ OUTBOUND (by time period)
P1 P2 P3 P4
APPENDIX B FIGURE 3: OBSERVED VS. OFFICIAL AVERAGE TIME BETWEEN TRAINS
4.6 3.54.9 5.2
3.5 3.75.7 6.9
4.0 4.05.5 5.5 6.5 6.5
9.5 9.5
INBOUND OUTBOUND INBOUND OUTBOUND INBOUND OUTBOUND INBOUND OUTBOUND
Period 1: 6:30‐9:00 AM Period 2: 9:00 AM ‐ 3:30 PM Period 3: 3:30 ‐ 8:00 PM Period 4: 8:00 ‐ 10:30 PM
Average Time Between Trains (min)
Observed Time Table
35
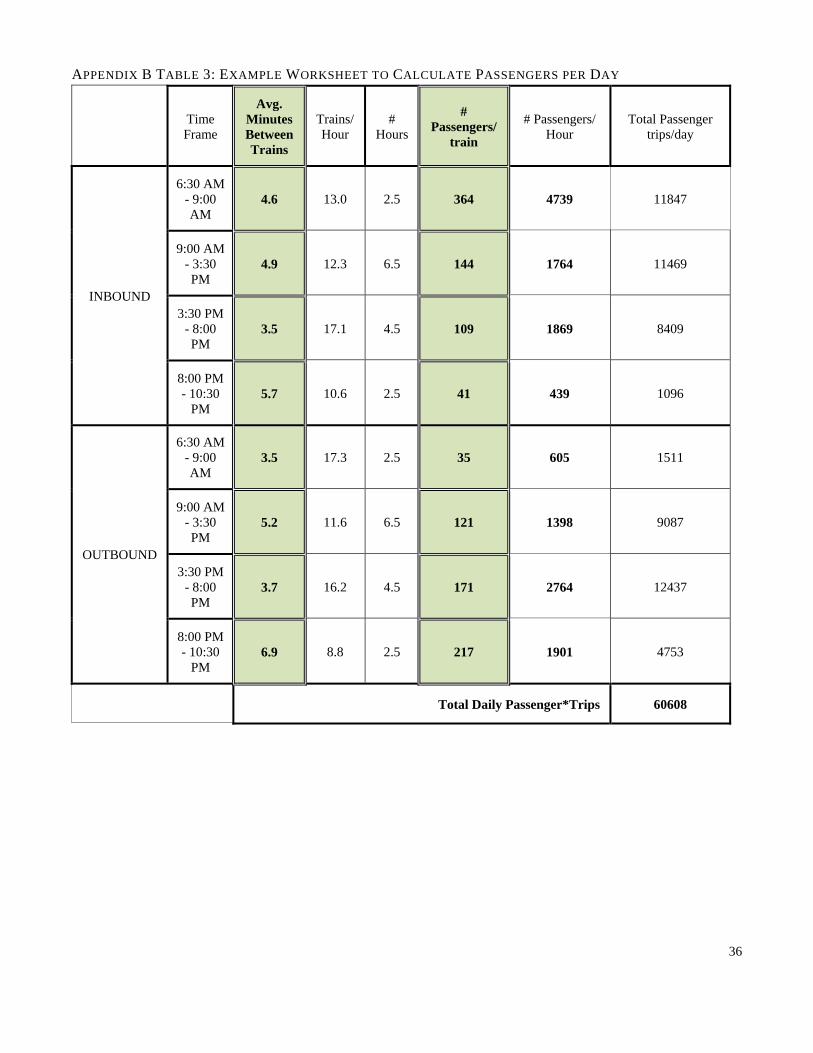
36
APPENDIX B TABLE 3: EXAMPLE WORKSHEET TO CALCULATE PASSENGERS PER DAY
Time Frame
Avg. Minutes Between Trains
Trains/ Hour
# Hours
# Passengers/
train
# Passengers/ Hour
Total Passenger trips/day
INBOUND
6:30 AM - 9:00 AM
4.6 13.0 2.5 364 4739 11847
9:00 AM - 3:30 PM
4.9 12.3 6.5 144 1764 11469
3:30 PM - 8:00 PM
3.5 17.1 4.5 109 1869 8409
8:00 PM - 10:30
PM 5.7 10.6 2.5 41 439 1096
OUTBOUND
6:30 AM - 9:00 AM
3.5 17.3 2.5 35 605 1511
9:00 AM - 3:30 PM
5.2 11.6 6.5 121 1398 9087
3:30 PM - 8:00 PM
3.7 16.2 4.5 171 2764 12437
8:00 PM - 10:30
PM 6.9 8.8 2.5 217 1901 4753
Total Daily Passenger*Trips 60608
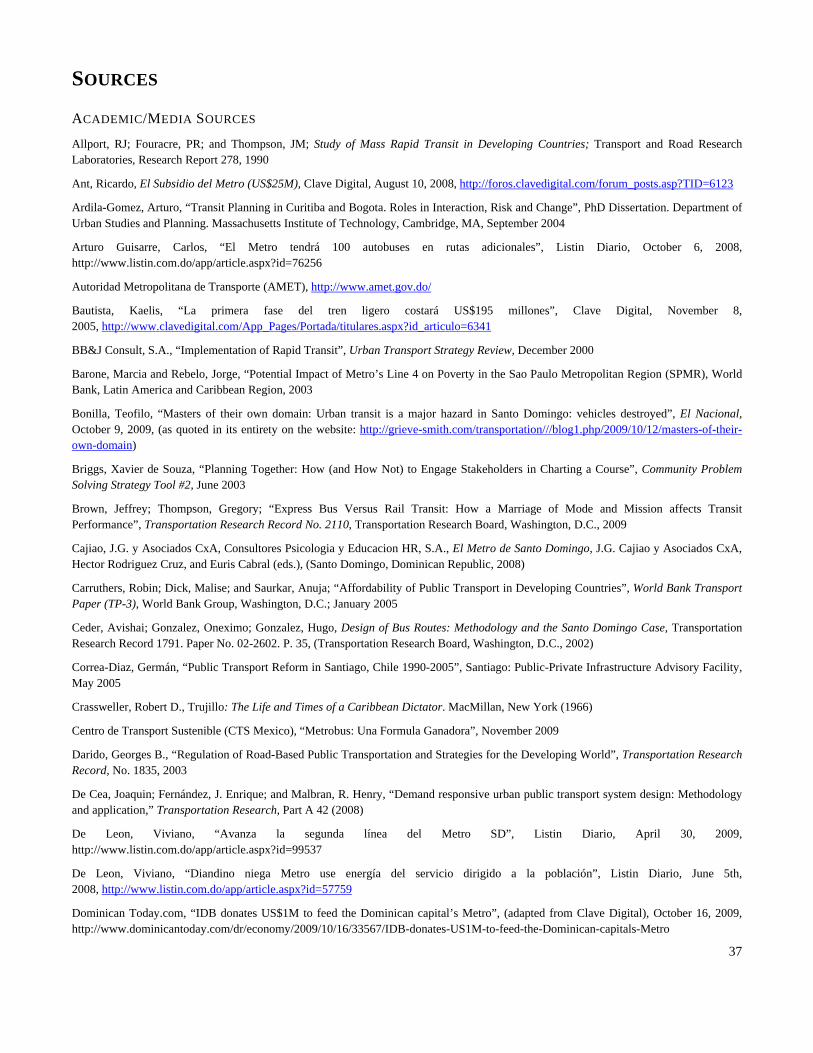
37
SOURCES
ACADEMIC/MEDIA SOURCES
Allport, RJ; Fouracre, PR; and Thompson, JM; Study of Mass Rapid Transit in Developing Countries; Transport and Road Research Laboratories, Research Report 278, 1990
Ant, Ricardo, El Subsidio del Metro (US$25M), Clave Digital, August 10, 2008, http://foros.clavedigital.com/forum_posts.asp?TID=6123
Ardila-Gomez, Arturo, “Transit Planning in Curitiba and Bogota. Roles in Interaction, Risk and Change”, PhD Dissertation. Department of Urban Studies and Planning. Massachusetts Institute of Technology, Cambridge, MA, September 2004
Arturo Guisarre, Carlos, “El Metro tendrá 100 autobuses en rutas adicionales”, Listin Diario, October 6, 2008, http://www.listin.com.do/app/article.aspx?id=76256
Autoridad Metropolitana de Transporte (AMET), http://www.amet.gov.do/
Bautista, Kaelis, “La primera fase del tren ligero costará US$195 millones”, Clave Digital, November 8, 2005, http://www.clavedigital.com/App_Pages/Portada/titulares.aspx?id_articulo=6341
BB&J Consult, S.A., “Implementation of Rapid Transit”, Urban Transport Strategy Review, December 2000
Barone, Marcia and Rebelo, Jorge, “Potential Impact of Metro’s Line 4 on Poverty in the Sao Paulo Metropolitan Region (SPMR), World Bank, Latin America and Caribbean Region, 2003
Bonilla, Teofilo, “Masters of their own domain: Urban transit is a major hazard in Santo Domingo: vehicles destroyed”, El Nacional, October 9, 2009, (as quoted in its entirety on the website: http://grieve-smith.com/transportation///blog1.php/2009/10/12/masters-of-their-own-domain)
Briggs, Xavier de Souza, “Planning Together: How (and How Not) to Engage Stakeholders in Charting a Course”, Community Problem Solving Strategy Tool #2, June 2003
Brown, Jeffrey; Thompson, Gregory; “Express Bus Versus Rail Transit: How a Marriage of Mode and Mission affects Transit Performance”, Transportation Research Record No. 2110, Transportation Research Board, Washington, D.C., 2009
Cajiao, J.G. y Asociados CxA, Consultores Psicologia y Educacion HR, S.A., El Metro de Santo Domingo, J.G. Cajiao y Asociados CxA, Hector Rodriguez Cruz, and Euris Cabral (eds.), (Santo Domingo, Dominican Republic, 2008)
Carruthers, Robin; Dick, Malise; and Saurkar, Anuja; “Affordability of Public Transport in Developing Countries”, World Bank Transport Paper (TP-3), World Bank Group, Washington, D.C.; January 2005
Ceder, Avishai; Gonzalez, Oneximo; Gonzalez, Hugo, Design of Bus Routes: Methodology and the Santo Domingo Case, Transportation Research Record 1791. Paper No. 02-2602. P. 35, (Transportation Research Board, Washington, D.C., 2002)
Correa-Diaz, Germán, “Public Transport Reform in Santiago, Chile 1990-2005”, Santiago: Public-Private Infrastructure Advisory Facility, May 2005
Crassweller, Robert D., Trujillo: The Life and Times of a Caribbean Dictator. MacMillan, New York (1966)
Centro de Transport Sustenible (CTS Mexico), “Metrobus: Una Formula Ganadora”, November 2009
Darido, Georges B., “Regulation of Road-Based Public Transportation and Strategies for the Developing World”, Transportation Research Record, No. 1835, 2003
De Cea, Joaquin; Fernández, J. Enrique; and Malbran, R. Henry, “Demand responsive urban public transport system design: Methodology and application,” Transportation Research, Part A 42 (2008)
De Leon, Viviano, “Avanza la segunda línea del Metro SD”, Listin Diario, April 30, 2009, http://www.listin.com.do/app/article.aspx?id=99537
De Leon, Viviano, “Diandino niega Metro use energía del servicio dirigido a la población”, Listin Diario, June 5th, 2008, http://www.listin.com.do/app/article.aspx?id=57759
Dominican Today.com, “IDB donates US$1M to feed the Dominican capital’s Metro”, (adapted from Clave Digital), October 16, 2009, http://www.dominicantoday.com/dr/economy/2009/10/16/33567/IDB-donates-US1M-to-feed-the-Dominican-capitals-Metro
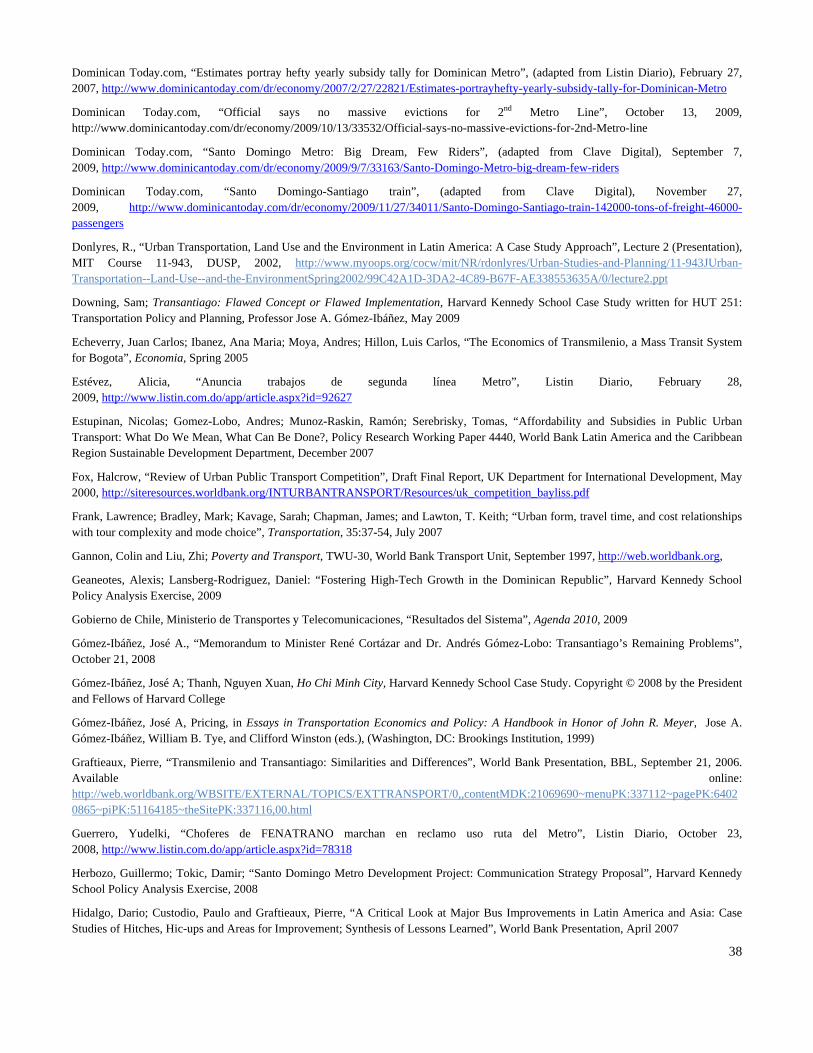
38
Dominican Today.com, “Estimates portray hefty yearly subsidy tally for Dominican Metro”, (adapted from Listin Diario), February 27, 2007, http://www.dominicantoday.com/dr/economy/2007/2/27/22821/Estimates-portrayhefty-yearly-subsidy-tally-for-Dominican-Metro
Dominican Today.com, “Official says no massive evictions for 2nd Metro Line”, October 13, 2009, http://www.dominicantoday.com/dr/economy/2009/10/13/33532/Official-says-no-massive-evictions-for-2nd-Metro-line
Dominican Today.com, “Santo Domingo Metro: Big Dream, Few Riders”, (adapted from Clave Digital), September 7, 2009, http://www.dominicantoday.com/dr/economy/2009/9/7/33163/Santo-Domingo-Metro-big-dream-few-riders
Dominican Today.com, “Santo Domingo-Santiago train”, (adapted from Clave Digital), November 27, 2009, http://www.dominicantoday.com/dr/economy/2009/11/27/34011/Santo-Domingo-Santiago-train-142000-tons-of-freight-46000-passengers
Donlyres, R., “Urban Transportation, Land Use and the Environment in Latin America: A Case Study Approach”, Lecture 2 (Presentation), MIT Course 11-943, DUSP, 2002, http://www.myoops.org/cocw/mit/NR/rdonlyres/Urban-Studies-and-Planning/11-943JUrban-Transportation--Land-Use--and-the-EnvironmentSpring2002/99C42A1D-3DA2-4C89-B67F-AE338553635A/0/lecture2.ppt
Downing, Sam; Transantiago: Flawed Concept or Flawed Implementation, Harvard Kennedy School Case Study written for HUT 251: Transportation Policy and Planning, Professor Jose A. Gómez-Ibáñez, May 2009
Echeverry, Juan Carlos; Ibanez, Ana Maria; Moya, Andres; Hillon, Luis Carlos, “The Economics of Transmilenio, a Mass Transit System for Bogota”, Economia, Spring 2005
Estévez, Alicia, “Anuncia trabajos de segunda línea Metro”, Listin Diario, February 28, 2009, http://www.listin.com.do/app/article.aspx?id=92627
Estupinan, Nicolas; Gomez-Lobo, Andres; Munoz-Raskin, Ramón; Serebrisky, Tomas, “Affordability and Subsidies in Public Urban Transport: What Do We Mean, What Can Be Done?, Policy Research Working Paper 4440, World Bank Latin America and the Caribbean Region Sustainable Development Department, December 2007
Fox, Halcrow, “Review of Urban Public Transport Competition”, Draft Final Report, UK Department for International Development, May 2000, http://siteresources.worldbank.org/INTURBANTRANSPORT/Resources/uk_competition_bayliss.pdf
Frank, Lawrence; Bradley, Mark; Kavage, Sarah; Chapman, James; and Lawton, T. Keith; “Urban form, travel time, and cost relationships with tour complexity and mode choice”, Transportation, 35:37-54, July 2007
Gannon, Colin and Liu, Zhi; Poverty and Transport, TWU-30, World Bank Transport Unit, September 1997, http://web.worldbank.org,
Geaneotes, Alexis; Lansberg-Rodriguez, Daniel: “Fostering High-Tech Growth in the Dominican Republic”, Harvard Kennedy School Policy Analysis Exercise, 2009
Gobierno de Chile, Ministerio de Transportes y Telecomunicaciones, “Resultados del Sistema”, Agenda 2010, 2009
Gómez-Ibáñez, José A., “Memorandum to Minister René Cortázar and Dr. Andrés Gómez-Lobo: Transantiago’s Remaining Problems”, October 21, 2008
Gómez-Ibáñez, José A; Thanh, Nguyen Xuan, Ho Chi Minh City, Harvard Kennedy School Case Study. Copyright © 2008 by the President and Fellows of Harvard College
Gómez-Ibáñez, José A, Pricing, in Essays in Transportation Economics and Policy: A Handbook in Honor of John R. Meyer, Jose A. Gómez-Ibáñez, William B. Tye, and Clifford Winston (eds.), (Washington, DC: Brookings Institution, 1999)
Graftieaux, Pierre, “Transmilenio and Transantiago: Similarities and Differences”, World Bank Presentation, BBL, September 21, 2006. Available online: http://web.worldbank.org/WBSITE/EXTERNAL/TOPICS/EXTTRANSPORT/0,,contentMDK:21069690~menuPK:337112~pagePK:64020865~piPK:51164185~theSitePK:337116,00.html
Guerrero, Yudelki, “Choferes de FENATRANO marchan en reclamo uso ruta del Metro”, Listin Diario, October 23, 2008, http://www.listin.com.do/app/article.aspx?id=78318
Herbozo, Guillermo; Tokic, Damir; “Santo Domingo Metro Development Project: Communication Strategy Proposal”, Harvard Kennedy School Policy Analysis Exercise, 2008
Hidalgo, Dario; Custodio, Paulo and Graftieaux, Pierre, “A Critical Look at Major Bus Improvements in Latin America and Asia: Case Studies of Hitches, Hic-ups and Areas for Improvement; Synthesis of Lessons Learned”, World Bank Presentation, April 2007
39
Hidalgo, Dario, “Open Assessment of Transantiago: Implementation Completion Report (IRC), Santiago Urban Transport Programmatic Development Policy Loan,” The World Bank, May 2008
Hidalgo, Dario, “Citywide Transit Integration in a Large City: The Interligado System of Sao Paulo, Brazil”, Transportation Research Record, No. 2114, EMBARQ – World Resources Institute Center for Sustainable Transport, Washington, D.C.; 2009
Hook, Walter, “Institutional and Regulatory Options for Bus Rapid Transit in Developing Countries: Lessons from International Experience”, Transportation Research Record, No. 1939, Transportation Research Board, Washington, D.C.; 2005
Hook, Walter, “Urban Transportation and the Millennium Development Goals”, Global Urban Development Magazine, Volume 2, Issue 1, March 2006, http://www.globalurban.org/GUDMag06Vol2Iss1/hook.htm
Infrasite.net, “IDB grant to PPP metro line in Sao Paulo Brazil”, May 5th, 2008, http://www.infrasite.net/news/news_article.php?ID_nieuwsberichten=9797&language=en
Inter-American Development Bank (IDB) / Banco Interamericano de Desarrollo (BID), “Apoyo al Sistema Integrado de Rutas Alimentadoras del Metro de Santo Domingo: Plan de Operaciones”, DR-T1065, September 2009
International Forum for Rural Transport and Development (IFRTD), The Role of Transport in the Millennium Development Goals, 2009, http://www.ifrtd.org/new/issues/mdgs.php
Juma, Calestous, and Lee Yee-Cheong, Lead authors. 2005. Innovation: Applying knowledge in development. London ; Sterling, Va.: Earthscan.
Kain, John F. and Liu, Zhi, “Efficiency and Locational Consequences of Government Transport Policies and Spending in Chile,” in Glaeser, Edward L. and Meyer, John R. eds., Chile: Political Economy of Urban Development, Cambridge, MA: John F. Kennedy School of Government and Harvard UP, 2002
Kain, John F., The Urban Transportation Problem: A Reexamination and Update, in Essays in Transportation Economics and Policy: A Handbook in Honor of John R. Meyer, Jose A. Gómez-Ibáñez, William B. Tye, and Clifford Winston (eds.), (Washington, DC: Brookings Institution, 1999)
Kronberger, Benedikt, “Metrobus – A Bus Rapid Transit System for Mexico City”, Harvard Kennedy School Case Study written for HUT 251: Transportation Policy and Planning, Professor Jose A. Gómez-Ibáñez, April 2007
Lacey, Marc, “A Subway: Just What’s Needed. Or Is It?”, The New York Times, September 3, 2007. http://www.nytimes.com/2007/09/03/world/americas/03domingo.html
Lee, John; and Hine, John L.; “Preparing a National Transport Strategy: Suggestions for Government Agencies in Developing Countries”, World Bank Transport Paper (TP-19), World Bank Group, Washington, D.C.; April 2008
Liriano, Jonathan, “Se averia patina con un vagon del Metro”, Listin Diario, December 28, 2008, http://www.listin.com.do/app/article.aspx?id=85919
Liu, Rongfang; Pendyala, Ram M.; Polzin, Steven; “Assessment of Intermodal Transfer Penalties Using Stated Preference Data”, Transportation Research Record, Issue 1607, Paper No. 971380, 1997
Lowry, Michael B.; “Online public deliberation for a regional transportation improvement decision”, Transportation, Springer Science+Business Media, LLC. 2009
McDonnell, Simon; Ferreira, Susana; and Convery, Frank; “Using Bus Rapid Transit to Mitigate Emissions of CO2 from Transport”, Transport Reviews, Vol. 28, No. 6, November 2008
Medrano, Nestor, “Leonel inaugura una escuela vial”, Listin Diario, June 7, 2009, http://www.listin.com.do/app/article.aspx?id=103842
Mendez, Riamny, “El Metro Encaresce Las Casas en Villa Mella”, Clave Digital, July 23, 2009, www.clavedigital.com
Meyer, John and Straszhiem, Mahlon; “Transport Demands: The Basic Framework”, pp. 99-109 in Techniques of Transportation Planning, Vol. 1, 1971 (Brookings)
Mohring, Herbert, Congestion, in Essays in Transportation Economics and Policy: A Handbook in Honor of John R. Meyer, Jose A. Gómez-Ibáñez, William B. Tye, and Clifford Winston (eds.), (Washington, DC: Brookings Institution, 1999)
Mojica, Carlos H., Transmilenio: The Battle over Avenida Septima, Harvard Kennedy School Case Study. Copyright © 2009 by the President and Fellows of Harvard College
40
Morandé, Felipe and Doña, Juan Esteban, “Transantiago: El remedio que esta mantando al paciente”, Trabajos de Investigacion en Politicas Publicas, Departamento de Economia, Universidad de Chile, No. 5, August 2007
Oficina para el Reordenamiento del Transporte (OPRET), Metro de Santo Domingo, (presentation), 2004
Oficina para el Reordenamiento del Transporte (OPRET), Estudio Ambiental Etapas 1A y 1B Metro de Santo Domingo, (presentation), 2006
Oficina para el Reordenamiento del Transporte (OPRET), Autoridad Unica de Transporte: Una necesidad en la gestión del transporte publico, (Buenos Aires ALAMYS presentation), 2006
Oficina para el Reordenamiento del Transporte (OPRET), Memoria y Cuenta de Primer Ano de Funcionamiento: Ano 2005-2006, 2007
Oficina Nacional de Estadistica (ONE), Republica Dominicana, (http://www.one.gov.do)
Oficina Metropolitana de Servicios de Autobuses (OMSA), Estadisticas, http://www.omsa.gob.do/Estad%C3%ADsticas/tabid/65/Default.aspx, 2009
Oficina Tecnica de Transporte Terrestre (OTTT), Historia/Quienes Somos, http://ottt.gob.do
O’Regan, Katherine and Quigley, John M., Accessibility and Economic Opportunity, in Essays in Transportation Economics and Policy: A Handbook in Honor of John R. Meyer, Jose A. Gómez-Ibáñez, William B. Tye, and Clifford Winston (eds.), (Washington, DC: Brookings Institution, 1999)
Ortega Tous, Julio, “El hito del Metro”, Listin Diario, December 29, 2008, http://www.listin.com.do/app/article.aspx?id=86029
Parry, Ian; Small, Kenneth, “Should Urban Transit Subsidies be Reduced?”, American Economic Review, 99(3), June 2009
Passengerfocus, National Passenger Survey, Autumn 2008, http://www.passengerfocus.org.uk/
Peguero, Adriana, “Choferes daran transporte gratis para atraer a los pasajeros”, Listin Diario, February 6, 2009, http://www.listin.com.do/app/article.aspx?id=90190
Peguero, Adriana, “Choferes sacan por la fuerza a los pasajeros de vehículos en servicio”, Listin Diario, December 10, 2008, http://www.listin.com.do/app/article.aspx?id=84051
Peguero, Adriana, “El Metro de Santo Domingo completa 16 de los 19 trenes que darán servicio”, Listin Diario, December 30, 2008, http://www.listin.com.do/app/article.aspx?id=86161
Peguero, Adriana, “Opret anuncia que operaciones comerciales del Metro iniciaran el próximo viernes”, Listin Diario, http://www.listin.com.do/app/article.aspx?id=88746, January 23, 2009
Peguero, Adriana, “Presidente Fernández abrirá hoy el Metro de Santo Domingo”, Listin Diario, http://www.listin.com.do/app/article.aspx?id=89329, January 29, 2009
RailwayTechnology.com, Santo Domingo Metro, http://www.railway-technology.com/projects/santodomingo/, 2009
Rivera, Carlos. Transantiago: Humillacion y Negocio (Santiago, Chile: Editorial Ayun, 2008)
Severino, Jairon, “El Sistema Masivo de Transporte Debio Operar con una Planta Propia”, Listin Diario, April 3, 2008, http://www.listin.com.do/app/article.aspx?id=57378
Small, Kenneth A, Project Evaluation, in Essays in Transportation Economics and Policy: A Handbook in Honor of John R. Meyer, Jose A. Gómez-Ibáñez, William B. Tye, and Clifford Winston (eds.), (Washington, DC: Brookings Institution, 1999)
Small, Kenneth A. and Winston, Clifford, The Demand for Transportation: Models and Applications, in Essays in Transportation Economics and Policy: A Handbook in Honor of John R. Meyer, Jose A. Gómez-Ibáñez, William B. Tye, and Clifford Winston (eds.), (Washington, DC: Brookings Institution, 1999)
Timilsina, Govinda; and Shrestha, Ashish; “The Growth of Transport Sector CO2 Emissions and Underlying Factors in Latin America and the Caribbean”, Policy Research Working Paper 4734, World Bank Development Research Group, September 2008
Transportation Research Board (TRB), “Metropolitan Travel Forecasting: Current Practice and Future Direction”, Special Report 288, Washington, D.C., 2007
United Kingdom Department for Transport (UKDfT), “Older People: Their transport needs and requirements – Summary Report”, 2009, http://www.dft.gov.uk/pgr/inclusion/older/olderpeopletheirtransportnee3261?page=1
41
United Kingdom Department for Transport (UKDfT), “Public Transport Needs of Minority, Ethnic and Faith Communities Guidance Pack”, 2009, http://www.dft.gov.uk/pgr/inclusion/mef/publictransportneedsofminori3259?page=1
United Kingdom Department for Transport (UKDfT), “Women and Public Transport: The Checklist”, 2009, http://www.dft.gov.uk/pgr/inclusion/women/womenandpublictransportthech3267?page=1
United Nations Centre for Regional Development (UNCRD), Environmentally Sustainable Transport and MDG Linkages, 2004, www.uncrd.or.jp/env/est/docs/EST_and_MDG_Linkages.pdf
United Nations Commission on Sustainable Development (UNCSD), 2009, http://www.un.org/esa/dsd/csd
United Nations Division for Sustainable Development (UNDSD), Agenda 21, Chapter 7: Promoting Sustainable Human Settlement Development, Chapter 9: Protection of the Atmosphere, June 1992, http://www.un.org/esa/sustdev/documents/agenda21
United Nations Department of Economic and Social Development (UNDESA) and United Nations Environment Programme (UNEP), Proposed Input to CSD on a 10-Year Framework of Programmes on Sustainable Consumption and Production, Second Public Draft, April 30, 2009 (prepared by the Marrakech Process Secretariat), http://www.unep.fr/scp/marrakechUTH
United Nations Economic and Social Council (UNESCO), “Energy and Transport”, Report of the Secretary General, Commission on Sustainable Development acting as the preparatory committee for the World Summit on Sustainable Development, organizational session, May 2001
United States Department of Transportation (USDOT), “Applicability of Bogota’s Transmilenio BRT System to the United States”, May 2006
United States Library of Congress, “The First Colony”, http://countrystudies.us/dominican-republic/3.htm, 2009
World Bank, Cities on the Move: A World Bank Urban Transport Strategy Review, (Washington, DC: World Bank, 2002)
World Bank, Project Appraisal Document…to the Republic of Colombia for the Integrated Mass Transit Systems Project (Transmilenio), Latin America and Caribbean Regional Office, May 14, 2004
World Bank, Notes on the Economic Evaluation of Transport Projects: Distribution of Benefits and Impacts on Poor People, Transport Note No. TRN-26, January 2005, World Bank, Washington, D.C.
World Bank, Notes on the Economic Evaluation of Transport Projects: Projects With a Very Long Life, Transport Note No. TRN-18, January 2005, World Bank, Washington, D.C.
Yáñez, Maria Francisca; Mansilla, Patricio and de Dios Ortuzar, Juan, “The Santiago Panel: measuring the effects of implementing Transantiago”, Transportation, DOI 10.1007, 2009
Zhang, Ming, “Bus Versus Rail: Meta-Analysis of Cost Characteristics, Carrying Capacities, and Land Use Impacts”, Transportation Research Record No. 2110, Transportation Research Board, Washington, D.C., 2009
INTERVIEWS
Carrasco, Ing. Ramón Leonel, Sub-Director, Officina Para el Reordeniamiento del Transporte (OPRET), July 16th and 17th, 2009, January 12th and 14th, 2010.
Corto Real, Jesus, Member of Committee Gastor and resident of La Zurca, July 2009
De León, Osiris, Geologist, Coordinator of the Comision de Ciencias Naturales y Medio Ambiente at the Academia de Ciencias de la R.D., and outspoken critic of the Metro, June 20th, 2009 and January 19th, 2010
Dias, Viola, President of Committe Gastor - neighborhood association in La Zurca (population relocated because of Metro construction), Metro employee, July 2009
Ditrén, Ignacio, Director General, Oficina Metropolitana de Servicios de Autobuses (OMSA), July 21st, 2009
Fernández, Leonel, President, Dominican Republic (1996-2000, 2004-2008, 2008-present), met on several occasions in July 2009.
Gagain, John, Executive Director, Comisión Presidencial sobre los Objetivos del Milenio y Desarrollo Sostenible (COPDES), Dominican Republic, (conversations over the course of Summer 2009 and January 2010)
Gil, Arqto. Vencian A. Ben, Director/Professor, Escuela de Arquitectura, Universidad Iberoamericana (UNIBE) and Director of CODIA from 1991-1992, interviewed in July 2009.
42
Gómez-Ibáñez, José A., Derek C. Bok Professor of Urban Planning and Public Policy, Harvard University Graduate School of Design, Harvard Kennedy School; Research Advisor: September 2009 – March 2010
Guzman Then, Abel and Liriano, Jonathan, journalists at Listin Diario, July 7, 2009 and January 13th, 2010
Kete, Nancy and Lobo Adriana, CTS Mexico and EMBARQ, Metrobus presentation at the Harvard Kennedy School, 11/10/2009
Linares, Alfredo Pulinario, President of MOCHOTRAN (transport federation in Santo Domingo) and Member of a special transportation advisory group to President Fernández, January 20th, 2010
Perez Polanco, Ing. F. Milciades, Presidente Consejo Directivo, Fondo para el Desarrollo del Transporte Terrestre (FONDET) and transportation engineer working with BID, January 14th, 2010
Pritchett, Lant, current Professor of the Practice of International Development, Harvard Kennedy School of Government, Lead Socio-Economist in the Social Development group of the South Asia region of the World Bank, Delhi, 2004-2007, (interviewed in October 2009)
Rodriguez, Arqto. Rafael R, Sub-Director, Oficina Para el Reordeniamiento del Transporte (OPRET), Professor of Architecture, UNIBE. July 17th, 2009 and January 18th, 2010.
Sánchez, Ing. Euclides, Senator from La Vega Province and President of the Congressional Public Works Commission (PLD Party), July 2009
Senderowitsch, Roby, World Bank Sub-Regional Manager, Dominican Republic, (met on two occasions, July 2009)
Voukas, Yorgos K., Gerente de Sistemas Integrales de Transporte, CTS Mexico/EMBARQ, (phone interview) November 25th, 2009