El Camino College Compton Center 2015-2016 Annual Fact Book · The El Camino College-Compton Center...
41
Institutional Research & Planning
Transcript of El Camino College Compton Center 2015-2016 Annual Fact Book · The El Camino College-Compton Center...

El Camino College Compton Center 2015-2016 Annual
Fact Book
Institutional Research & Planning

El Camino College Compton Center 1 Annual Fact Book 2016
Introduction ......................................................................................................................................................... 2
Student and Enrollment Trends ........................................................................................................................... 3
Special Programs ................................................................................................................................................ 13
Financial Aid ....................................................................................................................................................... 19
Success and Retention ....................................................................................................................................... 21
Student Outcomes ............................................................................................................................................. 27
District Employees ............................................................................................................................................. 33
Table of Contents

El Camino College Compton Center 2 Annual Fact Book 2016
The El Camino College-Compton Center Annual Factbook is a reference source containing trend data about students, student outcomes, and instructional programs and services. The data in the factbook provides background information to facilitate policy analysis and decision making. It should be a useful tool in college and departmental planning, grant preparation, and in the accreditation process. It is our hope that the information provided is used to objectively evaluate programs and practices as well as visualize the trends that affect El Camino College’s current and future operations. The Annual Factbook presents tables and graphs that contain enrollment trends for the last 5 academic years. Pie charts represent enrollment for the most recent academic year. Information has been disaggregated by age, gender and ethnicity where appropriate. Data Sources
Demographic and enrollment data on ECC students was provided by the Chancellor’s Office. Some of the data in the Special Programs section was extracted from the college’s student database. In addition, data from the National Student Clearinghouse was used to provide transfer destination information. The National Student Clearinghouse is a national, non-profit organization that offers access to enrollment and degree records. Please send any comments or feedback to Institutional Research & Planning.
Introduction
El Camino College Compton Center Annual Fact Book 2016
Student and Enrollment Trends
3

El Camino College Compton Center Annual Fact Book 2016
19 or less 20-24 25-34 35-44 45-54 55+ African-American 575 1,062 989 447 286 161 Asian 106 293 192 65 25 11 Latino 1,879 2,709 1,437 316 96 24 White 94 184 145 35 17 12 Other 68 155 146 37 17 19 Total 2,722 4,403 2,909 900 441 227
Enrollment – Age by Ethnicity
Other Includes: American Indian or Alaskan Native, Pacific Islander, Two or More Races, and Unknown
19 or less 20-24 25-34 35-44 45-54 55+African-American 21% 24% 34% 50% 65% 71%Asian 4% 7% 7% 7% 6% 5%Latino 69% 62% 49% 35% 22% 11%White 3% 4% 5% 4% 4% 5%Other 2% 4% 5% 4% 4% 8%
0%
10%
20%
30%
40%
50%
60%
70%
80%
90%
100%2015-2016
4

El Camino College Compton Center Annual Fact Book 2016
2011-12 2012-13 2013-14 2014-15 2015-16 19 or less 3,118 3,283 2,601 2,564 2,722
20-24 5,649 5,307 4,989 4,748 4,403
25-34 3,517 3,214 3,075 2,991 2,909
35-44 1,338 1,165 1,053 1,011 900
45-54 731 706 681 574 441
55+ 250 265 256 273 227
Total 14,603 13,940 12,655 12,161 11,602
Enrollment by Age
0
1,000
2,000
3,000
4,000
5,000
6,000
19 or less 20 - 24 25 - 34 35 - 44 45 - 54 55+
2011-2012
2012-2013
2013-2014
2014-2015
2015-201619 or less
23%
20 - 24 38%
25-34 25%
35 - 44 8%
45 - 54 4%
55+ 2%
2015-2016
5

El Camino College Compton Center Annual Fact Book 2016
*Unknowns included in Total
Fall 2011 Fall 2012 Fall 2013 Fall 2014 Fall 2015 Daytime 5,088 4,773 5,134 5,135 5,004
Evening 1,771 1,642 1,642 1,595 1,389
Irregular 425 581 401 400 394
Total* 7,912 7,531 7,756 7,701 7,428
Irregular meeting times including distance education
Enrollment by Day and Evening
0
1,000
2,000
3,000
4,000
5,000
6,000
Daytime Evening Irregular
Fall 2011
Fall 2012
Fall 2013
Fall 2014
Fall 2015
Daytime74%
Evening 20%
Irregular 6%
Fall 2015
6

El Camino College Compton Center Annual Fact Book 2016
2011-12 2012-13 2013-14 2014-15 2015-16 African-American 5,865 5,218 4,596 4,080 3,520
Amer. Ind. or Alask. Native 34 27 25 23 17
Asian 1,086 1,082 843 730 692
Latino 6,007 6,226 6,076 6,367 6,461
Pacific Islander 153 118 97 88 76
Two or more races 422 434 398 359 349
Unknown or Decline 284 166 88 59 45
White 752 669 532 455 442
Total 14,603 13,940 12,655 12,161 11,602
Enrollment by Ethnicity
Other Includes: Amer. Ind. or Alask. Native, Pacific Islander, Two+ Races, and Unknown
0
1,000
2,000
3,000
4,000
5,000
6,000
7,000
African-American Asian Latino White Other
2011-2012
2012-2013
2013-2014
2014-2015
2015-2016
African-American
30%
Amer. Ind. or Alask. Native
<1%Asian
6%Latino56%
Pacific Islander
1%Two+ Races
3%
Unknown <1%
White4%
2015-2016
7

El Camino College Compton Center Annual Fact Book 2016
2011-12 2012-13 2013-14 2014-15 2015-16
Carson Senior High* 166 168 105 71 69
Centennial High 110 117 122 155 136
Compton Senior High 299 295 285 297 249
Dominguez High 299 287 327 320 303
Jordan Senior High* 196 189 170 187 186
King/Drew Medical Magnet 116 129 132 118 76
Locke (Alain Leroy) Senior High 57 50 29 20 21
Lynwood High 171 146 141 164 182
Paramount High 113 129 141 154 160
Other Non-District Feeders 2,423 2,430 1,851 1,787 1,662
Enrollment by Feeder High School
*High schools outside Compton Community College District boundaries
8

El Camino College Compton Center Annual Fact Book 2016
2011-12 2012-13 2013-14 2014-15 2015-16 Female 9,180 8,764 8,016 7,663 7,247
Male 5,422 5,176 4,639 4,496 4,355
Unknown 1 0 0 0 0
Total 14,603 13,940 12,655 12,159 11,602
Enrollment by Gender
0
1,000
2,000
3,000
4,000
5,000
6,000
7,000
8,000
9,000
10,000
Female Male
2011-2012
2012-2013
2013-2014
2014-2015
2015-2016
Female62%
Male38%
2015-2016
9

El Camino College Compton Center Annual Fact Book 2016
19 or less 20-24 25-34 35-44 45-54 55+
Female 54% 61% 68% 71% 72% 62%
Male 46% 39% 32% 29% 28% 38%
Enrollment – Gender by Age
1,479
2,695
1,973
642
317
141
1,243
1,708
936
258
124
86
3000 2500 2000 1500 1000 500 0 500 1000 1500 2000 2500 3000
19 or less
20-24
25-34
35-44
45-54
55+
2015-2016
Female Male
10

El Camino College Compton Center Annual Fact Book 2016
African-American Asian Latino White Other
Female 67% 57% 61% 61% 67%
Male 33% 43% 39% 39% 33%
Enrollment – Gender by Ethnicity
328
268
3,909
396
2,346
160
174
2,551
296
1,174
4000 3500 3000 2500 2000 1500 1000 500 0 500 1000 1500 2000 2500 3000 3500 4000
Other
White
Latino
Asian
African-American
2015-2016
Female Male
11

El Camino College Compton Center Annual Fact Book 2016
2011-12 2012-13 2013-14 2014-15 2015-16
In District 5,372 4,889 4,745 4,929 4,868
Out of District (within 7.5 miles radius) 5,175 4,932 4,545 4,295 4,117
Out of District (beyond 7.5 miles radius) 4,056 4,119 3,365 2,937 2,617
Total 14,603 13,940 12,655 12,161 11,602
Enrollment
The Compton Community College District encompasses the cities of: Compton, Lynwood, and Paramount.
Enrollment by Residency
In District42%
Out of District (within
7.5 miles radius)
35%
Out of District (beyond 7.5 miles radius)
23%
2015-2016
0
1,000
2,000
3,000
4,000
5,000
6,000
In District Out of District (within 7.5miles radius)
Out of District (beyond 7.5miles radius)
2011-2012 2012-2013 2013-2014 2014-2015 2015-2016
12
El Camino College Compton Center Annual Fact Book 2016
Special Programs
13

El Camino College Compton Center Annual Fact Book 2016
2011-12 2012-13 2013-14 2014-15 2015-16 Self-Initiated Program participant (SIP) 320 271 204 193 173
County Referral Program Participant (CRP) 331 250 251 229 221
Total 651 521 455 422 394
CalWORKs
0
50
100
150
200
250
300
350
Self-Initiated Program participant (SIP) County Referral Program Participant (CRP)
2011-12 2012-13 2013-14 2014-15 2015-16
Self-Initiated Program
Participant 44%
County Referral Program
Participant 56%
2015-2016
14

El Camino College Compton Center Annual Fact Book 2016
2011-12 2012-13 2013-14 2014-15 2015-16
Acquired Brain Injury 16 20 18 10 9
Develop. Delay. Learner 35 28 28 25 19
Hearing Impaired 8 7 8 9 9
Learning Disabled 23 21 32 27 22
Mobility Impaired 68 62 54 46 58
Other Disability 127 170 164 167 197
Psychological Disability 97 106 83 88 103
Speech/Lang. Impaired 0 1 1 1 1
Visually Impaired 7 8 7 4 6
Total 381 423 395 377 424
Acquired Brain Injury
2%
Develop. Delayed Learner
4%
Hearing Impaired
2%
Learning Disabled
5%
Mobility Impaired
14%
Other Disability47%
Psych. Disability
24%
Speech/Lang. Impaired
<1%
Visually Impaired
1%
2015-2016
Disabled Student Programs & Services
15

El Camino College Compton Center Annual Fact Book 2016
2011-12 2012-13 2013-14 2014-15 2015-16
EOPS and CARE participant 199 239 181 172 172
EOPS participant 855 788 834 768 926
Total 1,054 1,027 1,015 940 1,098
Extended Opportunity Programs & Services
EOPS and CARE
participant 16%
EOPS participant
84%
2015-2016
0
100
200
300
400
500
600
700
800
900
1,000
EOPS and CARE participant EOPS participant
2011-12 2012-13 2013-14 2014-15 2015-16
16

El Camino College Compton Center Annual Fact Book 2016
2011-12 2012-13 2013-14 2014-15 2015-16
Baseball 37 39 50 46 45
Basketball 36 38 32 27 32
Cross Country 27 0 10 27 15
Football 67 67 71 67 60
Soccer 24 26 36 31 34
Track & Field 36 28 19 23 16
Total 227 198 218 221 202
Student Athletes - Males
Baseball22%
Basketball16%
Cross Country7%Football
30%
Soccer17%
Track & Field8%
2015-2016
17

El Camino College Compton Center Annual Fact Book 2016
2011-12 2012-13 2013-14 2014-15 2015-16
Badminton 5 7 7 9 10
Basketball 15 22 25 14 15
Cross Country 19 0 13 27 15
Soccer 20 20 22 23 24
Softball 17 22 22 25 14
Track & Field 14 9 12 15 16
Total 90 80 101 113 94
Student Athletes - Females
Badminton11%
Basketball16%
Cross Country16%
Soccer25%
Softball15%
Track & Field17%
2015-2016
18

El Camino College Compton Center Annual Fact Book 2016
Financial Aid
19

El Camino College Compton Center Annual Fact Book 2016
Number of Students Awarded
2011-12 2012-13 2013-14 2014-15 2015-16 BOGFW 6,005 5,822 5,344 5,305 5,508 Grant 2,800 2,255 2,835 3,088 2,944 Loan 158 105 0 0 0 Scholarship 17 28 26 46 70 Work Study 1 0 44 62 49 Total 6,086 5,887 5,428 5,396 5,708
Financial Aid by Award Type
Students may receive more than one award
BOGFW Grant Loan Scholarship Work Study Total2011-12 41.1% 19.2% 1.1% 0.1% 0.0% 41.7%2012-13 41.8% 16.2% 0.8% 0.2% 0.0% 42.2%2013-14 42.2% 22.4% 0.0% 0.2% 0.3% 42.9%2014-15 43.6% 25.4% 0.0% 0.4% 0.5% 44.4%2015-16 47.5% 25.4% 0.0% 0.6% 0.4% 49.2%
0%
10%
20%
30%
40%
50%
60%
Percent of Enrollment Receiving Financial Aid
20

El Camino College Compton Center Annual Fact Book 2016
Success and Retention
21
El Camino College Compton Center Annual Fact Book 2016
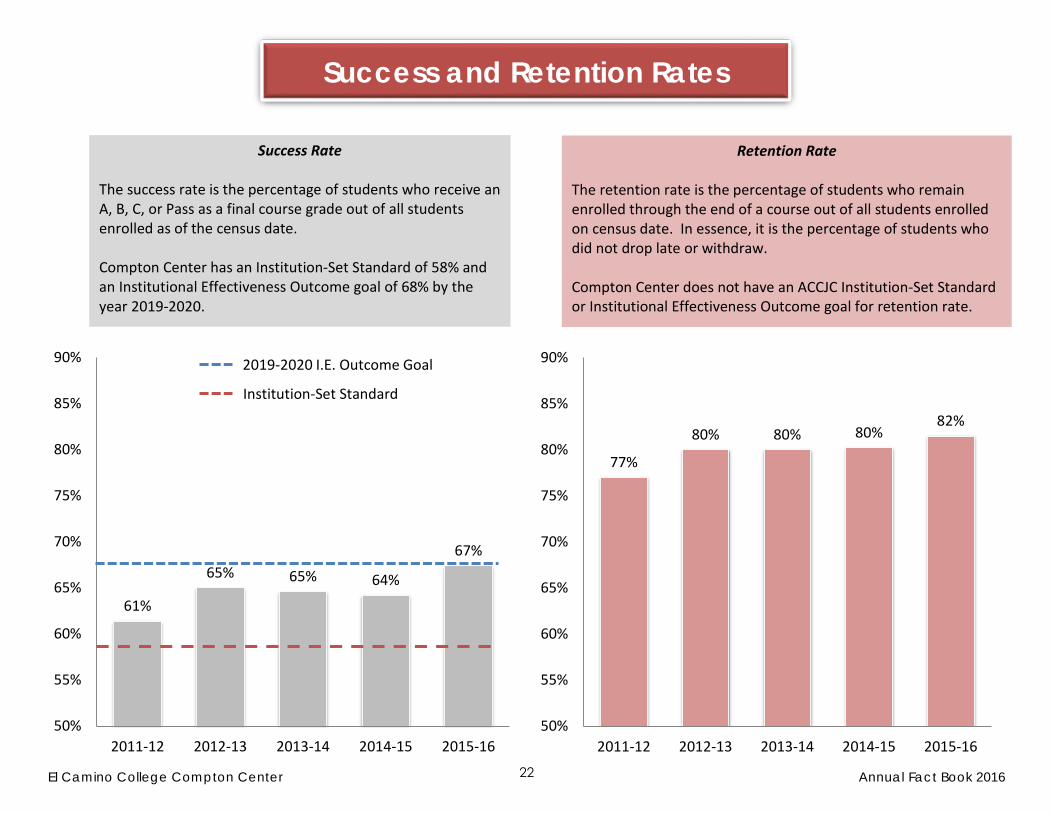
Success Rate The success rate is the percentage of students who receive an A, B, C, or Pass as a final course grade out of all students enrolled as of the census date. Compton Center has an Institution-Set Standard of 58% and an Institutional Effectiveness Outcome goal of 68% by the year 2019-2020.
Success and Retention Rates
61%
65% 65% 64%
67%
50%
55%
60%
65%
70%
75%
80%
85%
90%
2011-12 2012-13 2013-14 2014-15 2015-16
2019-2020 I.E. Outcome Goal
Institution-Set Standard
Retention Rate The retention rate is the percentage of students who remain enrolled through the end of a course out of all students enrolled on census date. In essence, it is the percentage of students who did not drop late or withdraw. Compton Center does not have an ACCJC Institution-Set Standard or Institutional Effectiveness Outcome goal for retention rate.
77%
80% 80% 80%82%
50%
55%
60%
65%
70%
75%
80%
85%
90%
2011-12 2012-13 2013-14 2014-15 2015-16
22

El Camino College Compton Center Annual Fact Book 2016
2011-12 2012-13 2013-14 2014-15 2015-16
19 or less 64% 82% 66% 83% 67% 84% 65% 83% 68% 84%
20 - 24 59% 75% 63% 79% 63% 79% 63% 79% 67% 81%
25 - 34 61% 75% 65% 78% 65% 79% 65% 80% 69% 81%
35 - 44 62% 75% 67% 80% 66% 79% 65% 79% 69% 81%
45 - 54 65% 78% 66% 79% 62% 78% 66% 81% 66% 78%
55+ 68% 79% 72% 81% 70% 80% 70% 81% 61% 76%
Total 61% 77% 65% 80% 65% 80% 64% 80% 68% 82%
Success Rate The success rate is the percentage of students who receive an A, B, C, P, or Pass as a final course grade out of all students enrolled as of the census date.
Retention Rate The retention rate is the percentage of students who remain enrolled through the end of a course out of all students enrolled on census date. In essence, it is the percentage of students who did not drop late or withdraw.
Success and Retention Rates by Age
40%
50%
60%
70%
80%
90%
19 or less 20 - 24 25 - 34 35 - 44 45 - 54 55+ Total
2015-2016
Success Retention
23

El Camino College Compton Center Annual Fact Book 2016
50%
55%
60%
65%
70%
75%
80%
85%
90%
Basic Skills Credit/DegreeApplicable
Transfer Career andTechnical
Education (CTE)
2015-2016Success Retention
2011-12 2012-13 2013-14 2014-15 2015-16
Basic Skills 51% 72% 53% 74% 56% 76% 56% 77% 56% 76%
Credit/Degree Applicable 57% 77% 56% 77% 55% 75% 57% 77% 58% 78%
Transfer 63% 78% 68% 81% 68% 82% 67% 81% 70% 83%
Career Technical Education (CTE) 64% 78% 68% 82% 70% 84% 68% 84% 73% 85%
Overall Success/Retention 61% 77% 65% 80% 65% 80% 64% 80% 67% 82%
Success Rate The success rate is the percentage of students who receive an A, B, C, P, or Pass as a final course grade out of all students enrolled as of the census date.
Retention Rate The retention rate is the percentage of students who remain enrolled through the end of a course out of all students enrolled on census date. In essence, it is the percentage of students who did not drop late or withdraw.
Success and Retention Rates by Course Type
24
El Camino College Compton Center Annual Fact Book 2016
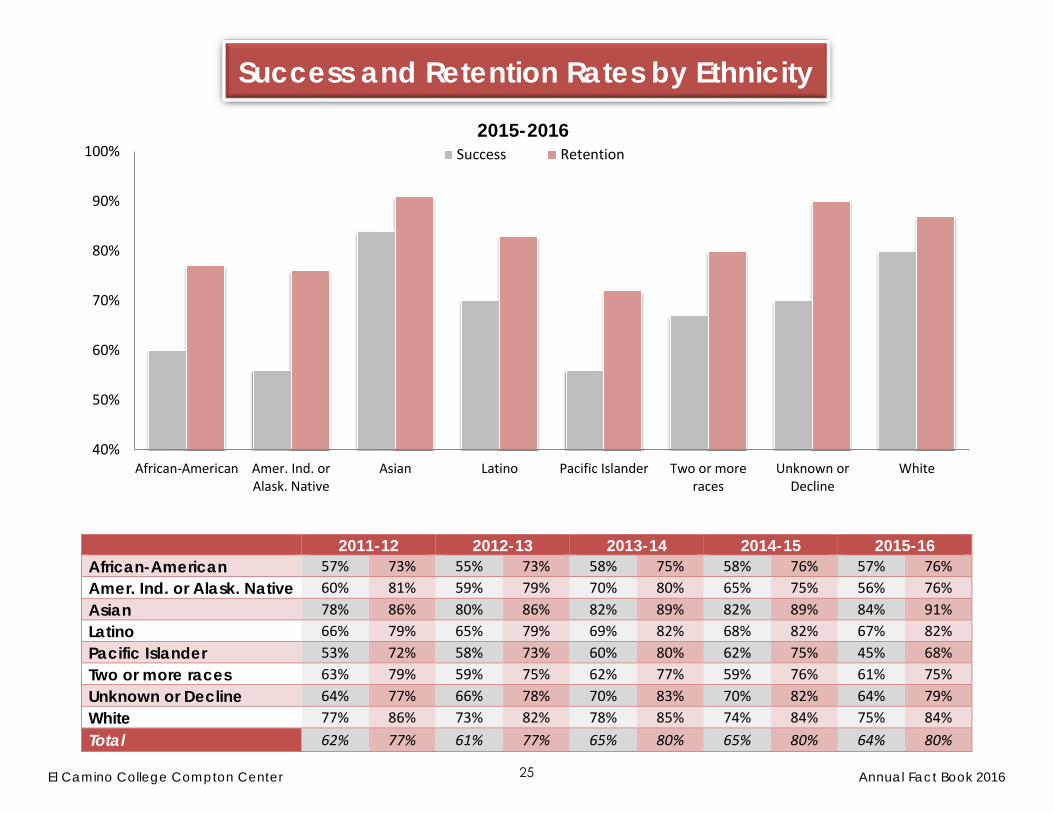
2011-12 2012-13 2013-14 2014-15 2015-16 African-American 57% 73% 55% 73% 58% 75% 58% 76% 57% 76% Amer. Ind. or Alask. Native 60% 81% 59% 79% 70% 80% 65% 75% 56% 76% Asian 78% 86% 80% 86% 82% 89% 82% 89% 84% 91% Latino 66% 79% 65% 79% 69% 82% 68% 82% 67% 82% Pacific Islander 53% 72% 58% 73% 60% 80% 62% 75% 45% 68% Two or more races 63% 79% 59% 75% 62% 77% 59% 76% 61% 75% Unknown or Decline 64% 77% 66% 78% 70% 83% 70% 82% 64% 79% White 77% 86% 73% 82% 78% 85% 74% 84% 75% 84% Total 62% 77% 61% 77% 65% 80% 65% 80% 64% 80%
Success and Retention Rates by Ethnicity
40%
50%
60%
70%
80%
90%
100%
African-American Amer. Ind. orAlask. Native
Asian Latino Pacific Islander Two or moreraces
Unknown orDecline
White
2015-2016Success Retention
25

El Camino College Compton Center Annual Fact Book 2016
2011-12 2012-13 2013-14 2014-15 2015-16
Female 61% 76% 65% 80% 64% 80% 64% 80% 67% 81%
Male 61% 78% 65% 80% 65% 80% 64% 80% 67% 82%
Total 61% 77% 65% 80% 65% 80% 64% 80% 68% 82%
Success Rate The success rate is the percentage of students who receive an A, B, C, P, or Pass as a final course grade out of all students enrolled as of the census date.
Retention Rate The retention rate is the percentage of students who remain enrolled through the end of a course out of all students enrolled on census date. In essence, it is the percentage of students who did not drop late or withdraw.
Success and Retention Rates by Gender
40%
50%
60%
70%
80%
90%
100%
Female Male
2015-2016
Success Retention
26

El Camino College Compton Center Annual Fact Book 2016
Student Outcomes
27

El Camino College Compton Center Annual Fact Book 2016
1st Semester 2nd Semester 3rd Semester 4th SemesterFall 2011 100% 53% 33% 25%Fall 2012 100% 51% 35% 25%Fall 2013 100% 54% 38% 30%Fall 2014 100% 56% 38% 31%Fall 2015 100% 57% 39%
0%
10%
20%
30%
40%
50%
60%
70%
80%
90%
100%
Student Persistence Over Four SemestersFall 2011 to Fall 2015
Persistence
28
El Camino College Compton Center Annual Fact Book 2016
Persistence
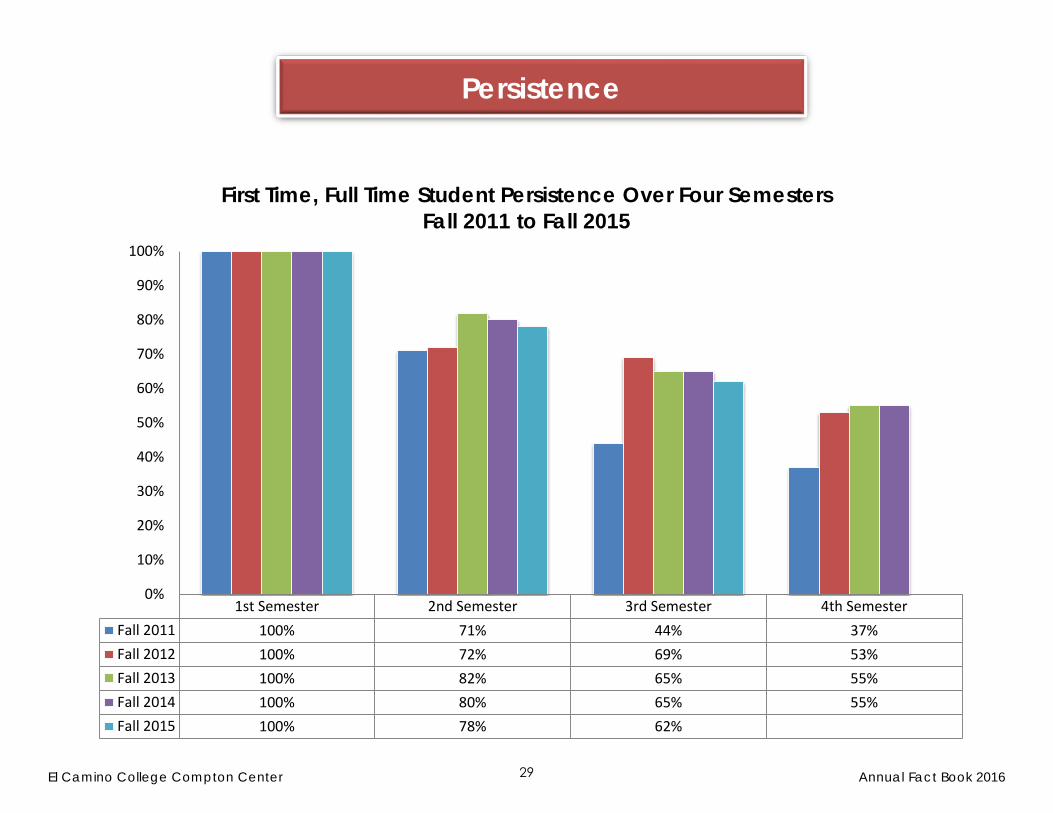
1st Semester 2nd Semester 3rd Semester 4th SemesterFall 2011 100% 71% 44% 37%Fall 2012 100% 72% 69% 53%Fall 2013 100% 82% 65% 55%Fall 2014 100% 80% 65% 55%Fall 2015 100% 78% 62%
0%
10%
20%
30%
40%
50%
60%
70%
80%
90%
100%
First Time, Full Time Student Persistence Over Four SemestersFall 2011 to Fall 2015
Persistence
29

El Camino College Compton Center Annual Fact Book 2016
2011-12 2012-13 2013-14 2014-15 2015-16 Associate of Arts 159 194 201 230 259
Associate of Science 69 88 60 86 127
Certificates 104 98 98 104 179
Total Degrees 332 380 359 420 565
Degree and Certificates
0
50
100
150
200
250
300
Associate of Arts Associate of Science Certificates
2011-12
2012-13
2013-14
2014-15
2015-16
Associate of Arts
46%
Associate of Science
22%
Certificates32%
2015-2016
30

El Camino College Compton Center Annual Fact Book 2016
Transfer Destinations
2011-12 2012-13 2013-14 2014-15 2015-16 Cal State Poly. University, Pomona 9 9 12 5 11
Cal State University, Bakersfield 1 2 7 0 0
Cal State University, Dominguez Hills 143 169 165 155 204
Cal State University, Fullerton 13 7 8 7 7
Cal State University, Long Beach 78 55 66 59 61 Cal State University, Los Angeles 26 44 27 36 49
Cal State University, Northridge 27 31 26 26 18
San Diego State University 6 3 0 1 1
San Francisco State University 0 0 3 1 1
San Jose State University 0 4 3 0 0
Other Cal States 23 20 23 17 14 Total Cal State Transfers 326 344 340 307 366
2011-12 2012-13 2013-14 2014-15 2015-16 University of California, Berkeley 7 9 0 3 8
University of California Davis 0 3 6 4 9
University of California, Irvine 13 13 16 14 11
University of California, Los Angeles 18 9 25 24 22
University of California, Merced 2 1 2 1 1
University of California, Riverside 0 8 7 5 8
University of California, San Diego 7 8 10 6 1
University of California, Santa Barbara 3 2 5 2 5
University of California, Santa Cruz 5 6 5 3 1 Total UC Transfers 55 59 76 62 66
31

El Camino College Compton Center Annual Fact Book 2016
2011-12 2012-13 2013-14 2014-15 2015-16 Biola University 4 3 3 0 2 Chapman University 0 0 0 2 0 Loyola Marymount University 3 3 3 2 0 Mount St. Mary's University 9 5 3 2 5 National University 0 8 7 3 4 Otis College of Art and Design 0 0 1 0 0 Pepperdine University 0 1 0 0 0 University of Phoenix 2 6 6 6 4 University of Southern California 6 12 10 5 5 Other Private Institutions 14 10 8 23 15 Total Private Transfers 38 48 41 43 35
2011-12 2012-13 2013-14 2014-15 2015-16 Total Out of State Transfers 44 67 40 69 49
2011-12 2012-13 2013-14 2014-15 2015-16 Total Transfers 463 518 497 481 516
32

El Camino College Compton Center Annual Fact Book 2016
District Employees
33
El Camino College Compton Center Annual Fact Book 2016
2011-12 2012-13 2013-14 2014-15 2015-16
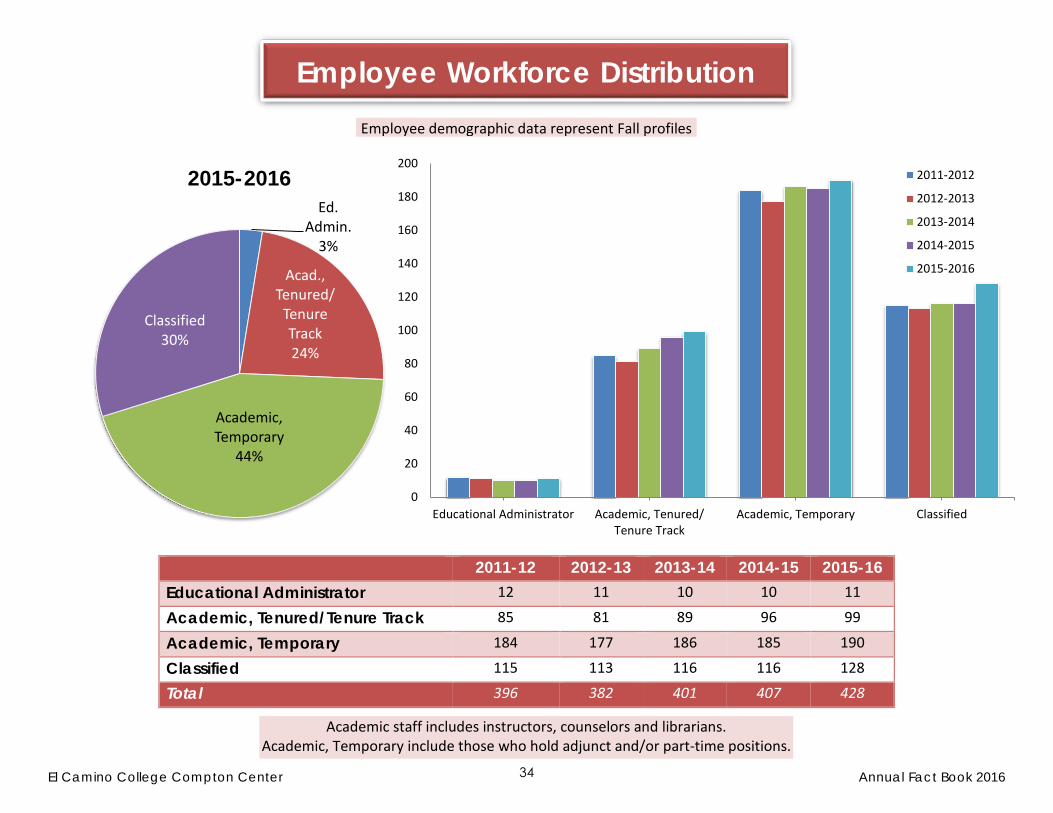
Educational Administrator 12 11 10 10 11
Academic, Tenured/Tenure Track 85 81 89 96 99
Academic, Temporary 184 177 186 185 190
Classified 115 113 116 116 128
Total 396 382 401 407 428
Ed. Admin.
3%
Acad., Tenured/
Tenure Track 24%
Academic, Temporary
44%
Classified30%
2015-2016
Employee Workforce Distribution Employee demographic data represent Fall profiles
Academic staff includes instructors, counselors and librarians. Academic, Temporary include those who hold adjunct and/or part-time positions.
0
20
40
60
80
100
120
140
160
180
200
Educational Administrator Academic, Tenured/Tenure Track
Academic, Temporary Classified
2011-2012
2012-2013
2013-2014
2014-2015
2015-2016
34

El Camino College Compton Center Annual Fact Book 2016
18-3415%
35-4422%
45-5425%
55-6424%
65+14%
2015-16
0
20
40
60
80
100
120
18-34 35-44 45-54 55-64 65+
2011-20122012-20132013-20142014-20152015-2016
2011-12 2012-13 2013-14 2014-15 2015-16 18-34 57 49 55 59 65
35-44 72 81 88 87 93
45-54 106 91 100 103 108
55-64 109 108 102 96 102
65+ 52 53 56 62 60
Total 396 382 401 407 428
Employee demographic data represent Fall profiles
Employee by Age
35
El Camino College Compton Center Annual Fact Book 2016
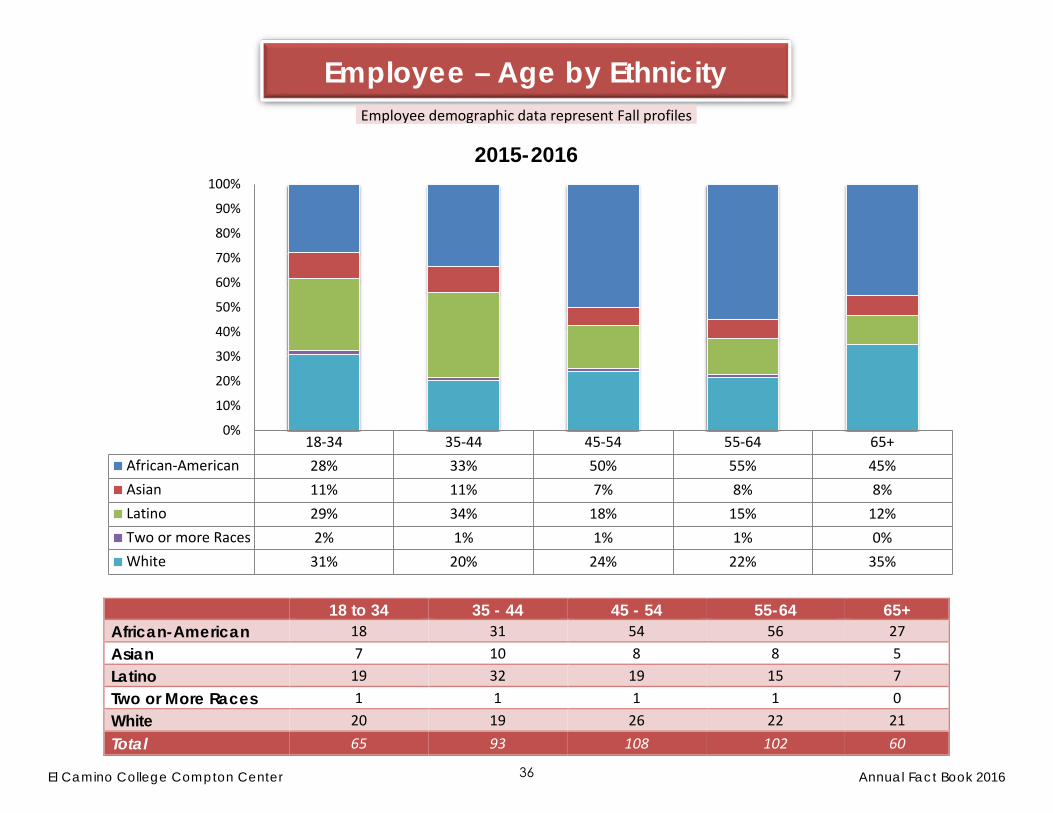
18 to 34 35 - 44 45 - 54 55-64 65+ African-American 18 31 54 56 27 Asian 7 10 8 8 5 Latino 19 32 19 15 7 Two or More Races 1 1 1 1 0 White 20 19 26 22 21 Total 65 93 108 102 60
18-34 35-44 45-54 55-64 65+African-American 28% 33% 50% 55% 45%Asian 11% 11% 7% 8% 8%Latino 29% 34% 18% 15% 12%Two or more Races 2% 1% 1% 1% 0%White 31% 20% 24% 22% 35%
0%
10%
20%
30%
40%
50%
60%
70%
80%
90%
100%
2015-2016
Employee – Age by Ethnicity Employee demographic data represent Fall profiles
36
El Camino College Compton Center Annual Fact Book 2016
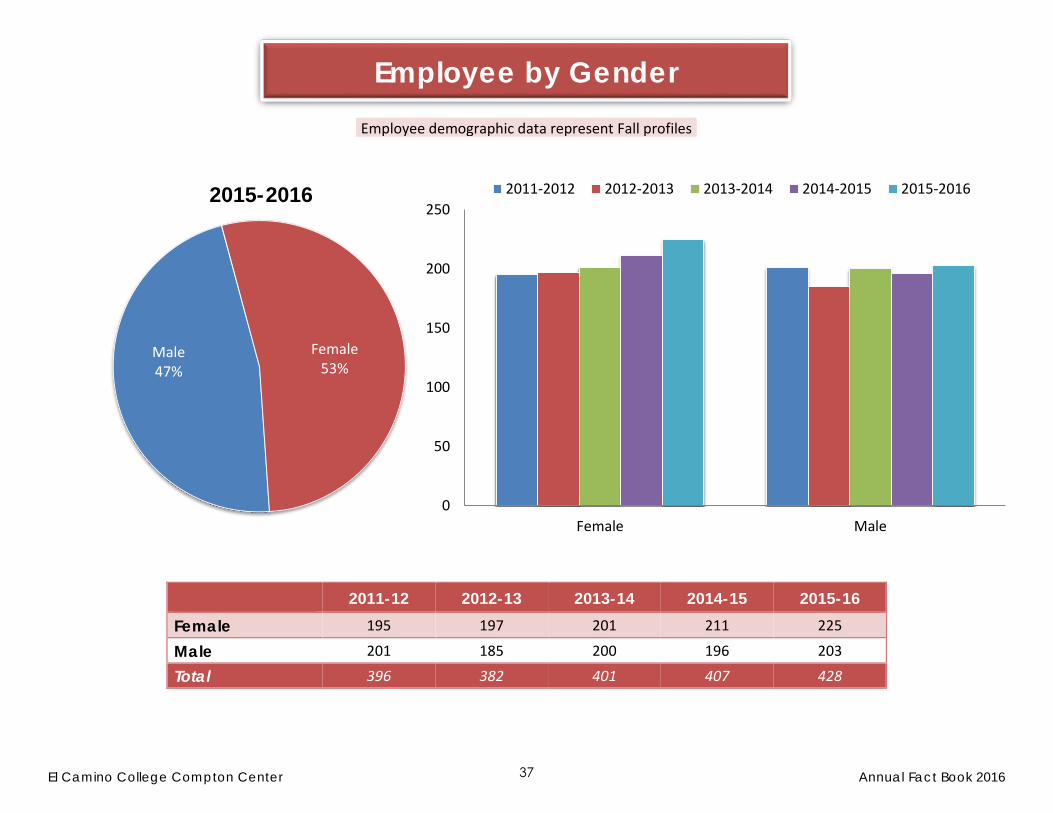
Male47%
Female53%
2015-2016
2011-12 2012-13 2013-14 2014-15 2015-16
Female 195 197 201 211 225
Male 201 185 200 196 203
Total 396 382 401 407 428
0
50
100
150
200
250
Female Male
2011-2012 2012-2013 2013-2014 2014-2015 2015-2016
Employee by Gender Employee demographic data represent Fall profiles
37

El Camino College Compton Center Annual Fact Book 2016
2011-12 2012-13 2013-14 2014-15 2015-16 African-American 179 173 183 187 186 Amer. Ind. Or Alask. Native 1 1 0 0 0 Asian 27 30 33 32 38 Latino 73 75 79 90 92 Pacific Islander 1 1 0 0 0 Two or More Races 1 0 4 3 4 White 102 86 83 95 108 Unknown or Decline 12 16 19 0 0 Total 396 382 401 407 428
African-American
43%
Asian9%Latino
22%
Two+ Races
1%
White25%
2015-2016
Employee by Ethnicity Employee demographic data represent Fall profiles
0
20
40
60
80
100
120
140
160
180
200
African-American Asian Latino White Other
2011-20122012-20132013-20142014-20152015-2016
Other Includes: Amer. Ind. or Alask. Native, Pacific Islander and Two+ Races
38

El Camino College Compton Center Annual Fact Book 2016
41
45
50
61
28
24
48
58
41
32
2015-2016
Female Male
18-34 35-44 45-54 55-64 65+ Female 63% 48% 46% 60% 47%
Male 37% 52% 54% 40% 53%
Employee – Gender by Age Employee demographic data represent Fall profiles
65+
55-64
45-54
35-44
18-34
39

El Camino College Compton Center Annual Fact Book 2016
African-American Asian Latino Two or More Races White
Female 58% 47% 57% 50% 43%
Male 42% 53% 43% 50% 57%
46
2
52
18
107
62
2
40
20
79
2015-2016
Female Male
Employee – Gender by Ethnicity Employee demographic data represent Fall profiles
African-American
Asian
Latino
Two or More Races
White
40