EL CAMINO COLLEGE CIRCULATION ANALYSIS April 24, 2015
83
;YHMÄJ ,UNPULLYPUN c ;YHUZWVY[H[PVU 7SHUUPUN c 7HYRPUN c 5VPZL=PIYH[PVU c ,_WLY[ >P[ULZZ (PY 8\HSP[` c .SVIHS *SPTH[L *OHUNL c /LHS[O 9PZR (ZZLZZTLU[ EL CAMINO COLLEGE CIRCULATION ANALYSIS April 24, 2015
Transcript of EL CAMINO COLLEGE CIRCULATION ANALYSIS April 24, 2015

EL CAMINO COLLEGE
CIRCULATION ANALYSIS
April 24, 2015

KKuunnzzmmaann AAssssoocciiaatteess,, IInncc..
EL CAMINO COLLEGE
CIRCULATION ANALYSIS
April 24, 2015
Prepared by:
Chris Pylant Carl Ballard, LEED GA
William Kunzman, P.E.
1111 Town & Country Road, Suite 34 Orange, California 92868
(714) 973-8383
www.traffic-engineer.com 5948

Table of Contents
I. Introduction ....................................................................................................................... 1
A. Project Description .......................................................................................................... 1 B. Study Area ........................................................................................................................ 1 C. Intersection Analysis Methodology ................................................................................. 1
II. Congestion Management Program Methodology ............................................................... 5 A. County Congestion Management Program ..................................................................... 5 B. Prescribed Methodology for a Traffic Impact Analysis .................................................... 5 C. Mitigation Measures ........................................................................................................ 6
III. Existing Conditions ............................................................................................................. 9 A. Existing Roadway System ................................................................................................. 9 B. Existing Volumes .............................................................................................................. 9 C. Existing Level of Service ................................................................................................... 9 E. Existing Transit Service ................................................................................................... 10 F. Planned Transportation Improvements and Relationship to General Plan ................... 10
IV. Traffic Volume Redistribution .......................................................................................... 17 A. Trip Redistribution ......................................................................................................... 17
V. Traffic Analysis ................................................................................................................. 19 A. Method of Projection ..................................................................................................... 19 B. Existing Plus Project Levels of Service ............................................................................ 19
VI. On-Site Traffic Considerations/Internal Circulation .......................................................... 23 VII. Conclusions and Recommendations ................................................................................. 25
A. Summary ........................................................................................................................ 25 B. Existing Conditions ......................................................................................................... 25 C. Existing Plus Project Conditions ..................................................................................... 25 D. Recommendations ......................................................................................................... 25
APPENDICES Appendix A – Glossary of Transportation Terms Appendix B – Traffic Count Worksheets Appendix C – Explanation and Calculation of Intersection Capacity Utilization

List of Tables
Table 1. Existing Intersection Capacity Utilization and Level of Service ...................................... 11 Table 2. Existing Plus Project Intersection Capacity Utilization and Level of Service .................. 20 Table 3. Existing Plus Project Traffic Contribution ...................................................................... 21

List of Figures
Figure 1. Project Location Map ....................................................................................................... 3 Figure 2. Site Plan ........................................................................................................................... 4 Figure 3. Existing Through Travel Lanes and Intersection Controls .............................................. 12 Figure 4. Existing Morning Peak Hour Intersection Turning Movement Volumes ....................... 13 Figure 5. County of Los Angeles Highway Plan ............................................................................. 14 Figure 6. City of Gardena General Plan Circulation Element ........................................................ 15 Figure 7. County of Los Angeles General Plan Roadway Cross-Sections ...................................... 16 Figure 8. Existing Plus Project Morning Peak Hour Intersection Turning Movement
Volumes ......................................................................................................................... 22 Figure 9. Circulation Recommendations – Proposed Parking Structure Area .............................. 28 Figure 10. Circulation Recommendations – Campus Wide ............................................................ 29

I. Introduction
The purpose of this report is to provide an assessment of existing campus circulation as well as circulation after development of the proposed north parking structure project and to identify the circulation mitigation measures necessary to maintain acceptable campus traffic operations. Although this is a technical report, every effort has been made to write the report clearly and concisely. To assist the reader with those terms unique to transportation engineering, a glossary of terms is provided in Appendix A. A. Project Description
El Camino College serves encompasses 126 acres and serves more than 25,000 students each semester. The college recently released a comprehensive master plan and many of its individual projects are currently under construction. As part of the master plan, a new parking structure was proposed at the north end of the campus. El Camino College proposes to construct a 1,443 space parking structure at the north end of the campus. The structure will have access to Manhattan Beach Boulevard via a redesigned loop access. A vicinity map showing the project location is provided on Figure 1. Figure 2 illustrates the project site plan. The focused traffic analysis accounts for the redistribution of traffic volumes with the construction of the new Parking Structure.
B. Study Area Regional access to the project site is provided by the I-405 Freeway. Local access is provided by various roadways in the vicinity of the site. The roadways which will be directly affected by the project are Crenshaw Boulevard and Manhattan Beach Boulevard. A series of scoping discussions were conducted with El Camino College to define the desired locations for the analysis.
C. Intersection Analysis Methodology The analysis of the traffic impacts from the proposed development and the assessment of the required mitigation measures were based on an evaluation of the existing and forecast traffic conditions in the vicinity of the site without and with the project. The following analysis years are considered in this report:
■ Existing Conditions (Year 2015) ■ Existing Plus Project Conditions
Existing intersection traffic conditions were established through morning peak hour traffic counts obtained by Kunzman Associates, Inc. in February 2015 (see Appendix B).

2
Existing Plus Project intersection traffic conditions were estimated by redistributing traffic volumes from other areas of the campus to the new parking structure.
5
II. Congestion Management Program Methodology
This section discusses the County Congestion Management Program. The purpose, prescribed methodology, and definition of a significant traffic impact are discussed. A. County Congestion Management Program
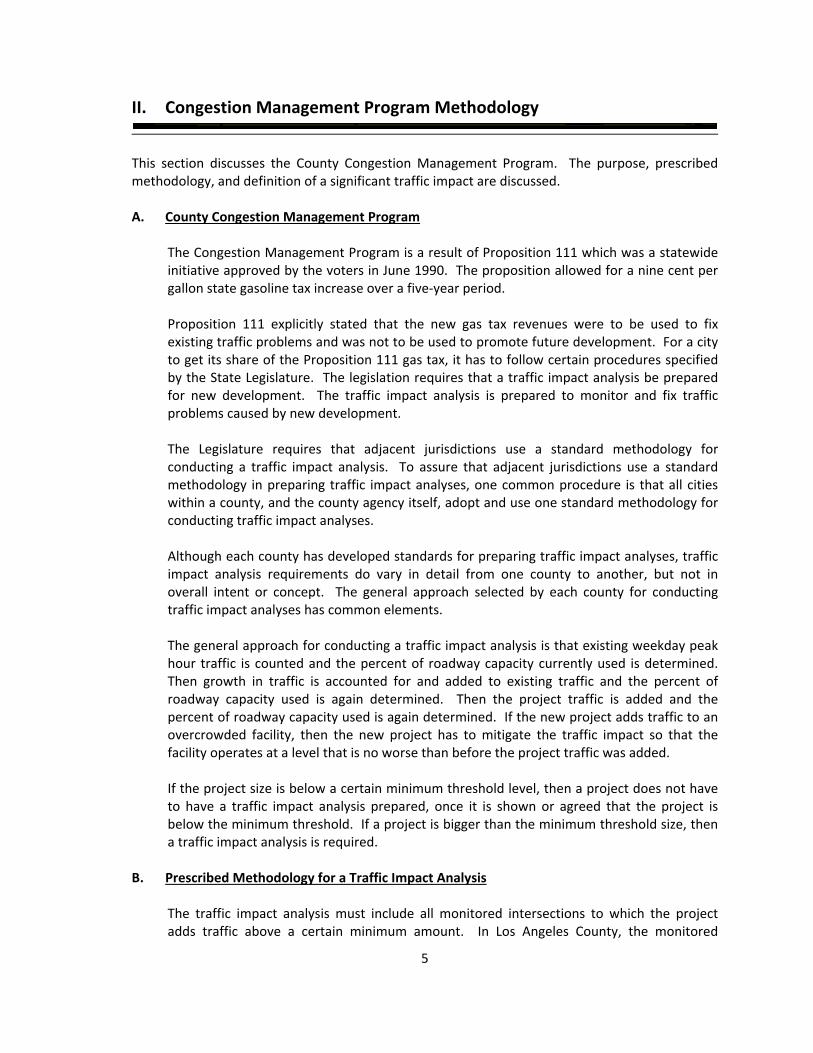
The Congestion Management Program is a result of Proposition 111 which was a statewide initiative approved by the voters in June 1990. The proposition allowed for a nine cent per gallon state gasoline tax increase over a five‐year period. Proposition 111 explicitly stated that the new gas tax revenues were to be used to fix existing traffic problems and was not to be used to promote future development. For a city to get its share of the Proposition 111 gas tax, it has to follow certain procedures specified by the State Legislature. The legislation requires that a traffic impact analysis be prepared for new development. The traffic impact analysis is prepared to monitor and fix traffic problems caused by new development. The Legislature requires that adjacent jurisdictions use a standard methodology for conducting a traffic impact analysis. To assure that adjacent jurisdictions use a standard methodology in preparing traffic impact analyses, one common procedure is that all cities within a county, and the county agency itself, adopt and use one standard methodology for conducting traffic impact analyses. Although each county has developed standards for preparing traffic impact analyses, traffic impact analysis requirements do vary in detail from one county to another, but not in overall intent or concept. The general approach selected by each county for conducting traffic impact analyses has common elements. The general approach for conducting a traffic impact analysis is that existing weekday peak hour traffic is counted and the percent of roadway capacity currently used is determined. Then growth in traffic is accounted for and added to existing traffic and the percent of roadway capacity used is again determined. Then the project traffic is added and the percent of roadway capacity used is again determined. If the new project adds traffic to an overcrowded facility, then the new project has to mitigate the traffic impact so that the facility operates at a level that is no worse than before the project traffic was added. If the project size is below a certain minimum threshold level, then a project does not have to have a traffic impact analysis prepared, once it is shown or agreed that the project is below the minimum threshold. If a project is bigger than the minimum threshold size, then a traffic impact analysis is required.
B. Prescribed Methodology for a Traffic Impact Analysis The traffic impact analysis must include all monitored intersections to which the project adds traffic above a certain minimum amount. In Los Angeles County, the monitored
6
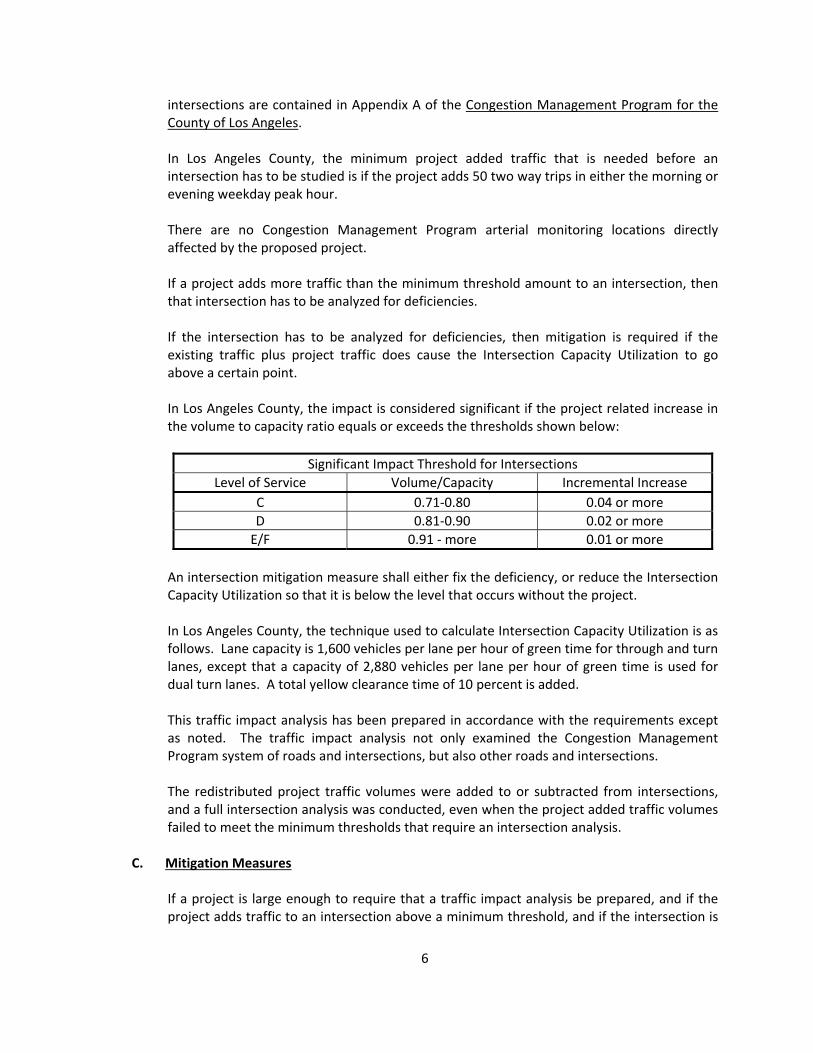
intersections are contained in Appendix A of the Congestion Management Program for the County of Los Angeles. In Los Angeles County, the minimum project added traffic that is needed before an intersection has to be studied is if the project adds 50 two way trips in either the morning or evening weekday peak hour. There are no Congestion Management Program arterial monitoring locations directly affected by the proposed project. If a project adds more traffic than the minimum threshold amount to an intersection, then that intersection has to be analyzed for deficiencies. If the intersection has to be analyzed for deficiencies, then mitigation is required if the existing traffic plus project traffic does cause the Intersection Capacity Utilization to go above a certain point. In Los Angeles County, the impact is considered significant if the project related increase in the volume to capacity ratio equals or exceeds the thresholds shown below:
Significant Impact Threshold for Intersections Level of Service Volume/Capacity Incremental Increase
C 0.71‐0.80 0.04 or more D 0.81‐0.90 0.02 or more E/F 0.91 ‐ more 0.01 or more
An intersection mitigation measure shall either fix the deficiency, or reduce the Intersection Capacity Utilization so that it is below the level that occurs without the project. In Los Angeles County, the technique used to calculate Intersection Capacity Utilization is as follows. Lane capacity is 1,600 vehicles per lane per hour of green time for through and turn lanes, except that a capacity of 2,880 vehicles per lane per hour of green time is used for dual turn lanes. A total yellow clearance time of 10 percent is added. This traffic impact analysis has been prepared in accordance with the requirements except as noted. The traffic impact analysis not only examined the Congestion Management Program system of roads and intersections, but also other roads and intersections. The redistributed project traffic volumes were added to or subtracted from intersections, and a full intersection analysis was conducted, even when the project added traffic volumes failed to meet the minimum thresholds that require an intersection analysis.
C. Mitigation Measures If a project is large enough to require that a traffic impact analysis be prepared, and if the project adds traffic to an intersection above a minimum threshold, and if the intersection is

7
operating at above an acceptable level of operation, then the project must mitigate its traffic impact. Traffic mitigation can be in many forms including adding lanes. Lanes can sometimes be obtained through restriping or elimination of parking, and sometimes require spot roadway widening. In the County of Los Angeles, Transportation Demand Management mitigation measures are required as a function of size of non‐residential development. For non‐residential projects with 25,000 square feet of floor space, an employee Transportation Information Area is required. For projects with 50,000 square feet or more, Preferential Carpool/Vanpool Parking, Parking Designed to Admit Vanpools, and Bicycle Parking are also required. For projects with 100,000 or more square feet of floor space, Carpool/Vanpool Loading Zones, Efficient Pedestrian Access, Bus Stop Improvements, and Safe Bike Access from Street to Bike Parking are also required. The Los Angeles County Congestion Management Program Transportation Demand Management components are described below. Projects with more than 25,000 square feet of non‐residential floor space must provide: Transportation Information Area. The information area may consist of a bulletin board, display case or kiosk featuring transportation information. The types of information that must be included are transit route maps, bicycle route maps, information numbers for local transit operators and the regional ridesharing agency, as well as a list of alternative transportation amenities at the site. Projects with more than 50,000 square feet of non‐residential floor space must also provide: Preferential Carpool/Vanpool Parking. No less than 10 percent of all employee parking shall be set aside for carpools and vanpools. The preferential parking spaces must be provided upon request. Parking Designed to Admit Vanpools. Vanpool parking areas must be designed to admit vanpool vehicles. A minimum interior clearance for parking structures of 7 foot 2 inches is required. Bicycle Parking. Bicycle parking facilities may include bicycle racks, bicycle lockers or locked storage rooms. Projects with more than 100,000 square feet of non‐residential floor space must also provide: Carpool/Vanpool Loading Zones. A safe and convenient area for carpool and vanpool passengers to wait for, board, and disembark from their ridesharing arrangement.
8
Direct Access for Pedestrians. A pedestrian system that allows direct and convenient access to the development. Bus Stop Improvements. If appropriate, improvements must be made to bus stop areas of bus routes impacted by the proposed development. Consultation with local bus service providers shall be required. Direct Access to Bicycle Parking from Street. Safe and convenient access to development bicycle parking from the external street system for bicycle riders.

9
III. Existing Conditions
A. Existing Roadway System
Figure 3 identifies the Existing conditions for the study area roadways. The number of through lanes for existing roadways and the existing intersection controls are identified. Regional access to the project site is provided by the I-405 Freeway. Local access is provided by various roadways in the vicinity of the site. The roadways which will be directly affected by the project include Crenshaw Boulevard and Manhattan Beach Boulevard. Crenshaw Boulevard: This north-south roadway is currently four lanes divided to six lanes divided in the study area. It is classified as a Major Highway on the County of Los Angeles Highway Plan. Manhattan Beach Boulevard: This east-west roadway is currently four lanes divided in the study area. It is classified as a Major Highway on the County of Los Angeles Highway Plan.
B. Existing Volumes Community colleges create many more vehicle trips during the morning peak hour than during the evening peak hour. Therefore, the morning peak hour was determined by obtaining manual counts between the hours of 8:00 AM and 12:00 NOON. The actual peak hour within the four hour interval is the four consecutive 15 minute periods with the highest total volume when all movements are added together. Thus, the peak hour at one intersection may be 8:45 AM to 9:45 AM if those four consecutive 15 minute periods have the highest combined volume. Existing intersection traffic conditions were established through traffic counts obtained by Kunzman Associates, Inc. in February 2015 (see Appendix B) and are shown with the highest peak hour on Figure 4. Explicit peak hour factors have been calculated using the data collected for this effort as well.
C. Existing Level of Service The Existing Levels of Service for intersections directly affected by the project are shown in Table 1. The study area intersections currently operate at acceptable Levels of Service during the morning peak hour for Existing traffic conditions. Existing Level of Service worksheets are provided in Appendix C.
D. Existing Internal Circulation
El Camino College staff have expressed concern with the operation of the frontage road that currently runs parallel to Manhattan Beach Boulevard and Crenshaw Boulevard. The frontage road currently runs from the northwest corner of the campus (Campus Access 1) to the existing Lot H, a parking structure located at the southern end of the campus.

10
After several site visits by Kunzman Associates, Inc. during the morning peak hour, it was determined that the frontage road currently functions effectively along the northern edge of the campus (from Campus Access 1 to Campus Access 7). There are, however, several issues along the eastern edge of campus, specifically where the frontage road intersects Campus Accesses 8 through 10. Moderate queues (3 to 4 vehicles) were observed at the northbound and southbound approaches of the intersection of the frontage road and Campus Access 9. These vehicles were often queued for 30 seconds or more. A large queue (10+ vehicles) was observed at the southbound approach of the intersection of the frontage road and Campus Access 10. These vehicles were often queued for 60 seconds or more. Though not a part of our study area, the intersections along the southern portion of the frontage road (those south of Campus Access 10) were observed during the ite visits. During the morning peak hour, a very large queue (approximately 50 vehicles) formed along the frontage road beginning at its terminus at Lot H. The queue extended around the roundabout in Lot L and sometimes reached the southern access to Lots J and K.
E. Existing Transit Service Transit service is provided adjacent to El Camino College by the Los Angeles County Metropolitan Transportation Authority (MTA) Transit Routes 126, 210, and 710, Torrance Transit Routes 2 and 5, the Municipal Area Express (MAX) Transit Route 3, and the Gardena Municipal Bus Line Transit Routes 3 and 4.
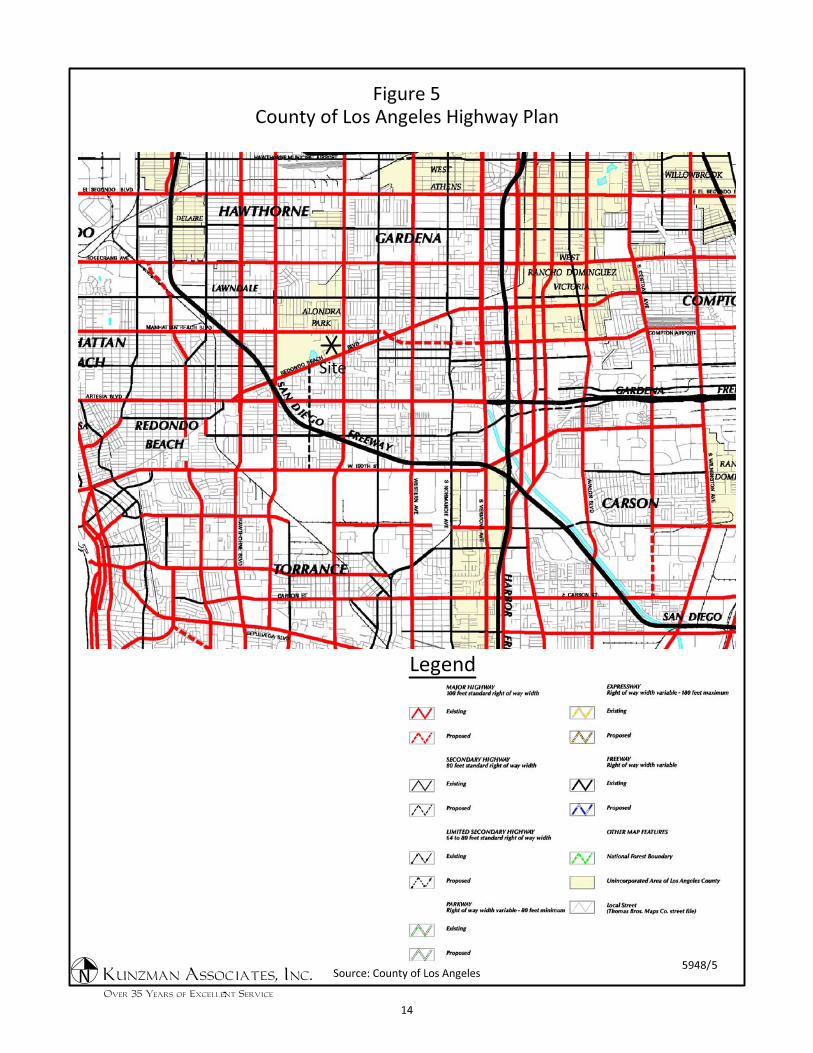
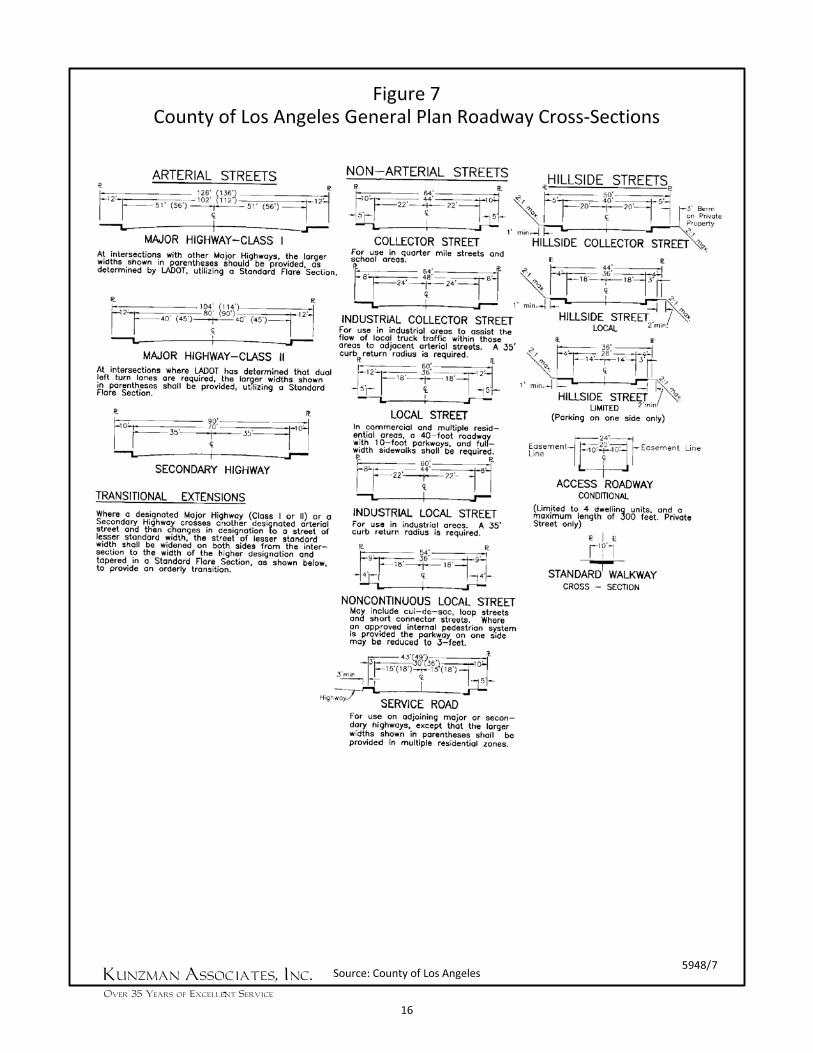
F. Planned Transportation Improvements and Relationship to General Plan The County of Los Angeles Highway Plan is shown on Figure 5. Additionally, the City of Gardena General Plan Circulation Element is shown on Figure 6. Existing and future roadways are included in these plans and are graphically depicted on Figures 5 and 6. These figures show the nature and extent of arterial highways that are needed to adequately serve the ultimate development depicted by the Land Use Elements of each jurisdiction’s General Plan. The County of Los Angeles General Plan roadway cross-sections are illustrated on Figure 7.

MorningTraffic Peak HourControl3 L T R L T R L T R L T R ICU‐LOS2
Campus Access 1 (NS) at:Manhattan Beach Boulevard (EW) ‐ #1 CSS 0 0 2 0 0 0 0 1.5 0.5 1 2 0 0.305‐A
Campus Access 2 (NS) at:Redondo Beach Boulevard (EW) ‐ #2 CSS 0 0 2 0 0 0 0 2 0 0 2 0 0.205‐A
Campus Access 3 (NS) at:Redondo Beach Boulevard (EW) ‐ #3 CSS 0 0 1 0 0 0 0 2 d 0 2 0 0.221‐A
Campus Access 4 (NS) at:Redondo Beach Boulevard (EW) ‐ #4 CSS 0 0 1 0 0 0 0 2 d 1 2 0 0.225‐A
Lemoli Avenue (NS) at:Manhattan Beach Boulevard (EW) ‐ #5 TS 0.5 0.5 1 0 1 0 1 2 d 1 2 d 0.329‐A
Campus Access 6 (NS) at:Manhattan Beach Boulevard (EW) ‐ #6 CSS 0.5 0 0.5 0 0 0 0 2 d 1 2 0 0.204‐A
Campus Access 7 (NS) at:Manhattan Beach Boulevard (EW) ‐ #7 CSS 0 0 1 0 0 0 0 2 d 0 2 0 0.234‐A
Crenshaw Boulevard (NS) at:Campus Access 8 (EW) ‐ #8 CSS 1 3 0 0 2.5 0.5 0.5 0 0.5 0 0 0 0.220‐ACampus Access 9 (EW) ‐ #9 TS 1 2.5 0.5 1 2.5 0.5 0 1 0 0 0 1 0.337‐ACampus Access 10 (EW) ‐ #10 CSS 0 3 0 0 2.5 0.5 0 0 1 0 0 1 0.316‐A
1 When a right turn lane is designated, the lane can either be striped or unstriped. To function as a right turn lane, there must be sufficient width for right
turning vehicles to travel outside the through lanes.
L = Left; T = Through; R = Right; d = De Facto Right Turn
2 ICU‐LOS = Intersection Capacity Utilization ‐ Level of Service
3 CSS = Cross Street Stop; TS = Traffic Signal
IntersectionNorthbound Southbound Eastbound
Existing Intersection Capacity Utilization and Level of Service
Table 1
Intersection Approach Lanes1
Westbound
11


17
IV. Traffic Volume Redistribution
As part of its 2012 Facilities Master Plan, El Camino College proposes to construct a 1,443 space parking structure at the north end of the campus. The structure will have access to Manhattan Beach Boulevard via a redesigned loop access (see Figure 2). A. Trip Redistribution
The proposed parking structure will not result in any added trips, but rather is a solution to a future parking deficiency outlined in previous studies1. To analyze the effects of building the proposed structure, peak hour trips throughout the campus have been redistributed to reflect the increased parking capacity at the north end of campus. This redistribution was completed in several steps as outlined below. The redistribution of traffic volumes was based on the comparison of campus parking demand at each parking lot as measured in previous studies1. 1. Campus Growth
Existing parking demand was calculated by applying a 2.4 percent annual growth rate over three (3) years to the parking counts performed in 2012. This was developed by splitting the 22.1% growth over 8 years identified in the 2012 Facilities Master Plan into a yearly rate.
2. Demand Spreading After adjusting for growth alone, many of the parking lots had an estimated existing demand of over 90%. A 90% utilization rate is ideal for parking lots. Therefore, demand at these parking lots in excess of 90% was redistributed to the new north parking structure. Then, additional demand was redistributed from these parking lots until parking utilization was similar throughout all major campus parking areas and differences in demand between parking lots were comparable to 2012 conditions.
3. Conversion to Peak Hour Trips The redistributed parking demand was converted to peak hour trips by assigning the number of morning peak hour trips forecasted by the Institute of Transportation Engineers, Trip Generation, 9th Edition, 2012 (Land Use Category 540) to each parking lot proportionally after subtracting 100 trips (50 inbound and 50 outbound) which were assumed to be drop-offs. The percent of demand from each parking lot being redistributed is applied to the total peak hour trips assigned to that parking lot to come up with the number of peak hour trips being reassigned. Half (25) of the drop-off trips
1 Source: El Camino College 2012 Facilities Master Plan Traffic Impact Analysis, Kunzman Associates, Inc. (March 4,
2013) and El Camino College 2012 Facilities Master Plan Parking Analysis, Kunzman Associates, Inc. (March 4, 2013).

18
were directly redistributed to reflect the additional proposed drop‐off area adjacent to the proposed parking structure.
19
V. Traffic Analysis
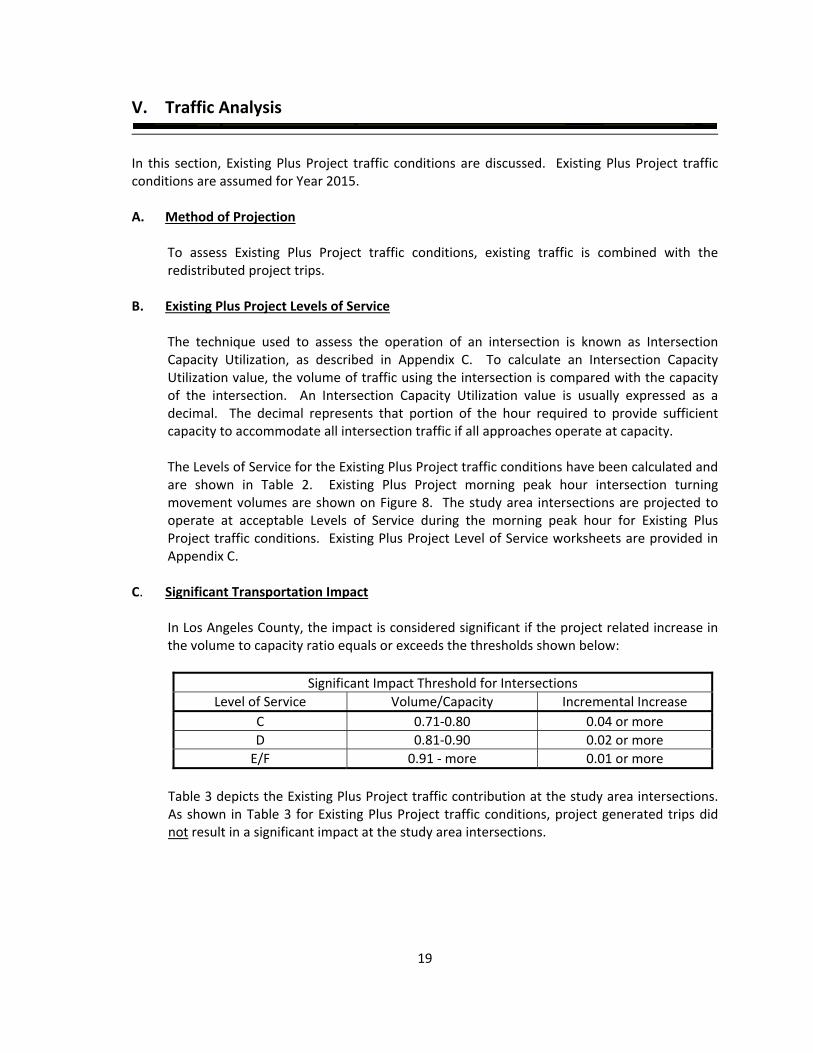
In this section, Existing Plus Project traffic conditions are discussed. Existing Plus Project traffic conditions are assumed for Year 2015. A. Method of Projection
To assess Existing Plus Project traffic conditions, existing traffic is combined with the redistributed project trips.
B. Existing Plus Project Levels of Service The technique used to assess the operation of an intersection is known as Intersection Capacity Utilization, as described in Appendix C. To calculate an Intersection Capacity Utilization value, the volume of traffic using the intersection is compared with the capacity of the intersection. An Intersection Capacity Utilization value is usually expressed as a decimal. The decimal represents that portion of the hour required to provide sufficient capacity to accommodate all intersection traffic if all approaches operate at capacity. The Levels of Service for the Existing Plus Project traffic conditions have been calculated and are shown in Table 2. Existing Plus Project morning peak hour intersection turning movement volumes are shown on Figure 8. The study area intersections are projected to operate at acceptable Levels of Service during the morning peak hour for Existing Plus Project traffic conditions. Existing Plus Project Level of Service worksheets are provided in Appendix C.
C. Significant Transportation Impact In Los Angeles County, the impact is considered significant if the project related increase in the volume to capacity ratio equals or exceeds the thresholds shown below:
Significant Impact Threshold for Intersections Level of Service Volume/Capacity Incremental Increase
C 0.71‐0.80 0.04 or more D 0.81‐0.90 0.02 or more E/F 0.91 ‐ more 0.01 or more
Table 3 depicts the Existing Plus Project traffic contribution at the study area intersections. As shown in Table 3 for Existing Plus Project traffic conditions, project generated trips did not result in a significant impact at the study area intersections.

MorningTraffic Peak HourControl3 L T R L T R L T R L T R ICU‐LOS2
Campus Access 1 (NS) at:Manhattan Beach Boulevard (EW) ‐ #1 CSS 0 0 2 0 0 0 0 1.5 0.5 1 2 0 0.300‐A
Campus Access 2 (NS) at:Redondo Beach Boulevard (EW) ‐ #2 CSS 0 0 2 0 0 0 0 2 0 0 2 0 0.204‐A
Campus Access 3 (NS) at:Redondo Beach Boulevard (EW) ‐ #3 CSS 0 0 1 0 0 0 0 2 d 0 2 0 0.224‐A
Campus Access 4 (NS) at:Redondo Beach Boulevard (EW) ‐ #4 CSS 0 0 1 0 0 0 0 2 d 1 2 0 0.235‐A
Lemoli Avenue (NS) at:Manhattan Beach Boulevard (EW) ‐ #5 TS 0.5 0.5 1 0 1 0 1 2 d 1 2 d 0.370‐A
Campus Access 6 (NS) at:Manhattan Beach Boulevard (EW) ‐ #6 CSS 0.5 0 0.5 0 0 0 0 2 d 1 2 0 0.238‐A
Campus Access 7 (NS) at:Manhattan Beach Boulevard (EW) ‐ #7 CSS 0 0 1 0 0 0 0 2 d 0 2 0 0.265‐A
Crenshaw Boulevard (NS) at:Campus Access 8 (EW) ‐ #8 CSS 1 3 0 0 2.5 0.5 0.5 0 0.5 0 0 0 0.238‐ACampus Access 9 (EW) ‐ #9 TS 1 2.5 0.5 1 2.5 0.5 0 1 0 0 0 1 0.331‐ACampus Access 10 (EW) ‐ #10 CSS 0 3 0 0 2.5 0.5 0 0 1 0 0 1 0.309‐A
1 When a right turn lane is designated, the lane can either be striped or unstriped. To function as a right turn lane, there must be sufficient width for right
turning vehicles to travel outside the through lanes.
L = Left; T = Through; R = Right; > = Right Turn Overlap; d = De Facto Right Turn; 1 = Improvement
2 ICU‐LOS = Intersection Capacity Utilization ‐ Level of Service
3 CSS = Cross Street Stop; TS = Traffic Signal
Table 2
Existing Plus Project Intersection Capacity Utilization and Level of Service
Intersection Approach Lanes1
IntersectionNorthbound Southbound Eastbound Westbound
20
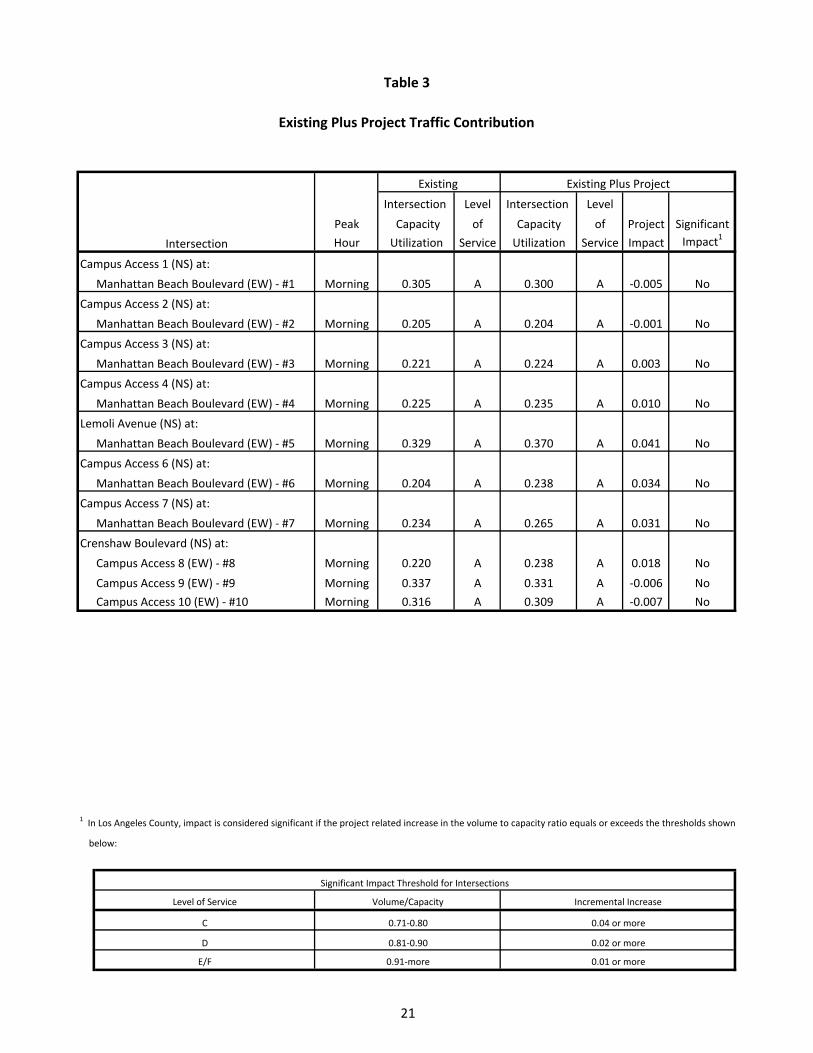
Intersection Level Intersection LevelPeak Capacity of Capacity of Project SignificantHour Utilization Service Utilization Service Impact Impact1
Campus Access 1 (NS) at:Manhattan Beach Boulevard (EW) ‐ #1 Morning 0.305 A 0.300 A ‐0.005 No
Campus Access 2 (NS) at:Manhattan Beach Boulevard (EW) ‐ #2 Morning 0.205 A 0.204 A ‐0.001 No
Campus Access 3 (NS) at:Manhattan Beach Boulevard (EW) ‐ #3 Morning 0.221 A 0.224 A 0.003 No
Campus Access 4 (NS) at:Manhattan Beach Boulevard (EW) ‐ #4 Morning 0.225 A 0.235 A 0.010 No
Lemoli Avenue (NS) at:Manhattan Beach Boulevard (EW) ‐ #5 Morning 0.329 A 0.370 A 0.041 No
Campus Access 6 (NS) at:
Manhattan Beach Boulevard (EW) ‐ #6 Morning 0.204 A 0.238 A 0.034 NoCampus Access 7 (NS) at:
Manhattan Beach Boulevard (EW) ‐ #7 Morning 0.234 A 0.265 A 0.031 NoCrenshaw Boulevard (NS) at:
Campus Access 8 (EW) ‐ #8 Morning 0.220 A 0.238 A 0.018 NoCampus Access 9 (EW) ‐ #9 Morning 0.337 A 0.331 A ‐0.006 NoCampus Access 10 (EW) ‐ #10 Morning 0.316 A 0.309 A ‐0.007 No
1 In Los Angeles County, impact is considered significant if the project related increase in the volume to capacity ratio equals or exceeds the thresholds shown
below:
Level of Service
C
D
E/F 0.91‐more
Volume/Capacity
0.71‐0.80
Significant Impact Threshold for Intersections
Incremental Increase
0.04 or more
0.02 or more
0.01 or more
Table 3
Existing Plus Project Traffic Contribution
Intersection
Existing Existing Plus Project
0.81‐0.90
21


23
VI. On-Site Traffic Considerations/Internal Circulation
As stated previously, El Camino College staff have expressed concern with the operation of the frontage road that currently runs parallel to Manhattan Beach Boulevard and Crenshaw Boulevard. The frontage road currently runs from the northwest corner of the campus (Campus Access 1) to the existing Lot H, a parking structure at the southern end of the campus. B. Internal Circulation Review
The on-site traffic circulation has been reviewed from a traffic engineering viewpoint, and the findings are as follows:
1. The closure of the frontage road between Lots B and D is not projected to result in any substantial traffic impacts. Access to all lots will be provided with completion of the proposed project and the inclusion of circulation recommendations shown on Figures 9 and 10.
2. The construction of the proposed parking structure will reduce demand at all
existing lots. The greatest improvements will be seen at lots which are currently at or near capacity. This includes Lots H, J, K, and L. Reduced demand at these lots will significantly reduce the queues along the southern portion of the frontage road.
3. The proposed additional drop-off area at the north end of campus will decrease
demand and improve congestion significantly along the portion of the frontage road which parallels Crenshaw Boulevard.
C. Garage Circulation
To facilitate internal circulation within the garage, the following is recommended:
1. Each parking level should have large numbers on the pillars or walls designating on which floor level the user has parked. Letters can also be added to designate what area within a parking level the person has parked such as 3 B.
2. The elevators and stairways should be clearly marked with signs to direct the user
how to go from their car to the main part of the campus.
3. At each aisle juncture, there should be an "Exit" sign that tells which way to go to exit.
4. Speed controls such as speed bumps may be desirable when straight sections of drive aisle exceed 300 feet.
5. An electronic system advising users of the number of available spaces on each floor is highly recommended.
24
C. Site Access
The proposed changes to Campus Access 5 will allow smooth traffic operations for vehicles entering and exiting. Landscape plantings and signs should be limited to 36 inches in height within 25 feet of the redesigned campus driveways to assure good visibility. As is the case for any roadway design, the County of Los Angeles should periodically review traffic operations in the vicinity of the project once the project is constructed to assure that the traffic operations are satisfactory.

25
VII. Conclusions and Recommendations
A. Summary
El Camino College serves encompasses 126 acres and serves more than 25,000 students each semester. The college recently released a comprehensive master plan and many of its individual projects are currently under construction. As part of the master plan, a new parking structure was proposed at the north end of the campus. El Camino College proposes to construct a 1,443 space parking structure at the north end of the campus. The structure will have access to Manhattan Beach Boulevard via a redesigned loop access. Existing intersection traffic conditions were established through morning peak hour traffic counts obtained by Kunzman Associates, Inc. in February 2015 (see Appendix B).
B. Existing Conditions Regional access to the project site is provided by the I-405 Freeway. Local access is provided by various roadways in the vicinity of the site. The roadways which will be directly affected by the project are Crenshaw Boulevard and Manhattan Beach Boulevard. The study area intersections currently operate at acceptable Levels of Service during the morning peak hour for Existing traffic conditions.
C. Existing Plus Project Conditions
For existing plus project traffic conditions, the study area intersections are projected to operate at acceptable Levels of Service during the morning peak hour.
D. Recommendations
The following mitigation measures are recommended for the El Camino College campus: On-Site Mitigation Measures The college shall implement the Opening Year site-specific circulation and access recommendations depicted on Figure 9 and 10. These recommendations include: 1. Construct the proposed drop-off area along the circle serving Campus Access 5. This
area will greatly reduce demand on the frontage road between Campus Accesses 8 and 10.
2. Install a signal at Campus Access 1. Though the Level of Service is currently acceptable,
a traffic signal is recommended in the future to handle campus growth. In addition, the closure of the frontage road between Campus Accesses 4 and 5 removes the ability for

26
vehicles exiting Lot F to make a legal left turn onto Manhattan Beach Boulevard. The addition of a signal at Campus Access 5 would restore this option.
3. Construct Campus Access 5 as proposed and leave signal phasing unchanged. The lane
configuration proposed for Campus Access 5 has been found to be acceptable. 4. Preserve the two way left turn lane along Manhattan Beach Boulevard from 120 feet
west of Campus Access 6 to 160 feet east of Campus Access 6. This lane ensures that vehicles travelling westbound on Manhattan Beach Boulevard will be able to turn left into Lot B and the proposed Lot 1. It also allows vehicles exiting those lots to turn left onto Manhattan Beach Boulevard.
5. Preserve the driveway configurations for all other campus accesses.
The college shall implement the Transportation Demand Management mitigation measures required by the Los Angeles County Congestion Management Program for projects of 100,000 or more square feet of floor space. Facilities Planning and Services shall monitor compliance. The college shall implement on-site traffic signing and striping in conjunction with detailed construction plans for the project. Facilities Planning and Services shall monitor compliance. Sight distance at the redesigned project accesses should be reviewed with respect to California Department of Transportation/County of Los Angeles standards in conjunction with the preparation of final grading, landscaping, and street improvement plans. Facilities Planning and Services shall monitor compliance. As is the case for any roadway design, the County of Los Angeles should periodically review traffic operations in the vicinity of the project once the project is constructed to assure that the traffic operations are satisfactory. Construction Mitigation Measures The college shall update parking, pedestrian, circulation, and signage plans regularly to address direct and indirect public safety needs for parking on campus during the construction period. Construction employee parking areas shall be identified and the changing parking demands created by construction, increased student enrollments, and new building locations projected to balance parking demand and supply. Facilities Planning and Service shall monitor compliance. Contractors shall submit traffic handling plans to Facilities Planning and Services and to the Campus Police Department prior to commencement of demolition or grading. The plans and documents shall comply with the Work Area Traffic Control Handbook (WATCH). Facilities Planning and Services shall approve the final plans and monitor compliance. Demolition and construction contracts shall include plans for temporary sidewalk closures, pedestrian safety on adjacent sidewalks, and vehicle and pedestrian safety along the project

27
perimeter, along construction equipment haul routes on campus and near on-site construction parking areas. These plans shall be reviewed by the Campus Police Division and approved by Facilities Planning and Services. Facilities Planning and Services shall monitor compliance. Construction contractors shall post a flag person at locations near a construction site during major truck hauling activities to protect pedestrians from conflicts with heavy equipment entering or leaving the project site. Facilities Planning and Services shall monitor compliance. Each project construction site shall be adequately barricaded with temporary fencing to secure construction equipment, minimize trespassing, vandalism, short-cut attractions, and reduce hazards during demolition and construction. Facilities Planning and Services shall monitor compliance. The college shall consult with the effected cities on a truck haul route plan for all major earth hauling activities with more than eighty (80) trucks per day shall be established. Hauling of earth materials shall only occur between 9:00 AM and 2:00 PM Monday through Friday and between 8:00 AM and 5:00 PM on Saturdays. Light duty trucks with a weight of no more than 8,500 pounds are exempted from this restriction. Facilities Planning and Services shall ensure compliance.
Transportation System Management Actions Schedule/fee information for the Los Angeles County Metropolitan Transportation Authority (MTA), Torrance Transit, Municipal Area Express (MAX), and the Gardena Municipal Bus Line shall be made available for students for each term. The college shall offer students discount bus passes for transit lines which offer them. Facilities Planning and Services shall monitor compliance.


Appendices
Appendix A – Glossary of Transportation Terms Appendix B – Traffic Count Worksheets Appendix C – Explanation and Calculation of Intersection Capacity Utilization
APPENDIX A
Glossary of Transportation Terms

GLOSSARY OF TRANSPORTATION TERMS COMMON ABBREVIATIONS AC: Acres ADT: Average Daily Traffic Caltrans: California Department of Transportation DU: Dwelling Unit ICU: Intersection Capacity Utilization LOS: Level of Service TSF: Thousand Square Feet V/C: Volume/Capacity VMT: Vehicle Miles Traveled TERMS AVERAGE DAILY TRAFFIC: The total volume during a year divided by the number of days in a year. Usually only weekdays are included. BANDWIDTH: The number of seconds of green time available for through traffic in a signal progression. BOTTLENECK: A constriction along a travelway that limits the amount of traffic that can proceed downstream from its location. CAPACITY: The maximum number of vehicles that can be reasonably expected to pass over a given section of a lane or a roadway in a given time period. CHANNELIZATION: The separation or regulation of conflicting traffic movements into definite paths of travel by the use of pavement markings, raised islands, or other suitable means to facilitate the safe and orderly movements of both vehicles and pedestrians. CLEARANCE INTERVAL: Nearly same as yellow time. If there is an all red interval after the end of a yellow, then that is also added into the clearance interval. CORDON: An imaginary line around an area across which vehicles, persons, or other items are counted (in and out). CYCLE LENGTH: The time period in seconds required for one complete signal cycle. CUL‐DE‐SAC STREET: A local street open at one end only, and with special provisions for turning around.

DAILY CAPACITY: The daily volume of traffic that will result in a volume during the peak hour equal to the capacity of the roadway. DELAY: The time consumed while traffic is impeded in its movement by some element over which it has no control, usually expressed in seconds per vehicle. DEMAND RESPONSIVE SIGNAL: Same as traffic‐actuated signal. DENSITY: The number of vehicles occupying in a unit length of the through traffic lanes of a roadway at any given instant. Usually expressed in vehicles per mile. DETECTOR: A device that responds to a physical stimulus and transmits a resulting impulse to the signal controller. DESIGN SPEED: A speed selected for purposes of design. Features of a highway, such as curvature, superelevation, and sight distance (upon which the safe operation of vehicles is dependent) are correlated to design speed. DIRECTIONAL SPLIT: The percent of traffic in the peak direction at any point in time. DIVERSION: The rerouting of peak hour traffic to avoid congestion. FORCED FLOW: Opposite of free flow. FREE FLOW: Volumes are well below capacity. Vehicles can maneuver freely and travel is unimpeded by other traffic. GAP: Time or distance between successive vehicles in a traffic stream, rear bumper to front bumper. HEADWAY: Time or distance spacing between successive vehicles in a traffic stream, front bumper to front bumper. INTERCONNECTED SIGNAL SYSTEM: A number of intersections that are connected to achieve signal progression. LEVEL OF SERVICE: A qualitative measure of a number of factors, which include speed and travel time, traffic interruptions, freedom to maneuver, safety, driving comfort and convenience, and operating costs. LOOP DETECTOR: A vehicle detector consisting of a loop of wire embedded in the roadway, energized by alternating current and producing an output circuit closure when passed over by a vehicle.

MINIMUM ACCEPTABLE GAP: Smallest time headway between successive vehicles in a traffic stream into which another vehicle is willing and able to cross or merge. MULTI‐MODAL: More than one mode; such as automobile, bus transit, rail rapid transit, and bicycle transportation modes. OFFSET: The time interval in seconds between the beginning of green at one intersection and the beginning of green at an adjacent intersection. PLATOON: A closely grouped component of traffic that is composed of several vehicles moving, or standing ready to move, with clear spaces ahead and behind. ORIGIN‐DESTINATION SURVEY: A survey to determine the point of origin and the point of destination for a given vehicle trip. PASSENGER CAR EQUIVALENTS (PCE): One car is one Passenger Car Equivalent. A truck is equal to 2 or 3 Passenger Car Equivalents in that a truck requires longer to start, goes slower, and accelerates slower. Loaded trucks have a higher Passenger Car Equivalent than empty trucks. PEAK HOUR: The 60 consecutive minutes with the highest number of vehicles. PRETIMED SIGNAL: A type of traffic signal that directs traffic to stop and go on a predetermined time schedule without regard to traffic conditions. Also, fixed time signal. PROGRESSION: A term used to describe the progressive movement of traffic through several signalized intersections. SCREEN‐LINE: An imaginary line or physical feature across which all trips are counted, normally to verify the validity of mathematical traffic models. SIGNAL CYCLE: The time period in seconds required for one complete sequence of signal indications. SIGNAL PHASE: The part of the signal cycle allocated to one or more traffic movements. STARTING DELAY: The delay experienced in initiating the movement of queued traffic from a stop to an average running speed through a signalized intersection. TRAFFIC‐ACTUATED SIGNAL: A type of traffic signal that directs traffic to stop and go in accordance with the demands of traffic, as registered by the actuation of detectors.

TRIP: The movement of a person or vehicle from one location (origin) to another (destination). For example, from home to store to home are two trips, not one. TRIP‐END: One end of a trip at either the origin or destination; i.e. each trip has two trip‐ends. A trip‐end occurs when a person, object, or message is transferred to or from a vehicle. TRIP GENERATION RATE: The quantity of trips produced and/or attracted by a specific land use stated in terms of units such as per dwelling, per acre, and per 1,000 square feet of floor space. TRUCK: A vehicle having dual tires on one or more axles, or having more than two axles. UNBALANCED FLOW: Heavier traffic flow in one direction than the other. On a daily basis, most facilities have balanced flow. During the peak hours, flow is seldom balanced in an urban area. VEHICLE MILES OF TRAVEL: A measure of the amount of usage of a section of highway, obtained by multiplying the average daily traffic by length of facility in miles.

APPENDIX B
Traffic Count Worksheets

DATE: LOCATION: PROJECT #: SC0556Thu, Mar 5, 15 NORTH & SOUTH: LOCATION #: 1
EAST & WEST: CONTROL: STOP N
NOTES: AM ▲PM NMD ◄ W E ►
OTHER SOTHER ▼
NORTHBOUND SOUTHBOUND EASTBOUND WESTBOUND
NL NT NR SL ST SR EL ET ER WL WT WR TOTAL NB SB EB WB TTLLANES: 0 X 0 X X X X 2 0 1 2 X X X X X
8:00 1 0 3 0 0 0 0 151 13 14 148 0 330 0 0 0 0 08:15 AM 0 0 2 0 0 0 0 142 11 4 143 0 302 0 0 0 0 08:30 AM 0 0 1 0 0 0 0 142 20 15 136 0 314 0 0 1 0 18:45 AM 2 0 5 0 0 0 0 155 28 18 141 0 349 0 0 0 0 09:00 AM 3 0 17 0 0 0 0 141 34 22 131 0 348 0 0 0 0 09:15 AM 2 0 21 0 0 0 0 138 48 32 124 0 365 0 0 0 0 09:30 AM 1 0 9 0 0 0 0 126 20 19 133 0 308 0 0 0 1 19:45 AM 0 0 8 0 0 0 0 128 12 12 128 0 288 0 0 0 2 210:00 AM 3 0 13 0 0 0 0 103 15 17 87 0 238 0 0 0 0 010:15 AM 2 0 20 0 0 0 0 95 13 8 99 0 237 0 0 0 0 010:30 AM 3 0 21 0 0 0 0 109 15 2 85 0 235 0 0 0 0 010:45 AM 3 0 16 0 0 0 0 138 29 13 105 0 304 0 0 0 0 011:00 AM 2 0 33 0 0 0 0 143 22 12 102 0 314 0 0 0 1 111:15 AM 6 0 24 0 0 0 0 126 12 3 114 0 285 0 0 0 0 011:30 AM 1 0 14 0 0 0 0 120 7 9 110 0 261 0 0 0 0 011:45 AM 2 0 24 0 0 0 0 97 5 4 121 0 253 0 0 0 2 2
VOLUMES 31 0 231 0 0 0 0 2,054 304 204 1,907 0 4,731 0 0 1 6 7APPROACH % 12% 0% 88% 0% 0% 0% 0% 87% 13% 10% 90% 0%APP/DEPART 262 / 0 0 / 508 2,359 / 2,286 2,117 / 1,944 0BEGIN PEAK HRVOLUMES 7 0 44 0 0 0 0 576 130 87 532 0 1,376APPROACH % 14% 0% 86% 0% 0% 0% 0% 82% 18% 14% 86% 0%PEAK HR FACTOR 0.554 0.000 0.949 0.973 0.942APP/DEPART 51 / 0 0 / 217 706 / 620 619 / 539 0
MID
DA
Y
8:30 AM
TorranceDrivewayManhattan
Driveway Driveway Manhattan Manhattan
INTERSECTION TURNING MOVEMENT COUNTSPREPARED BY: AimTD tel 951 249 3226 [email protected]
U-TURNS

DATE: LOCATION: PROJECT #: SC0556Thu, Mar 5, 15 NORTH & SOUTH: LOCATION #: 3
EAST & WEST: CONTROL: STOP N
NOTES: AM ▲PM NMD ◄ W E ►
OTHER SOTHER ▼
NORTHBOUND SOUTHBOUND EASTBOUND WESTBOUND
NL NT NR SL ST SR EL ET ER WL WT WR TOTAL NB SB EB WB TTLLANES: X X 0 X X X X 2 0 X 2 X X X X X
8:00 0 0 1 0 0 0 0 199 2 0 133 0 335 0 0 0 0 08:15 AM 0 0 0 0 0 0 0 183 3 0 116 0 302 0 0 0 0 08:30 AM 0 0 0 0 0 0 0 131 1 0 151 0 283 0 0 0 0 08:45 AM 0 0 1 0 0 0 0 139 2 0 173 0 315 0 0 0 0 09:00 AM 0 0 0 0 0 0 0 132 6 0 142 0 280 0 0 0 0 09:15 AM 0 0 0 0 0 0 0 153 3 0 136 0 292 0 0 0 0 09:30 AM 0 0 0 0 0 0 0 131 0 0 140 0 271 0 0 0 0 09:45 AM 0 0 0 0 0 0 0 117 6 0 130 0 253 0 0 0 0 010:00 AM 0 0 0 0 0 0 0 92 4 0 113 0 209 0 0 0 0 010:15 AM 0 0 1 0 0 0 0 115 2 0 94 0 212 0 0 0 0 010:30 AM 0 0 0 0 0 0 0 108 0 0 82 0 190 0 0 1 0 110:45 AM 0 0 3 0 0 0 0 140 3 0 102 0 248 0 0 1 0 111:00 AM 0 0 0 0 0 0 0 149 2 0 104 0 255 0 0 0 0 011:15 AM 0 0 1 0 0 0 0 128 2 0 101 0 232 0 0 0 0 011:30 AM 0 0 3 0 0 0 0 119 5 0 113 0 240 0 0 0 0 011:45 AM 0 0 11 0 0 0 0 89 3 0 110 0 213 0 0 0 1 1
VOLUMES 0 0 21 0 0 0 0 2,125 44 0 1,940 0 4,130 0 0 2 1 3APPROACH % 0% 0% 100% 0% 0% 0% 0% 98% 2% 0% 100% 0%APP/DEPART 21 / 0 0 / 44 2,171 / 2,148 1,941 / 1,941 0BEGIN PEAK HRVOLUMES 0 0 2 0 0 0 0 652 8 0 573 0 1,235APPROACH % 0% 0% 100% 0% 0% 0% 0% 99% 1% 0% 100% 0%PEAK HR FACTOR 0.500 0.000 0.821 0.828 0.922APP/DEPART 2 / 0 0 / 8 660 / 654 573 / 573 0
MID
DA
Y
8:00 AM
TorranceDrivewayManhattan
Driveway Driveway Manhattan Manhattan
INTERSECTION TURNING MOVEMENT COUNTSPREPARED BY: AimTD tel 951 249 3226 [email protected]
U-TURNS
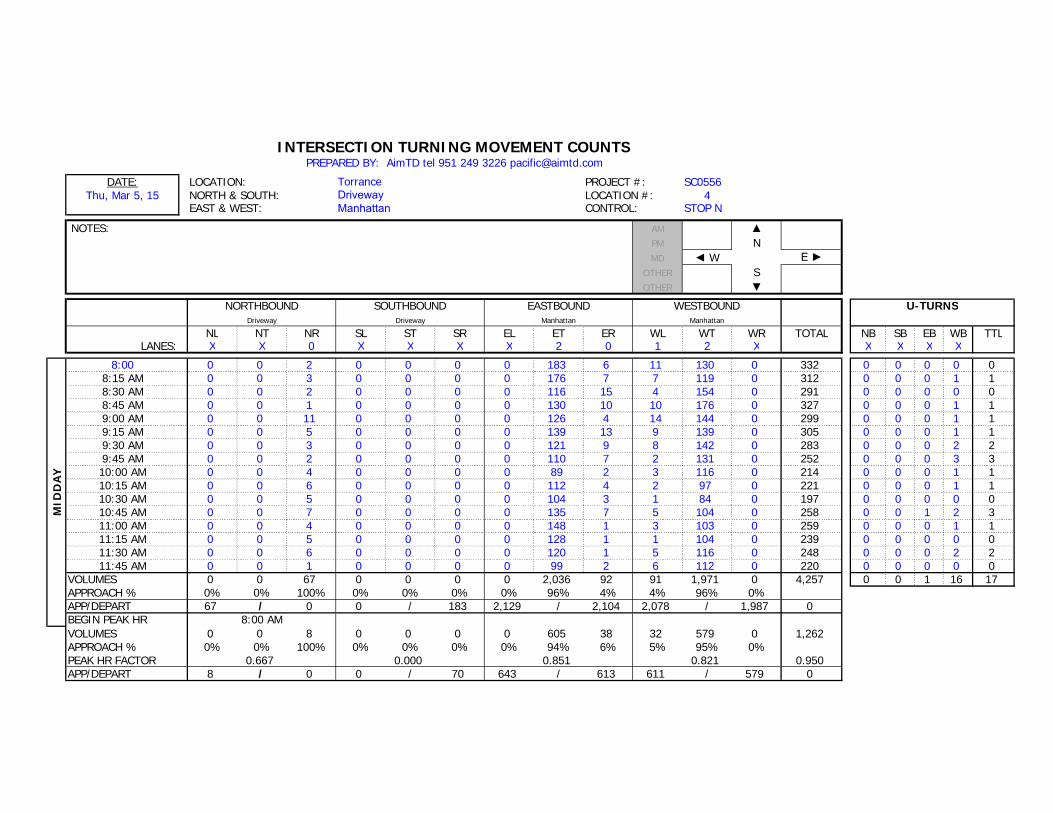
DATE: LOCATION: PROJECT #: SC0556Thu, Mar 5, 15 NORTH & SOUTH: LOCATION #: 4
EAST & WEST: CONTROL: STOP N
NOTES: AM ▲PM NMD ◄ W E ►
OTHER SOTHER ▼
NORTHBOUND SOUTHBOUND EASTBOUND WESTBOUND
NL NT NR SL ST SR EL ET ER WL WT WR TOTAL NB SB EB WB TTLLANES: X X 0 X X X X 2 0 1 2 X X X X X
8:00 0 0 2 0 0 0 0 183 6 11 130 0 332 0 0 0 0 08:15 AM 0 0 3 0 0 0 0 176 7 7 119 0 312 0 0 0 1 18:30 AM 0 0 2 0 0 0 0 116 15 4 154 0 291 0 0 0 0 08:45 AM 0 0 1 0 0 0 0 130 10 10 176 0 327 0 0 0 1 19:00 AM 0 0 11 0 0 0 0 126 4 14 144 0 299 0 0 0 1 19:15 AM 0 0 5 0 0 0 0 139 13 9 139 0 305 0 0 0 1 19:30 AM 0 0 3 0 0 0 0 121 9 8 142 0 283 0 0 0 2 29:45 AM 0 0 2 0 0 0 0 110 7 2 131 0 252 0 0 0 3 310:00 AM 0 0 4 0 0 0 0 89 2 3 116 0 214 0 0 0 1 110:15 AM 0 0 6 0 0 0 0 112 4 2 97 0 221 0 0 0 1 110:30 AM 0 0 5 0 0 0 0 104 3 1 84 0 197 0 0 0 0 010:45 AM 0 0 7 0 0 0 0 135 7 5 104 0 258 0 0 1 2 311:00 AM 0 0 4 0 0 0 0 148 1 3 103 0 259 0 0 0 1 111:15 AM 0 0 5 0 0 0 0 128 1 1 104 0 239 0 0 0 0 011:30 AM 0 0 6 0 0 0 0 120 1 5 116 0 248 0 0 0 2 211:45 AM 0 0 1 0 0 0 0 99 2 6 112 0 220 0 0 0 0 0
VOLUMES 0 0 67 0 0 0 0 2,036 92 91 1,971 0 4,257 0 0 1 16 17APPROACH % 0% 0% 100% 0% 0% 0% 0% 96% 4% 4% 96% 0%APP/DEPART 67 / 0 0 / 183 2,129 / 2,104 2,078 / 1,987 0BEGIN PEAK HRVOLUMES 0 0 8 0 0 0 0 605 38 32 579 0 1,262APPROACH % 0% 0% 100% 0% 0% 0% 0% 94% 6% 5% 95% 0%PEAK HR FACTOR 0.667 0.000 0.851 0.821 0.950APP/DEPART 8 / 0 0 / 70 643 / 613 611 / 579 0
MID
DA
Y
8:00 AM
TorranceDrivewayManhattan
Driveway Driveway Manhattan Manhattan
INTERSECTION TURNING MOVEMENT COUNTSPREPARED BY: AimTD tel 951 249 3226 [email protected]
U-TURNS

DATE: LOCATION: PROJECT #: SC0556Thu, Mar 5, 15 NORTH & SOUTH: LOCATION #: 5
EAST & WEST: CONTROL: SIGNAL
NOTES: AM ▲PM NMD ◄ W E ►
OTHER SOTHER ▼
NORTHBOUND SOUTHBOUND EASTBOUND WESTBOUND
NL NT NR SL ST SR EL ET ER WL WT WR TOTAL NB SB EB WB TTLLANES: 0 1 0 0 1 0 1 2 0 1 2 0 X X X X
8:00 13 1 2 23 6 6 11 139 9 11 144 9 374 0 0 1 1 28:15 AM 10 1 2 18 0 3 12 140 5 8 126 2 327 0 0 0 0 08:30 AM 12 2 3 13 16 2 12 117 2 8 134 4 325 0 0 2 0 28:45 AM 14 0 5 15 4 7 12 122 10 12 151 6 358 0 0 0 0 09:00 AM 12 0 6 16 4 7 9 114 11 10 131 7 327 0 0 1 0 19:15 AM 18 2 8 6 4 9 7 118 10 10 133 10 335 0 0 0 0 09:30 AM 18 2 6 12 2 9 11 116 5 8 110 4 303 0 1 2 3 69:45 AM 9 0 5 7 0 11 2 116 5 2 112 3 272 0 0 1 0 110:00 AM 9 2 4 7 0 6 6 104 5 7 105 4 259 0 0 0 0 010:15 AM 12 1 2 1 0 4 1 119 3 6 88 4 241 0 0 0 0 010:30 AM 7 1 5 1 0 11 5 96 7 6 77 11 227 0 0 1 0 110:45 AM 7 2 1 8 2 8 13 103 5 10 100 3 262 0 0 2 0 211:00 AM 16 6 5 2 4 6 10 135 7 5 97 5 298 0 0 1 1 211:15 AM 15 2 3 7 1 4 11 115 7 5 93 7 270 0 0 0 0 011:30 AM 10 5 4 7 1 15 8 115 5 3 102 5 280 0 0 1 0 111:45 AM 7 1 3 5 1 10 7 96 3 3 100 11 247 0 0 3 0 3
VOLUMES 189 28 64 148 45 118 137 1,865 99 114 1,803 95 4,705 0 1 15 5 21APPROACH % 67% 10% 23% 48% 14% 38% 7% 89% 5% 6% 90% 5%APP/DEPART 281 / 260 312 / 259 2,116 / 2,092 2,017 / 2,115 0BEGIN PEAK HRVOLUMES 49 4 12 69 26 18 47 518 26 39 555 21 1,384APPROACH % 75% 6% 18% 61% 23% 16% 8% 88% 4% 6% 90% 3%PEAK HR FACTOR 0.855 0.807 0.929 0.910 0.925APP/DEPART 65 / 72 113 / 91 591 / 599 615 / 622 0
MID
DA
Y
8:00 AM
TorranceLemoliManhattan
Lemoli Lemoli Manhattan Manhattan
INTERSECTION TURNING MOVEMENT COUNTSPREPARED BY: AimTD tel 951 249 3226 [email protected]
U-TURNS

DATE: LOCATION: PROJECT #: SC0556Thu, Mar 5, 15 NORTH & SOUTH: LOCATION #: 6
EAST & WEST: CONTROL: STOP N
NOTES: AM ▲PM NMD ◄ W E ►
OTHER SOTHER ▼
NORTHBOUND SOUTHBOUND EASTBOUND WESTBOUND
NL NT NR SL ST SR EL ET ER WL WT WR TOTAL NB SB EB WB TTLLANES: X X 0 X X X X 2 0 0 2 X X X X X
8:00 0 0 2 0 0 0 0 161 2 5 159 0 329 0 0 0 1 18:15 AM 0 0 1 0 0 0 0 144 2 0 150 0 297 0 0 0 0 08:30 AM 0 0 0 0 0 0 0 139 0 2 141 0 282 0 0 1 0 18:45 AM 0 0 0 0 0 0 0 142 1 1 159 0 303 0 0 0 0 09:00 AM 0 0 1 0 0 0 0 129 1 1 156 0 288 0 0 0 1 19:15 AM 0 0 3 0 0 0 0 133 1 5 155 0 297 0 0 0 3 39:30 AM 0 0 3 0 0 0 0 117 2 2 150 0 274 0 0 0 1 19:45 AM 0 0 1 0 0 0 0 124 0 1 121 0 247 0 0 0 2 210:00 AM 0 0 1 0 0 0 0 115 0 1 116 0 233 0 0 1 1 210:15 AM 0 0 2 0 0 0 0 100 0 0 98 0 200 0 0 0 0 010:30 AM 0 0 1 0 0 0 0 103 0 2 93 0 199 0 0 0 2 210:45 AM 0 0 1 0 0 0 0 120 2 2 106 0 231 0 0 2 0 211:00 AM 0 0 1 0 0 0 0 142 0 0 87 0 230 0 0 0 2 211:15 AM 0 0 1 0 0 0 0 123 0 3 104 0 231 0 0 0 0 011:30 AM 0 0 0 0 0 0 0 129 0 0 106 0 235 0 0 0 1 111:45 AM 0 0 1 0 0 0 0 114 0 1 107 0 223 0 0 0 0 0
VOLUMES 0 0 19 0 0 0 0 2,035 11 26 2,008 0 4,099 0 0 4 14 18APPROACH % 0% 0% 100% 0% 0% 0% 0% 99% 1% 1% 99% 0%APP/DEPART 19 / 0 0 / 37 2,050 / 2,058 2,048 / 2,022 0BEGIN PEAK HRVOLUMES 0 0 3 0 0 0 0 586 5 8 609 0 1,211APPROACH % 0% 0% 100% 0% 0% 0% 0% 99% 1% 1% 99% 0%PEAK HR FACTOR 0.375 0.000 0.906 0.941 0.920APP/DEPART 3 / 0 0 / 13 591 / 589 617 / 609 0
INTERSECTION TURNING MOVEMENT COUNTSPREPARED BY: AimTD tel 951 249 3226 [email protected]
U-TURNS
MID
DA
Y
8:00 AM
TorranceDrivewayManhattan
Driveway Driveway Manhattan Manhattan

DATE: LOCATION: PROJECT #: SC0556Thu, Mar 5, 15 NORTH & SOUTH: LOCATION #: 7
EAST & WEST: CONTROL: STOP N
NOTES: AM ▲PM NMD ◄ W E ►
OTHER SOTHER ▼
NORTHBOUND SOUTHBOUND EASTBOUND WESTBOUND
NL NT NR SL ST SR EL ET ER WL WT WR TOTAL NB SB EB WB TTLLANES: X X 0 X X X X 2 0 0 2 X X X X X
8:00 0 0 11 0 0 0 0 158 6 1 165 0 341 0 0 0 1 18:15 AM 0 0 3 0 0 0 0 139 5 0 149 0 296 0 0 1 1 28:30 AM 0 0 3 0 0 0 0 130 9 0 152 0 294 0 0 0 0 08:45 AM 0 0 5 0 0 0 0 128 4 0 170 0 307 0 0 0 2 29:00 AM 0 0 7 0 0 0 0 124 7 2 158 0 298 0 0 0 0 09:15 AM 0 0 11 0 0 0 0 126 13 1 163 0 314 0 0 0 0 09:30 AM 0 0 11 0 0 0 0 116 5 0 152 0 284 0 0 0 2 29:45 AM 0 0 3 0 0 0 0 114 13 0 124 0 254 0 0 0 0 010:00 AM 0 0 4 0 0 0 0 114 3 0 118 0 239 0 0 0 0 010:15 AM 0 0 4 0 0 0 0 97 5 2 97 0 205 0 0 0 0 010:30 AM 0 0 2 0 0 0 0 115 1 2 96 0 216 1 0 0 0 110:45 AM 0 0 2 0 0 0 0 115 6 0 106 0 229 0 0 0 0 011:00 AM 0 0 2 0 0 0 0 137 8 2 89 0 238 0 0 0 0 011:15 AM 0 0 5 0 0 0 0 120 4 0 107 0 236 0 0 0 0 011:30 AM 0 0 6 0 0 0 0 127 3 0 107 0 243 0 0 0 0 011:45 AM 0 0 7 0 0 0 0 114 1 2 108 0 232 0 0 0 0 0
VOLUMES 0 0 86 0 0 0 0 1,974 93 12 2,061 0 4,226 1 0 1 6 8APPROACH % 0% 0% 100% 0% 0% 0% 0% 96% 4% 1% 99% 0%APP/DEPART 87 / 1 0 / 105 2,068 / 2,061 2,079 / 2,067 0BEGIN PEAK HRVOLUMES 0 0 22 0 0 0 0 555 24 1 636 0 1,238APPROACH % 0% 0% 100% 0% 0% 0% 0% 96% 4% 0% 100% 0%PEAK HR FACTOR 0.500 0.000 0.883 0.937 0.908APP/DEPART 22 / 0 0 / 25 579 / 577 637 / 636 0
INTERSECTION TURNING MOVEMENT COUNTSPREPARED BY: AimTD tel 951 249 3226 [email protected]
U-TURNS
MID
DA
Y
8:00 AM
TorranceChadronManhattan
Chadron Chadron Manhattan Manhattan
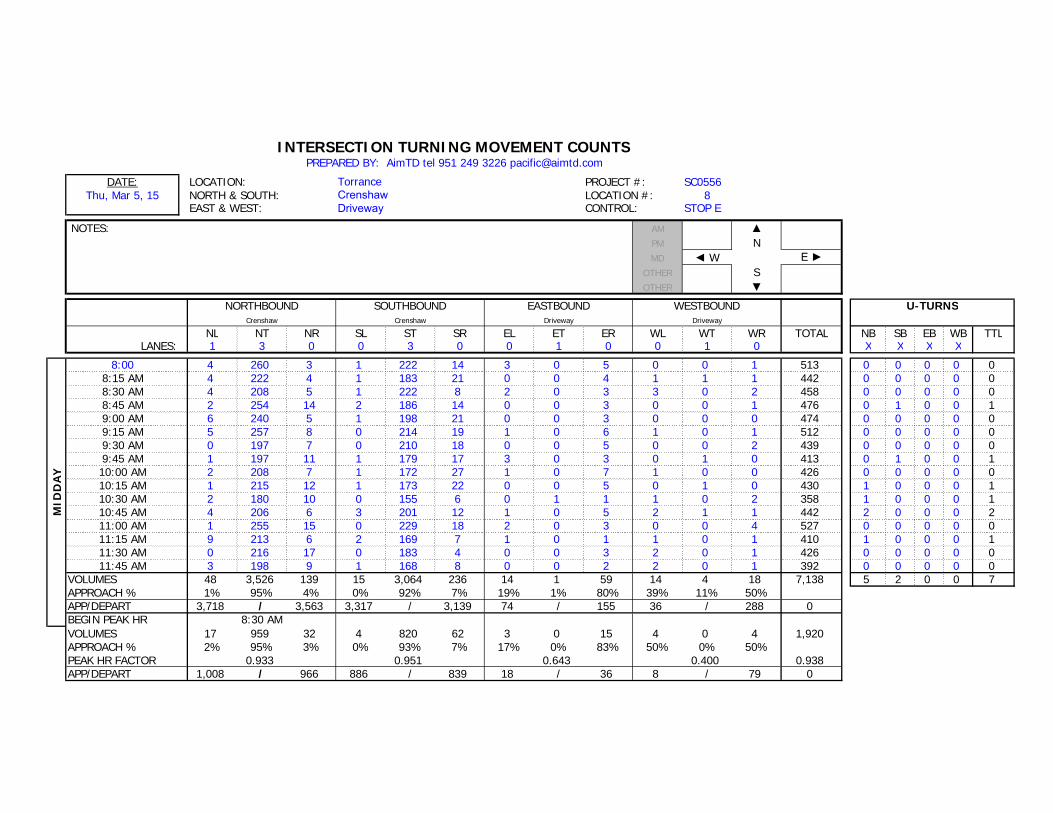
DATE: LOCATION: PROJECT #: SC0556Thu, Mar 5, 15 NORTH & SOUTH: LOCATION #: 8
EAST & WEST: CONTROL: STOP E
NOTES: AM ▲PM NMD ◄ W E ►
OTHER SOTHER ▼
NORTHBOUND SOUTHBOUND EASTBOUND WESTBOUND
NL NT NR SL ST SR EL ET ER WL WT WR TOTAL NB SB EB WB TTLLANES: 1 3 0 0 3 0 0 1 0 0 1 0 X X X X
8:00 4 260 3 1 222 14 3 0 5 0 0 1 513 0 0 0 0 08:15 AM 4 222 4 1 183 21 0 0 4 1 1 1 442 0 0 0 0 08:30 AM 4 208 5 1 222 8 2 0 3 3 0 2 458 0 0 0 0 08:45 AM 2 254 14 2 186 14 0 0 3 0 0 1 476 0 1 0 0 19:00 AM 6 240 5 1 198 21 0 0 3 0 0 0 474 0 0 0 0 09:15 AM 5 257 8 0 214 19 1 0 6 1 0 1 512 0 0 0 0 09:30 AM 0 197 7 0 210 18 0 0 5 0 0 2 439 0 0 0 0 09:45 AM 1 197 11 1 179 17 3 0 3 0 1 0 413 0 1 0 0 110:00 AM 2 208 7 1 172 27 1 0 7 1 0 0 426 0 0 0 0 010:15 AM 1 215 12 1 173 22 0 0 5 0 1 0 430 1 0 0 0 110:30 AM 2 180 10 0 155 6 0 1 1 1 0 2 358 1 0 0 0 110:45 AM 4 206 6 3 201 12 1 0 5 2 1 1 442 2 0 0 0 211:00 AM 1 255 15 0 229 18 2 0 3 0 0 4 527 0 0 0 0 011:15 AM 9 213 6 2 169 7 1 0 1 1 0 1 410 1 0 0 0 111:30 AM 0 216 17 0 183 4 0 0 3 2 0 1 426 0 0 0 0 011:45 AM 3 198 9 1 168 8 0 0 2 2 0 1 392 0 0 0 0 0
VOLUMES 48 3,526 139 15 3,064 236 14 1 59 14 4 18 7,138 5 2 0 0 7APPROACH % 1% 95% 4% 0% 92% 7% 19% 1% 80% 39% 11% 50%APP/DEPART 3,718 / 3,563 3,317 / 3,139 74 / 155 36 / 288 0BEGIN PEAK HRVOLUMES 17 959 32 4 820 62 3 0 15 4 0 4 1,920APPROACH % 2% 95% 3% 0% 93% 7% 17% 0% 83% 50% 0% 50%PEAK HR FACTOR 0.933 0.951 0.643 0.400 0.938APP/DEPART 1,008 / 966 886 / 839 18 / 36 8 / 79 0
MID
DA
Y
8:30 AM
TorranceCrenshawDriveway
Crenshaw Crenshaw Driveway Driveway
INTERSECTION TURNING MOVEMENT COUNTSPREPARED BY: AimTD tel 951 249 3226 [email protected]
U-TURNS

DATE: LOCATION: PROJECT #: SC0556Thu, Mar 5, 15 NORTH & SOUTH: LOCATION #: 9
EAST & WEST: CONTROL: SIGNAL
NOTES: AM ▲PM NMD ◄ W E ►
OTHER SOTHER ▼
NORTHBOUND SOUTHBOUND EASTBOUND WESTBOUND
NL NT NR SL ST SR EL ET ER WL WT WR TOTAL NB SB EB WB TTLLANES: 1 3 0 1 3 0 0 1 0 0 1 0 X X X X
8:00 24 253 1 0 227 1 17 0 9 0 0 0 532 1 0 0 0 18:15 AM 16 203 0 0 190 0 11 0 14 0 0 1 435 0 0 0 0 08:30 AM 13 224 2 1 233 0 11 0 7 0 0 0 491 0 1 0 0 18:45 AM 18 253 0 1 185 1 18 0 8 0 0 0 484 0 2 0 0 29:00 AM 19 220 1 0 186 2 23 0 13 0 0 0 464 1 0 0 0 19:15 AM 33 244 0 0 221 1 33 0 16 0 0 0 548 0 0 0 0 09:30 AM 20 193 0 0 213 2 23 0 15 0 0 0 466 2 0 0 0 29:45 AM 26 192 2 0 179 0 23 0 5 0 1 0 428 1 2 0 0 310:00 AM 22 190 1 1 174 0 24 0 12 0 0 2 426 1 3 0 0 410:15 AM 25 199 1 0 190 0 17 0 14 0 0 0 446 0 1 0 0 110:30 AM 18 182 0 0 170 0 11 0 6 1 0 1 389 0 1 0 0 110:45 AM 18 218 1 0 212 0 16 0 6 0 0 2 473 2 1 0 0 311:00 AM 27 223 1 2 228 2 33 0 9 0 0 1 526 1 4 0 0 511:15 AM 22 203 2 0 169 0 16 0 17 1 0 2 432 2 3 0 0 511:30 AM 13 213 0 1 181 0 9 0 2 0 0 0 419 0 2 0 0 211:45 AM 10 213 1 0 179 0 4 0 2 0 0 0 409 1 3 0 0 4
VOLUMES 324 3,423 13 6 3,137 9 289 0 155 2 1 9 7,368 12 23 0 0 35APPROACH % 9% 91% 0% 0% 100% 0% 65% 0% 35% 17% 8% 75%APP/DEPART 3,772 / 3,733 3,175 / 3,317 444 / 19 12 / 334 0BEGIN PEAK HRVOLUMES 83 941 3 2 825 4 85 0 44 0 0 0 1,987APPROACH % 8% 92% 0% 0% 99% 0% 66% 0% 34% 0% 0% 0%PEAK HR FACTOR 0.927 0.888 0.658 0.000 0.906APP/DEPART 1,027 / 1,026 831 / 869 129 / 5 0 / 87 0
INTERSECTION TURNING MOVEMENT COUNTSPREPARED BY: AimTD tel 951 249 3226 [email protected]
U-TURNS
MID
DA
Y
8:30 AM
TorranceCrenshawDriveway
Crenshaw Crenshaw Driveway Driveway

DATE: LOCATION: PROJECT #: SC0556Thu, Mar 5, 15 NORTH & SOUTH: LOCATION #: 10
EAST & WEST: CONTROL: STOP E
NOTES: AM ▲PM NMD ◄ W E ►
OTHER SOTHER ▼
NORTHBOUND SOUTHBOUND EASTBOUND WESTBOUND
NL NT NR SL ST SR EL ET ER WL WT WR TOTAL NB SB EB WB TTLLANES: X 3 0 X 3 0 X X 0 0 X 0 X X X X
8:00 0 286 1 0 214 9 0 0 23 0 0 1 534 1 0 0 0 18:15 AM 0 239 1 0 190 4 0 0 21 1 0 1 457 0 0 0 0 08:30 AM 0 240 0 0 214 9 0 0 14 0 1 1 479 0 0 0 0 08:45 AM 0 276 0 0 192 7 0 0 17 1 0 1 494 0 0 0 0 09:00 AM 0 254 0 0 191 13 0 0 32 0 0 2 492 0 0 0 0 09:15 AM 0 257 0 0 218 22 0 0 51 0 0 4 552 0 0 0 0 09:30 AM 0 218 0 0 217 15 0 0 27 0 0 3 480 0 0 0 0 09:45 AM 0 212 0 0 180 8 0 0 31 0 0 3 434 0 0 0 0 010:00 AM 0 211 0 0 174 6 0 0 31 0 0 5 427 0 0 0 0 010:15 AM 0 239 1 0 189 6 0 0 29 0 0 2 466 0 0 0 0 010:30 AM 0 193 0 0 172 6 0 0 24 0 0 2 397 1 0 0 0 110:45 AM 0 233 0 0 199 5 0 0 31 1 0 1 470 0 0 0 0 011:00 AM 0 252 0 0 211 13 0 0 59 0 0 2 537 0 0 0 0 011:15 AM 0 235 0 0 182 8 0 0 29 1 0 2 457 0 0 0 0 011:30 AM 0 237 0 0 171 4 0 0 22 0 0 2 436 0 0 0 0 011:45 AM 0 224 0 0 162 4 0 0 15 1 0 0 406 0 0 0 0 0
VOLUMES 0 3,806 3 0 3,076 139 0 0 456 5 1 32 7,518 2 0 0 0 2APPROACH % 0% 100% 0% 0% 96% 4% 0% 0% 100% 13% 3% 84%APP/DEPART 3,811 / 3,840 3,215 / 3,537 456 / 3 38 / 140 0BEGIN PEAK HRVOLUMES 0 1,005 0 0 818 57 0 0 127 1 0 10 2,018APPROACH % 0% 100% 0% 0% 93% 7% 0% 0% 100% 9% 0% 91%PEAK HR FACTOR 0.910 0.911 0.623 0.688 0.914APP/DEPART 1,005 / 1,015 875 / 946 127 / 0 11 / 57 0
INTERSECTION TURNING MOVEMENT COUNTSPREPARED BY: AimTD tel 951 249 3226 [email protected]
U-TURNS
MID
DA
Y
8:45 AM
TorranceCrenshawDriveway
Crenshaw Crenshaw Driveway Driveway

APPENDIX C
Explanation and Calculation of Intersection Capacity Utilization
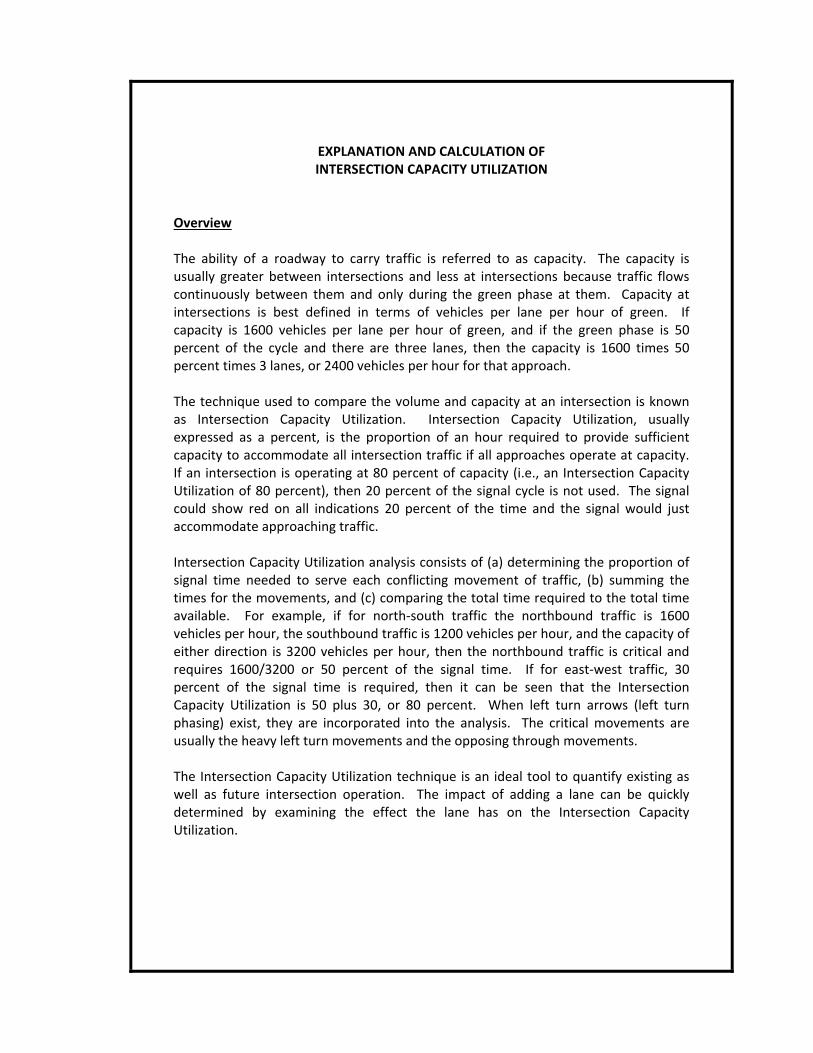
EXPLANATION AND CALCULATION OF INTERSECTION CAPACITY UTILIZATION
Overview The ability of a roadway to carry traffic is referred to as capacity. The capacity is usually greater between intersections and less at intersections because traffic flows continuously between them and only during the green phase at them. Capacity at intersections is best defined in terms of vehicles per lane per hour of green. If capacity is 1600 vehicles per lane per hour of green, and if the green phase is 50 percent of the cycle and there are three lanes, then the capacity is 1600 times 50 percent times 3 lanes, or 2400 vehicles per hour for that approach. The technique used to compare the volume and capacity at an intersection is known as Intersection Capacity Utilization. Intersection Capacity Utilization, usually expressed as a percent, is the proportion of an hour required to provide sufficient capacity to accommodate all intersection traffic if all approaches operate at capacity. If an intersection is operating at 80 percent of capacity (i.e., an Intersection Capacity Utilization of 80 percent), then 20 percent of the signal cycle is not used. The signal could show red on all indications 20 percent of the time and the signal would just accommodate approaching traffic. Intersection Capacity Utilization analysis consists of (a) determining the proportion of signal time needed to serve each conflicting movement of traffic, (b) summing the times for the movements, and (c) comparing the total time required to the total time available. For example, if for north‐south traffic the northbound traffic is 1600 vehicles per hour, the southbound traffic is 1200 vehicles per hour, and the capacity of either direction is 3200 vehicles per hour, then the northbound traffic is critical and requires 1600/3200 or 50 percent of the signal time. If for east‐west traffic, 30 percent of the signal time is required, then it can be seen that the Intersection Capacity Utilization is 50 plus 30, or 80 percent. When left turn arrows (left turn phasing) exist, they are incorporated into the analysis. The critical movements are usually the heavy left turn movements and the opposing through movements. The Intersection Capacity Utilization technique is an ideal tool to quantify existing as well as future intersection operation. The impact of adding a lane can be quickly determined by examining the effect the lane has on the Intersection Capacity Utilization.
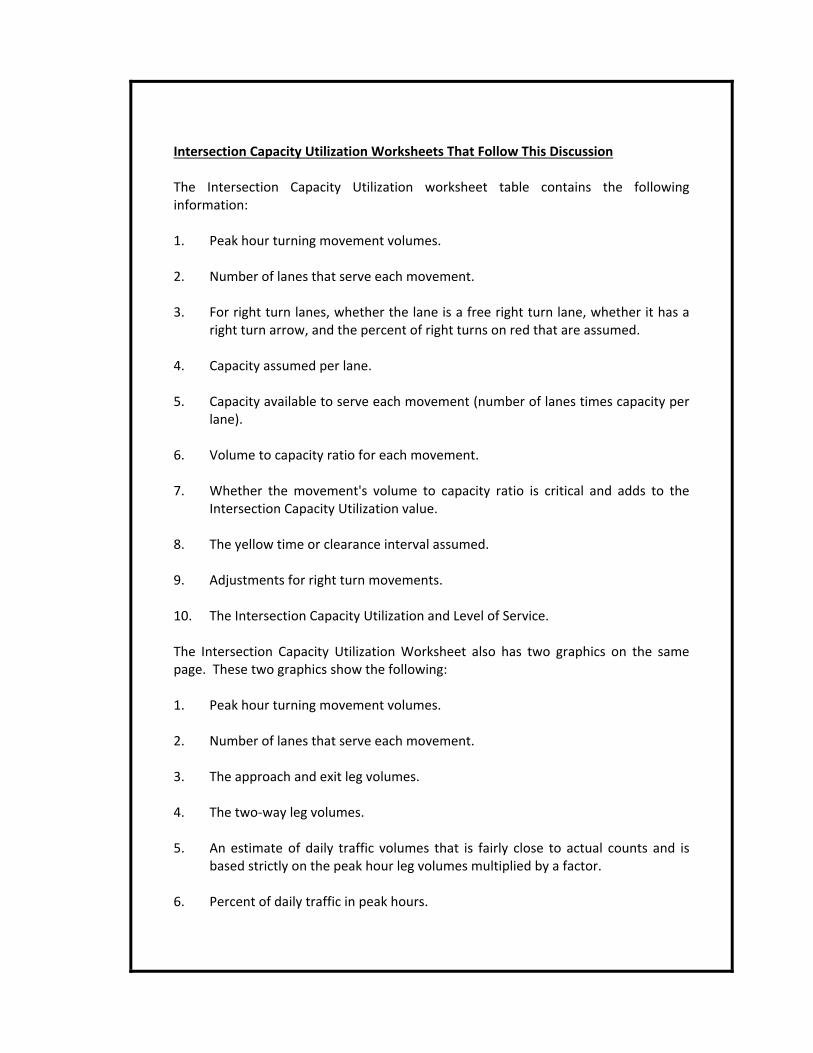
Intersection Capacity Utilization Worksheets That Follow This Discussion The Intersection Capacity Utilization worksheet table contains the following information: 1. Peak hour turning movement volumes. 2. Number of lanes that serve each movement. 3. For right turn lanes, whether the lane is a free right turn lane, whether it has a
right turn arrow, and the percent of right turns on red that are assumed. 4. Capacity assumed per lane. 5. Capacity available to serve each movement (number of lanes times capacity per
lane). 6. Volume to capacity ratio for each movement. 7. Whether the movement's volume to capacity ratio is critical and adds to the
Intersection Capacity Utilization value. 8. The yellow time or clearance interval assumed. 9. Adjustments for right turn movements. 10. The Intersection Capacity Utilization and Level of Service. The Intersection Capacity Utilization Worksheet also has two graphics on the same page. These two graphics show the following: 1. Peak hour turning movement volumes. 2. Number of lanes that serve each movement. 3. The approach and exit leg volumes. 4. The two‐way leg volumes. 5. An estimate of daily traffic volumes that is fairly close to actual counts and is
based strictly on the peak hour leg volumes multiplied by a factor. 6. Percent of daily traffic in peak hours.

7. Percent of peak hour leg volume that is inbound versus outbound. A more detailed discussion of Intersection Capacity Utilization and Level of Service follows. Level of Service Level of Service is used to describe the quality of traffic flow. Levels of Service A to C operate quite well. Level of Service C is typically the standard to which rural roadways are designed. Level of Service D is characterized by fairly restricted traffic flow. Level of Service D is the standard to which urban roadways are typically designed. Level of Service E is the maximum volume a facility can accommodate and will result in possible stoppages of momentary duration. Level of Service F occurs when a facility is overloaded and is characterized by stop‐and‐go traffic with stoppages of long duration. A description of the various Levels of Service appears at the end of the ICU description, along with the relationship between Intersection Capacity Utilization and Level of Service. Signalized and Unsignalized Intersections Although calculating an Intersection Capacity Utilization value for an unsignalized intersection is invalid, the presumption is that a signal can be installed and the calculation shows whether the geometrics are capable of accommodating the expected volumes with a signal. A traffic signal becomes warranted before Level of Service D is reached for a signalized intersection. Signal Timing The Intersection Capacity Utilization calculation assumes that a signal is properly timed. It is possible to have an Intersection Capacity Utilization well below 100 percent, yet have severe traffic congestion. This would occur if one or more movements is not getting sufficient green time to satisfy its demand, and excess green time exists on other movements. This is an operational problem that should be remedied. Lane Capacity Capacity is often defined in terms of roadway width; however, standard lanes have approximately the same capacity whether they are 11 or 14 feet wide. Our data indicates a typical lane, whether a through lane or a left turn lane, has a capacity of

approximately 1750 vehicles per hour of green time, with nearly all locations showing a capacity greater than 1600 vehicles per hour of green per lane. Right turn lanes have a slightly lower capacity; however 1600 vehicles per hour is a valid capacity assumption for right turn lanes. This finding is published in the August, 1978 issue of Institute of Transportation Engineers Journal in the article entitled, "Another Look at Signalized Intersection Capacity" by William Kunzman. A capacity of 1600 vehicles per hour per lane with no yellow time penalty, or 1700 vehicles per hour with a 3 or 5 percent yellow time penalty is reasonable. Yellow Time The yellow time can either be assumed to be completely used and no penalty applied, or it can be assumed to be only partially usable. Total yellow time accounts for approximately 10 percent of a signal cycle, and a penalty of 3 to 5 percent is reasonable. During peak hour traffic operation the yellow times are nearly completely used. If there is no left turn phasing, the left turn vehicles completely use the yellow time. Even if there is left turn phasing, the through traffic continues to enter the intersection on the yellow until just a split second before the red. Shared Lanes Shared lanes occur in many locations. A shared lane is often found at the end of an off ramp where the ramp forms an intersection with the cross street. Often at a diamond interchange off ramp, there are three lanes. In the case of a diamond interchange, the middle lane is sometimes shared, and the driver can turn left, go through, or turn right from that lane. If one assumes a three lane off ramp as described above, and if one assumes that each lane has 1600 capacity, and if one assumes that there are 1000 left turns per hour, 500 right turns per hour, and 100 through vehicles per hour, then how should one assume that the three lanes operate. There are three ways that it is done. One way is to just assume that all 1600 vehicles (1000 plus 500 plus 100) are served simultaneously by three lanes. When this is done, the capacity is 3 times 1600 or 4800, and the amount of green time needed to serve the ramp is 1600 vehicles divided by 4800 capacity or 33.3 percent. This assumption effectively assumes perfect lane distribution between the three lanes that is not realistic. It also means a left turn can be made from the right lane.
Another way is to equally split the capacity of a shared lane and in this case to assume there are 1.33 left turn lanes, 1.33 right turn lanes, and 0.33 through lanes. With this assumption, the critical movement is the left turns and the 1000 left turns are served by a capacity of 1.33 times 1600, or 2133. The volume to capacity ratio of the critical move is 1000 divided by 2133 or 46.9 percent. The first method results in a critical move of 33.3 percent and the second method results in a critical move of 46.9 percent. Neither is very accurate, and the difference in the calculated Level of Service will be approximately 1.5 Levels of Service (one Level of Service is 10 percent). The way Kunzman Associates, Inc. does it is to assign fractional lanes in a reasonable way. In this example, it would be assumed that there is 1.1 right turn lanes, 0.2 through lanes, and 1.7 left turn lanes. The volume to capacity ratios for each movement would be 31.3 percent for the through traffic, 28.4 percent for the right turn movement, and 36.8 percent for the left turn movement. The critical movement would be the 36.8 percent for the left turns. Right Turn on Red The Kunzman Associates, Inc. software treats right turn lanes in one of five different ways. Each right turn lane is classified into one of five cases. The five cases are (1) free right turn lane, (2) right turn lane with separate right turn arrow, (3) standard right turn lane with no right turns on red allowed, (4) standard right turn lane with a certain percentage of right turns on red allowed, and (5) separate right turn arrow and a certain percentage of right turns on red allowed. Free Right Turn Lane If it is a free right turn lane, then it is given a capacity of one full lane with continuous or 100 percent green time. A Free right turn lane occurs when there is a separate approach lane for right turning vehicles, there is a separate departure lane for the right turning vehicles after they turn and are exiting the intersection, and the through cross street traffic does not interfere with the vehicles after they turn right. Separate Right Turn Arrow If there is a separate right turn arrow, then it is assumed that vehicles are given a green indication and can proceed on what is known as the left turn overlap. The left turn overlap for a northbound right turn is the westbound left turn. When the left turn overlap has a green indication, the right turn lane is also given a green arrow

indication. Thus, if there is a northbound right turn arrow, then it can be turned green for the period of time that the westbound left turns are proceeding. If there are more right turns than can be accommodated during the northbound through green and the time that the northbound right turn arrow is on, then an adjustment is made to the Intersection Capacity Utilization to account for the green time that needs to be added to the northbound through green to accommodate the northbound right turns. Standard Right Turn Lane, No Right Turns on Red A standard right turn lane, with no right turn on red assumed, proceeds only when there is a green indication displayed for the adjacent through movement. If additional green time is needed above that amount of time, then in the Intersection Capacity Utilization calculation a right turn adjustment green time is added above the green time that is needed to serve the adjacent through movement. Standard Right Turn Lane, With Right Turns on Red A standard right turn lane with say 20 percent of the right turns allowed to turn right on a red indication is calculated the same as the standard right turn case where there is no right turn on red allowed, except that the right turn adjustment is reduced to account for the 20 percent of the right turning vehicles that can logically turn right on a red light. The right turns on red are never allowed to exceed the time the overlap left turns take plus the unused part of the green cycle that the cross street traffic moving from left to right has. As an example of how 20 percent of the cars are allowed to turn right on a red indication, assume that the northbound right turn volume needs 40 percent of the signal cycle to be satisfied. To allow 20 percent of the northbound right turns to turn right on red, then during 8 percent of the signal cycle (40 percent of signal cycle times 20 percent that can turn right on red) right turns on red will be allowed if it is feasible. For this example, assume that 15 percent of the signal cycle is green for the northbound through traffic, and that means that 15 percent of the signal cycle is available to satisfy northbound right turns. After the northbound through traffic has received its green, 25 percent of the signal cycle is still needed to satisfy the northbound right turns (40 percent of the signal cycle minus the 15 percent of the signal cycle that the northbound through used). Assume that the westbound left turns require a green time of 6 percent of the signal cycle. This 6 percent of the signal cycle is used by northbound right turns on red. After accounting for the northbound right turns that occur on the westbound overlap
left turn, 19 percent of the signal cycle is still needed for the northbound right turns (25 percent of the cycle was needed after the northbound through green time was accounted for [see above paragraph], and 6 percent was served during the westbound left turn overlap). Also, at this point 6 percent of the signal cycle has been used for northbound right turns on red, and still 2 percent more of the right turns will be allowed to occur on the red if there is unused eastbound through green time. For purpose of this example, assume that the westbound through green is critical, and that 15 percent of the signal cycle is unused by eastbound through traffic. Thus, 2 percent more of the signal cycle can be used by the northbound right turns on red since there is 15 seconds of unused green time being given to the eastbound through traffic. At this point, 8 percent of the signal cycle was available to serve northbound right turning vehicles on red, and 15 percent of the signal cycle was available to serve right turning vehicles on the northbound through green. So 23 percent of the signal cycle has been available for northbound right turns. Because 40 percent of the signal cycle is needed to serve northbound right turns, there is still a need for 17 percent more of the signal cycle to be available for northbound right turns. What this means is the northbound through traffic green time is increased by 17 percent of the cycle length to serve the unserved right turn volume, and a 17 percent adjustment is added to the Intersection Capacity Utilization to account for the northbound right turns that were not served on the northbound through green time or when right turns on red were assumed. Separate Right Turn Arrow, With Right Turns on Red A right turn lane with a separate right turn arrow, plus a certain percentage of right turns allowed on red is calculated the same way as a standard right turn lane with a certain percentage of right turns allowed on red, except the turns which occur on the right turn arrow are not counted as part of the percentage of right turns that occur on red. Critical Lane Method Intersection Capacity Utilization parallels another calculation procedure known as the Critical Lane Method with one exception. Critical Lane Method dimensions capacity in terms of standardized vehicles per hour per lane. A Critical Lane Method result of 800 vehicles per hour means that the intersection operates as though 800 vehicles were using a single lane continuously. If one assumes a lane capacity of 1600 vehicles per hour, then a Critical Lane Method calculation resulting in 800 vehicles per hour is the same as an Intersection Capacity Utilization calculation of 50 percent since 800/1600

is 50 percent. It is our opinion that the Critical Lane Method is inferior to the Intersection Capacity Utilization method simply because a statement such as "The Critical Lane Method value is 800 vehicles per hour" means little to most persons, whereas a statement such as "The Intersection Capacity Utilization is 50 percent" communicates clearly. Critical Lane Method results directly correspond to Intersection Capacity Utilization results. The correspondence is as follows, assuming a lane capacity of 1600 vehicles per hour and no clearance interval.
Critical Lane Method Result Intersection Capacity Utilization Result
800 vehicles per hour 50 percent 960 vehicles per hour 60 percent 1120 vehicles per hour 70 percent 1280 vehicles per hour 80 percent 1440 vehicles per hour 90 percent 1600 vehicles per hour 100 percent 1760 vehicles per hour 110 percent

INTERSECTION CAPACITY UTILIZATION
LEVEL OF SERVICE DESCRIPTION1
Level of
Service
Description
Volume to
Capacity Ratio
A
B
C
D
E
F
Level of Service A occurs when progression is extremely favorable and vehicles arrive during the green phase. Most vehicles do not stop at all. Short cycle lengths may also contribute to low delay. Level of Service B generally occurs with good progression and/or short cycle lengths. More vehicles stop than for Level of Service A, causing higher levels of average delay. Level of Service C generally results when there is fair progression and/or longer cycle lengths. Individual cycle failures may begin to appear in this level. The number of vehicles stopping is significant at this level, although many still pass through the intersection without stopping. Level of Service D generally results in noticeable congestion. Longer delays may result from some combination of unfavorable progression, long cycle lengths, or high volume to capacity ratios. Many vehicles stop, and the proportion of vehicles not stopping declines. Individual cycle failures are noticeable. Level of Service E is considered to be the limit of acceptable delay. These high delay values generally indicate poor progression, long cycle lengths, and high volume to capacity ratios. Individual cycle failures are frequent. Level of Service F is considered to be unacceptable to most drivers. This condition often occurs when oversaturation, i.e., when arrival flow rates exceed the capacity of the intersection. It may also occur at high volume to capacity ratios below 1.00 with many individual cycle failures. Poor progression and long cycle lengths may also be major contributing causes to such delay levels.
0.600 and below
0.601 to 0.700
0.701 to 0.800
0.801 to 0.900
0.901 to 1.000
1.001 and up
1Source: Highway Capacity Manual Special Report 209, Transportation Research Board, National Research Council Washington D.C., 2000.

Existing
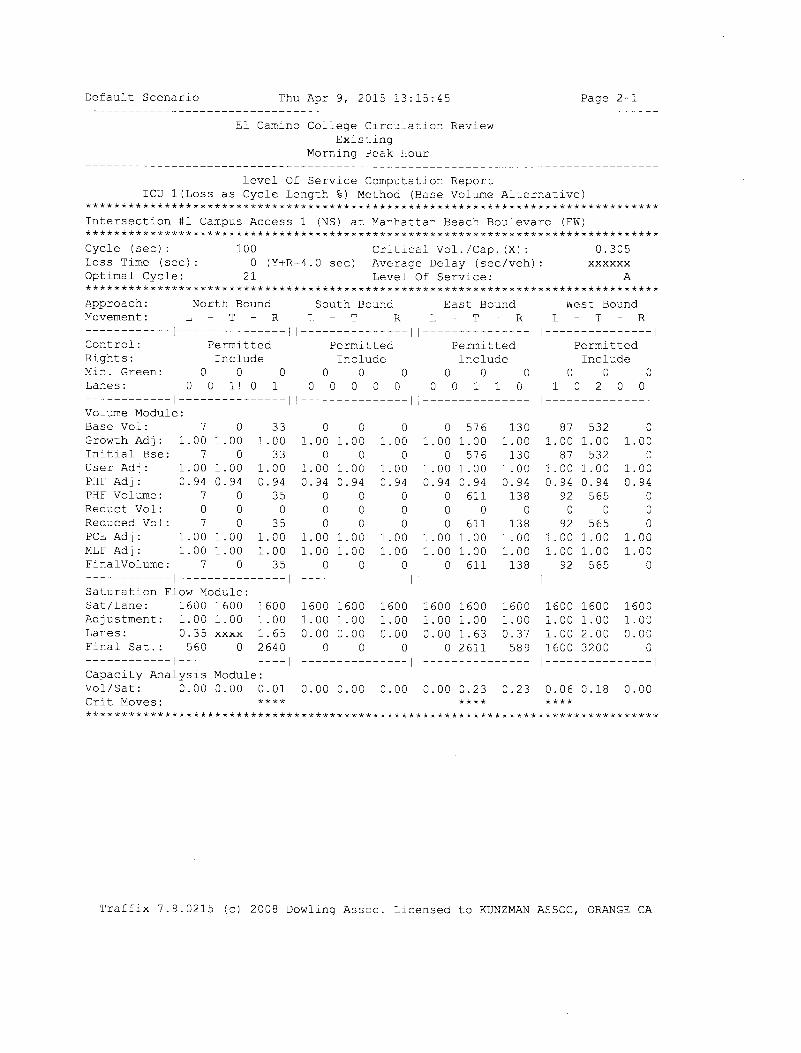


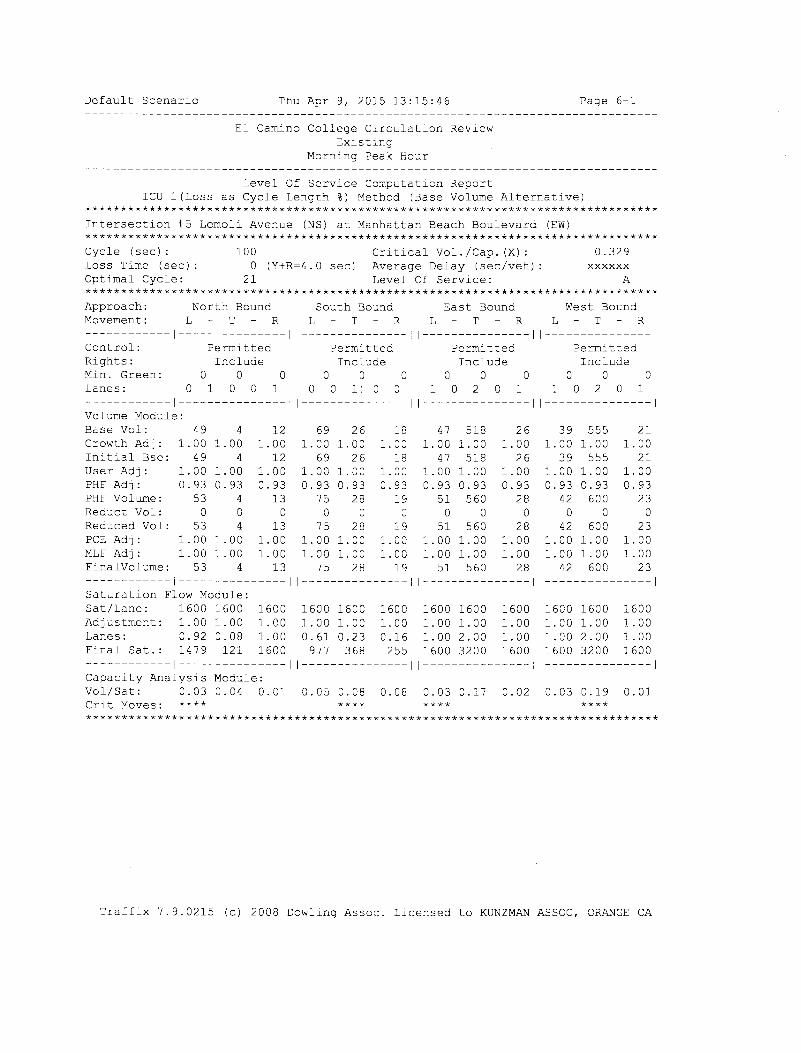
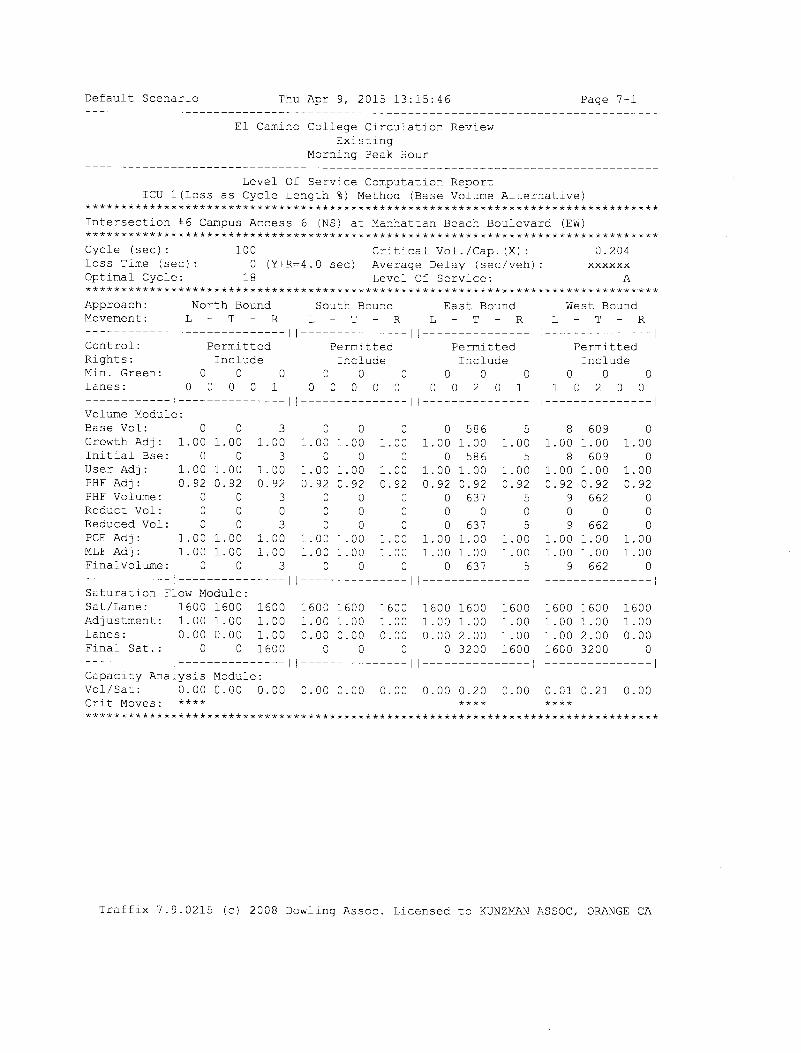
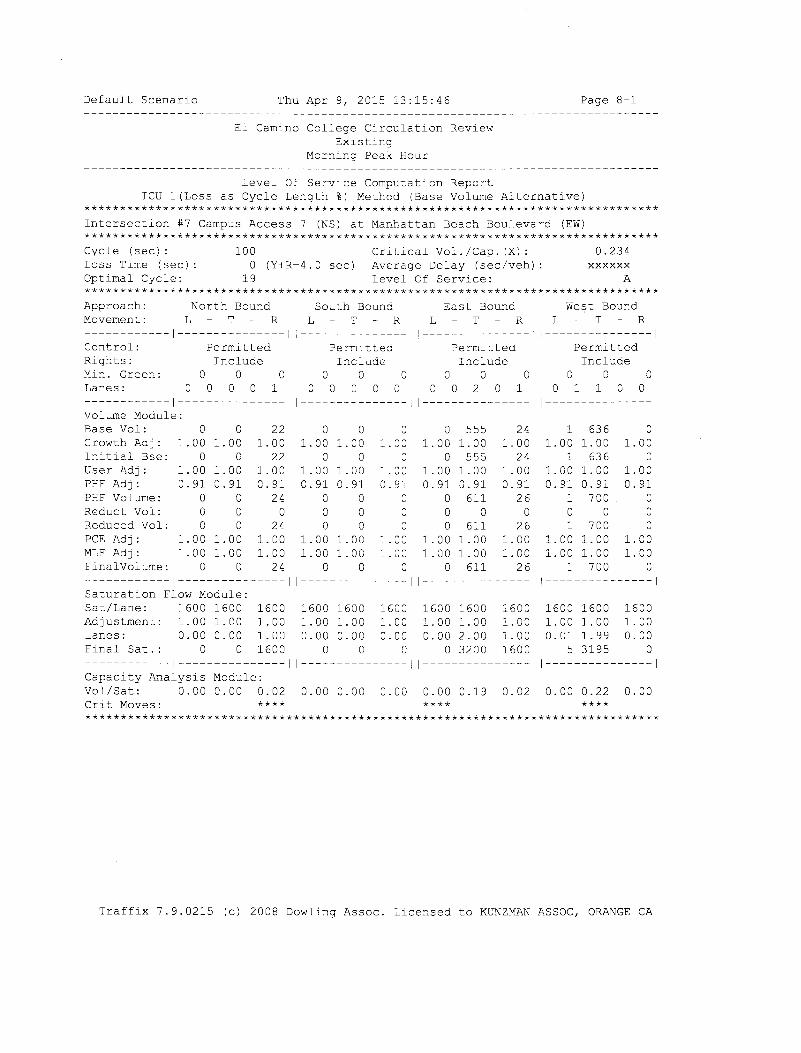


Existing Plus Project


1111 Town & Country Road, Suite 34 Orange, California 92868
(714) 973-8383
www.traffic-engineer.com