EKG Pearls for Your Practice - Tucson Osteopathic … · Notes EKG Pearls for Your Practice...
43
Notes EKG Pearls for Your Practice Fredrick M. Abrahamian, DO, FACEP, FIDSA EKG Pearls for Your Practice Fredrick M. Abrahamian, D.O., FACEP, FIDSA Professor of Medicine, UCLA School of Medicine, Los Angeles, California Director of Education, Department of Emergency Medicine Olive View-UCLA Medical Center, Sylmar, California Differential Diagnosis of ST-Segment Elevation Hyperkalemia Acute pericarditis Ventricular aneurysm Acute myocardial infarction Prinzmetal’s angina Left ventricular hypertrophy Left bundle branch block Brugada syndrome Pulmonary embolism Cardioversion Normal (male-pattern) Early repolarization ST elevation of normal variant Suggested articles: Abrahamian FM. ACS mimics: Non-AMI causes of ST-segment elevation. In: Matt A, Tabas JA, Barish RA, (eds). Electrocardiography in Emergency Medicine. ACEP; 2007:119-131. Wang K, Asinger RW, Marriott HJ. ST-segment elevation in conditions other than acute myocardial infarction. N Engl J Med. 2003;349:2128-2135. Hyperkalemia Tall, narrow-based, and pointed T-waves Earliest sign Symmetrical and peaked T-waves (especially precordial leads) “Tenting” or “peaking” with narrow base (amplitude of T-waves: > 6 mm in limb leads or > 10 mm in precordial leads) QT-interval shortening Prolongation of PR-interval Flattening (low amplitude) or absence of P-wave Widening of QRS complex May also see ST-segment elevation (often downsloping) or depression Sine-wave Altered cardiac conduction (can cause any type of a block) Relationship between serum K + and EKG changes vary among different patients Not a reliable test for mild (5.5-6.5) hyperkalemia EKG changes typically start around K + of 6.8 Suggested article: Mattu A, Brady WJ, Robinson DA. Electrocardiographic manifestations of hyperkalemia. Am J Emerg Med. 2000;18:721-729.
Transcript of EKG Pearls for Your Practice - Tucson Osteopathic … · Notes EKG Pearls for Your Practice...

NotesEKG Pearls for Your PracticeFredrick M. Abrahamian, DO, FACEP, FIDSA
EKG Pearls for Your Practice
Fredrick M. Abrahamian, D.O., FACEP, FIDSAProfessor of Medicine, UCLA School of Medicine, Los Angeles, CaliforniaDirector of Education, Department of Emergency MedicineOlive View-UCLA Medical Center, Sylmar, California
Differential Diagnosis of ST-Segment Elevation
Hyperkalemia Acute pericarditis Ventricular aneurysm Acute myocardial infarction Prinzmetal’s angina Left ventricular hypertrophy Left bundle branch block Brugada syndrome Pulmonary embolism Cardioversion Normal (male-pattern) Early repolarization ST elevation of normal variant
Suggested articles: Abrahamian FM. ACS mimics: Non-AMI causes of ST-segmentelevation. In: Matt A, Tabas JA, Barish RA, (eds).Electrocardiography in Emergency Medicine. ACEP; 2007:119-131.
Wang K, Asinger RW, Marriott HJ.ST-segment elevation in conditions other than acute myocardialinfarction. N Engl J Med. 2003;349:2128-2135.
Hyperkalemia
Tall, narrow-based, and pointed T-waves Earliest sign Symmetrical and peaked T-waves (especially precordial leads) “Tenting” or “peaking” with narrow base
(amplitude of T-waves: > 6 mm in limb leads or > 10 mm in precordial leads) QT-interval shortening Prolongation of PR-interval Flattening (low amplitude) or absence of P-wave Widening of QRS complex May also see ST-segment elevation (often downsloping) or depression Sine-wave Altered cardiac conduction (can cause any type of a block) Relationship between serum K
+and EKG changes vary among different patients
Not a reliable test for mild (5.5-6.5) hyperkalemia EKG changes typically start around K
+of 6.8
Suggested article: Mattu A, Brady WJ, Robinson DA.Electrocardiographic manifestations of hyperkalemia.Am J Emerg Med. 2000;18:721-729.

NotesEKG Pearls for Your PracticeFredrick M. Abrahamian, DO, FACEP, FIDSA
DDx of Conditions that Can Cause Peaked T-wave:
Hyperkalemia Early acute MI
T-waves are broad rather than narrow and pointed and often associated withlong QT-interval
Note: Intracranial hemorrhage can be associated with deep inverted T waves Other associated findings are prolonged QT-interval, prominent U-wave Commonly seen in precordial leads
T-wave
Normal T-wave has an initial slow phase followed by a fast phase When you divide the T-wave in half, the area under the curve is not symmetrical T-wave usually is ≥ 10% the height of the R-wave Always inverted in aVR Always upright in leads I, II, and V4-V6 Usually same direction as QRS complex except in right precordial leads (V1,V2)
U-wave
Normal U-wave has an initial fast phase followed by a slow phase (opposite to T-wave) Upright in all leads except in aVR Follows T-wave axis Usually < 1.5 mm and is 5-25% height of the T-wave Largest and best seen in leads V2 and V3 Prominent U-wave: Amplitude > 1.5 mm DDx of prominent U-wave: Hypokalemia, hypothermia, bradyarrhythmias,
intracranial hemorrhage
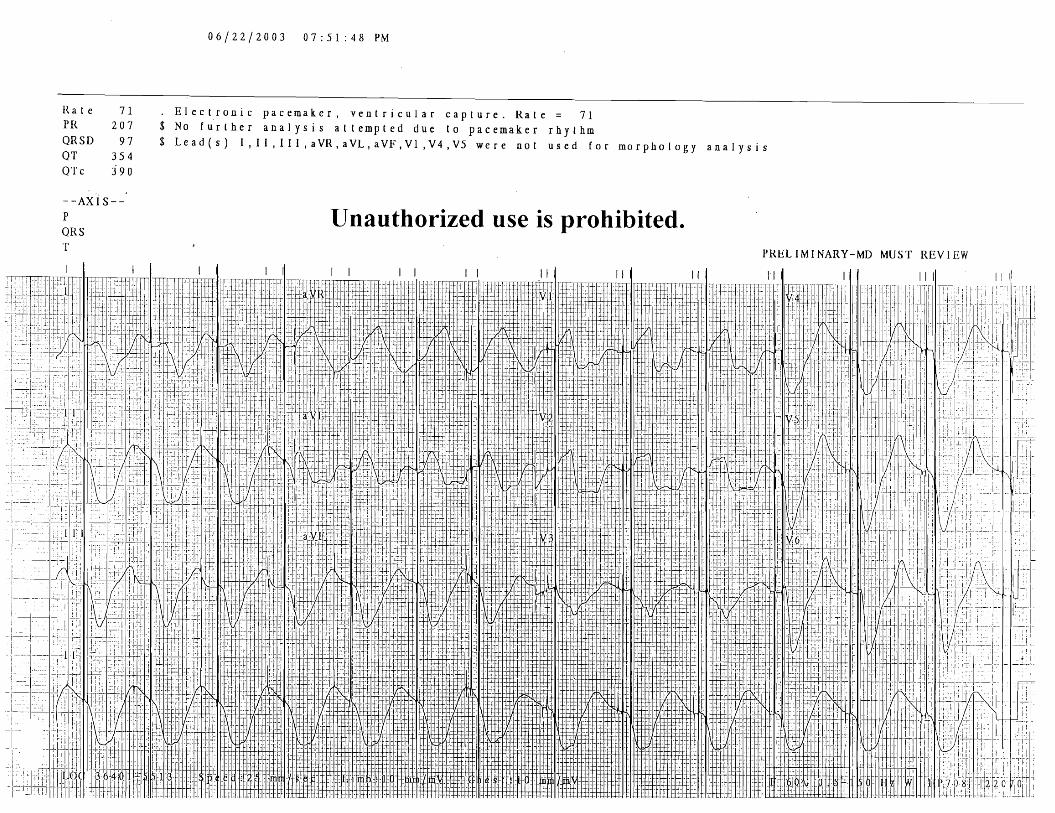
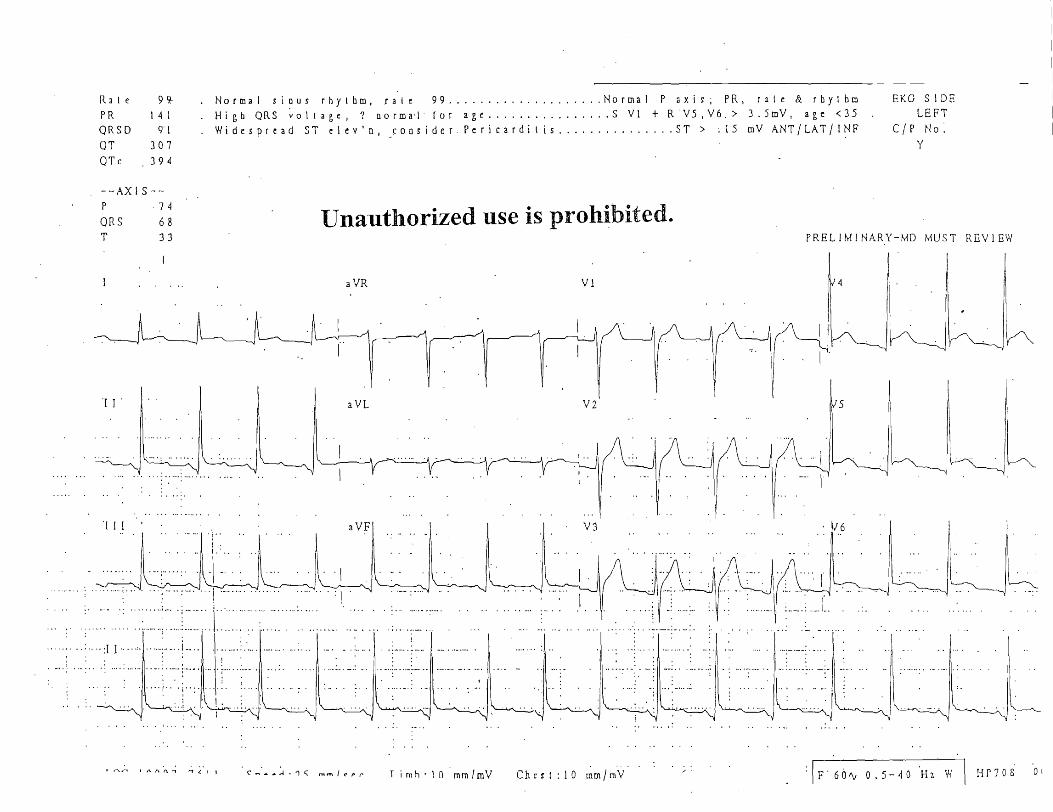
Pericarditis
Stages:
Stage 1: PR-segment depressionBest seen in lead IPrecedes ST-segment elevation
Widespread ST-segment elevation (seldom exceeds 5 mm)Concave upwardNo reciprocal depression
Reverse findings in lead aVR: PR-segment elevation and ST-segmentdepression
Stage 2: PR-segment and ST-segment returns to baselineT-wave amplitude begins to decrease
Stage 3: Inverted T-waves
Stage 4: Normal EKG
NotesEKG Pearls for Your PracticeFredrick M. Abrahamian, DO, FACEP, FIDSA
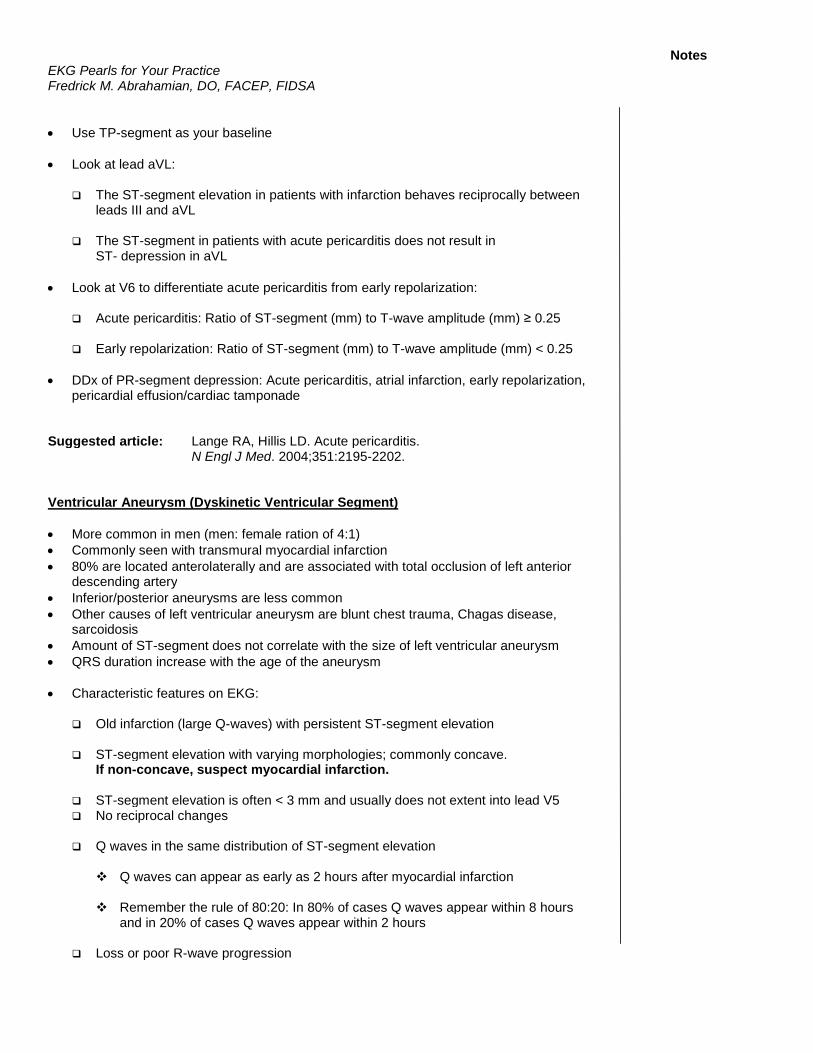
Use TP-segment as your baseline
Look at lead aVL:
The ST-segment elevation in patients with infarction behaves reciprocally betweenleads III and aVL
The ST-segment in patients with acute pericarditis does not result inST- depression in aVL
Look at V6 to differentiate acute pericarditis from early repolarization:
Acute pericarditis: Ratio of ST-segment (mm) to T-wave amplitude (mm) ≥ 0.25
Early repolarization: Ratio of ST-segment (mm) to T-wave amplitude (mm) < 0.25
DDx of PR-segment depression: Acute pericarditis, atrial infarction, early repolarization,pericardial effusion/cardiac tamponade
Suggested article: Lange RA, Hillis LD. Acute pericarditis.N Engl J Med. 2004;351:2195-2202.
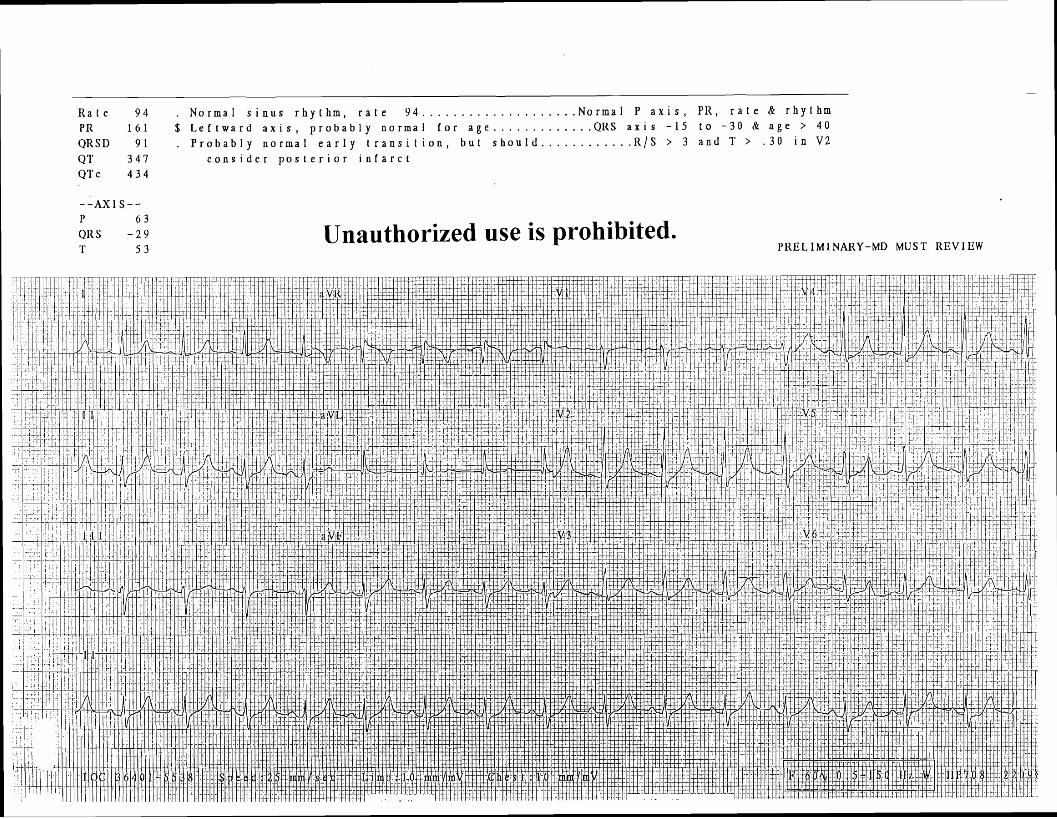
Ventricular Aneurysm (Dyskinetic Ventricular Segment)
More common in men (men: female ration of 4:1) Commonly seen with transmural myocardial infarction 80% are located anterolaterally and are associated with total occlusion of left anterior
descending artery Inferior/posterior aneurysms are less common Other causes of left ventricular aneurysm are blunt chest trauma, Chagas disease,
sarcoidosis Amount of ST-segment does not correlate with the size of left ventricular aneurysm QRS duration increase with the age of the aneurysm
Characteristic features on EKG:
Old infarction (large Q-waves) with persistent ST-segment elevation
ST-segment elevation with varying morphologies; commonly concave.If non-concave, suspect myocardial infarction.
ST-segment elevation is often < 3 mm and usually does not extent into lead V5 No reciprocal changes
Q waves in the same distribution of ST-segment elevation
Q waves can appear as early as 2 hours after myocardial infarction
Remember the rule of 80:20: In 80% of cases Q waves appear within 8 hoursand in 20% of cases Q waves appear within 2 hours
Loss or poor R-wave progression
NotesEKG Pearls for Your PracticeFredrick M. Abrahamian, DO, FACEP, FIDSA
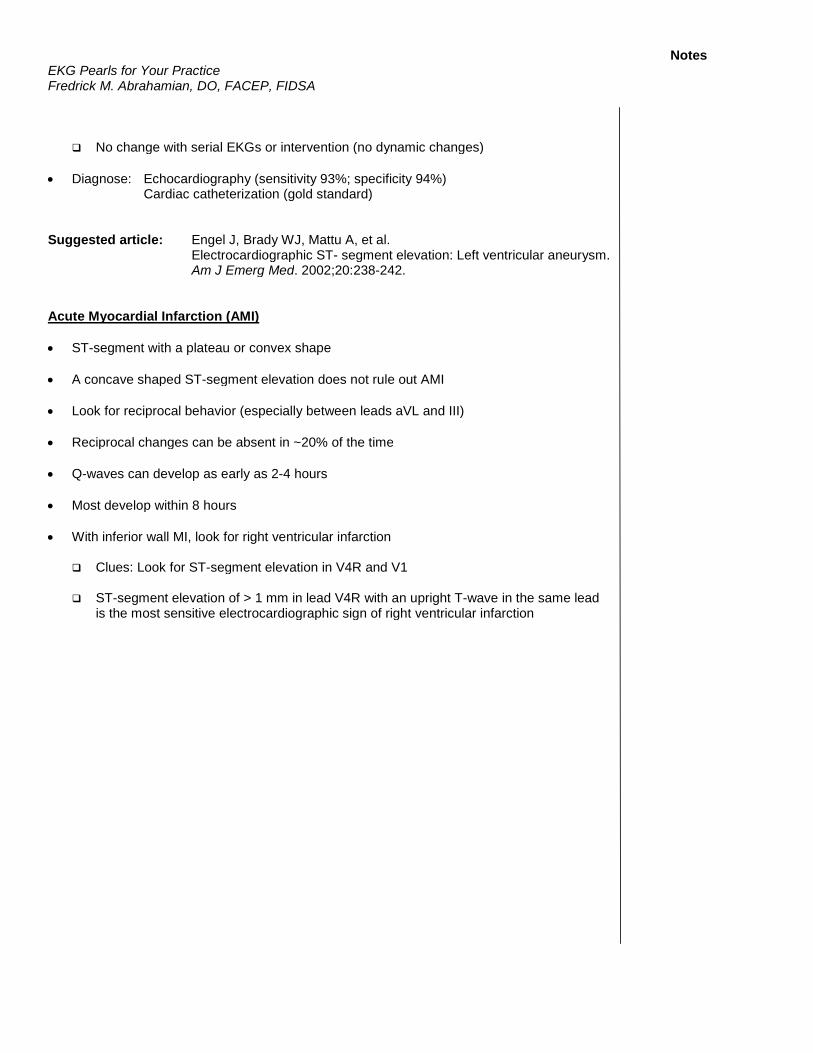
No change with serial EKGs or intervention (no dynamic changes)
Diagnose: Echocardiography (sensitivity 93%; specificity 94%)Cardiac catheterization (gold standard)
Suggested article: Engel J, Brady WJ, Mattu A, et al.Electrocardiographic ST- segment elevation: Left ventricular aneurysm.Am J Emerg Med. 2002;20:238-242.
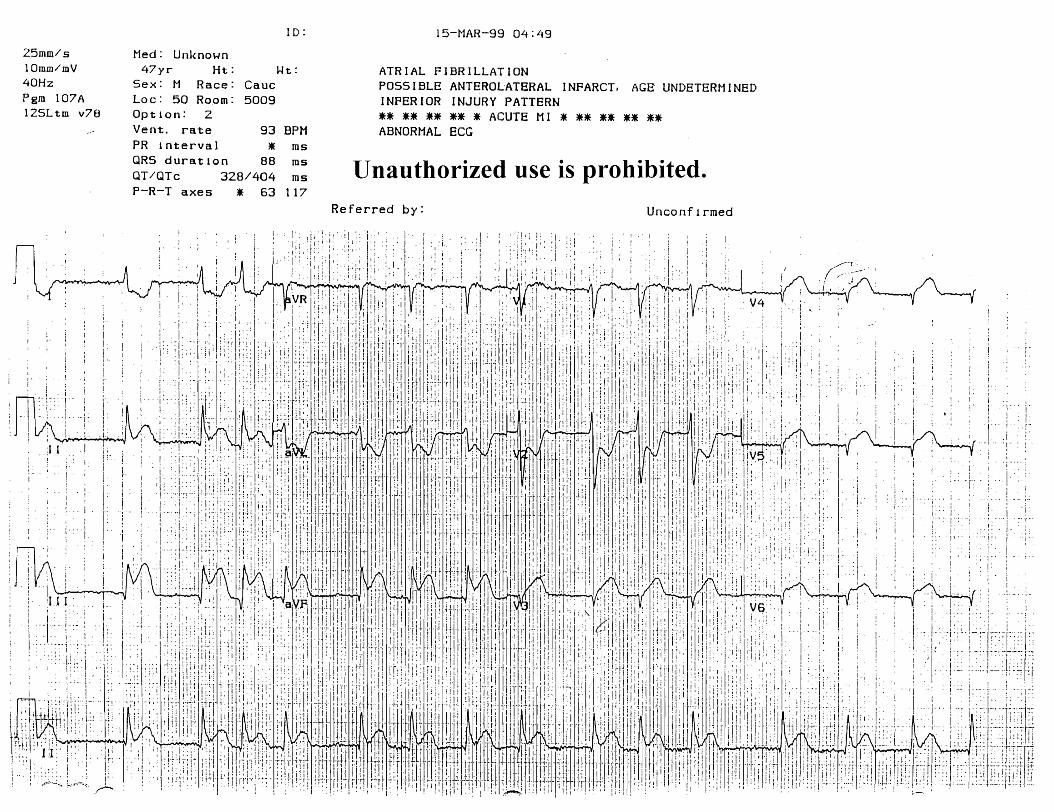
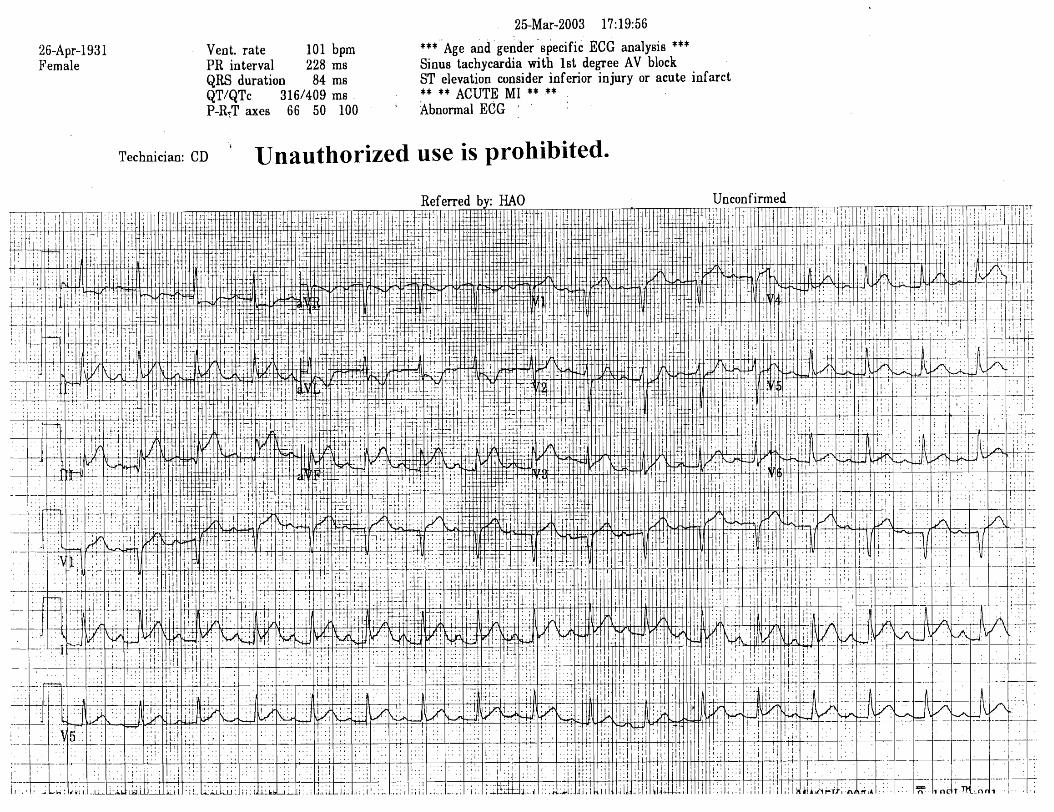
Acute Myocardial Infarction (AMI)
ST-segment with a plateau or convex shape
A concave shaped ST-segment elevation does not rule out AMI
Look for reciprocal behavior (especially between leads aVL and III)
Reciprocal changes can be absent in ~20% of the time
Q-waves can develop as early as 2-4 hours
Most develop within 8 hours
With inferior wall MI, look for right ventricular infarction
Clues: Look for ST-segment elevation in V4R and V1
ST-segment elevation of > 1 mm in lead V4R with an upright T-wave in the same leadis the most sensitive electrocardiographic sign of right ventricular infarction
NotesEKG Pearls for Your PracticeFredrick M. Abrahamian, DO, FACEP, FIDSA
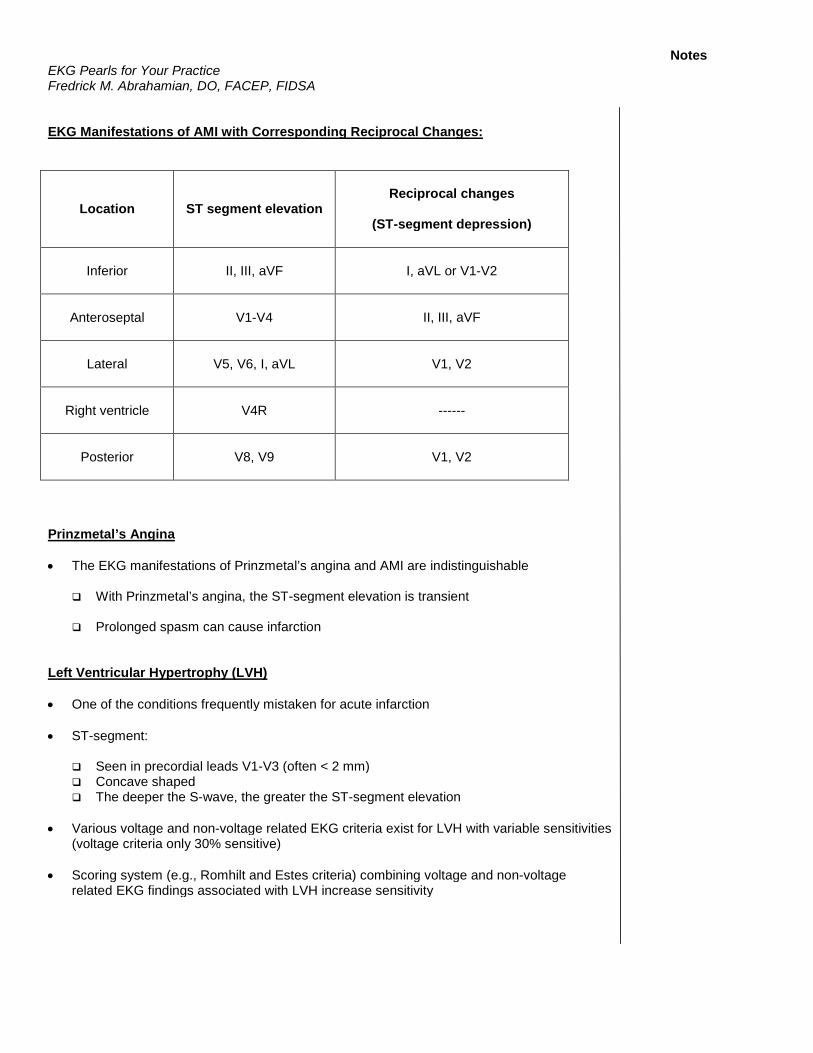
EKG Manifestations of AMI with Corresponding Reciprocal Changes:
Location ST segment elevationReciprocal changes
(ST-segment depression)
Inferior II, III, aVF I, aVL or V1-V2
Anteroseptal V1-V4 II, III, aVF
Lateral V5, V6, I, aVL V1, V2
Right ventricle V4R ------
Posterior V8, V9 V1, V2
Prinzmetal’s Angina
The EKG manifestations of Prinzmetal’s angina and AMI are indistinguishable
With Prinzmetal’s angina, the ST-segment elevation is transient
Prolonged spasm can cause infarction
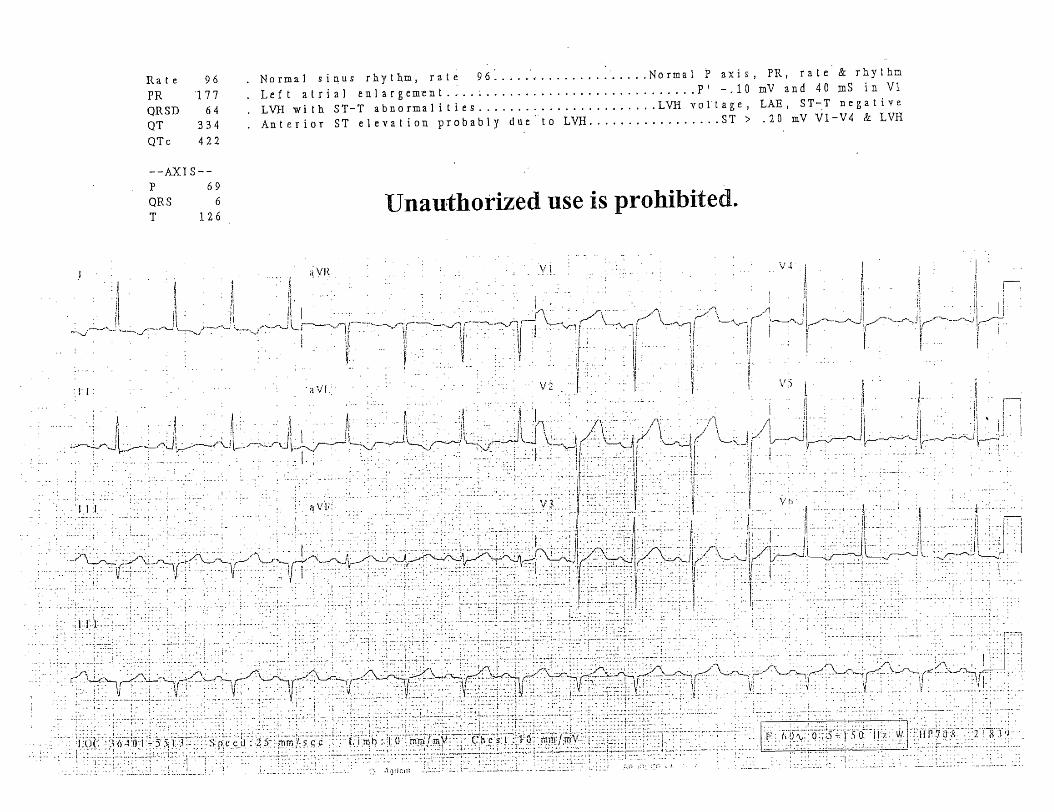
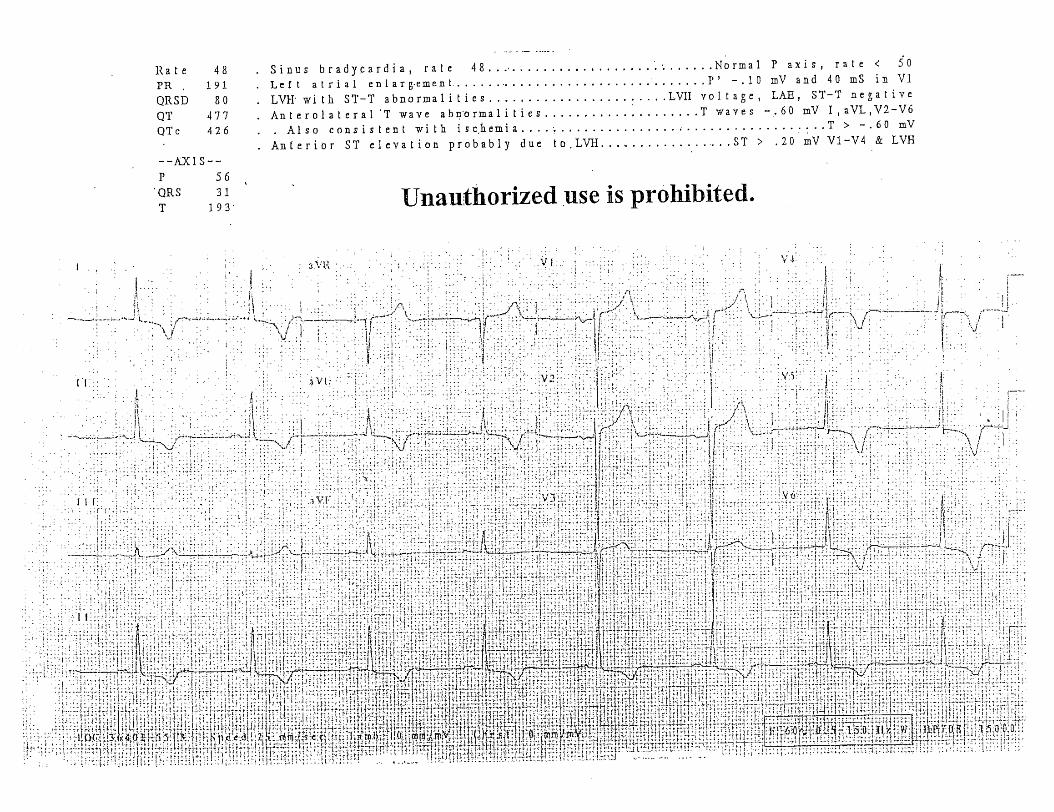
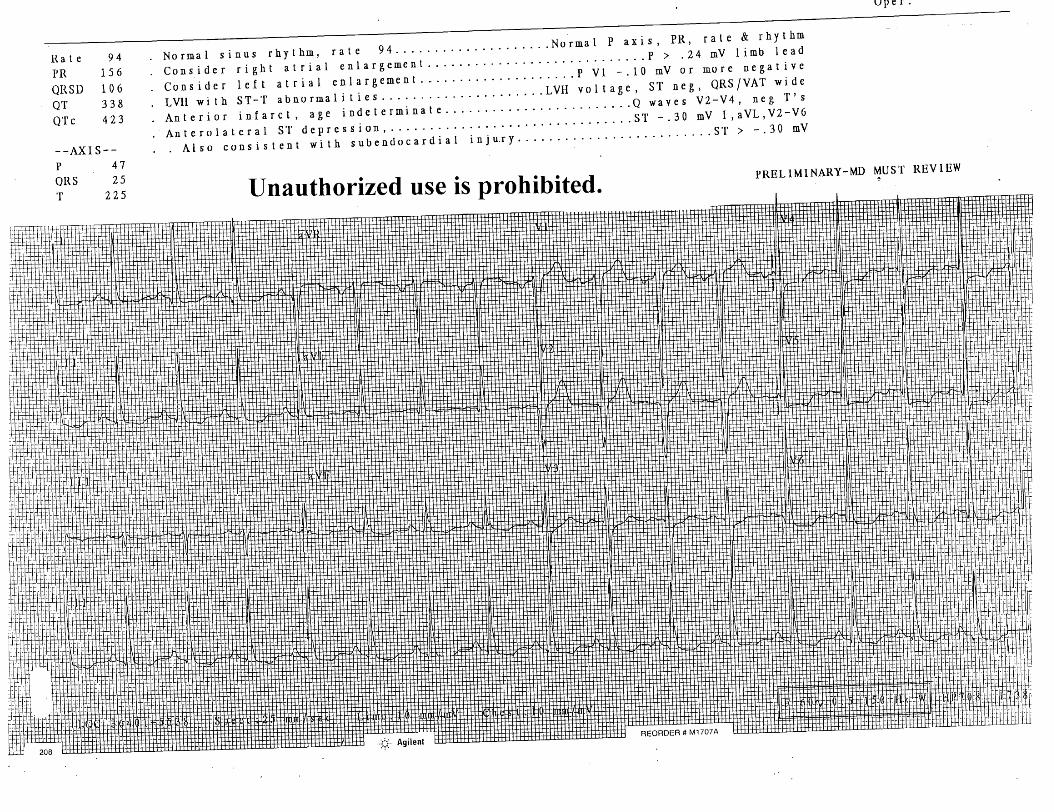
Left Ventricular Hypertrophy (LVH)
One of the conditions frequently mistaken for acute infarction
ST-segment:
Seen in precordial leads V1-V3 (often < 2 mm) Concave shaped The deeper the S-wave, the greater the ST-segment elevation
Various voltage and non-voltage related EKG criteria exist for LVH with variable sensitivities(voltage criteria only 30% sensitive)
Scoring system (e.g., Romhilt and Estes criteria) combining voltage and non-voltagerelated EKG findings associated with LVH increase sensitivity
NotesEKG Pearls for Your PracticeFredrick M. Abrahamian, DO, FACEP, FIDSA
Voltage Criteria for LVH:
Cornell criteria (most accurate):
R-wave in aVL + S-wave in V3
> 28 mm in males > 20 mm in females
Examples of Other Voltage Criteria for LVH:
Precordial leads:
R-wave in V5 or V6 + S-wave in V1
≥ 35 mm if age ≥ 20 years ≥ 45 mm if age < 20 years or with left bundle branch block
Limb leads:
R-wave in aVL ≥ 12 mm (a highly specific finding)
Non-voltage Related Findings Associated with LVH:
ST-segment and T-wave changes (secondary ST-T changes) also known as “strain pattern”
ST-segment and T-wave deviation opposite in direction to the major deflection of QRS
ST-depression with T-wave inversion in leads I, aVL, V5, V6
ST-segment often downsloping (hockey stick shape)
Consider ischemic process if associated with horizontal ST-segment depression
T-waves are asymmetrical (slow downward phase with fast upward wave) and not deep
Consider ischemic process if associated with deep symmetrical inverted T- waves
Classic ST-T changes are usually found in patients with fully developed LVH
Left atrial enlargement
Left axis deviation
Widened QRS complex
Delayed intrinsicoid deflection (> 0.04 seconds) in left chest leads(but remains normal in right chest leads)

NotesEKG Pearls for Your PracticeFredrick M. Abrahamian, DO, FACEP, FIDSA
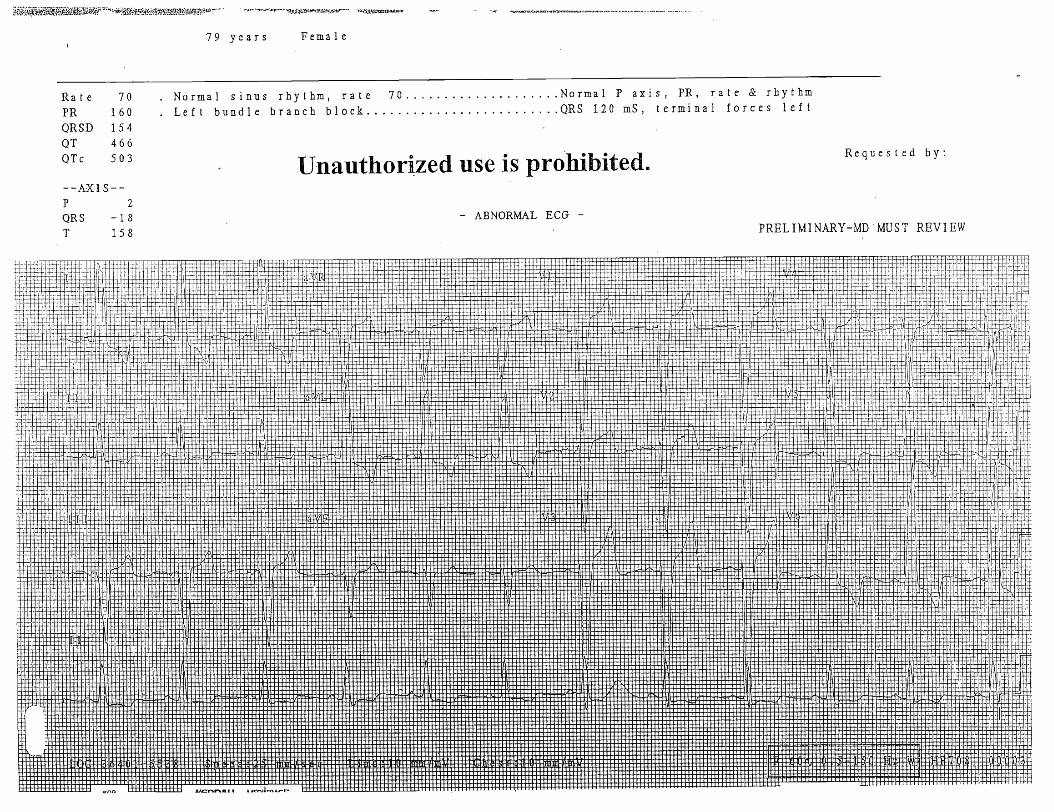
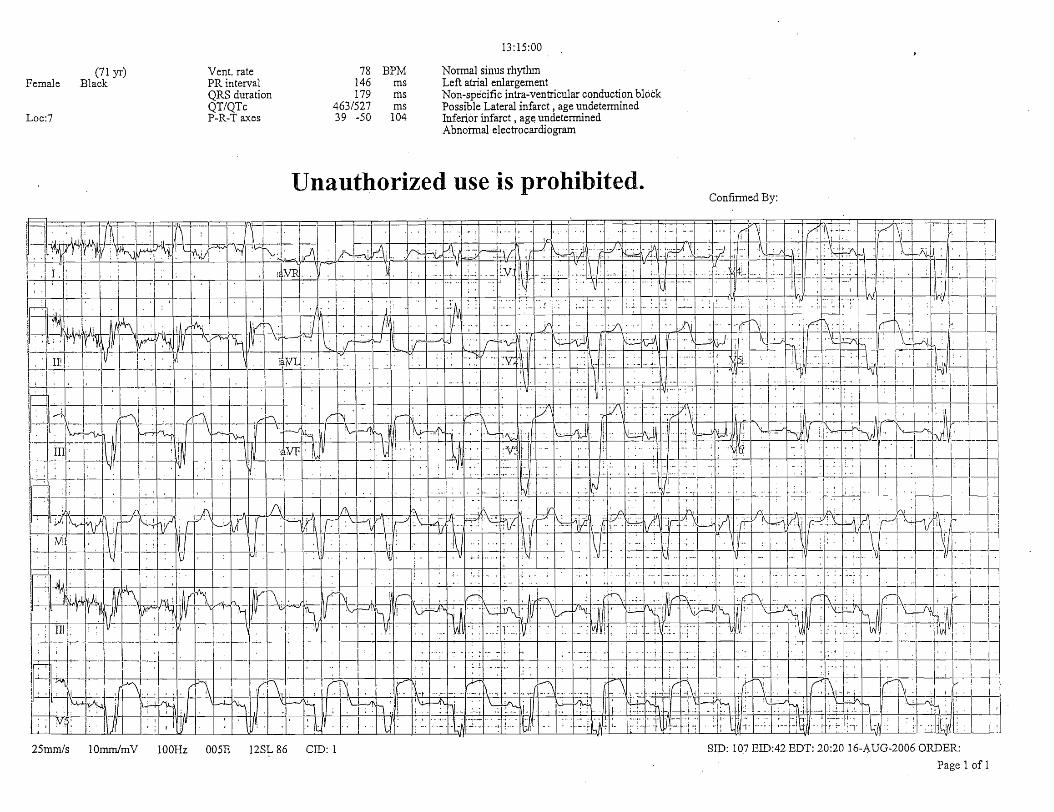
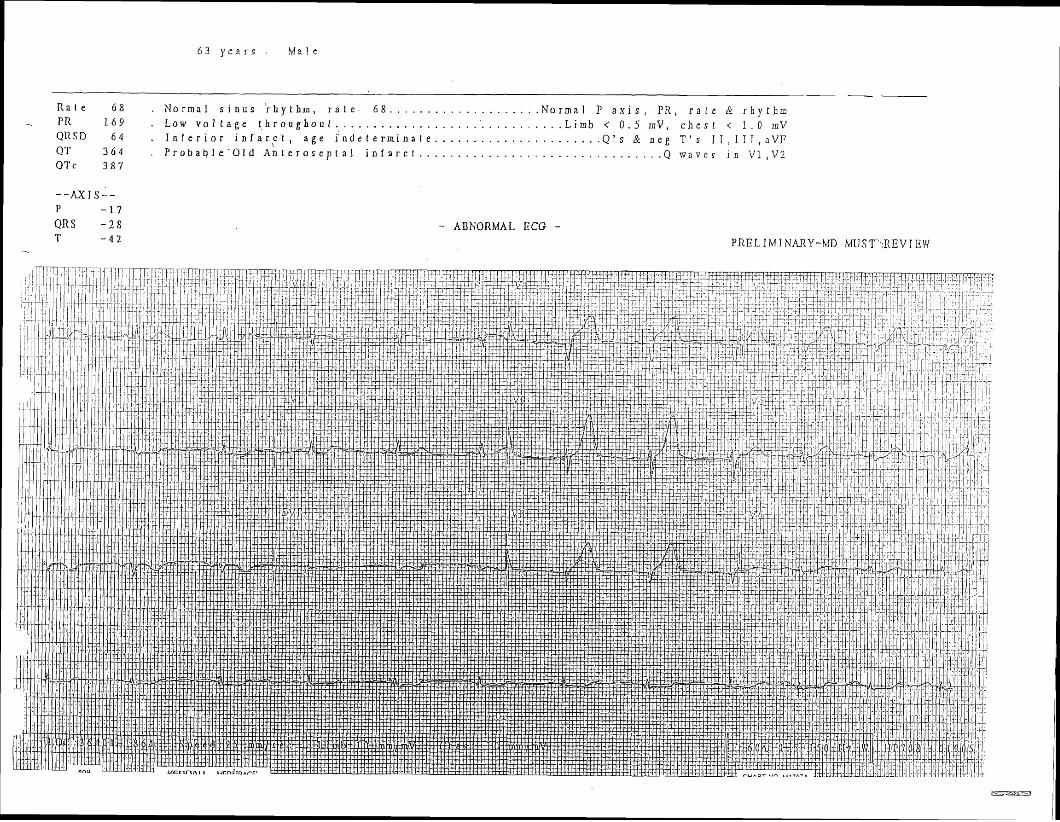
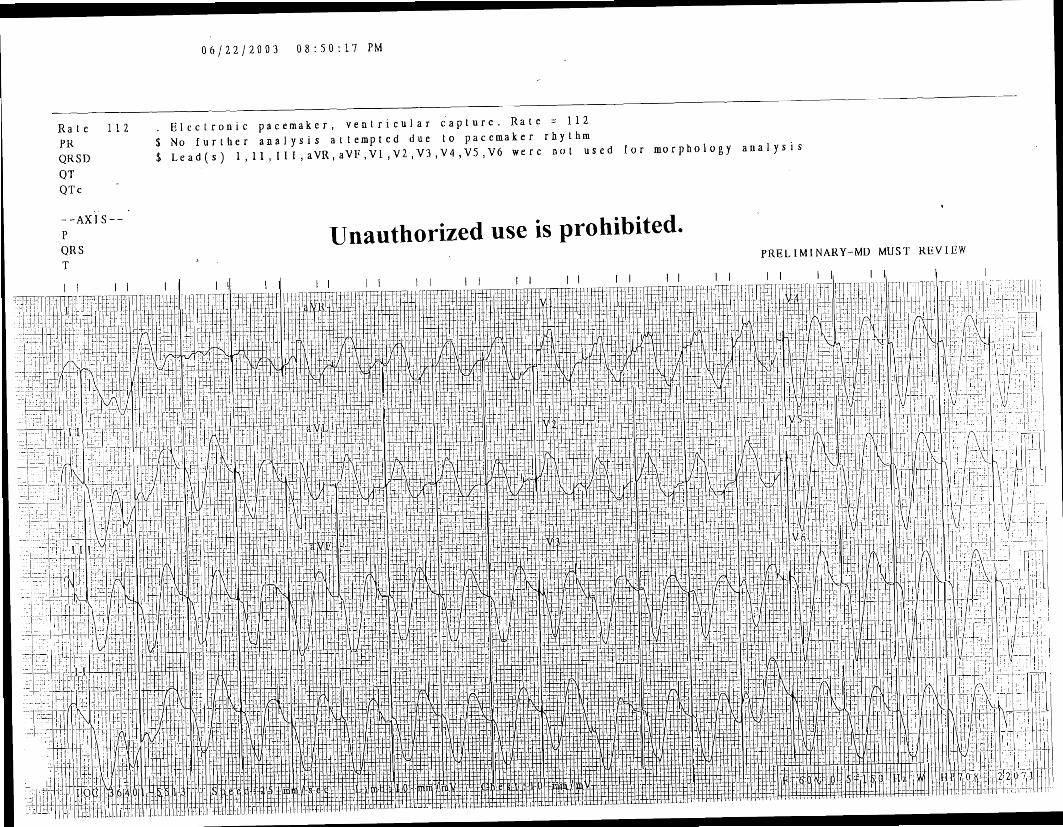
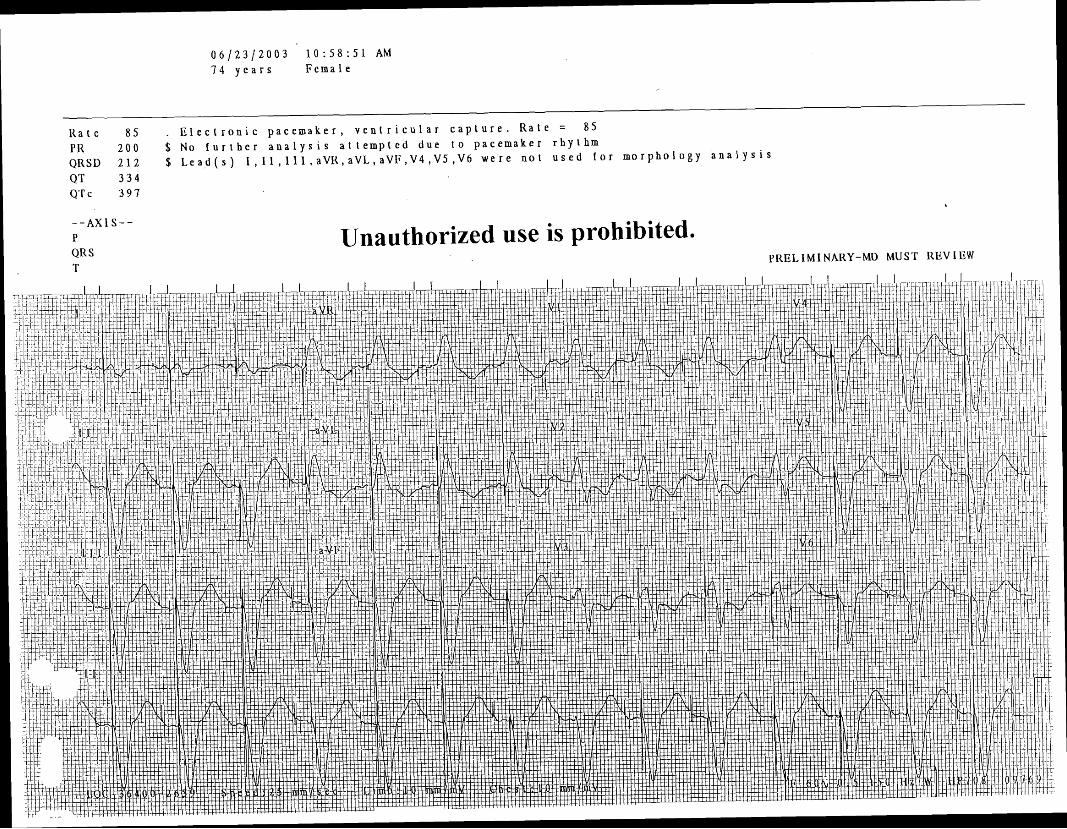
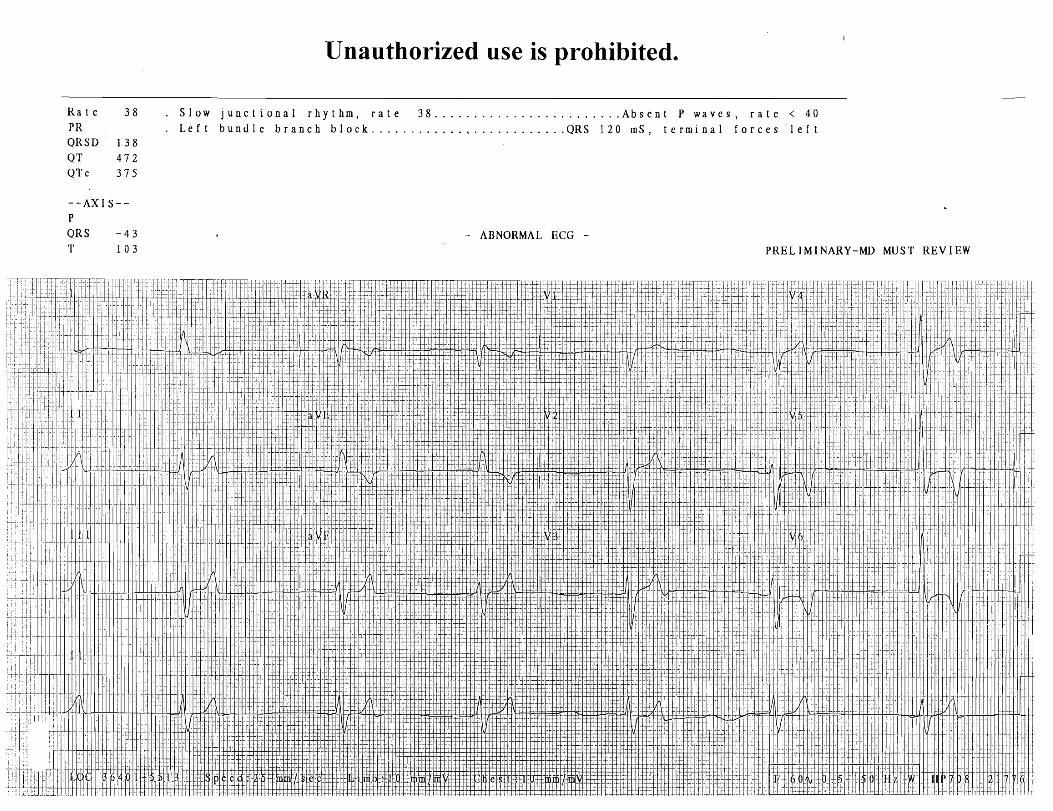
Left Bundle Branch Block (LBBB)
The abnormal ventricular depolarization as well as secondary ST-T changes makes thediagnosis of concomitant AMI in the presence of LBBB difficult
Normally, in LBBB the ST-segment and the T wave act in a discordant fashion with themain QRS complex
If the main QRS complex is positive (e.g., in leads I, aVL, V5, and V6), then theexpected secondary ST-T changes will be ST-segment depression with T waveinversion
If the main QRS complex is negative (e.g., in leads V1 and V2), then the expectedsecondary ST-T changes will be concave ST segment elevation with upright T wave
In LBBB, the presence of concordant changes (i.e., ST-segment elevation ≥ 1 mm in leadswith a positive QRS complex such as lead V5, or ST-segment depression ≥ 1 mm in leadswith a negative QRS complex such as leads V1-V3, II, III, aVF) are abnormal andconsidered highly specific and predictive for myocardial infarction.
However, the limitation of these EKG findings lies with its low sensitivity and poornegative likelihood ratio; hence, absence of these features cannot be used to excludepatients with AMI.
Another EKG feature suggestive of AMI in the presence of LBBB is extreme (i.e., ≥ 5 mm)discordant ST-segment deviation. Similarly, this EKG feature also exhibits low sensitivityand may be present in the absence of acute infarction.
Additional EKG features suggestive of myocardial infarction with LBBB may include:replacement of the secondary concave ST-segment elevations with a convex ST-segment;deep T wave inversion in leads V1 to V3; the presence of Q waves in at least two of theleads I, aVL, V5, or V6; and Q waves in II, III, and aVF especially if associated withT wave inversions.
Clues to prior myocardial infarction may also include notching of the upstroke part of awide S wave in at least two of the leads V3, V4, or V5 (the Cabrera sign), or notching of theR wave upstroke in leads I, aVL, V5, and V6 (the Chapman sign).
Obtaining serial EKGs looking for dynamic changes, as well as comparison to previousEKGs are also invaluable in identifying patients with acute pathology
Suggested articles: Sgarbossa EB, Pinski SL, Barbagelata A, et al.Electrocardiographic diagnosis of evolving acute myocardialinfarction in the presence of left bundle-branch block.N Engl J Med. 1996;334:481-487.[Erratum in: N Engl J Med. 1996;334:931].
Li SF, Walden PL, Marcilla O, et al.Electrocardiographic diagnosis of myocardial infarction in patients withleft bundle branch block. Ann Emerg Med. 2000;36:561-565.
NotesEKG Pearls for Your PracticeFredrick M. Abrahamian, DO, FACEP, FIDSA
Brugada Syndrome
Accounts for 40%-60% of all cases of idiopathic ventricular fibrillation
The syndrome has been linked to mutations in the cardiac sodium-channel gene
Depression or a loss of the action-potential dome in the right ventricular epicardium
The ST-segment elevation associated with Brugada syndrome is limited to leadsV1-V2 or V3.
Typically, it has a saddleback or coved appearance with a gradual downslope, ending withan inverted T wave
The high take-off ST-segment in V1-V2 resembles the rSR' pattern seen with RBBB.However the wide S wave in leads I, aVL, and V6 that are associated with RBBB may beabsent in Brugada syndrome. Most often the QT interval is within normal limits and thePR interval is prolonged.
The terminal portion of the QRS complex and the beginning of the ST-segment is indistinct.In contrast, the ST-segment associated with anteroseptal infarction complicated by RBBBhas a distinct transition from the QRS complex with a horizontal or upsloping (convex),rather than downsloping, morphology.
The ultimate diagnosis rests on exclusion of other conditions resulting in ST-segmentelevation in the right precordial leads (e.g., early repolarization, LBBB, LVH, or AMI),electrophysiological studies, or with the aid of a pharmacological challenge.Arrhythmogenic right ventricular cardiomyopathy also has a similar EKG pattern to that ofBrugada syndrome and the EKG distinction is difficult. A drug challenge with sodiumchannel blockers may help in differentiating these two conditions.
Suggested article: Antzelevitch C, Brugada P, Borggrefe M, et al.
Brugada syndrome: Report of the second consensus conference.Circulation. 2005;111:659-670.
Pulmonary Embolism (PE)
Incidence and severity of the EKG pattern depends on the timing and magnitude of theobstruction in the pulmonary vasculature
> 20 different EKG manifestations of PE have been discussed in medical literature EKG not useful and/or sensitive for diagnosis Most are nonspecific findings and often transient
Sinus tachycardia is the most frequent rhythm disturbance Most frequent EKG pattern: Sinus tachycardia with non-specific ST segment/T wave
changes
Other findings: Atrial arrhythmias (a.fib/flutter) Right bundle branch block (complete or incomplete) Right-axis deviation or left-axis deviation
(LAD occurs more often due to preexisting disease)
NotesEKG Pearls for Your PracticeFredrick M. Abrahamian, DO, FACEP, FIDSA
Tall, peaked P-wave with amplitude > 2.5 mV in lead II (P-pulmonale) S1Q3T3 (not pathognomonic; not sensitive; seen in < 30%) Right ventricular strain pattern
(ST-segment depression with inverted T-wave in V1 and V2
May be associated with ST-segment elevation in the inferior and to lesser degree inanteroseptal leads (“pseudoinfarct pattern”)
Inverted T-waves V1-V3(common finding in massive PE and is the most persistent of all EKG abnormalities)
Cardioversion
Transient ST-segment deviations, either depressions or elevations, can be encounteredwith transthoracic and epicardial electrical shocks
The ST-segment elevation at times could be significant (> 5 mm), but it only lasts oneto three minutes after the cardioversion
In comparison to the patients without ST-segment elevation, patients with ST-segmentelevation often have a lower conversion rate and are less likely to remain in sinus rhythm
The mechanism of ST-segment elevation associated with cardioversion is not wellunderstood
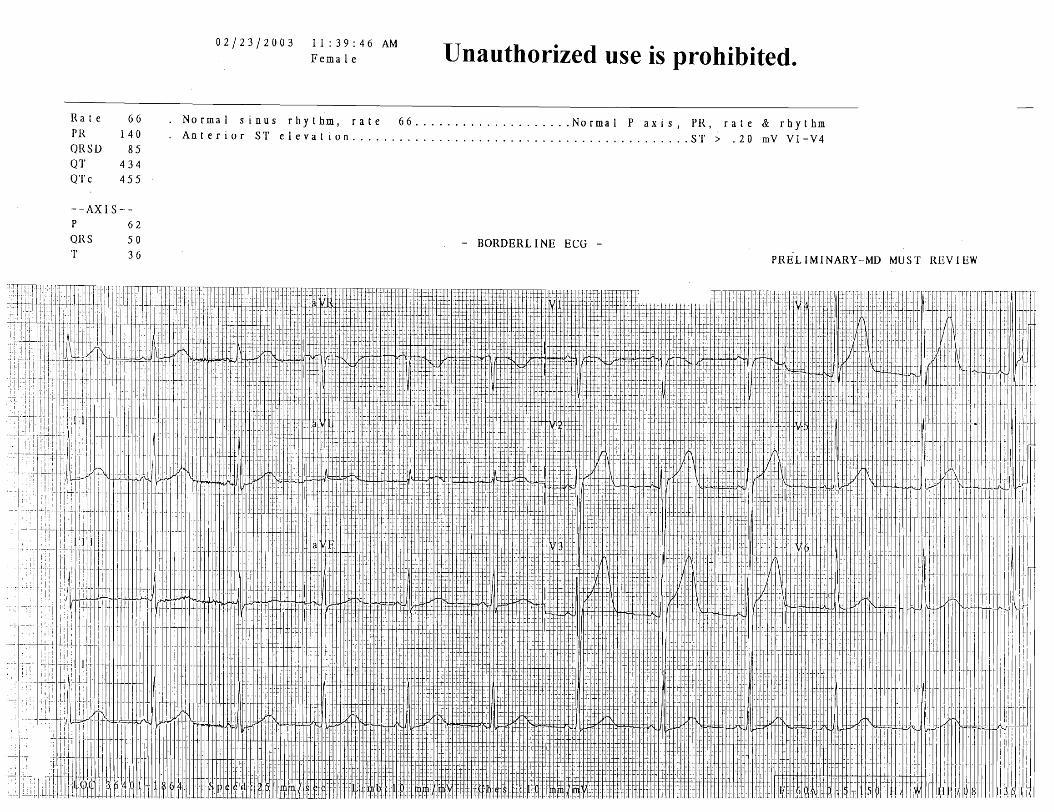
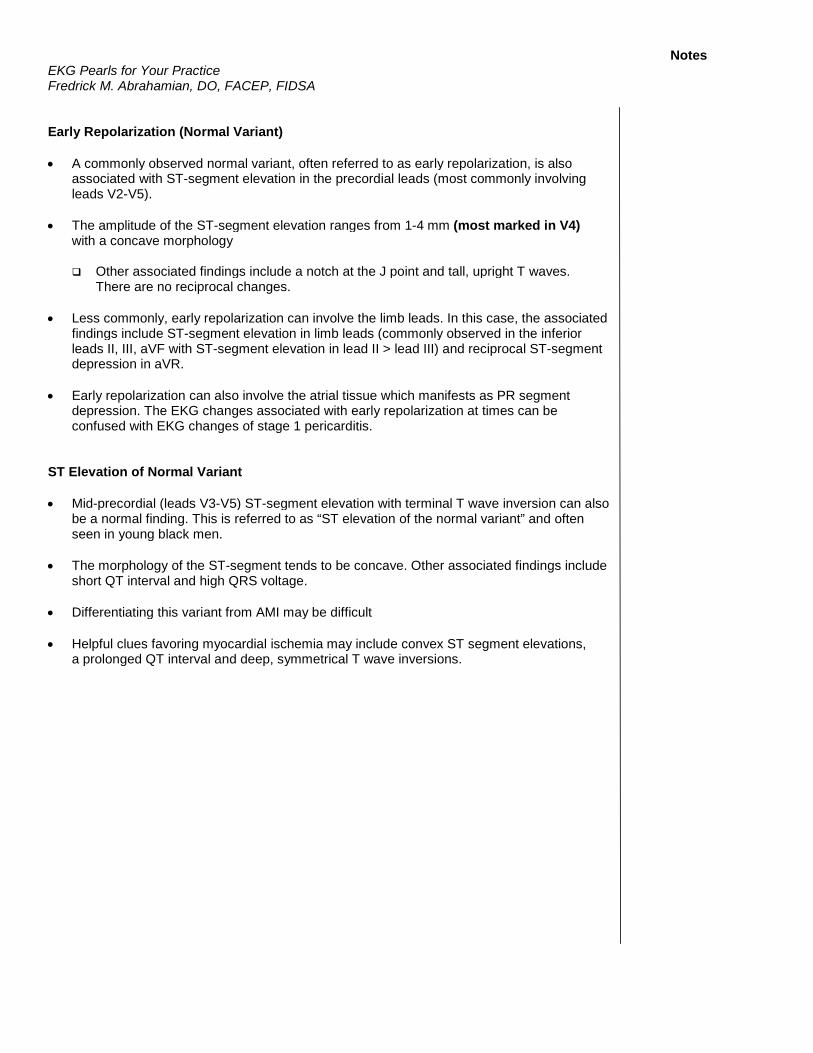
Normal ST-Segment Elevation
A majority of healthy men will commonly display ST-segment elevation in theprecordial leads V1-V4.
The prevalence of this so-called “male pattern” ST-segment elevation is very common andis considered to be a normal finding. It is highest in the age group of 17 to 24 years anddeclines gradually with advancing age.
The amplitude of the ST-segment elevation ranges from 1-3 mm (most marked in V2) witha concave morphology. There are no associated T wave abnormalities or reciprocalchanges.
Similar ST-segment elevation is less frequently observed in women. If present, theST-segment elevation in “female pattern” is most commonly < 1 mm.
NotesEKG Pearls for Your PracticeFredrick M. Abrahamian, DO, FACEP, FIDSA
Early Repolarization (Normal Variant)
A commonly observed normal variant, often referred to as early repolarization, is alsoassociated with ST-segment elevation in the precordial leads (most commonly involvingleads V2-V5).
The amplitude of the ST-segment elevation ranges from 1-4 mm (most marked in V4)with a concave morphology
Other associated findings include a notch at the J point and tall, upright T waves.There are no reciprocal changes.
Less commonly, early repolarization can involve the limb leads. In this case, the associatedfindings include ST-segment elevation in limb leads (commonly observed in the inferiorleads II, III, aVF with ST-segment elevation in lead II > lead III) and reciprocal ST-segmentdepression in aVR.
Early repolarization can also involve the atrial tissue which manifests as PR segmentdepression. The EKG changes associated with early repolarization at times can beconfused with EKG changes of stage 1 pericarditis.
ST Elevation of Normal Variant
Mid-precordial (leads V3-V5) ST-segment elevation with terminal T wave inversion can alsobe a normal finding. This is referred to as “ST elevation of the normal variant” and oftenseen in young black men.
The morphology of the ST-segment tends to be concave. Other associated findings includeshort QT interval and high QRS voltage.
Differentiating this variant from AMI may be difficult
Helpful clues favoring myocardial ischemia may include convex ST segment elevations,a prolonged QT interval and deep, symmetrical T wave inversions.

NotesEKG Pearls for Your PracticeFredrick M. Abrahamian, DO, FACEP, FIDSA
Take Home Points
Hyperkalemic T wave: Tall with narrow base
Hyperacute T waves: Tall with broad base
Pericarditis: Look at lead V6 for ST-segment / T-wave amplitude ≥ 0.25
Q waves + ST elevations in V1-V4: Think left ventricular aneurysm (LVA)
ST elevation with infarction behaves reciprocally between leads III and aVL
ST-T changes associated with LVH: Restricted to leads I, aVL, V5, & V6.
LBBB: ST-segment and T wave act in discordant fashion with the main QRS complex
Get serial EKGs

. P
E 7
- r. - '73
vi
v -
w
am
x
n
-. .-
<
"
r. v,
- rn
F
- 1
3
-.
!-2
OI
ow
-
u o
n
. +
9.
a r z
-0
0
0 --
w
-B
w
e:
w
w
- -,
u c-
-.
DW
D
OM
S
1
-. m
E3 vr
w-
1
- P
- a u
0-
-
wo
w
2 Z?
'4
rn - 1
-- w
1
- W
B0
B
0
", 1
r.
V>
-.
.-4 .
0.
D
-
. -
0.
m
.
D.
G
w
.
-09
0.
11
1.
.
D-
.
. 0
..
C
..
-
. .
a. .
..
.
..
.
. .
. .
..
rn .-
>
7 w
*-
Y
"n
-r
CT
--
'o
w
n-
e. -
- D
EW
o
w a
g
"m
o-
n
nc
J
--,
- -
LU
mu
. -
'C.
O
n.
'
... -
. w
lo
m
3V
' M
W
D.
.
* r.. .
nm
..
-
u.
.
. -
.
. m
..
.
..
-
..
..
.
..
.
..
..
.
..
.
..
.,
.
..
,
..
.,
.
..
.
s.
..
..
.,
.
..
.
..
..
.
..
.
2 ?;.,
G
m
n a,
D
Ui
-
u, -
4-
rn
-
-.
- w
-
A
R
--.-
c-, b
- r- o
y
- Y
cc
a ;;
"7
CR
rn:. ~x
ar
nw
-1-
o
c
-4
U]
P
II
0 1
a -
rzm
D 0 -
wn
n - n
-s -
11
1l
l
v-
0
u
cr
C
D 1.
- ~
n
- ew
u
- u
rn
-
w
n
w-
rb
- Y
- -F
! w
-.
R
Cm
0
s
- "
w-
w
-
<-
4
7, n
n
-
BP
<
= -
r-
l
"
D 1.
< a. 0
N
e
- G
-
<e
w
CL
)D
-
< -
0.
PO
w
- a
<=
- C
AW
c
- 0
1
2;
?' w
: :?
I-,-
0 l
D P
I1
0 '4
Y
.-
-
w -
c
5 -
VI
0 a
rzr
CD
C
WC
D
a-
n
-c -
Vl
ll
u- 0
a
I
- CD -'
"
-0
L
+w
u
- u
w
+w
0
L-
O
LC<
- -
E
w -.
A
. em
- C - W
"
w-
e -
4
rm
0
- D
J
WT
J -
< -
?1
O -
' -
ao
e
c
Pa
-
- C
W
em
- ,
Ll - -0
eo w
O*
"J
'a -
0
D 1
-,
Om
0
:.
w p
rP
O
OW
--,-
CD
?= -I
vl D-
II
n Y
a - C
r 00
-B
L"
P c.
ca
w
W
ma
w
+P
W'
D
:,
n,
C]--n
o
n-
u
n
P
mo
wn
-
.-
xm
ul m -.-I
n-LOn
nn
n
u
n 0.
-w
oQ
-
* <
+.
?.,,, tr
1 -.o
+.. 40 n
3
mp
..
n
u.
WD
* n
o*
5 B
Y.
P
-.p
. -
Pe
r.
1
. -.
".
. r
.. "
. r
r.
e
. -.
. -
. 0
. P
.
V)
.
n
..
.
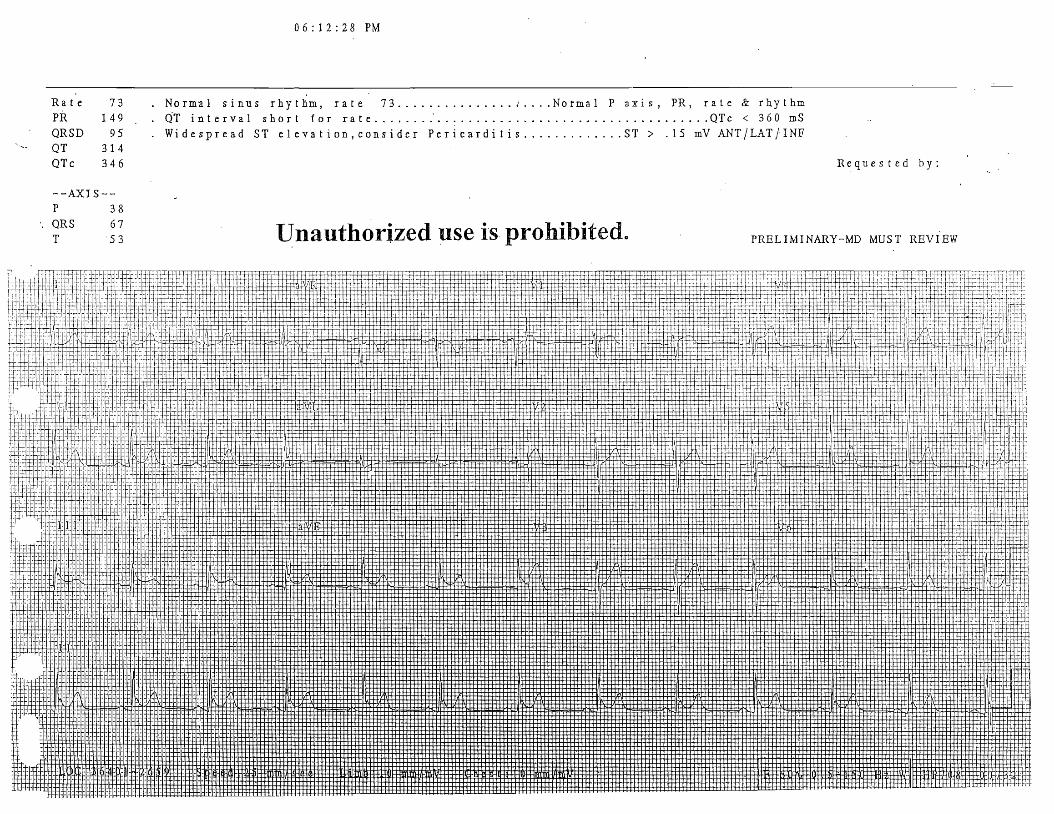
l l a t ' e 73 . Normal s i n u s r h y t h m , r a t e 73 . . . . . . . . . . . . . . . ; . . . . N o r m a l P a x i s , PR, r a t e C rhythm PR 149 . . QT i n t e r v a l s h o r t f o r r a t e . . . . . . . . . . . . . . . . . . . . . . . . . . . . . . . . . . . . . . . . . . . . T c < 3 6 0 mS Q R S D 9 5 W i d e s p r e a d ST e l e v a t i o n , c o n s i d e r P e r i c a r d i t i s . . . . . . . . . . . . . ST > .15 mV A N T / L A T / I N P . .
- QT 3 14 QTc 3 4 6 R e q u e s t e d b y :
- -AXIS- - P 3 8 QR S 6 7 T 5 3 Unauthorized use is prohibited. PRELIMINARY-MD MUST REVIEW