Einstein Telescope site selection · – Material (damping) Surface waves Body waves Example:...
33
Ambient ground motion and gravity gradient noise Jo van den Brand, Nikhef, Amsterdam on behalf of the design study team TAUP 2009, Roma, July 1, 2009 - [email protected] Einstein Telescope site selection
Transcript of Einstein Telescope site selection · – Material (damping) Surface waves Body waves Example:...

Ambient ground motion and gravity gradient noise
Jo van den Brand, Nikhef, Amsterdam
on behalf of the design study team
TAUP 2009, Roma, July 1, 2009 - [email protected]
Einstein Telescope site selection

LISA
Overview
Ambient seismic noise
– Lowest achievable noise - NLNM
– Frequency ranges, coherence
– Depth, geology, geography
Experience from other fields
– International linear collider, SSC, LEP, SLAC, Desy, KEK
– Borehole data
Used as input for gravity gradient noise estimates
– FEA analysis of GGN (David Rabeling, Mark Beker)
– GGN subtraction schemes (David Rabeling, Caspar van Leeuwen)
– Field measurements
• Homestake, Gran Sasso, etc.

LISA
McNamara & Buland USGS 2004
McNamara et al., USGS 2005
159 GSN and ANSS
stations
Lowest noise:
Antarctica, QSPA
300 m depth
Lowest noise has
1 – 2 % probability

LISA
USGS NLNM
PSD in Decibels
– Referred to 1 (m/s2)2/Hz
– 168.6 dB/Hz (0.37 ng/rtHz) at 1 Hz
– Note: 0.55 ng/rtHz at 1 Hz (NLC)
Displacement
– About 0.1 nm/rtHz at 1 Hz
Sometimes amplitude of
background noise needed
– Integration bandwidth → RMS value
– 1/3 octave: ±10% about center
– Convert PSD to p2p amplitude
– Gaussian signal passed through
narrow-band filter the absolute peak
signals of the filtered signal envelope
will have a Rayleigh distribution

LISA
Albuquerque New Mexico- USA
Granite
Borehole sensor: 100 m
Elevation: 1740 m
1 – 2 dB > NLNM at 0.8 s
Cultural noise 1 – 10 Hz
correlates up to 225 km
LISA
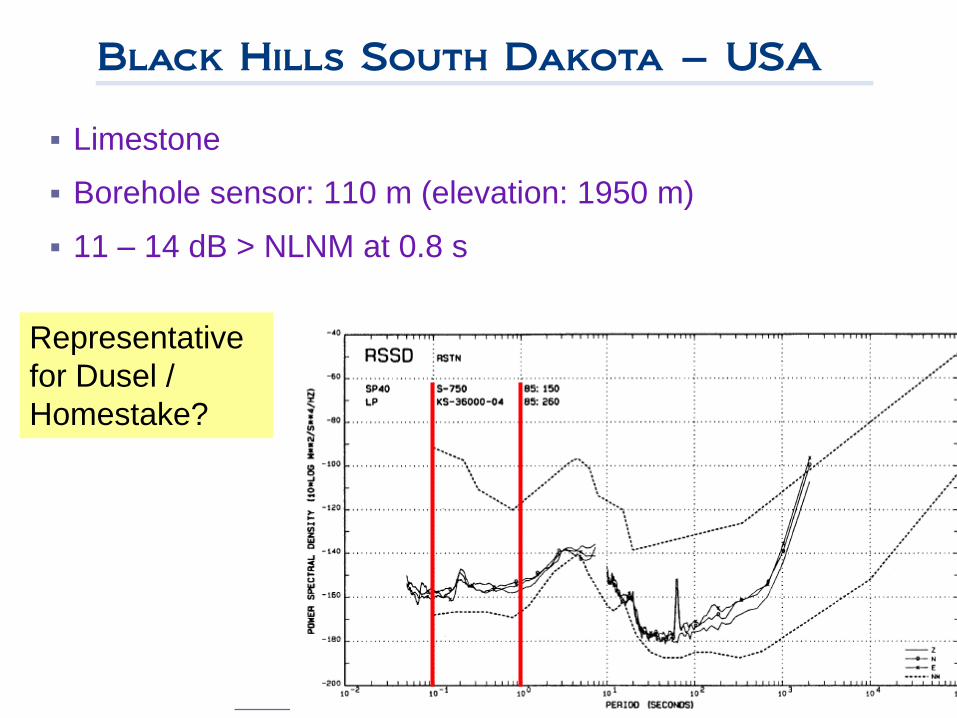
Black Hills South Dakota – USA
Limestone
Borehole sensor: 110 m (elevation: 1950 m)
11 – 14 dB > NLNM at 0.8 s
Representative
for Dusel /
Homestake?
LISA
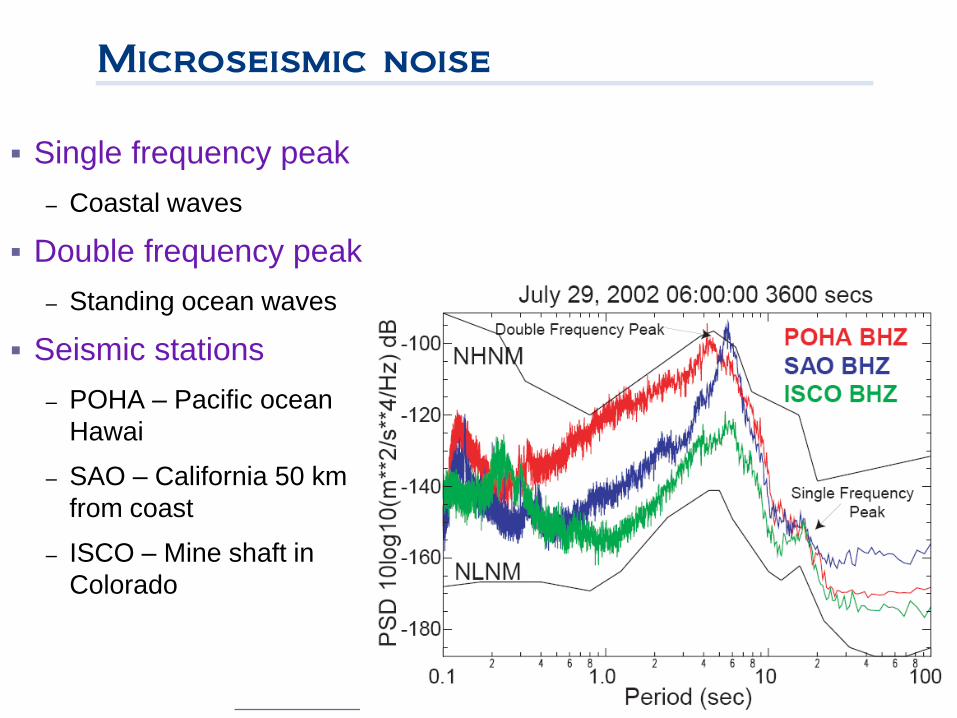
Microseismic noise
Single frequency peak
– Coastal waves
Double frequency peak
– Standing ocean waves
Seismic stations
– POHA – Pacific ocean
Hawai
– SAO – California 50 km
from coast
– ISCO – Mine shaft in
Colorado

LISA
Microseismic noise
PSD changes up to 30 dB
– Microseismic minimum vs maximum noise
Modeling
– Driver frequency f0
– Random phase loss n

LISA
Cultural noise
Diurnal variations
– Binghamton New York:
– 50 dB long periods
– 20 dB above 1 Hz
– ANMO borehole station
– noise 10 dB above 1 Hz
– Deep borehole stations see cultural noise up to depths of 2 km
– BFO station: 180m depth
– Saw mills

LISA
Cultural noise – DESY, SLAC
Noise sources
– Water pumps, water in cooling pipes, cryogenic fluids
– Low frequency reciprocating devices
– Vacuum pumps
– Air, helium, hydrogen compressors
– Well defined sharp spectral lines
– Implement site policy

LISA
Traffic induced vibrations
McNamara & Buland USGS 2004
– AHID: Auburn Hills, Idaho
– >30 dB at frequencies: 1 – 10 Hz
– Attenuation: km’s in distance and depth
Lombaert and Degrange (2001)
– Study of peak particle velocities
– 30 km/h: 5 – 20 Hz
– 50 km/h: 10 – 30 Hz
– 70 km/h: 10 – 40 Hz
Long (2003)
– Empirical formula for attenuation of seismic road noise
– Atlanta, GA
– Steady traffic (15 – 60 cars/min)
– A rms amplitude of particle velocity, r is distance
Log[A (mm/s)]=0.9 – 1.25 x Log[r (m)]

LISA
Wind noise
Withers et al (1996)
– Datil, New Mexico
– Remote site, gentle topography
– Sparse vegetation
– Nearest road 12 km, lightly traveled
– Nearest railroad 90 km
– Depth: 0, 5, 43 and 85 m
– Reduction 20 dB at 43 m
Young et al (1996)
– Amarillo, Texas
– Depth: 3, 13, 30, 122, 305 m
Features
– Broadband noise: 1 – 60 Hz
– Strong correlation with wind
– 34 dB at 3 m, 10 dB at 305 m above LNM
– Threshold increases with depth

LISA
Geographic variations
McNamara & Buland USGS
2004
– Strongest geographical
dependence > 1 Hz (diagram A)
– East coast up to 50 dB above
NLNM (Cultural noise)
– Microseismism along coast
(diagram B)
– Continental interior NLNM +10 dB
LISA
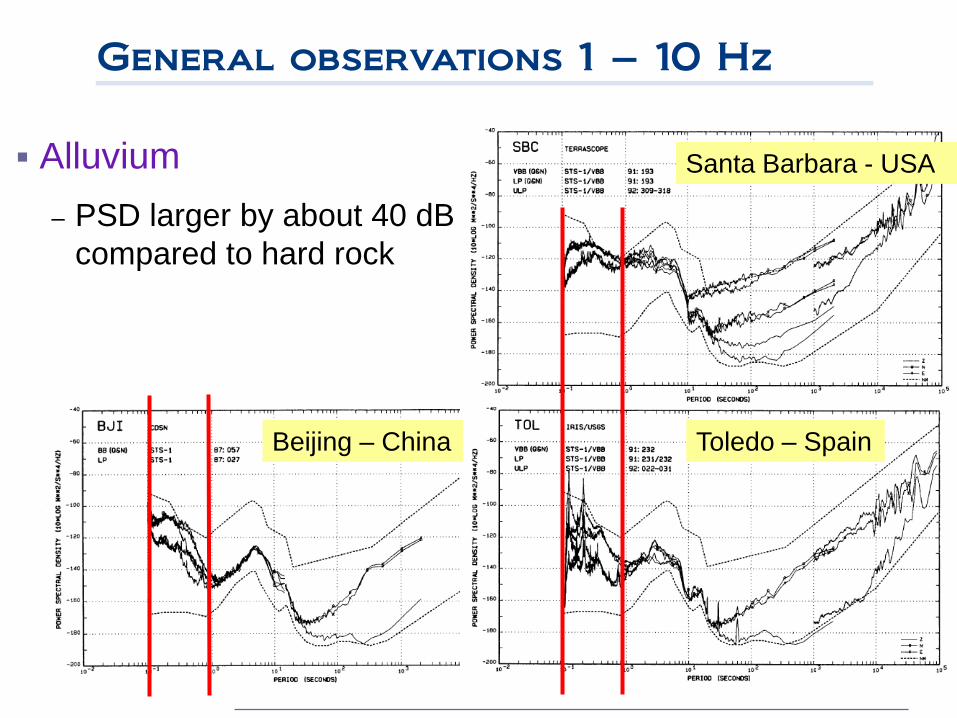
General observations 1 – 10 Hz
Alluvium
– PSD larger by about 40 dB
compared to hard rock
Santa Barbara - USA
Toledo – Spain Beijing – China

LISA
Steinwachs (Hannover PhD thesis 1969)
Vertical seismic noise in
Fed. Rep. Germany
Sediment
Hard rock
From Fischer at SLAC
LISA
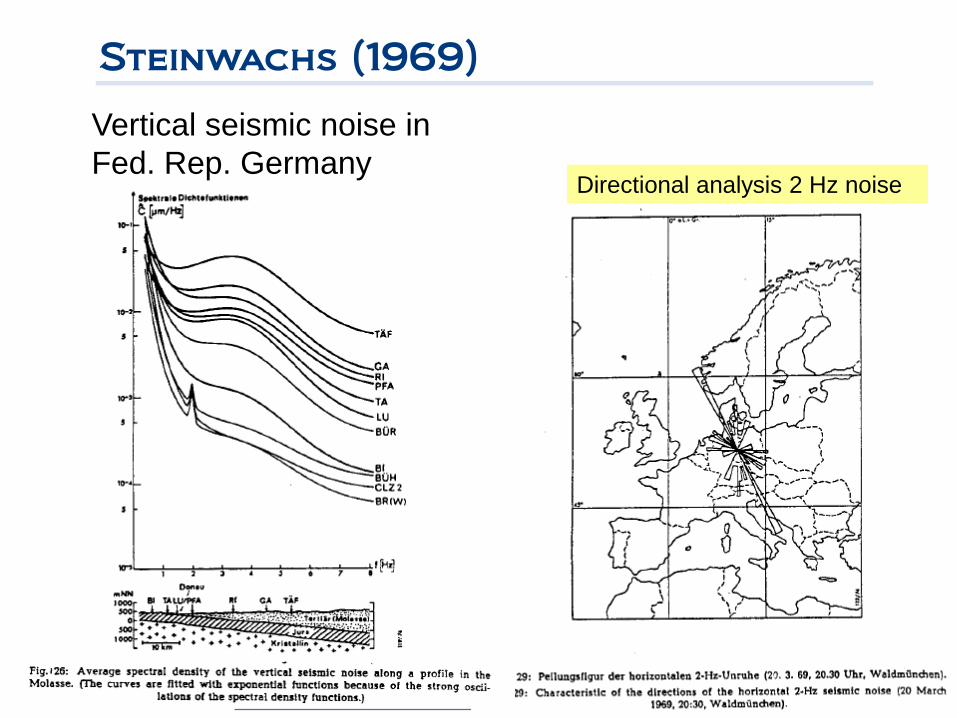
Steinwachs (1969)
Vertical seismic noise in
Fed. Rep. GermanyDirectional analysis 2 Hz noise

Europe: large sediment regions
Homogeneous materials: crystalline granite

KONO
Kongsberg, Norway
Silver mine, 340 m depth

LISA
Accelerator site spectra
At 1 Hz:
Hiidenvesi cave: <1 nm/rtHz
Moxa station: 0.5 nm/rtHz
Asse 900 m: 0.5 nm/rtHz

LISA
Coherence
HERA tunnel
TARP (tunnel and reservoir project)
near Chicago, 100 m depth

LISA
Japanese site spectra
At 1 Hz:
Kamioka: 2 nm/rtHz
Shin-Toyone: 3 nm/rtHz

LISA
Compilation of sites (noise 1 Hz)
For ILC database:
see vibration.desy.deSite location
Average
rms (nm) σ (nm)
Day rms
(nm)
Night
rms
(nm)
ALBA, Barcelona, Spain 18.8 9.5 42 9.1
ANMO Albaquerque NM 0.3
APS, Argonne, U.S.A. 10.7 1 11 9.8
Asse, Germany (salt mine) 0.6 0.1 0.7 0.5
Aurora FNAL, USA (mine) 1
BESSY, Berlin, Germany 75 28.1 140.7 53.1
BFO Black Forest 1
BNL, Upton, U.S.A. 89.6 30.2 135.3 29.1
CERN LHC, Geneva, Switzerland 1.9 0.8 2.8 0.9
DESY HERA, Hamburg, Germany 53.3 18.9 77 34.8
DESY XFEL, Osdorf, Germany 29.1 11.9 48.4 19.5
DESY XFEL, Schenefeld, Germany 41.1 16.6 70 35.1
DESY, Zeuthen, Germany 64.4 40.4 75.6 88.5
Ellerhoop, Germany (TESLA IP) 18.2 8.4 35.9 9.3
ESRF, Grenoble, France 74 34.9 137.2 40.2
FNAL, Batavia, U.S.A. 3 0.9 4 2.2
Hiidenvesi (cave), Finland 0.5
IHEP, Beijing, China 8.5 0.5 9 8.1
Kamioka, Japan 2
KEK, Tsukuba, Japan 80.5 36 125.1 38
LAPP, Annecy, France 3.6 1.6 7 1.9
Moxa, Germany (seismic station) 0.6 0.1 0.9 0.5
QSPA Antarctica 0.1
RSSD Blackhill SD 1
Shin-Toyone, Japan (tunnel) 3
SLAC, Menlo Park, U.S.A. 4.9 1.2 7.4 4.1
Spring-8, Harima, Japan 2 0.4 2.5 1.8
SSRF, Shanghai, China * 292 164 444 102
Various suitable sites
exist (in principle)
Next step: get data from
candidate sites, e.g.
borehole data
Conclusion: 1 – 2 nm/rtHz
at 1 Hz seems possible

LISA
Body and surface waves
Body: primary wave
Compressional motion
Body: secondary wave
Transverse motion
Surface: Rayleigh wave
Elliptical rolling motion
Surface: Love wave
Horizontal motion, fastest surface wave

Finite element analysis
Rayleigh
Head
Shear
Pressure
Reaction to vertical point oscillation
– Two layer geology
Wave attenuation has two components
– Geometrical (expansion of wave fronts) ~ rn
– Rayleigh, n=-1/2
– Body waves at depth, n=-1
– Material (damping)
Surface waves
Body waves
Example: sandstone, a = 3.5 x 10⁻⁸ f sec/cm, a plane wave disturbance at
1 Hz would be attenuated over 10 km by less than 4%
Mark Beker, David
Rabeling, Caspar van
Leeuwen, Eric Hennes

Effects of seismic noise
Seismic noise suppression
– Development of superattenuators
Gravity gradient noise
– Cannot be shielded
– Network of seismometers and development of
data correction algorithms
Figure: M.Lorenzini
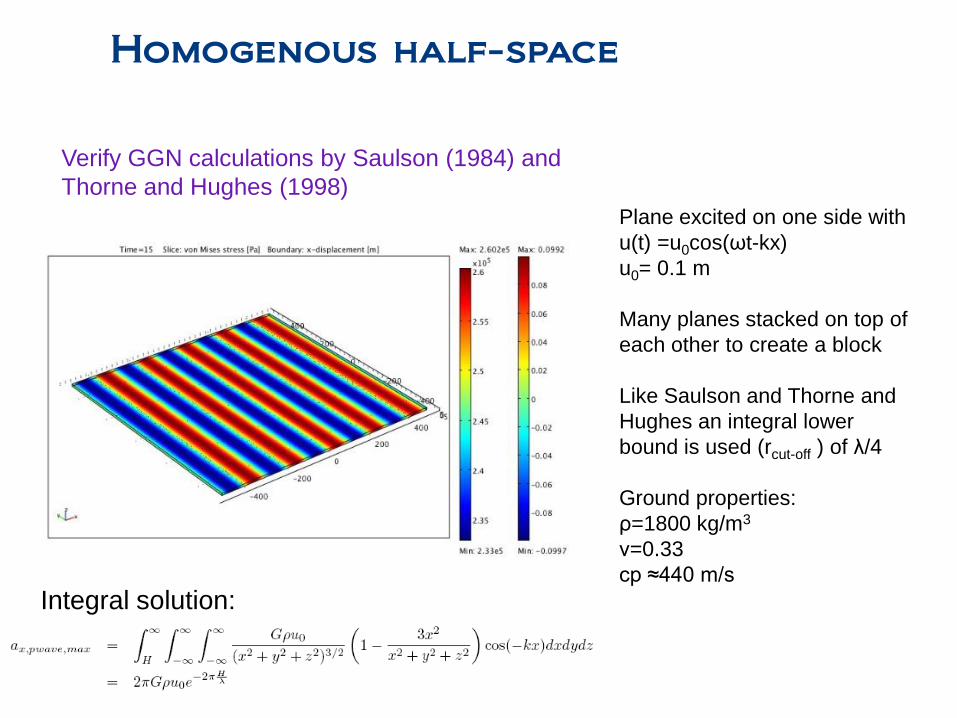
Homogenous half-space
Plane excited on one side with
u(t) =u0cos(ωt-kx)
u0= 0.1 m
Many planes stacked on top of
each other to create a block
Like Saulson and Thorne and
Hughes an integral lower
bound is used (rcut-off ) of λ/4
Ground properties:
ρ=1800 kg/m3
ν=0.33
cp ≈440 m/s
Integral solution:
Verify GGN calculations by Saulson (1984) and
Thorne and Hughes (1998)

FEA results: surface detectors
GGN spectra for surface detectors
agree with Saulson, Cella and Hughes
– For 1 – 10 Hz: 1 nm/rtHz
Beccaria et al., Class. Quant.
Grav. 15:3339-3362 (1998)
S.A.Hughes, K.S.Thorne, Phys.
Rev. D58:122002 (1998)
Care should be taken regarding
element size
P
H
m

Underground detectors - Cella
Surface
Surface
Z=-10 m
Z=-10 m
Z=-100 m
Z=-100 m
Z=-1000 m
Z=-1000 m
Eq
uiv
ale
nt str
ain
nois
e a
mp
litu
de
(H
z-1
/2)
Re
du
ctio
n f
acto
r
Frequency (Hz)
Assumptions:
• CL = 1000 m/s (lower is better)
• CT/CL = 0.5 (lower is worse)
• Surface modes and transverse
mode only
• V/H ratio = ½ (lower is better)
Feasible
• Can we do better?especially in the low frequency region
• Volume waves!
Analytical results by G. Cella
The 58th Fujihara Seminar
(May 2009)

Material properties:
E = 1.22×10⁹
ν = 0.33
ρ = 1800 kg/m3
cp = 1000 m
cS /cp = 0.5
Double plane wave excitation of surface waves
Soil characteristics to match Cella’s calculations
FEA surface excitation
Displacement [ m ]
Reasonable agreement with Cella
– Limited model size
– Deviations at higher frequencies
Geometric suppression increases with
– Lower velocities
– Domination by surface waves
More realistic model
– Surface wave amplitudes decay exponentially with depth
– Include compression waves
– Include incoherent sources
5 Hz1 Hz
Dimensions:
3000x3000x10 m
Element size:
21.4x21.4x10 m

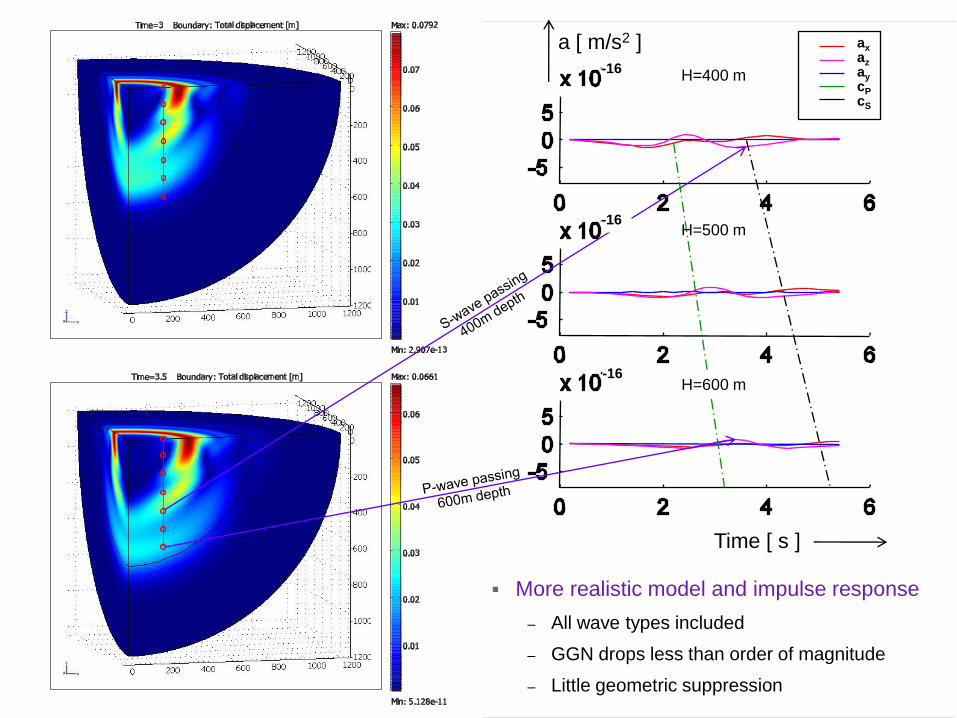
ax
az
ay
cP
cs
H=0 m
H=100 m
H=200 m
H=300 m
-16
-16
-16
-16
Time [ s ]
a [ m/s2 ]
Impulse response- halve space
- damping
ax
az
ay
cP
cS
H=400 m
H=500 m
H=600 m
Time [ s ]
a [ m/s2 ]-16
-16
-16
More realistic model and impulse response
– All wave types included
– GGN drops less than order of magnitude
– Little geometric suppression

LISA
Decomposition of GGN signal
×10-16
×10-16
z
x
GGN composition
– Both surface and bulk contributions
– GGN signal `instantaneous’, sensors delayed response
– GGN subtractions schemes under study

LISA
Summary
Site selection
– Possible sites feature
– Ambient seismic noise around 1 nm/rtHz at 1 Hz
– For frequencies > 1 Hz noise depends on 1/f2
– (Use as input for FEA)
– Avoid the following locations
– Sites near heavy industrialization
– Large population concentrations
– Use hard geology
– Good quality rock: e.g. granite; perhaps layered geology
Gravity gradient noise
– Limits sensitivity at low frequencies (1 – 10 Hz)
– FEA studies (and GGN subtraction schemes) in progress