EIIP Volume II: CH 4, Preferred and Alternative Methods...
122
VOLUME VOLUME II: II: CHAPTER CHAPTER 4 PREFERRED AND ALTERNATIVE METHODS FOR ESTIMATING FUGITIVE EMISSIONS FROM EQUIPMENT LEAKS Final Final Report Report November November 1996 1996 Prepared by: Eastern Research Group 1600 Perimeter Park Post Office Box 2010 Morrisville, North Carolina 27560 Prepared for: Point Sources Committee Emission Inventory Improvement Program
Transcript of EIIP Volume II: CH 4, Preferred and Alternative Methods...
VOLUMEVOLUME II:II: CHAPTERCHAPTER 44
PREFERRED AND ALTERNATIVEMETHODS FOR ESTIMATINGFUGITIVE EMISSIONS FROMEQUIPMENT LEAKS
FinalFinal ReportReport
NovemberNovember 19961996
Prepared by:Eastern Research Group1600 Perimeter ParkPost Office Box 2010Morrisville, North Carolina 27560
Prepared for:Point Sources CommitteeEmission Inventory Improvement Program

DISCLAIMER
As the Environmental Protection Agency has indicated in Emission Inventory ImprovementProgram (EIIP) documents, the choice of methods to be used to estimate emissions depends onhow the estimates will be used and the degree of accuracy required. Methods using site-specificdata are preferred over other methods. These documents are non-binding guidance and not rules. EPA, the States, and others retain the discretion to employ or to require other approaches thatmeet the requirements of the applicable statutory or regulatory requirements in individualcircumstances.

ACKNOWLEDGEMENT
This document was prepared by David Epperson of Eastern Research Group, Inc.,Wiley Barbour of the Office of Policy, Planning and Evaluation, U.S. EnvironmentalProtection Agency, and Marco Zarate of Radian International LLC for the Point SourcesCommittee, Emission Inventory Improvement Program and for Dennis Beauregard of theEmission Factor and Inventory Group, U.S. Environmental Protection Agency. Members ofthe Point Sources Committee contributing to the preparation of this document are:
Denise Alston-Guiden, Galsen CorporationPaul Brochi, Texas Natural Resource Conservation CommissionBob Betterton, South Carolina Department of Health and Environmental ControlAlice Fredlund, Louisana Department of Environmental QualityBill Gill, Co-Chair, Texas Natural Resource Conservation CommissionKarla Smith Hardison, Texas Natural Resource Conservation CommissionGary Helm, Air Quality Management, Inc.Paul Kim, Minnesota Pollution Control AgencyToch Mangat, Bay Area Air Quality Management DistrictRalph Patterson, Wisconsin Department of Natural ResourcesJim Southerland, North Carolina Department of Environment, Health and Natural ResourcesEitan Tsabari, Omaha Air Quality Control DivisionRobert Wooten, North Carolina Department of Environment, Health and Natural Resources
EIIP Volume II iii

CHAPTER 4 - EQUIPMENT LEAKS 11/29/96
This page is intentionally left blank.
EIIP Volume IIiv

CONTENTS
Section Page
1 Introduction . . . . . . . . . . . . . . . . . . . . . . . . . . . . . . . . . . . . . . . . . . . . . . . .4.1-1
2 General Source Category Description. . . . . . . . . . . . . . . . . . . . . . . . . . . . . . .4.2-1
2.1 Source Category Description. . . . . . . . . . . . . . . . . . . . . . . . . . . . . . . .4.2-12.1.1 Pumps . . . . . . . . . . . . . . . . . . . . . . . . . . . . . . . . . . . . . . . . . .4.2-12.1.2 Valves . . . . . . . . . . . . . . . . . . . . . . . . . . . . . . . . . . . . . . . . . .4.2-22.1.3 Compressors. . . . . . . . . . . . . . . . . . . . . . . . . . . . . . . . . . . . . .4.2-22.1.4 Pressure Relief Devices. . . . . . . . . . . . . . . . . . . . . . . . . . . . . .4.2-22.1.5 Connectors and Flanges. . . . . . . . . . . . . . . . . . . . . . . . . . . . . .4.2-22.1.6 Agitators. . . . . . . . . . . . . . . . . . . . . . . . . . . . . . . . . . . . . . . . .4.2-32.1.7 Open-Ended Lines. . . . . . . . . . . . . . . . . . . . . . . . . . . . . . . . . .4.2-32.1.8 Sampling Connections. . . . . . . . . . . . . . . . . . . . . . . . . . . . . . .4.2-4
2.2 Pollutant Coverage. . . . . . . . . . . . . . . . . . . . . . . . . . . . . . . . . . . . . .4.2-42.2.1 Total Organic Compounds. . . . . . . . . . . . . . . . . . . . . . . . . . . . .4.2-42.2.2 Speciated Organics/Hazardous and Toxic Air Pollutants. . . . . . . . 4.2-42.2.3 Inorganic Compounds. . . . . . . . . . . . . . . . . . . . . . . . . . . . . . . .4.2-4
2.3 Estimation of Control Efficiencies for Equipment Leak ControlTechniques. . . . . . . . . . . . . . . . . . . . . . . . . . . . . . . . . . . . . . . . . . . .4.2-52.3.1 Replacement/Modification of Existing Equipment. . . . . . . . . . . .4.2-52.3.2 Leak Detection and Repair (LDAR) Programs. . . . . . . . . . . . . . .4.2-8
3 Overview of Available Methods. . . . . . . . . . . . . . . . . . . . . . . . . . . . . . . . . .4.3-1
3.1 Emission Estimation Approaches. . . . . . . . . . . . . . . . . . . . . . . . . . . . .4.3-1
3.2 Speciating Emissions. . . . . . . . . . . . . . . . . . . . . . . . . . . . . . . . . . . . .4.3-6
3.3 Organic Compound Emission Estimates From EquipmentContaining Non-VOCs. . . . . . . . . . . . . . . . . . . . . . . . . . . . . . . . . . . .4.3-6
3.4 Inorganic Compound Emission Estimates. . . . . . . . . . . . . . . . . . . . . . .4.3-7
EIIP Volume II v

CONTENTS (CONTINUED)
Section Page
3.5 Description of Available Procedures for Collecting Equipment LeaksData . . . . . . . . . . . . . . . . . . . . . . . . . . . . . . . . . . . . . . . . . . . . . . . .4.3-83.5.1 Source Screening. . . . . . . . . . . . . . . . . . . . . . . . . . . . . . . . . . .4.3-83.5.2 Mass Emissions Sampling (Bagging). . . . . . . . . . . . . . . . . . . .4.3-12
3.6 Comparison of Available Emission EstimationMethodologies/Approaches. . . . . . . . . . . . . . . . . . . . . . . . . . . . . . . .4.3-17
4 Preferred Method for Estimating Emissions. . . . . . . . . . . . . . . . . . . . . . . . . .4.4-1
5 Alternative Methods for Estimating Emissions. . . . . . . . . . . . . . . . . . . . . . . .4.5-1
5.1 Emission Calculations Using the Average Emission FactorApproach . . . . . . . . . . . . . . . . . . . . . . . . . . . . . . . . . . . . . . . . . . . . .4.5-1
5.2 Emission Calculations Using the Screening Ranges Approach. . . . . . . . . 4.5-6
5.3 Emission Calculations Using Unit-Specific Correlation Approach. . . . . . 4.5-7
6 Quality Assurance/Quality Control Procedures. . . . . . . . . . . . . . . . . . . . . . . .4.6-1
6.1 Screening and Bagging Data Collection. . . . . . . . . . . . . . . . . . . . . . . .4.6-1
6.2 Other QA/QC Issues. . . . . . . . . . . . . . . . . . . . . . . . . . . . . . . . . . . . .4.6-5
6.3 Data Attribute Rating System (DARS) Scores. . . . . . . . . . . . . . . . . . . .4.6-5
7 Data Coding Procedures. . . . . . . . . . . . . . . . . . . . . . . . . . . . . . . . . . . . . . . .4.7-1
8 References. . . . . . . . . . . . . . . . . . . . . . . . . . . . . . . . . . . . . . . . . . . . . . . . .4.8-1
Appendix A: Estimating Leak Detection and Repair (LDAR) Control EffectivenessAppendix B: Source Screening - Response FactorsAppendix C: Mass Emission Sampling - Methods and Calculation ProceduresAppendix D: Example Data Collection Form
EIIP Volume IIvi

FIGURES AND TABLES
Figures Page
4.3-1 Overview of Data Collection and Analysis Approaches for DevelopingEquipment Leak Emissions Inventory. . . . . . . . . . . . . . . . . . . . . . . . . . . . . .4.3-4
4.3-2 HW-101 Portable Organic Compound DetectionInstrument (HNU Systems, Inc.). . . . . . . . . . . . . . . . . . . . . . . . . . . . . . . . .4.3-14
4.3-3 OVA-108 Portable Organic Compound DetectionInstrument (Foxboro). . . . . . . . . . . . . . . . . . . . . . . . . . . . . . . . . . . . . . . . .4.3-15
4.3-4 TVA-1000 Portable Organic/Inorganic Compound DetectionInstrument (Foxboro). . . . . . . . . . . . . . . . . . . . . . . . . . . . . . . . . . . . . . . . .4.3-16
4.6-1 Example Field Sheet for Equipment Screening Data. . . . . . . . . . . . . . . . . . . .4.6-2
4.6-2 Example Data Collection Form for Fugitive Emissions Bagging Test(Vacuum Method) . . . . . . . . . . . . . . . . . . . . . . . . . . . . . . . . . . . . . . . . . . . .4.6-3
4.6-3 Example Data Collection Form for Fugitive Emissions Bagging Test(Blow-Through Method). . . . . . . . . . . . . . . . . . . . . . . . . . . . . . . . . . . . . . . .4.6-4
Tables Page
4.2-1 Summary of Equipment Modifications. . . . . . . . . . . . . . . . . . . . . . . . . . . . . .4.2-6
4.2-2 Control Effectiveness for an LDAR Program at a SOCMI Process Unit. . . . . . 4.2-10
4.2-3 Control Effectiveness for LDAR Component Monitoring Frequencies forPetroleum Refineries. . . . . . . . . . . . . . . . . . . . . . . . . . . . . . . . . . . . . . . . .4.2-11
4.3-1 List of Variables and Symbols. . . . . . . . . . . . . . . . . . . . . . . . . . . . . . . . . . .4.3-2
4.3-2 Equipment Leak Emission Sources. . . . . . . . . . . . . . . . . . . . . . . . . . . . . . . .4.3-9
4.3-3 EPA Reference Method 21 Performance Criteria forPortable Organic Compound Detectors. . . . . . . . . . . . . . . . . . . . . . . . . . . . .4.3-11
EIIP Volume II vii

FIGURES AND TABLES (CONTINUED)
Tables Page
4.3-4 Portable Organic Compound Detection Instruments. . . . . . . . . . . . . . . . . . . .4.3-13
4.3-5 Summary of the Advantages and Disadvantages of Preferred andAlternative Emission Estimation Approaches for Equipment Leaks. . . . . . . . . 4.3-18
4.4-1 Sample Data for Example Calculations. . . . . . . . . . . . . . . . . . . . . . . . . . . . . .4.4-2
4.4-2 EPA Correlation Equation Method. . . . . . . . . . . . . . . . . . . . . . . . . . . . . . . . .4.4-3
4.4-3 Correlation Equations, Default Zero Emission Rates, and PeggedEmission Rates for Estimating SOCMI TOC Emission Rates. . . . . . . . . . . . . .4.4-5
4.4-4 Correlation Equations, Default Zero Emission Rates, and PeggedEmission Rates for Estimating Petroleum Industry TOCEmission Rates. . . . . . . . . . . . . . . . . . . . . . . . . . . . . . . . . . . . . . . . . . . . . .4.4-6
4.5-1 SOCMI Average Emission Factors. . . . . . . . . . . . . . . . . . . . . . . . . . . . . . . .4.5-2
4.5-2 Refinery Average Emission Factors. . . . . . . . . . . . . . . . . . . . . . . . . . . . . . . .4.5-3
4.5-3 Average Emission Factor Method. . . . . . . . . . . . . . . . . . . . . . . . . . . . . . . . .4.5-5
4.5-4 Screening Value Ranges Method. . . . . . . . . . . . . . . . . . . . . . . . . . . . . . . . . .4.5-8
4.6-1 DARS Scores: EPA Correlation Approach. . . . . . . . . . . . . . . . . . . . . . . . . . .4.6-6
4.6-2 DARS Scores: Average Emission Factor Approach. . . . . . . . . . . . . . . . . . . . .4.6-6
4.6-3 DARS Scores: Unit-Specific Correlation Approach. . . . . . . . . . . . . . . . . . . . .4.6-7
4.7-1 Source Classification Codes and Descriptions for Fugitive Emissionsfrom Equipment Leaks. . . . . . . . . . . . . . . . . . . . . . . . . . . . . . . . . . . . . . . . .4.7-2
EIIP Volume IIviii

1
INTRODUCTIONThe purposes of this document are to present general information on methodologies and/orapproaches for estimating air emissions from equipment leaks in a clear and concise mannerand to provide specific example calculations to aid in the preparation and review of emissioninventories.
Because documents describing procedures for estimating emissions from equipment leaks arereadily available, duplication of detailed information will be avoided in this document. Thereader is referred to the following reports that were used to develop this document:
Environmental Protection Agency (EPA). November 1995.Protocol forEquipment Leak Emission Estimates. EPA-453/R-95-017; U.S. EnvironmentalProtection Agency, Office of Air and Radiation, Office of Air Quality Planningand Standards, Research Triangle Park, North Carolina;
Chemical Manufacturers Association (CMA). 1989.Improving Air Quality:Guidance for Estimating Fugitive Emissions.Second Edition. Washington,DC; and,
During the development of this guideline document, results of recent studies developed by theEPA for the petroleum industry were incorporated (Epperson, January, 1995). Thisinformation is available on the Office of Air Quality Planning and Standards (OAQPS)Technology Transfer Network (TTN) (under the Clearinghouse for Inventoriesand Emission Factors [CHIEF]).
Section 2 of this chapter contains a general description of the equipment leak sources, such asvalves, pumps, and compressors and also includes information on equipment leak controltechniques and efficiencies. Section 3 of this chapter provides an overview of availableapproaches for estimating emissions from equipment leaks. Four main approaches arediscussed and compared in Section 3: (1) average emission factor; (2) screening ranges; (3)EPA correlation equation; and (4) unit-specific correlation equations. Also included in thissection are descriptions of available procedures for collecting equipment leaks data and acomparison of available emission estimation approaches. Section 4 presents the preferredmethod for estimating emissions, while Section 5 presents alternative emission estimationmethods. Quality assurance and control procedures are described in Section 6 and datacoding procedures are discussed in Section 7. References are listed in Section 8.
EIIP Volume II 4.1-1

CHAPTER 4 - EQUIPMENT LEAKS 11/29/96
Appendix A presents information on how to estimate the control effectiveness of leakdetection and repair (LDAR) programs. Appendix B presents additional information onresponse factors (RFs) and some guidelines on how to evaluate whether an RF correction to ascreening value should be made. Appendix C of this chapter presents general information onmethods and calculation procedures for mass emissions sampling (bagging). Appendix Dpresents an example data collection form that can be used for gathering information toestimate fugitive emissions from equipment leaks.
EIIP Volume II4.1-2

2
GENERAL SOURCE CATEGORYDESCRIPTION
2.1 SOURCE CATEGORY DESCRIPTION
Emissions occur from process equipment whenever components in the liquid or gas streamleak. These emissions generally occur randomly and are difficult to predict. In addition,these emissions may be intermittent and vary in intensity over time. Therefore, measurementsof equipment leak emissions actually represent a "snapshot" of the leaking process. There areseveral potential sources of equipment leak emissions. Components such as pumps, valves,pressure relief valves, flanges, agitators, and compressors are potential sources that can leakdue to seal failure. Other sources, such as open-ended lines, and sampling connections mayleak to the atmosphere for reasons other than faulty seals. The majority of data collected forestimating equipment leak emissions has been for total organic compounds and non-methaneorganic compounds. Equipment leak emission data have been collected from the followingindustry segments:
Synthetic Organic Chemical Manufacturing Industry (SOCMI);
Petroleum Refineries;
Petroleum Marketing Terminals; and
Oil and Gas Production Facilities.
Each of these emission sources is briefly described in this section. A more detaileddiscussion of these sources can be found in theProtocol for Equipment Leak EmissionEstimates(EPA, November 1995) and theEquipment Leaks Enabling Document(EPA,July 1992).
2.1.1 PUMPS
Pumps are used extensively in the petroleum and chemical industries for the movement ofliquids. The centrifugal pump is the most widely used pump type in the chemical industry;however, other types, such as the positive displacement (reciprocating) pump, are also used.Chemicals transferred by pump can leak at the point of contact between the moving shaft andthe stationary casing. Consequently, all pumps except the sealless type, such as canned-motor, magnetic drive, and diaphragm pumps, require a seal at the point where the shaftpenetrates the housing in order to isolate the pumped fluid from the environment.
EIIP Volume II 4.2-1

CHAPTER 4 - EQUIPMENT LEAKS 11/29/96
Two generic types of seals, packed and mechanical, are used on pumps. Packed seals can beused on both reciprocating and centrifugal pumps. A packed seal consists of a cavity("stuffing box") in the pump casing filled with packing gland to form a seal around the shaft.Mechanical seals are limited in application to pumps with rotating shafts. There are singleand dual mechanical seals, with many variations to their basic design and arrangement, but allhave a lapped seal face between a stationary element and a rotating seal ring.
2.1.2 VALVES
Except for connectors, valves are the most common and numerous process equipment typefound in the petroleum and chemical industries. Valves are available in many designs, andmost contain a valve stem that operates to restrict or allow fluid flow. Typically, the stem issealed by a packing gland or O-ring to prevent leakage of process fluid to the atmosphere.Emissions from valves occur at the stem or gland area of the valve body when the packing orO-ring in the valve fails.
2.1.3 COMPRESSORS
Compressors provide motive force for transporting gases through a process unit in much thesame way that pumps transport liquids. Compressors are typically driven with rotating orreciprocating shafts. Thus, the sealing mechanisms for compressors are similar to those forpumps (i.e., packed and mechanical seals).
2.1.4 PRESSURE RELIEF DEVICES
Pressure relief devices are safety devices commonly used in petroleum and chemical facilitiesto prevent operating pressures from exceeding the maximum allowable working pressures ofthe process equipment. Note that it is not considered an equipment leak-type emission whena pressure relief device functions as designed during an over pressure incident allowingpressure to be reduced. Equipment leaks from pressure relief devices occur when materialescapes from the pressure relief device during normal operation. The most common pressurerelief valve (PRV) is spring-loaded. The PRV is designed to open when the operatingpressure exceeds a set pressure and to reseat after the operating pressure has decreased tobelow the set pressure. Another pressure relief device is a rupture disk (RD) which does notresult in equipment leak emissions. The disks are designed to remain whole and intact, andburst at a set pressure.
2.1.5 CONNECTORS AND FLANGES
Connectors and flanges are used to join sections of piping and equipment. They are usedwherever pipes or other equipment (such as vessels, pumps, valves, and heat exchangers)require isolation or removal. Flanges are bolted, gasket-sealed connectors and are normally
EIIP Volume II4.2-2

11/29/96 CHAPTER 4 - EQUIPMENT LEAKS
used for pipes with diameters of 2.0 inches or greater. The primary causes of flange leakageare poor installation, aging and deterioration of the sealant, and thermal stress. Flanges canalso leak if improper gasket material is chosen.
Threaded fittings (connectors) are made by cutting threads into the outside end of one piece(male) and the inside end of another piece (female). These male and female parts are thenscrewed together like a nut and bolt. Threaded fittings are normally used to connect pipingand equipment having diameters of 2.0 inches or less. Seals for threaded fittings are made bycoating the male threads with a sealant before joining it to the female piece. The sealant maybe a polymeric tape, brush-on paste, or other spreadable material that acts like glue in thejoint. These sealants typically need to be replaced each time the joint is broken. Emissionscan occur as the sealant ages and eventually cracks. Leakage can also occur as the result ofpoor assembly or sealant application, or from thermal stress on the piping and fittings.
In the 1993 petroleum industry studies, flanges were analyzed separately from connectors.Non-flanged connectors (or just connectors) were defined as plugs, screwed or threadedconnectors, and union connectors that ranged in diameter from 0.5 to 8.0 inches, but weretypically less than 3.0 inches in diameter. Flanged connectors (flanges) were larger, withdiameters in some cases of 22.0 inches or more.
2.1.6 AGITATORS
Agitators are used in the chemical industry to stir or blend chemicals. Four seal arrangementsare commonly used with agitators: packed seals, mechanical seals, hydraulic seals, and lipseals. Packed and mechanical seals for agitators are similar in design and application topacked and mechanical seals for pumps. In a hydraulic seal, an annular cup attached to theprocess vessel contains a liquid that contracts an inverted cup attached to the rotating agitatorshaft. Although the simplest agitator shaft seal, the hydraulic seal, is limited to lowtemperature/low pressure applications, and can handle only very small pressure changes. Alip seal consists of a spring-loaded, nonlubricated elastomer element, and is limited inapplication to low-pressure, top-entering agitators.
2.1.7 OPEN-ENDED LINES
Some valves are installed in a system so that they function with the downstream line open tothe atmosphere. A faulty valve seat or incompletely closed valve on such an open-ended linewould result in a leakage through the open end.
2.1.8 SAMPLING CONNECTIONS
Sampling connections are used to obtain samples from within the process. Emissions occuras a result of purging the sampling line to obtain a representative sample of the process fluid.
EIIP Volume II 4.2-3
CHAPTER 4 - EQUIPMENT LEAKS 11/29/96
2.2 POLLUTANT COVERAGE
2.2.1 TOTAL ORGANIC COMPOUNDS
The majority of data collected for estimating equipment leaks within the petroleum and gasindustries and the SOCMI has been for total organic compounds and non-methane organiccompounds. Therefore, the emission factors and correlations developed for emissionestimation approaches are intended to be used for estimating total organic compound (TOC)emissions.
2.2.2 SPECIATED ORGANICS/HAZARDOUS AND TOXIC AIR POLLUTANTS
Because material in equipment within a process unit is often a mixture of several chemicals,equipment leak emission estimates for specific volatile organic compounds (VOCs), hazardousair pollutants (HAPs), and/or pollutants under Section 112(r) of the Clean Air Act, asamended can be obtained by multiplying the TOC emissions from a particular equipmenttimes the ratio of the concentration of the specific VOC/pollutant to the TOC concentration,both in weight percent. An assumption in the above estimation is that the weight percent ofthe chemicals in the mixture contained in the equipment will equal the weight percent of thechemicals in the leaking material. In general, this assumption should be accurate for single-phase streams containing any gas/vapor material or liquid mixtures containing constituents ofsimilar volatilities. Engineering judgement should be used to estimate emissions of individualchemical species, in cases when:
The material in the equipment piece is a liquid mixture of constituents withvarying volatilities; or
It is suspected that the leaking vapor will have different concentrations than theliquid.
2.2.3 INORGANIC COMPOUNDS
The emission estimation approaches developed for estimating TOC emissions may be used toestimate emissions of inorganic compounds--particularly for volatile compounds or thosepresent as a gas/vapor. Also, in the event that there is no approach available to estimate theconcentration of the inorganic compound at the leak interface, the average emission factorsdeveloped for organic compounds can be used; however, the accuracy of the emissionestimate will be unknown.
2.3 ESTIMATION OF CONTROL EFFICIENCIES FOR EQUIPMENT LEAKCONTROL TECHNIQUES
EIIP Volume II4.2-4

11/29/96 CHAPTER 4 - EQUIPMENT LEAKS
Two primary techniques are used to reduce equipment leak emissions: (1) modifying orreplacing existing equipment, and (2) implementing an LDAR program. Equipmentmodifications are applicable for each of the leaking equipment described in this section. AnLDAR program is a structured program to detect and repair equipment that are identified asleaking; however, it is more effective on some equipment than others.
The use of equipment modifications and equipment included in an LDAR program arepredicated by state and federal regulations that facilities/process units are required to meet. Inmost equipment leak regulations, a combination of equipment modifications and LDARrequirements are used. Table 4.A-1 in Appendix A of this chapter summarizes requirementsin several federal equipment leak control regulations.
2.3.1 REPLACEMENT/MODIFICATION OF EXISTING EQUIPMENT
Controlling emissions by modifying existing equipment is achieved by either installingadditional equipment that eliminates or reduces emissions, or replacing existing equipmentwith sealless types. Equipment modifications that can be used for each type of equipmentdescribed in this section, and their corresponding emission control efficiencies are presentedin Table 4.2-1. A closed-vent system is a typical modification for pumps, compressors, andpressure relief devices. A closed-vent system captures leaking vapors and routes them to acontrol device. The control efficiency of a closed-vent system depends on the efficiency ofthe vapor transport system and the efficiency of the control device. A closed-vent system canbe installed on a single piece of equipment or on a group of equipment pieces. A descriptionof the controls by equipment type are briefly presented below.
Pumps
Equipment modifications that are control options for pumps include: (1) routing leakingvapors to a closed-vent system, (2) installing a dual mechanical seal containing a barrier fluid,or (3) replacing the existing pump with a sealless type. Dual mechanical seals and seallesspumps are discussed in detail in Chapter 5 of theEquipment Leaks Enabling Document(EPA,July 1992). The control efficiency of sealless pumps and a dual mechanical seal with abarrier fluid at a higher pressure than the pumped fluid is essentially 100 percent, assumingboth the inner and outer seal do not fail simultaneously.
EIIP Volume II 4.2-5

CHAPTER 4 - EQUIPMENT LEAKS 11/29/96
TABLE 4.2-1
SUMMARY OF EQUIPMENT MODIFICATIONS
Equipment Type Modification
ApproximateControl
Efficiency(%)
Pumps Sealless design 100a
Closed-vent system 90b
Dual mechanical seal with barrier fluidmaintained at a higher pressure than thepumped fluid
100
Valves Sealless design 100a
Compressors Closed-vent system 90b
Dual mechanical seal with barrier fluidmaintained at a higher pressure than thecompressed gas
100
Pressure reliefdevices
Closed-vent systemc
Rupture disk assembly 100
Connectors Weld together 100
Open-ended lines Blind, cap, plug, or second valve 100
Samplingconnections
Closed-loop sampling 100
a Sealless equipment can be a large source of emissions in the event of equipment failure.b Actual efficiency of a closed-vent system depends on percentage of vapors collected and the efficiency
of the control device to which the vapors are routed.c Control efficiency of closed vent-systems installed on a pressure relief device may be lower than other
closed-vent systems because they must be designed to handle both potentially large and small volumesof vapor.
EIIP Volume II4.2-6

11/29/96 CHAPTER 4 - EQUIPMENT LEAKS
Valves
Emissions from process valves can be eliminated if the valve stem can be isolated from theprocess fluid, (i.e., using sealless valves). Two types of sealless valves, diaphragm valves andsealed bellows, are available. The control efficiency of both diaphragm and sealed bellowedvalves is essentially 100 percent.
Compressors
Emissions from compressors may be reduced by collecting and controlling the emissions fromthe seal using a closed-vent system or by improving seal performance by using a dualmechanical seal system similar to pumps. The dual mechanical seal system has an emissionscontrol efficiency of 100 percent, assuming both the inner and outer seal do not failsimultaneously.
Pressure Relief Valves
Equipment leaks from pressure relief valves (PRVs) occur as a result of improper reseating ofthe valve after a release, or if the process is operating too close to the set pressure of thePRV and the PRV does not maintain the seal. There are two primary equipmentmodifications that can be used for controlling equipment leaks from pressure relief devices:(1) a closed-vent system, or (2) use of a rupture disk in conjunction with the PRV.
The equipment leak control efficiency for a closed-vent system installed on a PRV may notbe as high as what can be achieved for other pieces of equipment because emissions fromPRVs can have variable flow during an overpressure situation and it may be difficult todesign a control device to efficiently handle both high and low flow emissions. Rupture diskscan be installed upstream of a PRV to prevent fugitive emissions through the PRV seat. Thecontrol efficiency of a rupture disk/PRV combination is essentially 100 percent when operatedand maintained properly.
Connectors and Flanges
In cases where connectors are not required for safety, maintenance, process modification, orperiodic equipment removal, emissions can be eliminated by welding the connectors together.
Open-Ended Lines
Emissions from open-ended lines can be controlled by properly installing a cap, plug, orsecond valve to the open end. The control efficiency of these measures is essentially100 percent.
EIIP Volume II 4.2-7

CHAPTER 4 - EQUIPMENT LEAKS 11/29/96
Sampling Connections
Emissions from sampling connections can be reduced by using a closed-loop sampling systemor by collecting the purged process fluid and transferring it to a control device or back to theprocess. The efficiency of a closed-loop system is 100 percent.
2.3.2 LEAK DETECTION AND REPAIR (LDAR) PROGRAMS
An LDAR program is a structured program to detect and repair equipment that is identified asleaking. A portable screening device is used to identify (monitor) pieces of equipment thatare emitting sufficient amounts of material to warrant reduction of the emissions throughsimple repair techniques. These programs are best applied to equipment types that can berepaired on-line, resulting in immediate emissions reduction.
An LDAR program may include most types of equipment leaks; however, it is best-suited tovalves and pumps and can also be implemented for connectors. For other equipment types,an LDAR program is not as applicable. Compressors are repaired in a manner similar topumps; however, because compressors ordinarily do not have a spare for bypass, a processunit shutdown may be required for repair. Open-ended lines are most easily controlled byequipment modifications. Emissions from sampling connections can only be reduced bychanging the method of collecting the sample, and cannot be reduced by an LDAR program.Safety considerations may preclude the use on an LDAR program on pressure relief valves.
The control efficiency of an LDAR program is dependent on three factors: (1) how a leak isdefined, (2) the monitoring frequency of the LDAR program, and (3) the final leak frequencyafter the LDAR program is implemented. The leak definition is the screening value measuredby a portable screening device at which a leak is indicated if a piece of equipment screensequal to or greater than that value. Screening values are measured as concentrations in partsper million by volume (ppmv). The leak definition is a given part of an LDAR program andcan either be defined by the facility implementing the program or by an equipment standardto which the facility must comply. Table 4.A-1 in Appendix A of this document providesequipment leak screening values for several equipment leak control programs. Themonitoring frequency is the number of times a year (daily, weekly, monthly, quarterly, yearly)that equipment are monitored with a portable screening device. The monitoring frequencymay be estimated from the initial leak frequency before the LDAR program is implemented,and the final leak frequency after the LDAR program is implemented. The leak frequency isthe fraction of equipment with screening values equal to or greater than the leak definition.The LDAR program control efficiency approach is based on the relationship between thepercentage of equipment pieces that are leaking and the corresponding average leak rate forall of the equipment.
EIIP Volume II4.2-8

11/29/96 CHAPTER 4 - EQUIPMENT LEAKS
Most federal equipment leak control programs have quarterly or monthly monitoringrequirements. However, the LDAR monitoring frequency and leak definitions at some stateequipment leak control programs may be different from federal programs. During theplanning of a LDAR program, it is recommended to contact the local environmental agency tofind out about their LDAR program guidelines and/or requirements.
The EPA has developed control efficiencies for equipment monitored at specified leakdefinitions and frequencies. Tables 4.2-2 and 4.2-3 summarize the control efficiencies forequipment that are monitored quarterly and monthly at a leak definition of 10,000 ppmv,and equipment meeting the LDAR requirements of the National Emission Standard forHazardous Air Pollutants (NESHAP) for hazardous organics known as the Hazardous OrganicNESHAP (HON). Although it was developed for the SOCMI, it is the basis for most newequipment leak regulations for other industries. Appendix A presents information on how todevelop process/facility-specific control efficiencies.
EIIP Volume II 4.2-9

CH
AP
TE
R4
-E
QU
IPM
EN
TLE
AK
S11/29/96
TABLE 4.2-2
CONTROL EFFECTIVENESS FOR AN LDAR PROGRAM AT A SOCMI PROCESS UNIT
Equipment Type and Service
Control Effectiveness (%)
MonthlyMonitoring
10,000 ppmv LeakDefinition
Quarterly Monitoring10,000 ppmv Leak
Definition HONa
Valves - gas 87 67 92
Valves - light liquid 84 61 88
Pumps - light liquid 69 45 75
Compressors - gasb b
93
Connectors - gas and light liquidb
33b
Pressure relief devices - gasb
44b
a Control effectiveness attributed to the requirements of the HON equipment leak regulation is estimated based on equipment-specific leakdefinitions and performance levels.
b Data are not available to estimate control effectiveness.
EIIP
Volum
eII
4.2-10

11/29/96C
HA
PT
ER
4-
EQ
UIP
ME
NT
LEA
KS
TABLE 4.2-3
CONTROL EFFECTIVENESS FOR LDAR COMPONENT MONITORING FREQUENCIES FORPETROLEUM REFINERIES
Equipment Type and Service
Control Effectiveness (%)
MonthlyMonitoring
10,000 ppmv LeakDefinitiona
Quarterly Monitoring10,000 ppmv Leak
Definitiona,b HONa,c
Valves - gas 88 70 96
Valves - light liquid 76 61 95
Pumps - light liquid 68 45 88
Compressors - gasd
33e
Connectors - gas and light liquidf f
81
Pressure relief devices - gasd
44e
a Source: EPA, July 1992.b Source: EPA, April 1982.c Control effectiveness attributed to the requirements of the HON equipment leak regulation is estimated based on equipment-specific leak
definitions and performance levels.d Monthly monitoring of component is not required in any control program.e Rule requires equipment modifications instead of LDAR.f Information not available.
EIIP
Volum
eII
4.2-11

CHAPTER 4 - EQUIPMENT LEAKS 11/29/96
This page is intentionally left blank.
EIIP Volume II4.2-12

3
OVERVIEW OF AVAILABLE METHODSThis section contains general information on the four basic approaches for estimatingequipment leak emissions. The approach used is dependent upon available data, availableresources to develop additional data, and the degree of accuracy needed in the estimate.
Regulatory considerations should also be taken into account in selecting an emissionestimation approach. These considerations may include air toxic evaluations, nonattainmentemission inventory reporting requirements, permit reporting requirements, and employeeexposure concerns.
Each approach is briefly described including its corresponding data requirements. Since datacollection procedures will impact the accuracy of the emission estimate, this section alsoincludes a general description of the two variable procedures for collecting equipment leaksdata, screening and bagging procedures, and available monitoring methods. Finally, a generaldescription for estimating control efficiencies for equipment leak control techniques ispresented. Table 4.3-1 lists the variables and symbols used in the following discussions onemissions estimates.
3.1 EMISSION ESTIMATION APPROACHES
There are four basic approaches for estimating emissions from equipment leaks in a specificprocessing unit. The approaches, in order of increasing refinement, are:
Average emission factor approach;
Screening ranges approach;
EPA correlation approach; and
Unit-specific correlation approach.
The approaches increase in complexity and in the amount of data collection and analysisrequired. All the approaches require some data collection, data analysis and/or statisticalevaluation.
These approaches range from simply applying accurate equipment counts to average emissionfactors to the more complex project of developing unit-specific correlations of mass emission
EIIP Volume II 4.3-1

CHAPTER 4 - EQUIPMENT LEAKS 11/29/96
TABLE 4.3-1
LIST OF VARIABLES AND SYMBOLS
Variable Symbol Units
TOC mass emissions ETOC kg/hr of TOC
VOC mass emissions EVOC kg/hr of VOC
Mass emissions of organic chemical x Ex kg/hr of organic chemical x
Concentration of TOCs WPTOC weight percent of TOCs
VOC concentration WPVOC weight percent of VOCs
Concentration of organic chemical x WPx weight percent of organicchemical x
Average emission factor FA typically, kg/hr per source
Emission factor for screening value≥10,000ppmv
FG kg/hr per source
Emission factor for screening value <10,000ppmv
FL kg/hr per source
Concentration from screening value SV ppmv
EIIP Volume II4.3-2

11/29/96 CHAPTER 4 - EQUIPMENT LEAKS
rates and screening values. In general, the more refined approaches require more data andprovide more accurate emission estimates for a process unit. Also, the more refinedapproaches, especially the unit-specific correlation approach which requires bagging data,require a larger budget to implement the program and develop the correlation equations.
Figure 4.3-1 shows an overview of the data collection and analysis required to apply each ofthe above approaches. All of the approaches require an accurate count of equipmentcomponents by the type of equipment (e.g., valves, pumps, connectors), and for some of theequipment types, the count must be further described by service (e.g., heavy liquid, lightliquid, and gas).
The chemical industry has developed alternative methods for estimating equipment componentcount (CMA, 1989). One of the methods calls for an accurate count of the number of pumpsin the process and the service of the pumps. Equipment components in the entire process arethen estimated through use of the number of pumps. Another method calls for an accuratecount of valves directly associated with a specific piece of equipment using process flowsheets; and then based on the number of valves, the number of flanges and fittings areestimated using ratios (e.g., flanges/valves) A careful selection/development of themethodology used to quantify the equipment component count should be made to accuratelyreflect the equipment leak emission estimates for any facilities and/or process units.
Except for the average emission factor approach, all of the approaches require screening data.Screening data are collected by using a portable monitoring instrument to sample air frompotential leak interfaces on individual pieces of equipment. A screening value is a measureof the concentration of leaking compounds in the ambient air that provides an indication ofthe leak rate from an equipment piece, and is measured in units of parts per million byvolume (ppmv). See "Source Screening" in this section for details about screeningprocedures.
In addition to equipment counts and screening data, the unit-specific correlation approachrequires bagging data. Bagging data consist of screening values and their associatedmeasured leak rates. A leak rate is measured by enclosing an equipment piece in a bag todetermine the actual mass emission rate of the leak. The screening values and measured leakrates from several pieces of equipment are used to develop a unit-specific correlation. Theresulting leak rate/screening value correlation predicts the mass emission rate as a function ofthe screening value. See "Mass Emissions Sampling (Bagging)" in this section for detailsabout bagging procedures.
These approaches are applicable to any chemical- and petroleum-handling facility. However,more than one set of emission factors or correlations have been developed by the EPA andother regulatory agencies, depending upon the type of process unit being considered.
EIIP Volume II 4.3-3

CHAPTER 4 - EQUIPMENT LEAKS 11/29/96
EIIP Volume II4.3-4

11/29/96 CHAPTER 4 - EQUIPMENT LEAKS
EPA data collection on emissions from equipment leaks in SOCMI facilities, refineries, oiland gas production operations, and marketing terminals has yielded emission factors andcorrelations for these source categories. Emission factors and correlations for oil and gasproduction facilities, including well heads, have also been developed by regulatory agenciesand the American Petroleum Institute (CARB, August 1989; API, 1993).
For process units in source categories for which emission factors and/or correlations have notbeen developed, the factors and/or correlations already developed can be utilized. However,appropriate evidence should indicate that the existing emission factors and correlations areapplicable to the source category in question. Criteria for determining the appropriateness ofapplying existing emission factors and correlations to another source category may includeone or more of the following: (1) process design; (2) process operation parameters(i.e., pressure and temperature); (3) types of equipment used; and, (4) types of materialhandled. For example, in most cases, SOCMI emission factors and correlations are applicablefor estimating equipment leak emissions from the polymer and resin manufacturing industry.This is because, in general, these two industries have comparable process design andcomparable process operations; they use the same types of equipment and they tend to usesimilar feedstock with similar operations, molecular weight, density, and viscosity. Therefore,response factors should also be similar for screening values.
In estimating emissions for a given process unit, all equipment components must be screenedfor each class of components. However, in some cases, equipment is difficult or unsafe toscreen or it is not possible to screen every equipment piece due to cost considerations. Thelatter is particularly true for connectors. TheProtocol for Equipment Leak EmissionEstimates(EPA, November 1995) provides criteria for determining how may connectors mustbe screened to constitute a large enough sample size to identify the screening valuedistribution for connectors. However, if the process unit to be screened is subject to astandard which requires the screening of connectors, then all connectors must be screened. Ifthe criteria presented in theProtocol document are met, the average emission rate forconnectors that were connected can be applied to connectors that were not screened. Forequipment types other than connectors, including difficult or unsafe-to-screen equipment, thatare not monitored, the average emission factor approach or the average emission rate for theequipment components that were screened can be used to estimate emissions.
Also, screening data collected at several different times can be used for estimating emissions,as long as the elapsed time between values obtained is known. For example, if quarterlymonitoring is performed on a valve, four screening values will be obtained from the valve inan annual period. The annual emissions from the valve should be calculated by determiningthe emissions for each quarter based on the operational hours for the quarter, and summingthe quarterly emission together to get entire year emissions.
EIIP Volume II 4.3-5

CHAPTER 4 - EQUIPMENT LEAKS 11/29/96
3.2 SPECIATING EMISSIONS
In some cases, it may be necessary to estimate emissions of a specific VOC in a mixture ofseveral chemicals. The equations developed for each one of the approaches (see Sections 4and 5) are used to estimate total VOC emissions; the following equation is used to speciateemissions from a single equipment piece:
where:
(4.3-1)Ex ETOC × WPx/WPTOC
Ex = The mass emissions of organic chemical "x" from the equipment(kg/hr);
ETOC = The TOC mass emissions from the equipment (kg/hr) calculatedfrom either the Average Emission Factor, Screening Ranges,EPA Correlation, or Unit-Specific Correlation approaches;
WPx = The concentration of organic chemical x in the equipment inweight percent; and
WPTOC = The TOC concentration in the equipment in weight percent.
An assumption in the above equation is that the weight percent of the chemicals in themixture contained in the equipment will equal the weight percent of the chemicals in theleaking material. In general, this assumption should be accurate for single-phase streamscontaining any gas/vapor material or liquid mixtures containing constituents of similarvolatilities.
Engineering judgement should be used to estimate emissions of individual chemical speciesfrom liquid mixtures of constituents with varying volatilities or in cases where it is suspectedthat the leaking vapor has different concentrations than the liquid.
3.3 ORGANIC COMPOUND EMISSION ESTIMATES FROM EQUIPMENTCONTAINING NON-VOCS
A very similar approach to the one used to speciate emissions can be used to estimate organiccompound emissions from equipment containing organic compounds not classified as VOCs.Because the concentrations of these compounds (such as methane or ethane) are included withVOC concentrations in the screening value, the emissions associated with the screening valuewill include emissions of the "non-VOCs."
Once TOC emissions have been estimated, the organic compound emissions from a group ofequipment containing similar composition can be calculated using the equation:
EIIP Volume II4.3-6

11/29/96 CHAPTER 4 - EQUIPMENT LEAKS
where:
(4.3-2)EVOC ETOC × WPVOC/WPTOC
EVOC = The VOC mass emissions from the equipment (kg/hr);ETOC = The TOC mass emissions from the equipment (kg/hr) calculated
from either the Average Emission Factor, Screening Ranges,EPA Correlation, or Unit-Specific Correlation approaches;
WPVOC = The concentration of VOC in the equipment in weight percent;and
WPTOC = The TOC concentration in the equipment in weight percent.
3.4 INORGANIC COMPOUND EMISSION ESTIMATES
The emission factors and correlations presented in this document are intended to be applied toestimate emissions of total organic compounds. However, in some cases, it may be necessaryto estimate equipment leak emissions of inorganic compounds, particularly for those existingas gas/vapor or for volatile compounds.
Equipment leak emission estimates of inorganic compounds can be obtained by the followingmethods:
Develop unit-specific correlations;
Use a portable monitoring instrument to obtain actual concentrations of theinorganic compounds and then enter the screening values obtained into theapplicable correlations developed by the EPA;
Use the screening values obtained above and apply the emission factorscorresponding to that screening range; or
Multiply the average emission factor by the component count to estimate theleak rate.
Also, surrogate measurements can be used to estimate emissions of inorganic compounds.For example, potassium iodide (KI) or a similar salt solution is an indicator for equipmentleaks from acid (hydrochloric acid [HCl], hydrofluoric acid [HF]) process lines.
EIIP Volume II 4.3-7

CHAPTER 4 - EQUIPMENT LEAKS 11/29/96
3.5 DESCRIPTION OF AVAILABLE PROCEDURES FOR COLLECTINGEQUIPMENT LEAKS DATA
The Protocol document (EPA, November 1995) provides a consistent approach for collectingequipment leaks data, which will ensure the development of acceptable emission factorsand/or correlation equations for emission estimation purposes. Recognizing the importance ofthe above statement, general information on the two available procedures for collectingequipment leaks data, screening and bagging, is presented in this section.
3.5.1 SOURCE SCREENING
This part of the section provides general information for conducting a screening programon-site and provides a short description of the type of portable analyzers that can be usedwhen conducting screening surveys.
Source screening is performed with a portable organic compound analyzer (screening device).The Protocol document (EPA, November 1995) requires that the portable analyzer probeopening be placed at the leak interface of the equipment component to obtain a "screening"value. The screening value is an indication of the concentration level of any leaking materialat the leak interface.
Some state and local agencies may require different screening procedures with respect to thedistance between the probe and the leak interface. The reader should contact their state orlocal agency to determine the appropriate screening guidelines. However, use of the leak ratecorrelations require screening values gathered as closely as practicable to the leak interface.
The main objective of a screening program is to measure organic compound concentration atany potential leak point associated with a process unit. A list of equipment types that arepotential sources of equipment leak emissions is provided in Table 4.3-2.
The first step is to define the process unit boundaries and obtain a component count of theequipment that could release fugitive emissions. A process unit can be defined as thesmallest set of process equipment that can operate independently and includes all operationsnecessary to achieve its process objective. The use of a simplified flow diagram of theprocess is recommended to note the process streams. The actual screening data collection canbe done efficiently by systematically following each stream.
The procedures outlined in EPA Reference Method 21 —Determination of Volatile OrganicCompound Leaks(40 CFR 60, Appendix A) should be followed to screen each equipmenttype that has been identified. TheProtocol document (EPA, November 1995) describes thelocation on each type of equipment where screening efforts should be concentrated. Forequipment with no moving parts at the leak interface, the probe should be placed directly on
EIIP Volume II4.3-8

11/29/96 CHAPTER 4 - EQUIPMENT LEAKS
TABLE 4.3-2
EQUIPMENT LEAK EMISSION SOURCES
Equipment Types
Pump seals
Compressor seals
Valves
Pressure relief devices
Flanges
Connectors
Open-ended lines
Agitator seals
Othera
Services
Gas/vapor
Light liquid
Heavy liquid
a Includes instruments, loading arms, stuffing boxes, vents, dump leverarms, diaphragms, drains, hatches, meters, polished rods, and vents.
EIIP Volume II 4.3-9

CHAPTER 4 - EQUIPMENT LEAKS 11/29/96
the leak interface (perpendicular, not tangential, to the leak potential interface). On the otherhand, for equipment with moving parts, the probe should be placed approximately 1centimeter off from the leak interface (EPA, November 1995). The Chemical ManufacturersAssociation has also made some suggestions to maintain good screening practices (CMA,1989). Recent ongoing efforts by the American Petroleum Institute have also been focusedon increasing the accuracy of screening readings.
Various portable organic compound detection devices can be used to measure concentrationlevels at the equipment leak interface. Any analyzer can be used provided it meets thespecifications and performance criteria set forth in EPA Reference Method 21.
Reference Method 21 requires that the analyzer meet the following specifications:
The VOC detector should respond to those organic compounds being processed(determined by the response factor [RF]);
Both the linear response range and the measurable range of the instrument forthe VOC to be measured and the calibration gas must encompass the leakdefinition concentration specified in the regulation;
The scale of the analyzer meter must be readable to ±2.5 percent of thespecified leak definition concentration;
The analyzer must be equipped with an electrically driven pump so that acontinuous sample is provided at a nominal flow rate of between 0.1 and3.0 liters per minute;
The analyzer must be intrinsically safe for operation in explosive atmospheres;and
The analyzer must be equipped with a probe or probe extension for samplingnot to exceed 0.25 inch in outside diameter, with a single end opening foradmission of sample.
Note that the suction flow rate span allowed by Reference Method 21 is intended toaccommodate a wide variety of instruments, and manufacturers guidelines for appropriatesuction flow rate should be followed.
In addition to the specifications for analyzers, each analyzer must meet instrumentperformance criteria, including instrument response factor, instrument response time, andcalibration precision. Table 4.3-3 presents the performance criteria requirements that portableorganic compound detectors must meet to be accepted for use in a screening program.
EIIP Volume II4.3-10

11/29/96 CHAPTER 4 - EQUIPMENT LEAKS
TABLE 4.3-3
EPA REFERENCE METHOD 21 PERFORMANCE CRITERIA FOR PORTABLEORGANIC COMPOUND DETECTORSa
Criteria Requirement Time Interval
Instrumentresponse factorb
Must be <10 unlesscorrection curve is used
One time, before detector is put inservice.
Instrumentresponse timec
Must be≤30 seconds One time, before detector is put inservice. If modification to samplepumping or flow configuration ismade, a new test is required.
Calibrationprecisiond
Must be≤10 percent ofcalibration gas value
Before detector is put in service andat 3-month intervals or next use,whichever is later.
a Source: 40 CFR Part 60, Appendix A, EPA Reference Method 21. These performance criteria must bemet in order to use the portable analyzer in question for screening.
b The response factor is the ratio of the known concentration of a VOC to the observed meter readingwhen measured using an instrument calibrated with the reference compound specified in the applicableregulation.
c The response time is the time interval from a step change in VOC concentration at the input of thesampling system to the time at which 90 percent of the corresponding final value is reached asdisplayed on the instrument readout meter.
d The precision is the degree of agreement between measurements of the same known value, expressed asthe relative percentage of the average difference between the meter readings and the knownconcentration to the known concentration; i.e., between two meter readings of a sample of knownconcentration.
EIIP Volume II 4.3-11

CHAPTER 4 - EQUIPMENT LEAKS 11/29/96
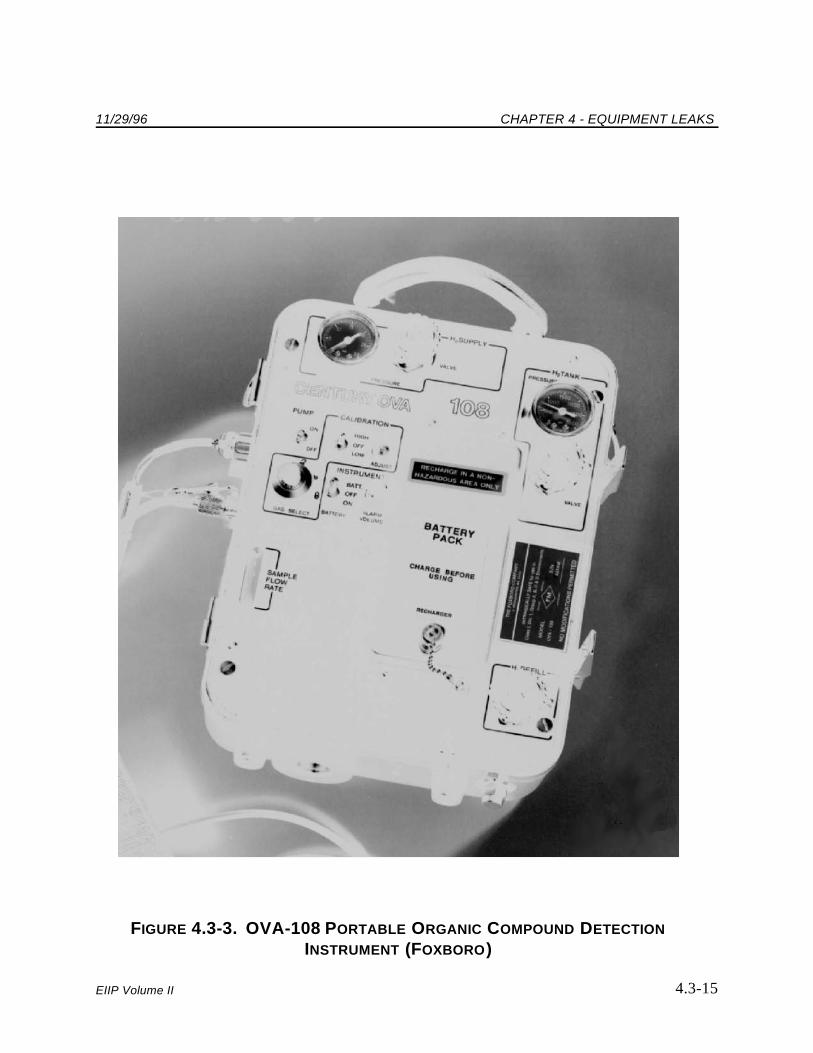
Table 4.3-4 lists several portable organic compound detection instruments, theirmanufacturers, model number, pollutants detected, principle of operation, and range.Figure 4.3-2 shows the HW-101 (HNU Systems, Inc.) instrument, Figure 4.3-3 shows theFoxboro OVA-108, and Figure 4.3-4 shows the Foxboro TVA-1000. When a monitoringdevice does not meet all of the EPA Reference Method 21 requirements, it can still be usedfor the purpose of estimating emissions if its reliability is documented. For information onoperating principles and limitations of portable organic compound detection devices, as wellas specifications and performance criteria, please refer to theProtocol for Equipment LeakEmission Estimatesdocument (EPA, November 1995).
Data loggers are available for use with portable organic compound detection devices to aid inthe collection of screening data and in downloading the data to a computer. Databasemanagement programs are also available to aid in screening data inventory management andcompiling emissions. Contact the American Petroleum Institute or state and local agenciesfor more information about data loggers and database management programs.
As mentioned earlier, screening values are obtained by using a portable monitoring instrumentto detect TOCs at an equipment leak interface. However, portable monitoring instrumentsused to detect TOC concentrations do not respond to different organic compounds equally.To correct screening values to compensate for variations in a monitor’s response to differentcompounds, response factors (RFs) have been developed. An RF relates measuredconcentrations to actual concentrations for specific compounds using specific instruments.
Appendix B of this chapter presents additional information on response factors and includessome guidelines on how to evaluate whether an RF correction to a screening value should bemade.
3.5.2 MASS EMISSIONS SAMPLING (BAGGING)
An equipment component is bagged by enclosing the component to collect leaking vapors. Abag (or tent) made of material that is impermeable to the compound(s) of interest isconstructed around the leak interface of the piece of the equipment.
A known rate of carrier gas is introduced into the bag. A sample of the gas from the bag iscollected and analyzed to determine the concentration (in parts per million by volume [ppmv])of leaking material. The concentration is measured using laboratory instrumentation andprocedures. The use of analytical instrumentation in a laboratory is critical to accuratelyestimate mass emissions. A gas chromatograph (GC) equipped with a flame ionizationdetector or electron capture detector is commonly used to identify individual constituents of asample (EPA, November 1995).Appendix C of this chapter presents general information on the methods generally employedin sampling source enclosures (vacuum and blow-through methods) and presents the
EIIP Volume II4.3-12

11/29/96C
HA
PT
ER
4-
EQ
UIP
ME
NT
LEA
KS
TABLE 4.3-4
PORTABLE ORGANIC COMPOUND DETECTION INSTRUMENTS
ManufacturerModel
NumberPollutant(s)
DetectedDetectionTechnique Range
Bacharach Instrument Co., SantaClara, California
L Combustible gases Catalyticcombustion
0 - 100% LELa
TLV Sniffer Combustible gases Catalyticcombustion
0 - 1,000 and0 - 10,000 ppm
FoxboroS. Norwalk, Connecticut
OVA-128 Most organic compounds FID/GCb 0 - 1,000 ppm
OVA-108 Most organic compounds FID/GC 0 - 10,000 ppm
Miran IBX Compounds that absorbinfrared radiation
NDIRc Compound specific
TVA-1000 Most organic and inorganiccompounds
Photoionizationand FID/GC
0.5-2,000 ppm(photoionization)1-50,000 ppm (FID/GC)
Health Consultants Detecto- PAKIII
Most organic compounds FID/GC 0 - 10,000 ppm
HNU Systems, Inc.Newton Upper Falls,Massachusetts
HW-101 Chlorinated hydrocarbons,aromatics, aldehydes,ketones, any substance thatultraviolet light ionizes
Photoionization 0 - 20, 0 - 200 and0 - 2,000 ppm
Mine Safety Appliances Co.,Pittsburgh, Pennsylvania
40 Combustible gases Catalyticcombustion
0 - 10% and0 - 100% LEL
Survey and Analysis, Inc.,Northboro, Massachusetts
On MarkModel 5
Combustible gases Thermalconductivity
0 - 5% and0 - 100% LEL
Rae SystemsSunnyvale, California
MiniRAEPGM-75K
Chlorinated hydrocarbons,aromatics, aldehydes,ketones, any substance thatultraviolet light ionizes
Photoionization 0 - 1,999 ppm
a LEL = Lower explosive limit.b FID/GC = Flame ionization detection/gas chromatography.c NDIR = Nondispersive infrared analysis.
EIIP
Volum
eII
4.3-13

CHAPTER 4 - EQUIPMENT LEAKS 11/29/96
FIGURE 4.3-2. HW-101 PORTABLE ORGANIC COMPOUND DETECTION INSTRUMENT(HNU SYSTEM, INC.)
EIIP Volume II4.3-14
11/29/96 CHAPTER 4 - EQUIPMENT LEAKS
4.3-15EIIP Volume II
FIGURE 4.3-3. OVA-108 PORTABLE ORGANIC COMPOUND DETECTIONINSTRUMENT (FOXBORO)

CHAPTER 4 - EQUIPMENT LEAKS 11/29/96
4.3-16 EIIP Volume II
FIGURE 4.3-4. TVA-1000 PORTABLE ORGANIC/INORGANIC COMPOUNDDETECTION INSTRUMENT (FOXBORO)

11/29/96 CHAPTER 4 - EQUIPMENT LEAKS
calculation procedures for leak rates when using both methods.
The Protocol for Equipment Leak Emission Estimatesdocument provides detailed informationon sampling methods for bagging equipment, considerations for bagging each equipment typeand analytical techniques (EPA, November 1995).
3.6 COMPARISON OF AVAILABLE EMISSION ESTIMATIONMETHODOLOGIES/APPROACHES
Table 4.3-5 identifies the preferred and alternative emission estimation approaches forequipment leaks, and presents their advantages and disadvantages. All four emissionestimation approaches presented are more appropriately applied to the estimation of emissionsfrom equipment population rather than individual equipment pieces.
The preferred approach for estimating fugitive emissions from equipment leaks is to use theEPA correlation equations that relate screening values to mass emission rates. The selectionof the preferred method for emission estimation purposes is based on the degree of accuracyobtained and the amount of resources and cost associated with the method.
Because the equipment leak emissions may occur randomly, intermittently, and vary inintensity over time, the "snapshot" of emissions from a given leak indicated by screeningand/or bagging results, which are used either to develop or apply all of the approaches, mayor may not be representative of the individual leak. However, by taking measurements fromseveral pieces of a given equipment type, the snapshots of individual deviations from theactual leaks offset one another such that the ensemble of leaks should be representative. Allof these approaches are imperfect tools for estimating fugitive emissions from equipmentleaks; however, they are the best tools available. The best of these tools, the preferredmethod, can be expected to account for approximately 50 to 70 percent of the variability ofthe snapshot ensemble of equipment leak emissions.
EIIP Volume II 4.3-17

CHAPTER 4 - EQUIPMENT LEAKS 11/29/96
TABLE 4.3-5
SUMMARY OF THE ADVANTAGES AND DISADVANTAGES OF PREFERRED ANDALTERNATIVE EMISSION ESTIMATION APPROACHES FOR EQUIPMENT LEAKS
PreferredEmission
EstimationApproach
AlternativeEmission
EstimationApproach Advantages Disadvantages
EPACorrelationEquations
Provides a refined emissionestimate when actual screeningvalues are available.
Provides a continuous function overthe entire range of screening valuesinstead of discrete intervals.
Screening value measurements usedwith these correlations should have thesame format as the one followed todevelop the correlations(OVAa/methane).
The development of an instrumentresponse curve may be needed to relatescreening values to actualconcentration.
AverageEmissionFactors
In the absence of screening data,offers good indication of equipmentleak emission rates from equipmentin a process unit.
They are not necessarily an accurateindication of the mass emission ratefrom an individual piece of equipment.Average emission factors do not reflectdifferent site-specific conditions amongprocess units within a source category.
May present the largest potential error(among the other approaches) whenapplied to estimate emissions fromequipment populations.
ScreeningRanges
Offers some refinement over theAverage Emission Factor approach.
Allows some adjustment forindividual unit conditions andoperation.
Available data indicate that measuredmass emission rates can varyconsiderably from the rates predictedby the use of these emission factors.
Process-UnitSpecificCorrelation
The correlations are developed on aprocess unit basis to minimize theerror associated with different leakrate characteristics between units.
High cost.
a Organic vapor analyzer.
EIIP Volume II4.3-18

4
PREFERRED METHOD FORESTIMATING EMISSIONSThe EPA correlation equation approach is the preferred method when actual screening valuesare available. This approach involves entering the screening value into the correlationequation, which predicts the mass emission rate based on the screening value. For newsources, when no actual screening values are available, average emission factors can be usedtemporarily to determine fugitive emissions from equipment leaks until specific and/or betterdata are available. However, it is recommended that the local environmental agency becontacted to discuss the best approach and assumptions when data are not available.
This approach offers a good refinement to estimating emissions from equipment leaks byproviding an equation to predict mass emission rate as a function of screening value for aparticular equipment type. This approach is most valid for estimating emissions from apopulation of equipment and is not intended for estimating emissions from an individualequipment piece over a short time period (i.e., 1 hour). EPA correlation equations relatingscreening values to mass emission rates have been developed by the EPA for SOCMI processunits and for the petroleum industry (EPA, November 1995).
Correlations for SOCMI are available for: (1) gas valves; (2) light liquid valves;(3) connectors; (4) single equation for light liquid pump seals. Correlation equations, for thepetroleum industry that apply to refineries, marketing terminals, and oil and gas productionoperations data are available for: (1) valves; (2) connectors; (3) flanges; and (4) pump seals;(5) open-ended lines; and (6) other. The petroleum industry correlations apply to all servicesfor a given equipment type.
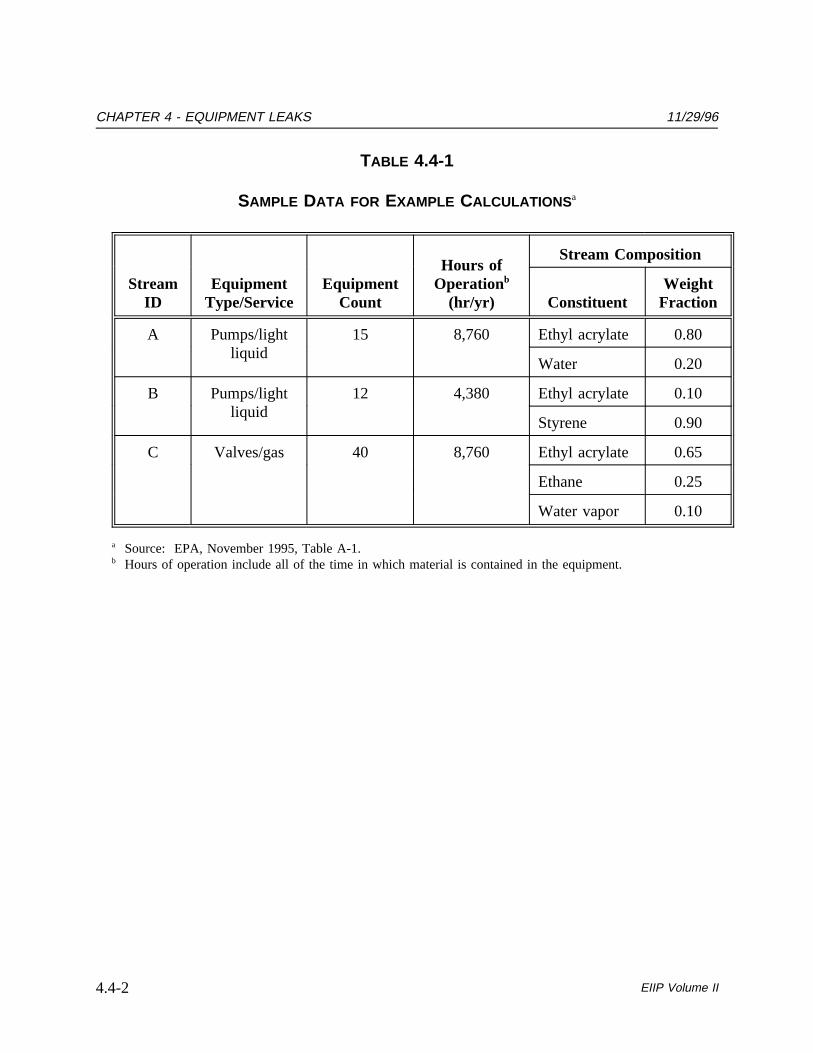
An example of the EPA correlation equation approach is demonstrated for Streams A and Bdescribed in Table 4.4-1. This example is for a hypothetical chemical processing facility andis shown for the sole purpose of demonstrating the emission estimating techniques describedin this chapter. As mentioned before, the correlation approach involves entering screeningvalues into a correlation equation to generate an emission rate for each equipment piece. InTable 4.4-2, example screening values and the resulting emissions for each individualequipment piece are presented. Emissions from the pump that was not screened are estimatedusing the corresponding average emission factor.
EIIP Volume II 4.4-1
CHAPTER 4 - EQUIPMENT LEAKS 11/29/96
TABLE 4.4-1
SAMPLE DATA FOR EXAMPLE CALCULATIONS a
StreamID
EquipmentType/Service
EquipmentCount
Hours ofOperationb
(hr/yr)
Stream Composition
ConstituentWeight
Fraction
A Pumps/lightliquid
15 8,760 Ethyl acrylate 0.80
Water 0.20
B Pumps/lightliquid
12 4,380 Ethyl acrylate 0.10
Styrene 0.90
C Valves/gas 40 8,760 Ethyl acrylate 0.65
Ethane 0.25
Water vapor 0.10
a Source: EPA, November 1995, Table A-1.b Hours of operation include all of the time in which material is contained in the equipment.
EIIP Volume II4.4-2

11/29/96 CHAPTER 4 - EQUIPMENT LEAKS
TABLE 4.4-2
EPA CORRELATION EQUATION METHODa
Equipment IDbScreening Value
(ppmv)VOC Mass Emissions
c
(kg/yr)
A-1A-2A-3A-4A-5A-6A-7A-8A-9A-10A-11A-12A-13A-14A-15
00000
205050
100100200400
1,0002,0005,000
0.0660.0660.0660.0660.0662.04.24.27.47.4
13234987
190
Total Stream A Emissions: 390
B-1B-2B-3B-4B-5B-6B-7B-8B-9B-10B-11
B-12 (100% VOC)d
000
1030
250500
2,0005,0008,000
25,000Not screened
0.0330.0330.0330.551.47.9
144493
14035087
Total Stream B Emissions: 740
Total Emissions 1,130
a Source: EPA, November, 1995, Table A-4.b Equipment type: Light liquid pumps.
Correlation equation: Leak rate (kg/hr) = 1.90 × 10⁻⁵ × (Screening Value)0.824; Default-zero mass emissionrate: 7.49 × 10⁻⁶ kg/hr.Hours of operation: Stream A = 8,760; Stream B = 4,380.
c VOC Emissions = (correlation equation or default-zero emission rate) × (WPVOC/WPTOC) × (hours ofoperation).
d VOC Emissions = (average emission factor) × (wt. fraction of TOC) × (WPVOC/WPTOC) × (hours of operation).
EIIP Volume II 4.4-3

CHAPTER 4 - EQUIPMENT LEAKS 11/29/96
VOC emission estimates using the EPA correlation equation approach are 1,130 kg/yr. Onthe other hand, VOC emission estimates using the average emission factor approach andscreening value range for the same Streams A and B included in Table 4.4-1 are 3,138 and1,480 kg/yr, respectively (see Section 5, Tables 4.5-3 and 4.5-4).
The leak rate/screening value correlations, default zero emission rates, and pegged emissionrates are presented in Table 4.4-3 for SOCMI and in Table 4.4-4 for the petroleum industry.Example calculations utilizing the information presented in Tables 4.4-2 through 4.4-3 aredemonstrated in Example 4.4-1.
The EPA correlation equations can be used to estimate emissions when the adjusted screeningvalue (adjusted for the background concentration) is not a "pegged" screening value (thescreening value that represents the upper detection limit of the monitoring device) or a "zero"screening value (the screening value that represents the minimum detection limit of themonitoring device). All non-zero and non-pegged screening values can be entered directlyinto the EPA correlation equation to predict the mass emissions (kg/hr) associated with theadjusted screening value (ppmv) measured by the monitoring device.
The correlation equations mathematically predict zero emissions for zero screening values(note that any screening value that is less than or equal to ambient [background] concentrationis considered a screening value of zero). However, data collected by EPA show thisprediction to be incorrect. Mass emissions have been measured from equipment having ascreening value of zero. This is because the lower detection limit of the monitoring devicesused is larger than zero and because of the difficulty in taking precise measurements close tozero. The default-zero emission rates are applicable only when the minimum detection limitof the portable monitoring device is 1 ppmv or less above background. In cases where amonitoring device has a minimum detection limit greater than 1 ppmv, the available default-zero emission leak rates presented in Tables 4.4-3 and 4.4-4 of this section are not applicable.For these cases, an alternative approach for determining a default-zero leak rate is to(1) determine one-half theminimum screening value of the monitoring device, and (2) enter this screening value into theapplicable correlation to determine the associated default-zero leak rate.
In instances of pegged screening values, the true screening value is unknown and use of thecorrelation equation is not appropriate. Pegged emission rates have been developed usingmass emissions data associated with known screening values of 10,000 ppmv or greater andfor known screening values of 100,000 ppmv or greater. When the monitoring device ispegged at either of these levels, the appropriate pegged emission rate should be used toestimate the mass emissions of the component.
EIIP Volume II4.4-4

11/29/96C
HA
PT
ER
4-
EQ
UIP
ME
NT
LEA
KS
TABLE 4.4-3
CORRELATION EQUATIONS, DEFAULT ZERO EMISSION RATES, AND PEGGED EMISSION RATES FORESTIMATING SOCMI TOC EMISSION RATESa
Equipment Type
Default ZeroEmission Rate
(kg/hr per source)
Pegged Emission Rates(kg/hr per source)
Correlation Equation(kg/hr per source)b10,000 ppmv 100,000 ppmv
Gas valves 6.6E-07 0.024 0.11 Leak Rate = 1.87E-06 × (SV)0.873
Light liquid valves 4.9E-07 0.036 0.15 Leak Rate = 6.41E-06 × (SV)0.797
Light liquid pumpsc 7.5E-06 0.14 0.62 Leak Rate = 1.90E-05 × (SV)0.824
Connectors 6.1E-07 0.044 0.22 Leak Rate = 3.05E-06 × (SV)0.885
a Source: EPA, November 1995, Tables 2-9, 2-11, and 2-13. To estimate emissions: Use the default zero emission rates only when thescreening value (adjusted for background) equals 0.0 ppmv; otherwise use the correlation equations. If the monitoring device registers apegged value, use the appropriate pegged emission rate.
b SV is the screening value (ppmv) measured by the monitoring device.c The emission estimates for light liquid pump seals can be applied to compressor seals, pressure relief valves, agitator seals, and heavy
liquid pumps.
EIIP
Volum
eII
4.4-5

CH
AP
TE
R4
-E
QU
IPM
EN
TLE
AK
S11/29/96
TABLE 4.4-4
CORRELATION EQUATIONS, DEFAULT ZERO EMISSION RATES, AND PEGGED EMISSION RATES FORESTIMATING PETROLEUM INDUSTRY TOC EMISSION RATESa
Equipment Type/Service
Default ZeroEmission Rate
(kg/hr per source)b
Pegged Emission Rates(kg/hr per source)c
Correlation Equation(kg/hr per source)d
10,000ppmv 100,000 ppmv
Connector/All 7.5E-06 0.028 0.030 Leak Rate = 1.51E-06 × (SV)0.735
Flange/All 3.1E-07 0.085 0.084 Leak Rate = 4.44E-06 × (SV)0.703
Open-Ended Line/All 2.0E-06 0.030 0.079 Leak Rate = 2.16E-06 × (SV)0.704
Pump/All 2.4E-05 0.074 0.160e Leak Rate = 4.82E-05 × (SV)0.610
Valve/All 7.8E-06 0.064 0.140 Leak Rate = 2.28E-06 × (SV)0.746
Otherf/All 4.0E-06 0.073 0.110 Leak Rate = 1.32E-05 × (SV)0.589
a Source: EPA, November 1995, Tables 2-10, 2-12, and 2-14. Developed from the combined 1993 refinery, marketing terminal,and oil and gas production operations data. To estimate emissions: use the default zero emission rates only when the screeningvalue (adjusted for background) equals 0.0 ppmv; otherwise use the correlation equations. If the monitoring device registers apegged value, use the appropriate pegged emission rate.
b Default zero emission rates were based on the combined 1993 refinery and marketing terminal data only (default zero data werenot collected from oil and gas production facilities).
c The 10,000 ppmv pegged emission rate was based on components screened at greater than 10,000 ppmv; however, in some cases,most of the data could have come from components screened at greater than 100,000 ppmv, thereby resulting in similar peggedemission rates for both the 10,000 and 100,000 ppmv pegged levels (e.g., connector and flanges).
d SV is the screening value (ppmv) measured by the monitoring device.e Only two data points were available for the pump 100,000 ppmv pegged emission rate; therefore, the ratio of the pump
10,000 ppmv pegged emission rate to the overall 10,000 ppmv pegged emission rate was multiplied by the overall 100,000 ppmvpegged emission rate to approximate the pump 100,000 ppmv pegged emission rate.
f The other equipment type includes instruments, loading arms, pressure relief valves, stuffing boxes, vents, compressors, and dumplever arms.
EIIP
Volum
eII
4.4-6

11/29/96 CHAPTER 4 - EQUIPMENT LEAKS
Example 4.4-1:
Stream A, Equipment IDs: A-1, A-2, A-3, A-4, and A-5Equipment Type: Light-liquid PumpsHours of Operation: 8,760 hoursSV (Screening value) = 0 ppmvSOCMI default-zero TOC emission rate (kg/hr/source)
= 7.5 × 10⁻⁶ (from Table 4.4-3)VOC emissions per equipment ID (kg/yr)
= 7.5 × 10⁻⁶ kg/hr × (0.80/0.80) × 8,760 hr= 0.066
Stream A, Equipment ID: A-6Equipment Type: Light-liquid PumpsHours of Operation: 8,760 hoursSV (Screening value) = 20 ppmvSOCMI Correlation Equation:TOC Leak Rate (kg/hr)
= 1.90 × 10⁻⁵ (SV)0.824 (from Table 4.4-3)= 1.90 × 10⁻⁵ (20)0.824
= 2.24 × 10⁻⁴
VOC emissions (kg/yr)= 2.24 × 10⁻⁴ kg/hr × 8,760 hr × (0.80/0.80)= 2.0
Stream A, Equipment IDs: A-7 and A-8Equipment Type: Light-liquid PumpsSV (Screening value) = 50 ppmvSOCMI Correlation Equation:TOC Leak Rate (kg/hr)
= 1.90 × 10⁻⁵ (SV)0.824 (from Table 4.4-3)= 1.90 × 10⁻⁵ (50)0.824
= 4.77 × 10⁻⁴
VOC emissions (kg/yr)= 4.77 × 10⁻⁴ kg/hr × 8,760 hr × (0.80/0.80)= 4.2
EIIP Volume II 4.4-7

CHAPTER 4 - EQUIPMENT LEAKS 11/29/96
This page is intentionally left blank.
EIIP Volume II4.4-8

5
ALTERNATIVE METHODS FORESTIMATING EMISSIONSThe alternative methods for estimating emissions from equipment leaks are the following (inno specific order of preference):
Average emission factor approach;
Screening ranges approach; and
Unit-specific correlation approach.
5.1 EMISSION CALCULATIONS USING THE AVERAGE EMISSIONFACTOR APPROACH
The average emission factor approach is commonly used to calculate emissions whensite-specific screening data are unavailable.
To estimate emissions using the average emission factor approach, the TOC concentration inweight percent within the equipment is needed. The TOC concentration in the equipment isimportant because equipment (and VOC or HAP concentrations if speciation is to beperformed) with higher TOC concentrations tend to have higher TOC leak rates. The variousequipment should be grouped into "streams," such that all equipment within a stream hasapproximately the same TOC weight percent.
This approach for estimating emissions allows use of average emission factors developed bythe EPA in combination with unit-specific data that are relatively simple to obtain. Thesedata include: (1) the number of each type of component in a unit (valve, connector, etc.);(2) the service each component is in (gas, light liquid, or heavy liquid); (3) the TOCconcentration of the stream; and (4) the time period each component was in that service.
EPA average emission factors have been developed for SOCMI process units, refineries,marketing terminals, and oil and gas production operations (EPA, November 1995). Themethod used by the EPA to develop emission factors for individual equipment leak emissionsources is described in theProtocol for Equipment Leak Emission Estimates(EPA, November1995). Tables 4.5-1 and 4.5-2 show the average emission factors for SOCMI process unitsand refineries, respectively.
EIIP Volume II 4.5-1

CHAPTER 4 - EQUIPMENT LEAKS 11/29/96
TABLE 4.5-1
SOCMI AVERAGE EMISSION FACTORSa
Equipment Type ServiceEmission Factor
(kg/hr per source)b
Valves Gas 0.00597
Light liquid 0.00403
Heavy liquid 0.00023
Pump sealsc Light liquid 0.0199
Heavy liquid 0.00862
Compressor seals Gas 0.228
Pressure relief valves Gas 0.104
Connectors All 0.00183
Open-ended lines All 0.0017
Sampling connections All 0.0150
a Source: EPA, November 1995, Table 2-1.b These factors are for TOC emission rates.c The light liquid pump seal factor can be used to estimate the leak rate from agitator seals.
EIIP Volume II4.5-2

11/29/96 CHAPTER 4 - EQUIPMENT LEAKS
TABLE 4.5-2
REFINERY AVERAGE EMISSION FACTORSa
Equipment Type ServiceEmission Factor
(kg/hr per source)b
Valves Gas 0.0268
Light liquid 0.0109
Heavy liquidd 0.00023
Pump sealsc Light liquid 0.114
Heavy liquidd 0.021
Compressor seals Gas 0.636
Pressure relief valves Gas 0.16
Connectors All 0.00025
Open-ended lines All 0.0023
Sampling connections All 0.0150
a Source: EPA, November 1995, Table 2-2. Based on data gathered in the 1970’s.b These factors are for non-methane organic compound emission rates.c The light liquid pump seal factor can be used to estimate the leak rate from agitator seals.d The American Petroleum Institute is conducting a program to develop revised emission factors for
components in heavy liquid service. Contact state or local agencies to determine the appropriateapplication of heavy liquid emission factors.
EIIP Volume II 4.5-3

CHAPTER 4 - EQUIPMENT LEAKS 11/29/96
Although the average emission factors are in units of kilogram per hour per individual source,it is important to note that these factors are most valid for estimating emissions from apopulation of equipment. However, the average emission factor approach may present thelargest potential error, among the other approaches, when applied to estimate emissions fromequipment populations. The average factors are not intended to be used for estimatingemissions from an individual piece of equipment over a short time period (i.e., 1 hour).
When the average emission factors are used to estimate TOC mass emissions from refineries,it is necessary to adjust the refinery emission factors because they represent only non-methaneemissions. To estimate TOC emissions, methane and non-methane organic compounds mustbe included. Two guidelines for adjusting the refinery emission factors are as follows:
The adjustment should be applied only to equipment containing a mixture oforganic and methane, and
The maximum adjustment for the methane weight fraction should not exceed0.10, even if the equipment contains greater than 10 weight percent methane.(This reflects that equipment in the Refinery Assessment Study (EPA, Apriland July 1980) typically contained 10 weight percent or less methane).
Because the average emission factors for refineries must be adjusted when estimating TOCemissions, there is one equation (Equation 4.5-1) for using the average emission factors toestimate emissions from SOCMI marketing terminals, and oil and gas production operationsand a second equation (Equation 4.5-2) for using the emission factors to estimate emissionsfrom refinery operations.
These equations can be used to estimate TOC emission from all of the equipment of a givenequipment type in a stream:
where:
(4.5-1)ETOC FA × WFTOC × N
(4.5-2)ETOC FA ×WFTOC
WFTOC WFmethane
× WFTOC × N
ETOC = Emission rate of TOC from all equipment in the stream of a givenequipment type (kg/hr);
EIIP Volume II4.5-4

11/29/96 CHAPTER 4 - EQUIPMENT LEAKS
FA = Applicable average emission factor1 for the equipment type(kg/hr per source);
WFTOC = Average weight fraction of TOC in the stream;WFmethane = Average weight fraction of methane in the stream;WFTOC = Average weight fraction of TOC in the stream; andN = Number of pieces of the applicable equipment type in the
stream.
If there are several streams at a process unit, the total VOC emission rate for an equipmenttype is the sum of VOC emissions from each of the streams. The total emission rates for allof the equipment types are summed to generate the process unit total VOC emission rate fromleaking equipment.
An example of the average emission factor approach is demonstrated for Streams A and Bincluded in Table 4.4-1. Note that Stream A contains water, which is not a TOC. Therefore,this is accounted for when total TOC emissions are estimated from Stream A. Table 4.5-3summarizes the average emission factor approach calculations.
TABLE 4.5-3
AVERAGE EMISSION FACTOR METHOD
Stream IDEquipment
Count
TOC EmissionFactor
(kg/hr per source)
WeightFraction of
TOC
Hours ofOperation
(hr/yr)
VOCEmissionsa
(kg/yr)
A 15 0.0199 0.80 8,760 2,092
B 12 0.0199 1.00 4,380 1,046
Total Emissions 3,138
a VOC Emissions = (no. of components) × (emission factor) × (wt. fraction TOC) ×(WPVOC/WPTOC) × (hours of operation).
1 Emission factors presented in the1995 Protocol for Equipment Leak Emission Estimates(EPA, November1995) are for TOC emission rates, except for refineries that are for non-methane organic compound emissionrates.
EIIP Volume II 4.5-5

CHAPTER 4 - EQUIPMENT LEAKS 11/29/96
5.2 EMISSION CALCULATIONS USING THE SCREENING RANGESAPPROACH
The screening ranges approach requires screening data to be collected for the equipment inthe process unit. This approach is applied in a similar manner as the average emission factorapproach in that equipment counts are multiplied by the applicable emission factor. However,because the screening value on which emissions are based is a measurement of only organiccompound leakage, no adjustment is made for inorganic compounds.
This approach may be applied when screening data are available as either "greater than orequal to 10,000 ppmv" or as "less than 10,000 ppmv." As with the average factors, theSOCMI, marketing terminal, and oil and gas production operations screening range factorspredict TOC emissions, whereas the refinery screening range factors predict non-methaneorganic compound emissions. Thus, when using the average refinery screening range factorsto estimate TOC emissions from refineries, an adjustment must be made to the factors toinclude methane emissions. The maximum adjustment for the methane weight factors shouldnot exceed 0.10, even if the equipment contains greater than 10 weight percent methane.
Because the average screening range factors for refineries must be adjusted when estimatingTOC emissions, there is one equation (Equation 4.5-3) for using the average screening rangefactors to estimate emissions from SOCMI, marketing terminals, and oil and gas productionoperations and a second equation (Equation 4.5-4) for using the screening range factors toestimate emissions from refinery operations. These equations are described below:
where:
(4.5-3)ETOC (FG × NG) (FL × NL)
(4.5-4)ETOC
WFTOC
WFTOC WFmethane
(FG ×NG) (fL×NL)
ETOC = TOC emission rate for an equipment type (kg/hr);FG = Applicable emission factor1 for sources with screening values
greater than or equal to 10,000 ppmv (kg/hr per source);
1 Emission factors presented in the1995 Protocol for Equipment Leak Emission Estimates(EPA, November1995) are for TOC emission rates, except for refineries that are for non-methane organic compound emissionrates.
EIIP Volume II4.5-6

11/29/96 CHAPTER 4 - EQUIPMENT LEAKS
WPTOC = Average weight percent of TOC in the stream;WPmethane = Average weight percent of methane in the stream;NG = Equipment count (specific equipment type) for sources with
screening values greater than or equal to 10,000 ppmv;FL = Applicable emission factor for sources with screening values less
than 10,000 ppmv (kg/hr per source); andNL = Equipment count (specific equipment type) for sources with
screening values less than 10,000 ppmv.
Assuming all of the organic compounds in the stream are classified as VOCs, the total VOCemission for each stream is calculated as the sum of TOC emissions associated with eachspecific equipment type in the stream.
The screening range emission factors are a better indication of the actual leak rate fromindividual equipment than the average emission factors. Nevertheless, available data indicatethat measured mass emission rates can vary considerably from the rates predicted by use ofthese factors.
An example of the screening value ranges approach is demonstrated in Table 4.5-4 using theexample of a hypothetical chemical processing facility presented in Section 4 for Streams Aand B (Table 4.4-1). The calculations are similar to those used for the average emissionfactor approach, except that a TOC emission factor for each screening value range is used.Emissions from equipment that could not be screened are calculated using average emissionfactors. VOC emissions using the screening value range approach are 1,480 kg/yr. Incomparison, VOC emissions using the average emission factor approach for the sameStreams A and B are 3,138 kg/yr, as shown in Table 4.5-3.
5.3 EMISSION CALCULATIONS USING UNIT-SPECIFIC CORRELATIONAPPROACH
Correlation equations may be developed for specific units rather than using correlationequations developed by the EPA. Once the correlations are developed, they are applied in thesame way as described for the EPA correlations.
Before developing unit-specific correlations it is recommended that the validity of the EPAcorrelations to a particular process unit be evaluated because of the high cost of bagging.This can be done measuring as few as four leak rates of a particular equipment type in aparticular service. The measured emission rate can be compared with the predicted ratesobtained using the EPA correlations. If there is a consistent trend (i.e., all measured valuesare less than values predicted by the EPA correlation equation or all measured values arelarger) the EPA correlation equation may not provide reasonable emission estimates for the
EIIP Volume II 4.5-7

CHAPTER 4 - EQUIPMENT LEAKS 11/29/96
TABLE 4.5-4
SCREENING VALUE RANGES METHODa
Stream IDEquipment
Countb
Emission Factor(kg/hr per
source)
Hours ofOperation
(hr/yr)
VOCEmissions
(kg/yr)
Components screening≥ 10,000 ppmvc
B 1 0.243 4,380 1,060
Components screening < 10,000 ppmvc
A 15 0.00187 8,760 246
B 10 0.00187 4,380 82
Components not screenedd
B (TOC wt. fraction equalto 1.0)
1 0.0199 4,380 87
Total emissions 1,480
a Source: EPA, November, 1995, Table A-3.b It was assumed that none of the light liquid pumps in Stream A have a screening value greater than or equal to
10,000 ppmv, one of the light liquid pumps in Stream B screens greater than 10,000 ppmv, and one of thepumps in Stream B could not be screened.
c VOC emissions = (no. of components) × (TOC emission factor) × (WPVOC/WPTOC) ×(hours of operation).
d VOC emissions = (no. of components) × (average TOC emission factor) × (WPVOC) × (hours of operation).
EIIP Volume II4.5-8

11/29/96 CHAPTER 4 - EQUIPMENT LEAKS
process unit. There is a more formal comparison, the Wilcoxon signed-rank test, which canbe performed by comparing the logarithm of the measured mass emission rates to thelogarithm of the corresponding rates predicted by the EPA correlation.
In developing new unit-specific correlations, a minimum number of leak rate measurementsand screening value pairs must be obtained. TheProtocol for Equipment Leak EmissionEstimates(EPA, November 1995) provides detailed information on the methodology to befollowed. In general, the following consideration should be observed:
Process unit equipment should be screened to know the distribution of screeningvalues at the unit;
Mass emission data must be collected from individual sources with screening valuesdistributed over the entire range; and
A random sample of a minimum of six components from each of the followingscreening value ranges (in ppmv) should be selected for bagging: 1-100; 101-1,000;1,001-10,000; 10,001-100,000; and >100,000. Therefore, a minimum of 30 emissionsrate/screening value pairs should be obtained to estimate emissions across the entirerange of screening values.
The Protocol document (EPA, November 1995) provides some alternatives to developing acorrelation equation with fewer than 30 bags. These alternatives are based on experience inmeasuring leak rates and developing leak rate/screening value correlations. However, othersource selection strategies can be used if an appropriate rationale is given.
Methodologies for generating leak rate/screening value correlations with mass emissions dataand screening values are presented in Appendix B of the1995 Protocoldocument. Oncecorrelations are developed using the methodologies outlined in Appendix B, they are appliedin the same manner as described in the example for the EPA correlations.
EIIP Volume II 4.5-9

CHAPTER 4 - EQUIPMENT LEAKS 11/29/96
This page is intentionally left blank.
EIIP Volume II4.5-10

6
QUALITY ASSURANCE/QUALITYCONTROL PROCEDURESThe consistent use of standardized methods and procedures is essential in the compilation ofreliable emission inventories. Quality assurance (QA) and quality control (QC) of aninventory are accomplished through a set of procedures that ensure the quality and reliabilityof data collection and analysis. These procedures include the use of appropriate emissionestimation techniques, applicable and reasonable assumptions, accuracy/logic checks ofcomputer models, checks of calculations, and data reliability checks. Chapter 4 of Volume VI(the QA Source Document)of this series describes some QA/QC methods for performingthese procedures.
Volume II, Chapter 1,Introduction to Stationary Point Source Emission InventoryDevelopment, presents recommended standard procedures to follow that ensure the reportedinventory data are complete and accurate. Chapter 1, should be consulted for current EIIPguidance for QA/QC checks for general procedures, recommended components of a QA plan,and recommended components for point source inventories. The QA plan discussion includesrecommendations for data collection, analysis, handling, and reporting. The recommendedQC procedures include checks for completeness, consistency, accuracy, and the use ofapproved standardized methods for emission calculations, where applicable.
6.1 SCREENING AND BAGGING DATA COLLECTION
To ensure that data quality is maintained while screening and data collection take place, it isrecommended that data be recorded on prepared data sheets. Figures 4.6-1 provides anexample data sheet that may be used to log measurements taken during a screening program.
To ensure highest quality of the data collected during the bagging program, QA/QCprocedures must be followed. Quality assurance requirements include accuracy checks of theinstrumentation used to perform mass emission sampling. Quality control requirementsinclude procedures to be followed when performing equipment leak mass emissions sampling.
Figures 4.6-2 and 4.6-3 present examples of data collection forms to be used when collectingdata in the field. Accuracy checks on the instrumentation and monitoring devices used toperform mass emission sampling include a leak rate check performed in the laboratory, blindstandards to be analyzed by the laboratory instrumentation, and drift checks on the portablemonitoring device.
EIIP Volume II 4.6-1

CH
AP
TE
R4
-E
QU
IPM
EN
TLE
AK
S11/29/96
EXAMPLE FIELD SHEET FOR EQUIPMENT SCREENING DATA
Detector Model No:
Operator Name:
Date:
ComponentID
ComponentType
Location/Stream Service
Operatinghr/yr
Screeningvalue (ppmv)
Background(ppmv)
Comments:
FIGURE 4.6-1. EXAMPLE FIELD SHEET FOR EQUIPMENT SCREENING DATA
EIIP
Volum
eII
4.6-2

11/29/96 CHAPTER 4 - EQUIPMENT LEAKS
EXAMPLE DATA COLLECTION FORM FOR FUGITIVE EMISSIONSBAGGING TEST (VACUUM METHOD)
Equipment Type Component IDEquipment Category Plant IDLine Size DateStream Phase (G/V, LL, HL) Analysis TeamBarometric PressureAmbient Temperature Instrument IDStream Temperature Stream PressureStream Composition (Wt. %) ,
, ,
Time Bagging Test Measurement Data
Initial Screening (ppmv) Equipment Piecea Bkgd.
Background Bag Organic Compound Conc. (ppmv)b
Sample Bag 1 Organic Compound Conc. (ppmv)
Dry Gas Meter Reading (L/min)
Vacuum Check in Bag (Y/N) (Must be YES to collect sample.)
Dry Gas Meter Temperaturec (°C)
Dry Gas Meter Pressurec (mmHg)
Sample Bag 2 Organic Compound Conc. (ppmv)
Dry Gas Meter Reading (L/min)
Vacuum Check in Bag (Y/N) (Must be YES to collect sample.)
Dry Gas Meter Temperaturec (°C)
Dry Gas Meter Pressurec (mmHg)
Condensate Accumulation: Starting Time Final Time
Organic Condensate Collected (mL)
Density of Organic Condensate (g/mL)
Final Screening (ppmv) Equip. Piecea Bkgd.
a The vacuum method is not recommended if the screening value is approximately 10 ppmv or less.b Collection of a background bag is optional.c Pressure and temperature are measured at the dry gas meter.
FIGURE 4.6-2. EXAMPLE DATA COLLECTION FORM FOR FUGITIVE EMISSIONSBAGGING TEST (VACUUM METHOD)
EIIP Volume II 4.6-3

CHAPTER 4 - EQUIPMENT LEAKS 11/29/96
EXAMPLE DATA COLLECTION FORM FOR FUGITIVE EMISSIONS BAGGING TEST(BLOW-THROUGH METHOD)
Equipment Type Component ID
Equipment Category Plant ID
Line Size Date
Stream Phase (G/V, LL, HL) Analysis Team
Barometric Pressure
Ambient Temperature Instrument ID
Stream Temperature Stream Pressure
Stream Composition (Wt. %) ,
, ,
Time Bagging Test Measurement Data
Initial Screening (ppmv) Equipment Piece Bkgd.
Background Bag Organic Compound Conc. (ppmv)a
Sample Bag 1 Organic Compound Conc. (ppmv)
Dilution Gas Flow Rate (L/min)
O2 Concentration (volume %)
Bag Temperature (°C)
Sample Bag 2 Organic Compound Conc. (ppmv)
Dilution Gas Flow Rate (L/min)
O2 Concentration (volume %)
Bag Temperature (°C)
Condensate Accumulation: Starting Time Final Time
Organic Condensate Collected (mL)
Density of Organic Condensate (g/mL)
Final Screening (ppmv) Equipment Piece Bkgd.
a Collection of a background bag is optional. However, it is recommended in cases where the screeningvalue is less than 10 ppmv and there is a detectable oxygen level in the bag.
FIGURE 4.6-3. EXAMPLE DATA COLLECTION FORM FOR FUGITIVE EMISSIONSBAGGING TEST (BLOW-THROUGH METHOD)
EIIP Volume II4.6-4

11/29/96 CHAPTER 4 - EQUIPMENT LEAKS
6.2 OTHER QA/QC ISSUES
At a minimum, the approach and data used to estimate emissions should be peer reviewed toassure correctness. In addition, some sample calculations should be performed to verify thatcalculations were done correctly.
If any of the methods that require screening or bagging data were used, the sample designshould be reviewed to assure that all relevant equipment types were sampled. Furthermore,the adequacy of sample sizes should be verified.
6.3 DATA ATTRIBUTE RATING SYSTEM (DARS) SCORES
One measure of emission inventory data quality is the DARS score. Three examples aregiven here to illustrate DARS scoring using the preferred and alternative methods. TheDARS provides a numerical ranking on a scale of 1 to 10 for individual attributes of theemission factor and the activity data. Each score is based on what is known about the factorand activity data, such as the specificity to the source category and the measurementtechnique employed. The composite attribute score for the emissions estimate can be viewedas a statement of the confidence that can be placed in the data. For a complete discussion ofDARS and other rating systems, see theQA Source Document(Volume VI, Chapter 4), andVolume II, Chapter 1,Introduction to Stationary Point Sources Emission InventoryDevelopment.
For each example, assume emissions are being estimated for a petroleum marketing terminal.Table 4.6-1 gives a set of scores for the preferred method, the EPA correlation approach.Note that a perfect score (1.0) is not possible with any of the methods described in thischapter because all are based on the use of surrogates rather than direct measurement ofemissions. The spatial congruity attribute is not particularly relevant for this category, andthus is given a score of 1.0. Both measurement and specificity scores are relatively high (0.8)because the correlation equation is based on a representative sample from the specificcategory. The measurement attribute score assumes that the pollutants of interest weremeasured directly. The temporal attribute scores are 0.7 because the data (for the correlationequation and for the screening values) are presumed to be one time samples, but thethroughputs are assumed not to vary much over time.
Tables 4.6-2 and 4.6-3 give DARS scores for the average emission factor approach and theunit-specific correlation approach respectively. Not surprisingly, the first approach gets lowerDARS scores, while the second gets higher scores.
EIIP Volume II 4.6-5

CHAPTER 4 - EQUIPMENT LEAKS 11/29/96
TABLE 4.6-1
DARS SCORES: EPA CORRELATION APPROACH
Attribute
Scores
Factor Activity Emissions
Measurement 0.8 0.8 0.64
Specificity 0.8 1.0 0.80
Spatial 1.0 1.0 1.0
Temporal 0.7a 0.7a 0.49
Composite Scores 0.83 0.88 0.73
a Assumes a one-time sampling of equipment and little variation in throughput.
TABLE 4.6-2
DARS SCORES: AVERAGE EMISSION FACTOR APPROACH
Attribute
Scores
Factor Activity Emissions
Measurement 0.6 0.5 0.3
Specificity 0.5 1.0 0.5
Spatial 1.0 1.0 1.0
Temporal 0.7 0.7 0.49
Composite Scores 0.7 0.8 0.57
EIIP Volume II4.6-6

11/29/96 CHAPTER 4 - EQUIPMENT LEAKS
These examples are given as an illustration of the relative quality of each method. If the
TABLE 4.6-3
DARS SCORES: UNIT-SPECIFIC CORRELATION APPROACH
Attribute
Scores
Factor Activity Emissions
Measurement 0.9 0.9 0.81
Specificity 1.0 1.0 1.0
Spatial 1.0 1.0 1.0
Temporal 0.7 0.7 0.49
Composite Scores 0.90 0.90 0.83
same analysis were done for an actual real site, the scores could be different but the relativeranking of methods should stay the same. Note, however, that if the source is not truly amember of the population used to develop the EPA correlation equations or the emissionfactors, these approaches are less appropriate and the DARS scores will probably drop.
If sufficient data are available, the uncertainty in the estimate should be evaluated.Qualitative and quantitative methods for conducting uncertainty analyses are described in theQA Source Document(Volume VI, Chapter 4).
EIIP Volume II 4.6-7

CHAPTER 4 - EQUIPMENT LEAKS 11/29/96
This page is intentionally left blank.
EIIP Volume II4.6-8

7
DATA CODING PROCEDURESThis section describes the methods and codes available for characterizing fugitive emissionsfrom equipment leaks using Source Classification Codes (SCCs) and Aerometric InformationRetrieval System (AIRS) control device codes. Consistent categorization and coding willresult in greater uniformity among inventories. The SCCs are the building blocks on whichpoint source emissions data are structured. Each SCC represents a unique process or functionwithin a source category that is logically associated with an emission point. Without anappropriate SCC, a process cannot be accurately identified for retrieval purposes. In addition,the procedures described here will assist the reader preparing data for input into a databasemanagement system. For example, the SCCs provided in Table 4.7-1 are typical of the validcodes recommended for describing equipment leaks. This table does not include all fugitivesource SCCs, but does include those commonly used to identify equipment leaks. Refer toCHIEF for a complete listing of SCCs.
While the codes presented here are currently in use, they may change based on furtherrefinement by the emission inventory community. As part of the EIIP, a common dataexchange format is being developed to facilitate data transfer between industry, states, andEPA.
For equipment leaks, be careful to use only one SCC for each process or source category.Many of these are designated for the entire process unit on an annual basis. In some cases,the user may need to calculate emissions for multiple pieces of equipment and then sum up tothe unit total. The process-specific codes should be used as often as possible.
EIIP Volume II 4.7-1

CHAPTER 4 - EQUIPMENT LEAKS 11/29/96
TABLE 4.7-1
SOURCE CLASSIFICATION CODES AND DESCRIPTIONS FOR FUGITIVE EMISSIONSFROM EQUIPMENT LEAKS
Source Description Process Description SCC Units
Industrial ProcessesChemicalManufacturing
Adipic Acid - FugitiveEmissions: General
3-01-001-80 Process Unit-Year
Carbon Black Production;Furnace Process: FugitiveEmissions
3-01-005-09 Tons Produced
Chlorine: CarbonReactivation/Fugitives
3-01-007-05 Tons Produced
Sulfuric Acid (ContactProcess): Process EquipmentLeaks
3-01-023-22 Tons 100% H2SO4
Terephthalic Acid/ DimethylTerephthalate: FugitiveEmissions
3-01-031-80 Process Unit-Year
Aniline/Ethanolamines:Fugitive Emissions
3-01-034-06 Process Unit-Year
Aniline/Ethanolamines:Fugitive Emissions
3-01-034-14 Process Unit-Year
Pharmaceutical Preparations:Miscellaneous Fugitives
3-01-060-22 Tons Processed
Pharmaceutical Preparations:Miscellaneous Fugitives
3-01-060-23 Tons Processed
Inorganic ChemicalManufacturing (General):Fugitive Leaks
3-01-070-01 Tons Product
Acetone/Ketone Production:Fugitive Emissions (Acetone)
3-01-091-80 Process Unit-Year
Maleic Anhydride: FugitiveEmissions
3-01-100-80 Process Unit-Year
Fugitive Emissions(Formaldehyde)
3-01-120-07 Process Unit-Year
EIIP Volume II4.7-2
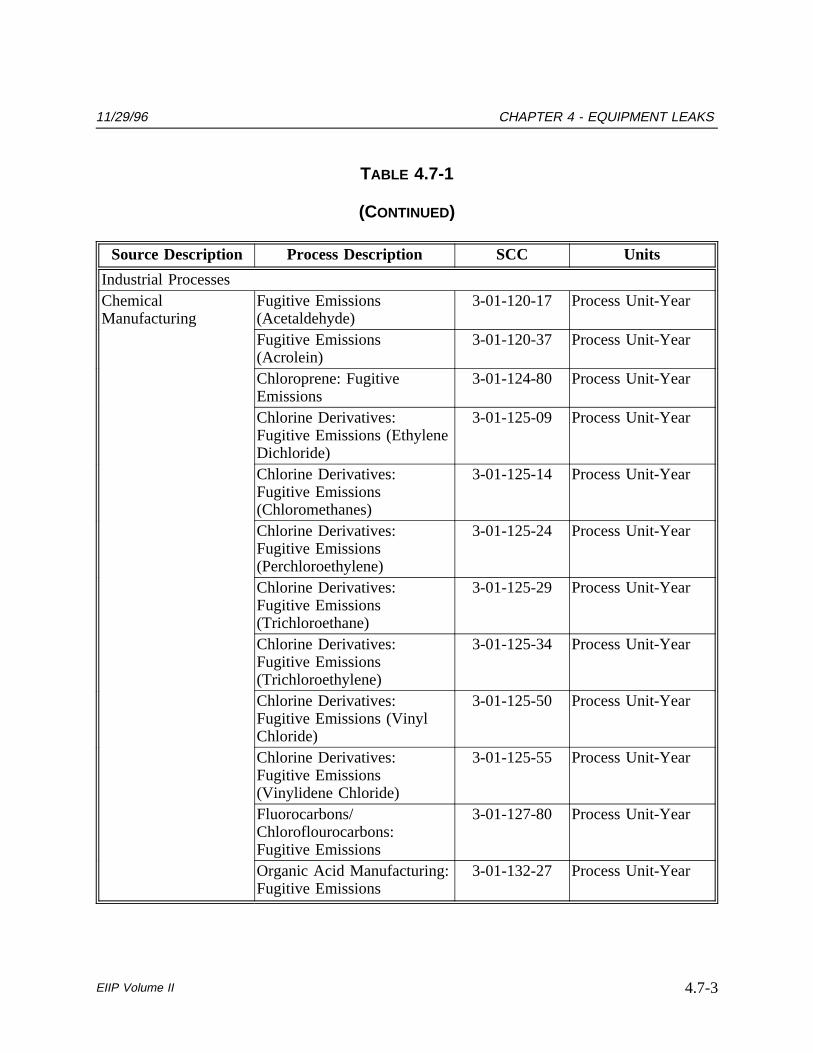
11/29/96 CHAPTER 4 - EQUIPMENT LEAKS
TABLE 4.7-1
(CONTINUED)
Source Description Process Description SCC Units
Industrial ProcessesChemicalManufacturing
Fugitive Emissions(Acetaldehyde)
3-01-120-17 Process Unit-Year
Fugitive Emissions(Acrolein)
3-01-120-37 Process Unit-Year
Chloroprene: FugitiveEmissions
3-01-124-80 Process Unit-Year
Chlorine Derivatives:Fugitive Emissions (EthyleneDichloride)
3-01-125-09 Process Unit-Year
Chlorine Derivatives:Fugitive Emissions(Chloromethanes)
3-01-125-14 Process Unit-Year
Chlorine Derivatives:Fugitive Emissions(Perchloroethylene)
3-01-125-24 Process Unit-Year
Chlorine Derivatives:Fugitive Emissions(Trichloroethane)
3-01-125-29 Process Unit-Year
Chlorine Derivatives:Fugitive Emissions(Trichloroethylene)
3-01-125-34 Process Unit-Year
Chlorine Derivatives:Fugitive Emissions (VinylChloride)
3-01-125-50 Process Unit-Year
Chlorine Derivatives:Fugitive Emissions(Vinylidene Chloride)
3-01-125-55 Process Unit-Year
Fluorocarbons/Chloroflourocarbons:Fugitive Emissions
3-01-127-80 Process Unit-Year
Organic Acid Manufacturing:Fugitive Emissions
3-01-132-27 Process Unit-Year
EIIP Volume II 4.7-3

CHAPTER 4 - EQUIPMENT LEAKS 11/29/96
TABLE 4.7-1
(CONTINUED)
Source Description Process Description SCC Units
Industrial ProcessesChemicalManufacturing
Acetic Anhydride: FugitiveEmissions
3-01-133-80 Process Unit-Year
Butadiene: FugitiveEmissions
3-01-153-80 Process Unit-Year
Cumene: Fugitive Emissions 3-01-156-80 Process Unit-YearCyclohexane: FugitiveEmissions
3-01-157-80 Process Unit-Year
Cyclohexanone/Cyclohexanol: FugitiveEmissions
3-01-158-80 Process Unit-Year
Vinyl Acetate: FugitiveEmissions
3-01-167-80 Process Unit-Year
Ethyl Benzene: FugitiveEmissions
3-01-169-80 Process Unit-Year
Ethylene Oxide: FugitiveEmissions
3-01-174-80 Process Unit-Year
Glycerin (Glycerol): FugitiveEmissions
3-01-176-80 Process Unit-Year
Toluene Diisocyanate:Fugitive Emissions
3-01-181-80 Process Unit-Year
Methyl Methacrylate:Fugitive Emissions
3-01-190-80 Process Unit-Year
Nitrobenzene: FugitiveEmissions
3-01-195-80 Process Unit-Year
Olefin Prod.: FugitiveEmissions (Propylene)
3-01-197-09 Process Unit-Year
Olefin Prod.: FugitiveEmissions (Ethylene)
3-01-197-49 Process Unit-Year
Phenol: Fugitive Emissions 3-01-202-80 Process Unit-YearPropylene Oxide: FugitiveEmissions
3-01-205-80 Process Unit-Year
Styrene: Fugitive Emissions 3-01-206-80 Process Unit-Year
EIIP Volume II4.7-4

11/29/96 CHAPTER 4 - EQUIPMENT LEAKS
TABLE 4.7-1
(CONTINUED)
Source Description Process Description SCC Units
Industrial ProcessesChemicalManufacturing
Caprolactam: FugitiveEmissions
3-01-210-80 Process Unit-Year
Linear Alkylbenzene:Fugitive Emissions
3-01-211-80 Process Unit-Year
Methanol/AlcoholProduction: FugitiveEmissions (Methanol)
3-01-250-04 Process Unit-Year
Ethylene Glycol: FugitiveEmissions
3-01-251-80 Process Unit-Year
Glycol Ethers: FugitiveEmissions
3-01-253-80 Process Unit-Year
Nitriles, Acrylonitrile,Adiponitrile Prod.: FugitiveEmissions
3-01-254-09 Process Unit-Year
Nitriles, Acrylonitrile,Adiponitrile Prod.: FugitiveEmissions
3-01-254-20 Process Unit-Year
Benzene/Toluene/Aromatics/Xylenes: FugitiveEmissions (Aromatics)
3-01-258-80 Process Unit-Year
Chlorobenzene: FugitiveEmissions
3-01-301-80 Process Unit-Year
Carbon Tetrachloride:Fugitive Emissions
3-01-302-80 Tons Product
Allyl Chloride: FugitiveEmissions
3-01-303-80 Process Unit-Year
Allyl Alcohol: FugitiveEmissions
3-01-304-80 Process Unit-Year
Epichlorohydrin: FugitiveEmissions
3-01-305-80 Process Unit-Year
General Processes: FugitiveLeaks
3-01-800-01 Process Unit-Year
EIIP Volume II 4.7-5

CHAPTER 4 - EQUIPMENT LEAKS 11/29/96
TABLE 4.7-1
(CONTINUED)
Source Description Process Description SCC Units
Industrial ProcessesChemicalManufacturing
Fugitive Emissions: SpecifyIn Comments Field
3-01-888-02 Tons Product
Fugitive Emissions: SpecifyIn Comments Field
3-01-888-01 Tons Product
Fugitive Emissions: SpecifyIn Comments Field
3-01-888-03 Tons Product
Fugitive Emissions: SpecifyIn Comments Field
3-01-888-04 Tons Product
Fugitive Emissions: SpecifyIn Comments Field
3-01-888-05 Process Unit-Year
Primary MetalProduction
By-Product CokeManufacturing-EquipmentLeaks
3-03-003-61 Process Unit-Year
Primary Metal Production -Equipment Leaks
3-03-800-01 Facility-Annual
Secondary MetalProduction
Secondary MetalProduction-Equipment Leaks
3-04-800-01 Facility-Annual
Petroleum Industry Pipeline Valves And Flanges 3-06-008-01 1000 Barrels RefinedVessel Relief Valves 3-06-008-02 1000 Barrels RefinedPump Seals Without Controls 3-06-008-03 1000 Barrels RefinedCompressor Seals 3-06-008-04 1000 Barrels RefinedMisc: Sampling/Non-AsphaltBlowing/Purging/Etc.
3-06-008-05 1000 Barrels Refined
Pump Seals With Controls 3-06-008-06 1000 Barrels Refined
EIIP Volume II4.7-6

11/29/96 CHAPTER 4 - EQUIPMENT LEAKS
TABLE 4.7-1
(CONTINUED)
Source Description Process Description SCC Units
Industrial ProcessesPetroleum Industry Blind Changing 3-06-008-07 1000 Barrels Refined
Pipeline Valves: Gas Streams3-06-008-11 Valves In OperationPipeline Valves: LightLiquid/Gas Stream
3-06-008-12 Valves In Operation
Pipeline Valves: HeavyLiquid Stream
3-06-008-13 Valves In Operation
Pipeline Valves: HydrogenStreams
3-06-008-14 Valves In Operation
Open-Ended Valves: AllStreams
3-06-008-15 Valves In Operation
Flanges: All Streams 3-06-008-16 Flanges In OperationPump Seals: LightLiquid/Gas Streams
3-06-008-17 Seals In Operation
Pump Seals: Heavy LiquidStreams
3-06-008-18 Seals In Operation
Compressor Seals: GasStreams
3-06-008-19 Seals In Operation
Compressor Seals: HeavyLiquid Streams
3-06-008-20 Seals In Operation
Drains: All Streams 3-06-008-21 Drains In OperationVessel Relief Valves: AllStreams
3-06-008-22 Valves In Operation
Fugitive Emissions - SpecifyIn Comments Field
3-06-888-01 1000 Barrels Refined
Fugitive Emissions - SpecifyIn Comments Field
3-06-888-02 1000 Barrels Refined
Fugitive Emissions - SpecifyIn Comments Field
3-06-888-03 1000 Barrels Refined
EIIP Volume II 4.7-7

CHAPTER 4 - EQUIPMENT LEAKS 11/29/96
TABLE 4.7-1
(CONTINUED)
Source Description Process Description SCC Units
Industrial ProcessesPetroleum Industry Fugitive Emissions - Specify
In Comments Field3-06-888-04 1000 Barrels Refined
Fugitive Emissions - SpecifyIn Comments Field
3-06-888-05 1000 Barrels Refined
Rubber AndMiscellaneous PlasticsProducts
Rubber And MiscellaneousPlastic Parts - EquipmentLeaks
3-08-800-01 Facility-Annual
Oil And GasProduction
Crude Oil Production -Complete Well
3-10-001-01 Wells/Year InOperation
Crude Oil Production - OilWell Cellars
3-10-001-08 Sq Ft Of SurfaceArea
Crude Oil Production -Compressor Seals
3-10-001-30 Number Of Seals
Crude Oil Production -Drains
3-10-001-31 Number Of Drains
Natural Gas Production -Valves
3-10-002-07 Million Cubic Feet
Natural Gas Production -Drains
3-10-002-31 Number Of Drains
Fugitive Emissions - SpecifyIn Comments Field
3-10-888-01 Process-Unit/Year
Fugitive Emissions - SpecifyIn Comments Field
3-10-888-02 Process-Unit/Year
Fugitive Emissions - SpecifyIn Comments Field
3-10-888-03 Process-Unit/Year
Fugitive Emissions - SpecifyIn Comments Field
3-10-888-04 Process-Unit/Year
Fugitive Emissions - SpecifyIn Comments Field
3-10-888-05 100 Barrel FeedProd.
Fugitive Emissions - SpecifyIn Comments Field
3-10-888-11 Million Cubic Feet
EIIP Volume II4.7-8

11/29/96 CHAPTER 4 - EQUIPMENT LEAKS
TABLE 4.7-1
(CONTINUED)
Source Description Process Description SCC Units
Industrial ProcessesTransportationEquipment
Transportation Equipment -Equipment Leaks
3-14-800-01 Facility-Annual
Petroleum & Solvent EvaporationOrganic SolventEvaporation
Dry Cleaning - Misc.Trichloroethylene Fugitives
4-01-001-63 Tons ClothesCleaned
Fugitive Emissions - SpecifyIn Comments Field
4-01-888-01 Tons Product
Fugitive Emissions - SpecifyIn Comments Field
4-01-888-02 Tons Product
Fugitive Emissions - SpecifyIn Comments Field
4-01-888-03 Tons Product
Fugitive Emissions - SpecifyIn Comments Field
4-01-888-04 Tons Product
Fugitive Emissions - SpecifyIn Comments Field
4-01-888-05 Tons Product
Fugitive Emissions - SpecifyIn Comments Field
4-01-888-98 Gallons
Surface CoatingOperations
Surface Coating Operations -Equipment Leaks
4-02-800-01 Facility-Annual
Organic ChemicalTransportation
Organic ChemicalTransportation - EquipmentLeaks
4-08-800-01 Facility-Annual
Organic SolventEvaporation
Waste Solvent RecoveryOperations - Fugitive Leaks
4-90-002-06 Process-Unit/Year
Waste DisposalSolid Waste Disposal- Government
Solid Waste Disposal: Govt.- Equipment Leaks
5-01-800-01 Facility-Annual
Solid Waste Disposal- Commercial/
Institutional
Solid Waste Disposal:Comm./Inst. - EquipmentLeaks
5-02-800-01 Facility-Annual
Solid Waste Disposal- Industrial
Solid Waste Disposal: Indus.- Equipment Leaks
5-03-800-01 Facility-Annual
EIIP Volume II 4.7-9

CHAPTER 4 - EQUIPMENT LEAKS 11/29/96
TABLE 4.7-1
(CONTINUED)
Source Description Process Description SCC Units
Waste DisposalSite Remediation Site Remediation -
Equipment Leaks5-04-800-01 Facility-Annual
MACT Source CategoriesStyrene OrMethacrylate-basedResins
Styrene Or Methacrylate-based Resins - EquipmentLeaks
6-41-800-01 Facility-Annual
Cellulose-based ResinsCellulose-based Resins -Equipment Leaks
6-44-800-01 Facility-Annual
Miscellaneous ResinsMiscellaneous Resins -Equipment Leaks
6-45-800-01 Facility-Annual
Vinyl-based Resins Vinyl-based Resins -Equipment Leaks
6-46-800-01 Facility-Annual
MiscellaneousPolymers
Miscellaneous Polymers -Equipment Leaks
6-48-800-01 Facility-Annual
MACT MiscellaneousProcesses (Chemicals)
MACT Misc. Processes(Chemicals) - EquipmentLeaks
6-84-800-01 Facility-Annual
MACT MiscellaneousProcesses (Chemicals)
MACT Misc. Processes(Chemicals) - EquipmentLeaks
6-85-800-01 Facility-Annual
EIIP Volume II4.7-10

8
REFERENCESAmerica Petroleum Institute. 1993.Fugitive Hydrocarbon Emissions from Oil and GasProduction Operations, API Publication No. 4589.
California Air Resources Board. August 1989.Technical Guidance Document to the Criteriaand Guidelines Regulation for AB-2588.
Chemical Manufacturer’s Association (CMA). 1989.Improving Air Quality: Guidance forEstimating Fugitive Emissions. Second Edition. Washington, D.C.
Code of Federal Regulations, Title 40, Part 60, Appendix A. July 1, 1987. ReferenceMethod 21,Determination of Volatile Organic Compound Leaks. Office of the FederalRegister. Washington, D.C.
EPA. April 1980. Assessment of Atmospheric Emissions from Petroleum Refining:Volume 3, Appendix B. U.S. Environmental Protection Agency, 600/2-80-075c. ResearchTriangle Park, North Carolina.
EPA. April 1982. Fugitive Emission Sources of Organic Compounds — AdditionalInformation on Emissions, Emission Reductions, and Costs. U.S. Environmental ProtectionAgency, Office of Air Quality, Planning, and Standards, 450/3-82-010. Research TrianglePark, North Carolina.
EPA. July 1992. Equipment Leaks Enabling Document. Final Report. Internal InstructionManual for ESD Regulation Development. U.S. Environmental Protection Agency, Office ofAir and Radiation, Office of Air Quality Planning and Standards, Reasearch Triangle Park,North Carolina.
EPA. November 1995.Protocol for Equipment Leak Emission Estimates. U.S.Environmental Protection Agency, Office of Air and Radiation, Office of Air QualityPlanning and Standards, 453/R-95-017. Research Triangle Park, North Carolina.
Epperson, D.L., Radian Corporation. January 27, 1995. Technical memorandum toD. Markwordt, U.S. Environmental Protection Agency,Petroleum Industry Equipment Leaks:Revised Correlations, Default Zero Emission Factors, and Pegged Emission Factors Based onthe 1993 Data from Refineries, Marketing Terminals, and Oil and Gas ProductionOperations.
EIIP Volume II 4.8-1

CHAPTER 4 - EQUIPMENT LEAKS 11/29/96
EPA. July 1980. Assessment of Atmospheric Emissions from Petroleum Refining: Volume 4.Appendices C, D, and E. U.S. Environmental Protection Agency, 600/2-80-075d. ResearchTriangle Park, North Carolina.
EPA. April 1980. Assessment of Atmospheric Emissions from Petroleum Refining: Volume3. Appendix B. U.S. Environmental Protection Agency, 600/2-80-075c. Research TrianglePark, North Carolina.
EIIP Volume II4.8-2

11/29/96 CHAPTER 4 - EQUIPMENT LEAKS
APPENDIX A
ESTIMATING LEAK DETECTION ANDREPAIR (LDAR) CONTROL
EFFECTIVENESS
EIIP Volume II

CHAPTER 4 - EQUIPMENT LEAKS 11/29/96
This page is intentionally left blank.
EIIP Volume II

11/29/96 CHAPTER 4 - EQUIPMENT LEAKS
ESTIMATING LDAR CONTROL EFFECTIVENESS
Some process units/facilities may want to develop control efficiencies specific to theirprocess/facility if they have different leak definitions than what is in the federal programs.The LDAR monitoring frequency and leak definitions at some state equipment leak controlprograms may also be significantly different from federal programs. Table 4.A-1 presents asummary of controls required by federal requirement leak control programs.
The control efficiency of monitoring equipment at various leak definitions and monitoringfrequencies may be estimated from the leak frequency before and after an LDAR program isimplemented. Tables 4.A-2, and 4.A-3 present equations relating average leak rate to fractionleaking at SOCMI facilities and petroleum refineries. Once the initial and final leakfrequencies are determined, they can be entered into the applicable equation to calculate thecorresponding average leak rates at these leak frequencies. The control effectiveness for anLDAR program can be calculated from the initial leak rate and the final leak rate.
where:
(4.A-1)Eff (ILR FLR)/ILR × 100
Eff = Control effectiveness (percent)ILR = Initial leak rate (kg/hr per source)FLR = Final leak rate (kg/hr per source)
The methodology for estimating leak frequencies is discussed in detail in Chapter 5 of theEquipment Leaks Enabling Document(EPA, July 1992). The methodology requiresknowledge of screening data and equipment repair times.
REFERENCE
EPA. July 1992. Equipment Leaks Enabling Document. Final Report. Internal InstructionManual for ESD Regulation Development. U.S. Environmental Protection Agency, Office ofAir and Radiation, Office of Air Quality Planning and Standards, Reasearch Triangle Park,North Carolina.
EIIP Volume II 4.A-1

CH
AP
TE
R4
-E
QU
IPM
EN
TLE
AK
S11/29/96
TABLE 4.A-1
CONTROLS REQUIRED BY EQUIPMENT LEAK CONTROL PROGRAMS
EquipmentType Service
PetroleumRefinery CTGa SOCMI CTG
Petroleum RefineryNSPSb HON
Valves Gas Quarterly LDAR at10,000 ppm
Quarterly LDAR at10,000 ppm
Monthly LDAR at10,000 ppm; decreasingfrequency with goodperformance
Monthly LDAR with >2% leakers;quarterly LDAR with <2% leakers;decreasing frequency with goodperformance. Initially at 10,000ppm, annually at 500 ppm
Lightliquid
Annual LDAR at10,000 ppm
Quarterly LDAR at10,000 ppm
Monthly LDAR at10,000 ppm; decreasingfrequency with goodperformance
Monthly LDAR with >2% leakers;quarterly LDAR with <2% leakers;decreasing frequency with goodperformance. Initially at 10,000ppm, annually at 500 ppm
Pumps Lightliquid
Annual LDAR at10,000 ppm;weekly visualinspection
Quarterly LDAR at10,000 ppm;weekly visualinspection
Monthly LDAR at10,000 ppm; weeklyvisual inspection; ordual mechanical sealswith controlleddegassing vents
Monthly LDAR; weekly visualinspection. Leak definitiondecreases from 10,000 ppm; or dualmechanical seals or closed-ventsystem
Compressors Gas Quarterly LDAR at10,000 ppm
Quarterly LDAR at10,000 ppm
Daily visual inspection;dual mechanical sealwith barrier fluid andclosed-vent system ormaintained at a higherpressure than thecompressed gas
Daily visual inspection. Dualmechanical seal with barrier fluidand closed-vent system ormaintained at a higher pressure thanthe compressed gas
Connectors Gas andlightliquid
None None None Annual LDAR at 500 ppm with>0.5% leakers; decreasing frequencywith good performance
EIIP
Volum
eII
4.A-2

11/29/96C
HA
PT
ER
4-
EQ
UIP
ME
NT
LEA
KS
TABLE 4.A-1
(CONTINUED)
EquipmentType Service
PetroleumRefinery CTGa SOCMI CTG
Petroleum RefineryNSPSb HON
Pressure reliefdevices
Gas Quarterly LDARat 10,000 ppm
Quarterly LDARat 10,000 ppm
No detectableemissions
No detectable emissions orclosed-vent system
Samplingconnections
All None None Closed-loop or in situsampling
Closed-loop, closed-purge, closedvent or in situ sampling
Open-endedlines
All Cap, blind flange,plug, or secondvalve
Cap, blind flange,plug, or secondvalve
Cap, blind flange,plug, or second valve
Cap, blind flange, plug, or secondvalve
a CTG = Control Techniques Guidelines.b NSPS = New Source Performance Standard.
EIIP
Volum
eII
4.A-3

CHAPTER 4 - EQUIPMENT LEAKS 11/29/96
TABLE 4.A-2
EQUATIONS RELATING AVERAGE LEAK RATE TO FRACTIONLEAKING AT SOCMI UNITS
Equipment TypeLeak Definition
(ppmv) Equationsa,b
Gas valve 500 ALR = (0.04372) × (Lk Frac.) + 0.000017
1000 ALR = (0.04982) × (Lk Frac.) + 0.000028
2000 ALR = (0.05662) × (Lk Frac.) + 0.000043
5000 ALR = (0.06793) × (Lk Frac.) + 0.000081
10000 ALR = (0.07810) × (Lk Frac.) + 0.000131
Light liquid valve 500 ALR = (0.04721) × (Lk Frac.) + 0.000027
1000 ALR = (0.05325) × (Lk Frac.) + 0.000039
2000 ALR = (0.06125) × (Lk Frac.) + 0.000059
5000 ALR = (0.07707) × (Lk Frac.) + 0.000111
10000 ALR = (0.08901) × (Lk Frac.) + 0.000165
Light liquid pump 500 ALR = (0.09498) × (Lk Frac.) + 0.000306
1000 ALR = (0.11321) × (Lk Frac.) + 0.000458
2000 ALR = (0.13371) × (Lk Frac.) + 0.000666
5000 ALR = (0.19745) × (Lk Frac.) + 0.001403
10000 ALR = (0.24132) × (Lk Frac.) + 0.001868
Connector 500 ALR = (0.04684) × (Lk Frac.) + 0.000017
2000 ALR = (0.07307) × (Lk Frac.) + 0.000035
5000 ALR = (0.09179) × (Lk Frac.) + 0.000054
10000 ALR = (0.11260) × (Lk Frac.) + 0.000081
a ALR = Average TOC leak rate (kg/hr per source).b Lk Frac. = Fraction leaking.
EIIP Volume II4.A-4

11/29/96 CHAPTER 4 - EQUIPMENT LEAKS
TABLE 4.A-3EQUATIONS RELATING AVERAGE LEAK RATE TO FRACTION LEAKING
AT REFINERY PROCESS UNITS
Equipment TypeLeak Definition
(ppmv) Equationa,b
Gas valve 500 ALR = (0.11140) × (Lk Frac.) + 0.000088
1000 ALR = (0.12695) × (Lk Frac.) + 0.000140
10000 ALR = (0.26200) × (Lk Frac.) + 0.000600
Light liquid valve 500 ALR = (0.03767) × (Lk Frac.) + 0.000195
1000 ALR = (0.04248) × (Lk Frac.) + 0.000280
10000 ALR = (0.08350) × (Lk Frac.) + 0.001700
Light liquid pump 500 ALR = (0.19579) × (Lk Frac.) + 0.001320
1000 ALR = (0.23337) × (Lk Frac.) + 0.001980
10000 ALR = (0.42500) × (Lk Frac.) + 0.012000
Connector 500 ALR = (0.01355) × (Lk Frac.) + 0.000013
1000 ALR = (0.01723) × (Lk Frac.) + 0.000018
10000 ALR = (0.03744) × (Lk Frac.) + 0.000060
a ALR = Average non-methane organic compound leak rate (kg/hr per source).b Lk Frac. = Fraction leaking.
EIIP Volume II 4.A-5

CHAPTER 4 - EQUIPMENT LEAKS 11/29/96
This page is intentionally left blank.
EIIP Volume II4.A-6

11/29/96 CHAPTER 4 - EQUIPMENT LEAKS
APPENDIX B
SOURCE SCREENING — RESPONSEFACTORS
EIIP Volume II

CHAPTER 4 - EQUIPMENT LEAKS 11/29/96
This page is intentionally left blank.
EIIP Volume II

11/29/96 CHAPTER 4 - EQUIPMENT LEAKS
SOURCE SCREENING — RESPONSE FACTORS
This appendix presents additional information on response factors and includes someguidelines on how to evaluate whether a RF correction to a screening value should be made.An RF is a correction factor that can be applied to a screening value to relate the actualconcentration to the measured concentration of a given compound. The RF is calculatedusing the equation:
RF = AC/SV (4.B-1)
where:
RF = Response factorAC = Actual concentration of the organic compound (ppmv)SV = Screening value (ppmv)
The value of the RF is a function of several parameters. These parameters include themonitoring instrument, the calibration gas used to calibrate the instrument, the compound(s)being screened, and the screening value.
The EPA recommends that if a compound (or mixture) has an RF greater than 3, then the RFshould be used to adjust the screening value before it is used in estimating emissions. Whena compound has an RF greater than three for the recalibrated instrument, the emissionsestimated using the unadjusted screening value will, generally, underestimate the actualemissions.
A detailed list of published RFs is presented in Appendix C of theProtocol document (EPA,November 1995). These RFs, developed for pure compounds, can be used to estimate the RFfor a mixture by using the equation:
where:
(4.B-2)RFm
1n
i 1
(xi/RFi)
RFm = Response factor of the mixturen = Number of components in the mixture
xi = Mole fraction of constituent "i" in the mixtureRFi = Response factor of constituent i in the mixture
EIIP Volume II 4.B-1

CHAPTER 4 - EQUIPMENT LEAKS 11/29/96
For more detail on the derivation of this equation, please refer to Appendix A of theProtocoldocument (EPA, November 1995).
In general, RFs can be used to correct all screening values, if so desired. The following stepscan be carried out to evaluate whether an RF correction to a screening value should be made.
1. For the combination of monitoring instrument and calibration gas used,determine the RFs of a given material at an actual concentration of 500 ppmvand 10,000 ppmv. When it may not be possible to achieve an actualconcentration of 10,000 ppmv for a given material, the RF at the highestconcentration that can be safely achieved should be determined.
2. If the RFs at both actual concentrations are below 3, it is not necessary toadjust the screening values.
3. If either of the RFs are greater than 3, then the EPA recommends an RF beapplied for those screening values for which the RF exceeds 3.
One of the following two approaches can be applied to correct screening values:
1. Use the higher of either the 500 ppmv RF or the 10,000 ppmv RF to adjust allscreening values; or
2. Generate a response factor curve to adjust the screening values.
When it is necessary to apply RFs, site personnel should use engineering judgement to groupprocess equipment into streams containing similar compounds. All components associatedwith a given stream can then be assigned the same RF, as opposed to calculating an RF foreach individual equipment piece. Appendix A of theProtocol document (EPA,November 1995) presents an example about the application of response factors.
REFERENCE
EPA. November 1995.Protocol for Equipment Leak Emission Estimates. U.S.Environmental Protection Agency, Office of Air and Radiation, Office of Air QualityPlanning and Standards, 453/R-95-017. Research Triangle Park, North Carolina.
EIIP Volume II4.B-2

11/29/96 CHAPTER 4 - EQUIPMENT LEAKS
APPENDIX C
MASS EMISSIONS SAMPLING —METHODS AND CALCULATION
PROCEDURES
EIIP Volume II

CHAPTER 4 - EQUIPMENT LEAKS 11/29/96
This page is intentionally left blank.
EIIP Volume II

11/29/96 CHAPTER 4 - EQUIPMENT LEAKS
MASS EMISSIONS SAMPLING (BAGGING)
When bagging an equipment piece, two methods are generally employed in sampling sourceenclosures: the vacuum method (Figure 4.C-1) and the blow-through method (Figure 4.C-2).These two methods differ in the ways that the carrier gas is conveyed through the bag. In thevacuum method, a vacuum pump is used to pull air through the bag. In the blow-throughmethod, a carrier gas such as nitrogen is blown into the bag. In general, the blow-throughmethod has advantages over the vacuum method. These advantages are as follows:
The blow-through method is more conducive to better mixing in the bag.
The blow-through method minimizes ambient air in the bag and thus reducespotential error associated with background organic compound concentrations.(For this reason the blow-through method is especially preferable whenmeasuring the leak rate from components with zero or very low screeningvalues.)
The blow-through method minimizes oxygen concentration in the bag(assuming air is not used as the carrier gas) and the risk of creating anexplosive environment.
In general, less equipment is required to set up the blow-through methodsampling train.
However, the blow-through method does require a carrier gas source, and preferably thecarrier gas should be inert and free of any organic compounds and moisture. The vacuummethod does not require a special carrier gas.
Figures 4.C-3 and 4.C-4 present the calculation procedures for leak rates when using thevacuum and blow-through methods, respectively.
When choosing the bagging material, an important criteria is that it is impermeable to thespecific compounds being emitted from the equipment piece.
Example 4.C-1, for the vacuum method, and Example 4.C-2, for the blow-through method,are presented in two parts. Part 1 shows the data sheets that were presented in Section 6(Figures 4.6-2 and 4.6-3) filled out with the appropriate information, and Part 2 shows howthat information is used to calculate the mass emission rates, using the equations shown inFigures 4.C-3 and 4.C-4.
EIIP Volume II 4.C-1

This line shouldbe as short
as possible
Tent
Leaking
Valve
Cold Trap in Ice Bath
(Optional)
Dry Gas
Meter
Trap
Hg Manometer
Control
Valve
Filter
Small
Diaphragm
Pump Two-Way Valve
Sample Bag
Vacuum
Pump
Pressure
Reading
Device
CHAPTER 4 - EQUIPMENT LEAKS 11/29/96
4.C-2 EIIP Volume II
FIGURE 4.C-1. SAMPLING TRAIN FOR BAGGING A SOURCE USING THE VACUUM METHOD

11/29/96C
HA
PTE
R 4 - E
QU
IPM
EN
T LEA
KS
4.C-3
EIIP
Volum
e II
FIG
UR
E 4.C
-2. EQ
UIP
ME
NT
RE
QU
IRE
D F
OR
TH
E
BL
OW
-TH
RO
UG
H S
AM
PL
ING
TE
CH
NIQ
UE

CHAPTER 4 - EQUIPMENT LEAKS 11/29/96
CALCULATION PROCEDURES FOR LEAK RATE WHEN USING THE VACUUM METHOD
Leak Rate(kg/hr)
=9.63 × 10⁻¹⁰(Q)(MW)(GC)(P)
+(ρ)(vL)
T + 273.15 16.67(t)
where:
9.63 × 10-10 = A conversion factor using the gas constant:
°K × 106 × kg-mol × min
L × hour × mmHg
Q = Flow rate out of bag (L/min)MWa = Molecular weight of organic compound(s) in the sample bag or alternatively in the
process stream contained within the equipment piece being bagged (kg/kg-mol)GCb = Sample bag organic compound concentration (ppmv) minus background bag organic
compound concentrationc (ppmv)P = Absolute pressure at the dry gas meter (mmHg)T = Temperature at the dry gas meter (°C)ρ = Density of organic liquid collected (g/mL)VL = Volume of liquid collected (mL)16.67 = A conversion factor to adjust term to units of kilograms per hour (g × hr)/(kg × min)t = Time in which liquid is collected (min)
a For mixtures, calculate MW as:
where:
n
i 1
MWiXi
n
i 1
Xi
MWi = Molecular weight of organic compound "i"Xi = Mole fraction of organic compound in = Number of organic compounds in mixture.
b For mixtures, the value of GC is the total concentration of all the organic compounds in the mixture.c Collection of a background bag is optional. If a bag of background air is not collected, assume the
background concentration is zero.
FIGURE 4.C-3. CALCULATION PROCEDURES FOR LEAK RATE WHEN USING THEVACUUM METHOD
EIIP Volume II4.C-4

11/29/96 CHAPTER 4 - EQUIPMENT LEAKS
CALCULATION PROCEDURES FOR LEAK RATE WHEN USING THEBLOW-THROUGH METHOD
where:
Leak Rate(kg/hr)
1.219 × 10⁵(Q)(MW)(GC)T 273.15
(ρ)(VL)
16.67(t)×
106 ppmv
106 ppmv GC
1.219 × 10-5 = A conversion factor taking into account the gas constant and assuming apressure in the bag of 1 atmosphere:
°K × 106
× kg-mol
m3
Q = flow rate out of bag (m3/hr);
= N2 Flow Rate (L/min) [0.06 (m3/min)]×1 - [Bag Oxygen Conc. (volume %)/21] (L/hr)
MWa = Molecular weight of organic compounds in the sample bag or alternatively inthe process stream contained within the equipment piece being bagged(kg/kg-mol)
GCb = Sample bag organic compound concentration (ppmv), corrected forbackground bag organic compound concentration (ppmv)c
T = Temperature in bag (°C)ρ = Density of organic liquid collected (g/mL)VL = Volume of liquid collected (mL)16.67 = A conversion factor to adjust term to units of kilograms per hour (g × hr)/(kg
× min)t = Time in which liquid is collected (min)
FIGURE 4.C-4. CALCULATION PROCEDURES FOR LEAK RATE WHEN USING THEBLOW-THROUGH METHOD
EIIP Volume II 4.C-5

CHAPTER 4 - EQUIPMENT LEAKS 11/29/96
CALCULATION PROCEDURES FOR LEAK RATE WHEN USING THEBLOW-THROUGH METHOD (CONTINUED)
a For mixtures, calculate MW as:
n
i 1
MWiXi
n
i 1
Xi
where:
MWi = Molecular weight of organic compound "i"Xi = Mole fraction of organic compound in = Number of organic compounds in mixture
b For mixtures, the value of GC is the total concentration of all the organic compounds in the mixture.c Collection of a background bag is optional. If a bag of background air is not collected, assume the background
concentration is zero. To correct for background concentration, use the following equation:
where:
GC(ppmv) SB
BAG21
× BG
SB = Sample bag concentration (ppmv);BAG = Tent oxygen concentration (volume %); andBG = Background bag concentration (ppmv)
FIGURE 4.C-4. (CONTINUED)
EIIP Volume II4.C-6

11/29/96 CHAPTER 4 - EQUIPMENT LEAKS
EXAMPLE 4.C-1: PART 1
EXAMPLE DATA COLLECTION FORM FOR FUGITIVE EMISSIONSBAGGING TEST (VACUUM METHOD)
Equipment Type Valve Component ID V0101Equipment Category Plant ID P012Line Size Date 10-15-95Stream Phase (G/V, LL, HL) LL Analysis TeamBarometric PressureAmbient Temperature Instrument ID I01Stream Temperature Stream PressureStream Composition (Wt. %)100% TOC MW = 25.4735 kg/kg-mol
, ,
Time Bagging Test Measurement Data
Initial Screening (ppmv) Equipment Piecea 450 Bkgd. 9
Background Bag Organic Compound Conc. (ppmv)b
Sample Bag 1 Organic Compound Conc. (ppmv) 268
Dry Gas Meter Reading (L/min) 2.806
Vacuum Check in Bag (Y/N) (Must be YES to collect sample.)
Dry Gas Meter Temperaturec (°C) 17
Dry Gas Meter Pressurec (mmHg) 668
Sample Bag 2 Organic Compound Conc. (ppmv)
Dry Gas Meter Reading (L/min)
Vacuum Check in Bag (Y/N) (Must be YES to collect sample.)
Dry Gas Meter Temperaturec (°C)
Dry Gas Meter Pressurec (mmHg)
Condensate Accumulation: Starting Time Final Time
Organic Condensate Collected (mL)
Density of Organic Condensate (g/mL)
Final Screening (ppmv) Equip. Piecea 450 Bkgd. 9
a The vacuum method is not recommended if the screening value is approximately 10 ppmv or less.b Collection of a background bag is optional.c Pressure and temperature are measured at the dry gas meter.
EIIP Volume II 4.C-7

CHAPTER 4 - EQUIPMENT LEAKS 11/29/96
EXAMPLE 4.C-1: PART 2
EQUATION FOR CALCULATING THE LEAK RATE USING THE DATA FROM PART 1
Leak Rate =
9.63E 10 (Q)(MW)(GC)(P)T 273.15
=
9.63E 10 °K × 106 × kg mol × minL × hr × mmHg
2.806 Lmin
25.4735 kgkg mol
(268 ppmv)(668 mmHg)(17 273.15)°K
= 4.25E 05 kg/hr
EIIP Volume II4.C-8

11/29/96 CHAPTER 4 - EQUIPMENT LEAKS
EXAMPLE 4.C-2: PART 1
EXAMPLE DATA COLLECTION FORM FOR FUGITIVE EMISSIONS BAGGING TEST(BLOW-THROUGH METHOD)
Equipment Type Valve Component ID V0102
Equipment Category Plant ID P012
Line Size Date 10-15-95
Stream Phase (G/V, LL, HL)LL Analysis Team
Barometric Pressure
Ambient Temperature Instrument ID I01
Stream Temperature Stream Pressure
Stream Composition (Wt. %)100% TOC MW=28.12 kg/kg-mol
, ,
Time Bagging Test Measurement Data
Initial Screening (ppmv) Equipment Piece8 Bkgd. 4
Background Bag Organic Compound Conc. (ppmv)a
Sample Bag 1 Organic Compound Conc. (ppmv) 29.3
Dilution Gas Flow Rate (L/min) 5.21
O2 Concentration (volume %) 2.55
Bag Temperature (°C) 23.89
Sample Bag 2 Organic Compound Conc. (ppmv)
Dilution Gas Flow Rate (L/min)
O2 Concentration (volume %)
Bag Temperature (°C)
Condensate Accumulation: Starting Time Final Time
Organic Condensate Collected (mL)
Density of Organic Condensate (g/mL)
Final Screening (ppmv) Equipment Piece8 Bkgd. 4
a Collection of a background bag is optional. However, it is recommended in cases where the screeningvalue is less than 10 ppmv and there is a detectable oxygen level in the bag.
EIIP Volume II 4.C-9

CHAPTER 4 - EQUIPMENT LEAKS 11/29/96
EXAMPLE 4.C-2: PART 2
EQUATION FOR CALCULATING THE LEAK RATE USING THE DATA FROM PART 1
Q = Dilution Gas Flow Rate
1Bag O2 conc (vol%)
21%
× 0.06 m3/minL/hr
=5.21 L
min
1
2.55%21%
× 0.06 m3/minL/hr
= 0.36 m3/hr
Leak Rate =
1.219E 05 (Q) (MW) (GC)T 273.15
×
106
106 GC
=
1.219E 05 °K × 106 × kg mol × min
m3
0.36 m3
hr
28.12 kgkg mol
(29.3ppmv)
23.89 273.15 °K×
106
106 29.3
= 1.22E 05 kg/hr
EIIP Volume II4.C-10

11/29/96 CHAPTER 4 - EQUIPMENT LEAKS
APPENDIX D
EXAMPLE DATA COLLECTION FORMFOR FUGITIVE EMISSIONS FROM
EQUIPMENT LEAKS
EIIP Volume II

CHAPTER 4 - EQUIPMENT LEAKS 11/29/96
This page is intentionally left blank.
EIIP Volume II

11/29/96 CHAPTER 4 - EQUIPMENT LEAKS
EXAMPLE DATA COLLECTION FORM INSTRUCTIONS
GENERAL
This form may be used as a worksheet to aid in collecting the information/datanecessary to estimate HAP and VOC emissions from equipment leaks.
The form is divided into five sections: General Information; Stream CompositionData; Equipment Counts; Screening Data; and Equipment Leaks Controls.
Some of the sections require entry on a stream basis; for these, a separate copy of thesection will need to be made for each stream in the process unit.
If you want to modify the form to better serve your needs, an electronic copy of theform may be obtained through the EIIP on the CHIEF system ofthe OAQPS TTN.
STREAM COMPOSITION DATA SECTION
Weight percents may not need to be provided for constituents present inconcentrations less than 1.0 weight percent.
In the row labelled "OTHER," identify total weight percent of all constituents notpreviously listed. The total weight percent of constituents labelled as "OTHER" mustnot exceed 10 percent. Total weight percent of all constituents in the stream mustequal 100 percent.
SCREENING DATA SECTION
Complete the information/data for each screened stream.
EIIP Volume II 4.D-1

CHAPTER 4 - EQUIPMENT LEAKS 11/29/96
EQUIPMENT COUNT SECTION
Complete each blank form for each stream in the facility.
The LDAR trigger concentration refers to the concentration level that the componentis considered to be leaking.
Enter the control parameters for each component type in the stream. Provide thepercent of the total equipment type in the stream that has the controls listed in theattached table.
If other controls are used, specify what they are in the space left of the slash. Specifythe percent of each component type in the stream that use the other control in thespace to the right of the slash.
Indicate any secondary control devices to which the closed vent system transports theprocess fluid.
Example 4.D-1 shows how all of the sections of this form would be filled out for the examplepresented in Section 4 (Tables 4.4-1 and 4.4-2) for a hypothetical chemical processingfacility, which is subject to an LDAR program.
EIIP Volume II4.D-2

11/29/96C
HA
PT
ER
4-
EQ
UIP
ME
NT
LEA
KS
Note: Complete this form for each type of fuel used and for each unit.
EXAMPLE DATA COLLECTION FORM - FUGITIVE EMISSIONS FROM EQUIPMENT LEAKS
GENERAL INFORMATION
Process Unit Capacity (lb/yr)
Portable VOC Monitoring Instrument Useda
Calibration Gas of Monitoring Instrumenta
STREAM COMPOSITION DATA
CASNumber Chemical Name
Concentration (wt.%)
Stream 1 Stream 2 Stream 3 Stream 4 Stream 5
-- OTHER
-- Total HAPs
-- Total VOCs
-- Sourcec
Amount of Time Fluid in Stream (hr/yr)
a Collect information if screening data have been gathered at the process unit.b CAS = Chemical Abstract Service.c EJ = Engineering judgement; TD = Test data; LV = Literature values.
EIIP
Volum
eII
4.D-3

CH
AP
TE
R4
-E
QU
IPM
EN
TLE
AK
S11/29/96
EXAMPLE DATA COLLECTION FORM - FUGITIVE EMISSIONS FROM EQUIPMENT LEAKS
EQUIPMENT COUNTS
Component Service Count SourcebStream 1
(A)Stream 2
(B)Stream 3
(C)
Valves gas/vapor
light liquid
heavy liquid
Connectors all
Pumps light liquid
heavy liquid
Compressor gas/vapor
Open Lines all
Sample Connections all
Pressure Relief Valve gas/vapor
a Do not include equipment in vacuum service.b D = Design specifications; I = Inspection and maintenance tags; C = Actual count; and R = Ratio; if ratio, specify (i.e., 25 valves per
pump).
EIIP
Volum
eII
4.D-4

11/29/96C
HA
PT
ER
4-
EQ
UIP
ME
NT
LEA
KS
EXAMPLE DATA COLLECTION FORM - FUGITIVE EMISSIONS FROM EQUIPMENT LEAKS
SCREENING DATA
Stream ID: Component Type:
Date Components Screened: Total Number of Components Screened
Component ID Screening Value (ppmv)
EIIP
Volum
eII
4.D-5

CH
AP
TE
R4
-E
QU
IPM
EN
TLE
AK
S11/29/96
EXAMPLE DATA COLLECTION FORM - FUGITIVE EMISSIONS FROM EQUIPMENT LEAKS
EQUIPMENT LEAKS CONTROLS
Stream ID:
Is the equipment in this stream subject to a LDAR program? (Yes/No)
Type of Monitoring Systema:
Leak Detection and Repair Parameters Control Parameters
EquipmentQuantity in
Program
LDARTriggerConc.
MonitoringFrequency
ResponseTimeb
Percent withControl Ac
Percent withControl Bc
Percent withControl Cc Other
Closed VentSecondary
Control
Valves NAd /
Pumps /
Compressors NA /
Connectors NA NA /
Open-endedlines
NA /
SamplingConnections
NA NA NA NA /
PressureRelief Valves
NA /
a V = Visual; P = Portable; F = Fixed point; If other, please specify.b IM = Immediately; D = 1 day; D3 = 3 days; W = 1 week; W2 = 2 weeks; and M = 1 month.c See attached table, Controls by Equipment Type.d NA = Not applicable.
EIIP
Volum
eII
4.D-6

11/29/96C
HA
PT
ER
4-
EQ
UIP
ME
NT
LEA
KS
EXAMPLE DATA COLLECTION FORM - FUGITIVE EMISSIONS FROM EQUIPMENT LEAKS
TABLE OF CONTROLS BY EQUIPMENT TYPE
Control Option Equipment Controls
A All Closed vent system
B ValvesPumpsCompressorsOpen-ended linesSampling ConnectionsPRVs
SeallessDual mechanical seal with barrier fluidMechanical seals with barrier fluidCapped, plugged, blind-flaggedIn-situ samplingRupture disk
C PumpsSampling connections
SeallessClosed loop sampling
EIIP
Volum
eII
4.D-7

CH
AP
TE
R4
-E
QU
IPM
EN
TLE
AK
S11/29/96
EXAMPLE 4.D-1
EXAMPLE DATA COLLECTION FORM -FUGITIVE EMISSIONS FROM EQUIPMENT FROM EQUIPMENT LEAKS
GENERAL INFORMATION
Process Unit Capacity (lb/yr) 800,000
Portable VOC Monitoring Instrument Useda Foxboro OVA Model108
Calibration Gas of Monitoring Instrumenta Methane
STREAM COMPOSITION DATA
CASNumber Chemical Name
Concentration (wt%)
Stream 1(A)
Stream 2(B)
Stream 3(C) Stream 4 Stream 5
140885 ETHYL ACRYLATE 80 10 65
100425 STYRENE 90
74840 ETHANE 25
7732185 WATER 20 10
-- OTHER
-- Total HAPs 80 100 65
-- Total VOCs 80 100 90
-- Sourceb TD TD TD
Amount of Time Fluid in Stream (hr/yr) 8760 4380 8760
a Collect information if screening data have been gathered at the process unit.b EJ = Engineering judgement; TD = Test data; LV = Literature values.
EIIP
Volum
eII
4.D-8

11/29/96C
HA
PT
ER
4-
EQ
UIP
ME
NT
LEA
KS
EXAMPLE 4.D-1
(CONTINUED)
EQUIPMENT COUNTS
Component ServiceCount Sourceb Stream 1
(A)Stream 2
(B)Stream 3
(C)
Valves gas/vapor C 40
light liquid
heavy liquid
Connectors all
Pumps light liquid C 15 12
heavy liquid
Compressor gas/vapor
Open Lines all
Sample Connections all
Pressure Relief Valve gas/vapor
a Do not include equipment in vacuum service.b D = Design specifications; I = Inspection and maintenance tags; C = Actual count; and R = Ratio; if ratio, specify (i.e., 25 valves per
pump).
EIIP
Volum
eII
4.D-9

CH
AP
TE
R4
-E
QU
IPM
EN
TLE
AK
S11/29/96
EXAMPLE 4.D-1
(CONTINUED)
SCREENING DATA
Stream ID: A Component Type:Light Liquid Pump
Date Components Screened:7-15-95 Total Number of Components Screened:15
Component ID Screening Value (ppmv)
A-1 0
A-2 0
A-3 0
A-4 0
A-5 0
A-6 20
A-7 50
A-8 50
A-9 100
A-10 100
A-11 200
A-12 400
A-13 1000
A-14 2000
A-15 5000
EIIP
Volum
eII
4.D-10

11/29/96C
HA
PT
ER
4-
EQ
UIP
ME
NT
LEA
KS
EXAMPLE 4.D-1
(CONTINUED)
SCREENING DATA
Stream ID: B Component Type:Light Liquid Pump
Date Components Screened:7-15-95 Total Number of Components Screened:11
Component ID Screening Value (ppmv)
B-1 0
B-2 0
B-3 0
B-4 10
B-5 30
B-6 250
B-7 500
B-8 2000
B-9 5000
B-10 8000
B-11 25,000
EIIP
Volum
eII
4.D-11

CH
AP
TE
R4
-E
QU
IPM
EN
TLE
AK
S11/29/96
EXAMPLE 4.D-1
(CONTINUED)
SCREENING DATA
Stream ID: C Component Type:Gas/Vapor Valve
Date Components Screened:7-15-95 Total Number of Components Screened:40
Component ID Screening Value (ppmv)
C-1 0
C-2 0
C-3 0
C-4 0
C-5 0
C-6 0
C-7 15
C-8 20
C-9 20
C-10 35
C-11 50
C-12 50
C-13 120
C-14 150
C-15 200
EIIP
Volum
eII
4.D-12

11/29/96C
HA
PT
ER
4-
EQ
UIP
ME
NT
LEA
KS
EXAMPLE 4.D-1
(CONTINUED)
SCREENING DATA
Stream ID: C Component Type:Gas/Vapor Valve
Date Components Screened:7-15-95 Total Number of Components Screened:40
Component ID Screening Value (ppmv)
C-16 500
C-17 550
C-18 575
C-19 600
C-20 610
C-21 700
C-22 800
C-23 1010
C-24 1200
C-25 1500
C-26 1550
C-27 1700
C-28 2000
C-29 5000
C-30 5100
EIIP
Volum
eII
4.D-13

CH
AP
TE
R4
-E
QU
IPM
EN
TLE
AK
S11/29/96
EXAMPLE 4.D-1
(CONTINUED)
SCREENING DATA
Stream ID: C Component Type:Gas/Vapor Valve
Date Components Screened:7-15-95 Total Number of Components Screened:40
Component ID Screening Value (ppmv)
C-31 6100
C-32 7000
C-33 8000
C-34 8100
C-35 8150
C-36 8300
C-37 9000
C-38 10,000
C-39 15,000
C-40 50,000
EIIP
Volum
eII
4.D-14

11/29/96C
HA
PT
ER
4-
EQ
UIP
ME
NT
LEA
KS
EXAMPLE 4.D-1
(CONTINUED)
EQUIPMENT LEAKS CONTROLS
Stream ID: A
Is the equipment in this stream subject to a LDAR program? (Yes/No)Yes
Type of Monitoring Systema: P
Leak Detection and Repair Parameters Control Parameters
EquipmentQuantity in
Program
LDARTriggerConc.
MonitoringFrequency
ResponseTimeb
Percent withControl Ac
Percent withControl Bc
Percent withControl Cc Other
Closed VentSecondary
Control
Valves NAd /
Pumps 15 10,000 ppm monthly W 53% 7% 40% /
Compressors NA /
Connectors NA NA /
Open-endedlines
NA /
SamplingConnections
NA NA NA NA /
PressureRelief Valves
NA /
a V = Visual; P = Portable; F = Fixed point; If other, please specify.b IM = Immediately; D = 1 day; D3 = 3 days; W = 1 week; W2 = 2 weeks; and M = 1 month.c See attached table, Controls by Equipment Type.d NA = Not applicable.
EIIP
Volum
eII
4.D-15

CH
AP
TE
R4
-E
QU
IPM
EN
TLE
AK
S11/29/96
EXAMPLE 4.D-1
(CONTINUED)
EQUIPMENT LEAKS CONTROLS
Stream ID: B
Is the equipment in this stream subject to a LDAR program? (Yes/No)Yes
Type of Monitoring Systema: P
Leak Detection and Repair Parameters Control Parameters
EquipmentQuantity in
Program
LDARTriggerConc.
MonitoringFrequency
ResponseTimeb
Percent withControl Ac
Percent withControl Bc
Percent withControl Cc Other
Closed VentSecondary
Control
Valves NAd /
Pumps 12 10,000 ppm monthly W 67% 33% 0% /
Compressors NA /
Connectors NA NA /
Open-endedlines
NA /
SamplingConnections
NA NA NA NA /
PressureRelief Valves
NA /
a V = Visual; P = Portable; F = Fixed point; If other, please specify.b IM = Immediately; D = 1 day; D3 = 3 days; W = 1 week; W2 = 2 weeks; and M = 1 month.c See attached table, Controls by Equipment Type.d NA = Not applicable.
EIIP
Volum
eII
4.D-16

11/29/96C
HA
PT
ER
4-
EQ
UIP
ME
NT
LEA
KS
EXAMPLE 4.D-1
(CONTINUED)
EQUIPMENT LEAKS CONTROLS
Stream ID: C
Is the equipment in this stream subject to a LDAR program? (Yes/No)Yes
Type of Monitoring Systema: P
Leak Detection and Repair Parameters Control Parameters
EquipmentQuantity in
ProgramLDAR Trigger
Conc.MonitoringFrequency
ResponseTimeb
Percent withControl Ac
Percent withControl Bc
Percent withControl Cc Other
Closed VentSecondary
Control
Valves 40 10,000 ppm monthly W 50% 50% NAd /
Pumps /
Compressors NA /
Connectors NA NA /
Open-endedlines
NA /
SamplingConnections
NA NA NA NA /
PressureRelief Valves
NA /
a V = Visual; P = Portable; F = Fixed point; If other, please specify.b IM = Immediately; D = 1 day; D3 = 3 days; W = 1 week; W2 = 2 weeks; and M = 1 month.c See attached table, Controls by Equipment Type.d NA = Not applicable.
EIIP
Volum
eII
4.D-17

CHAPTER 4 - EQUIPMENT LEAKS 11/29/96
This page is intentionally left blank.
EIIP Volume II4.D-18