EIGHTH ANNUAL SOUTHERN CALIFORNIA ECONOMIC RECOVERY …economy.scag.ca.gov/Economy site document...
43
Orange County Business Council November 2017 EIGHTH ANNUAL SOUTHERN CALIFORNIA ECONOMIC RECOVERY & JOB CREATION SUMMIT 2017 ORANGE COUNTY ECONOMIC UPDATE Prepared for the Southern California Association of Governments
Transcript of EIGHTH ANNUAL SOUTHERN CALIFORNIA ECONOMIC RECOVERY …economy.scag.ca.gov/Economy site document...
Orange County Business Council November 2017
EIGHTH ANNUAL SOUTHERN CALIFORNIA ECONOMIC RECOVERY & JOB CREATION
SUMMIT
2017 ORANGE COUNTY ECONOMIC UPDATE
Prepared for the
Southern California Association of Governments


Table of Contents Page | i
Table of Contents
Section 1 ‐ Introduction .................................................................................................................. 3
Section 2 – Current Economic Conditions ...................................................................................... 5
Section 3 ‐ Key Existing and Emerging Industries ......................................................................... 12
Section 4 – Industry Innovation in Orange County ....................................................................... 17
Section 5 ‐ Occupational Employment and Salary Growth ........................................................... 23
Section 6 ‐ Income and Poverty Statistics ..................................................................................... 27
Section 7 ‐ Educational Attainment Demographics ...................................................................... 30
Section 8 ‐ Housing Market and Construction Activity ................................................................. 33
Section 9 ‐ Final Thoughts ......................................................................................................... 4039

List of Figures Page | ii
List of Figures
Exhibit 2.1 Unemployment Rates (Jan. 2008 – Aug. 2017) ................................................................................................................ 57
Exhibit 2.2 Orange County Labor Force Characteristics (2008‐2017) ................................................................................................. 68
Exhibit 2.3 Orange County Labor Force Participation Rate (2001 – 2017 YTD) ................................................................................... 68
Exhibit 2.4 SCAG Region GDP Growth (2012 ‐ 2016) ......................................................................................................................... 79
Exhibit 2.5 2016 SCAG Regional GDP ($ in Billions) ......................................................................................................................... 810
Exhibit 2.6 Orange County Projected Population Change by Age Group (2010‐2060) ...................................................................... 911
Exhibit 2.7 Orange County Projected Population Change (2010‐2060) ............................................................................................ 911
Exhibit 2.8 Orange County Population Growth (2000‐2016) ......................................................................................................... 1012
Exhibit 3.1 Orange County Industry Employment Breakdown (August 2017) ................................................................................ 1214
Exhibit 3.2 Orange County Annual Industry Trends (2010‐2017 YTD) ............................................................................................ 1315
Exhibit 3.3 Orange County Annual Industry Cluster Employment Trends (2009‐2016) .................................................................. 1416
Exhibit 3.4 Orange County Annual Industry Cluster Salary Trends (2009‐2016) ............................................................................. 1517
Exhibit 3.5 Projected Changes in Orange County Employment by Industry (2014 – 2024) ............................................................. 1618
Exhibit 4.1 Top 10 Orange County Industry Clusters by Location Quotient ................................................................................... 1820
Exhibit 4.2 Venture Capital Investments in Orange County, 2006 – Q2 2017 ................................................................................. 1921
Exhibit 4.3 Venture Capital Investments in Orange County by Sector, 2011‐2016 ......................................................................... 1921
Exhibit 4.4 Proportion of Venture Capital Investments in Orange County by Sector, 2016 ............................................................ 2022
Exhibit 4.5 Top 10 California Counties by Patent Count, 2012‐2016 ..................................................... Error! Bookmark not defined.23
Exhibit 4.6 Patent Grants Awarded per 10,000 Residents in the United States, California and Orange County, 2008‐2015 ............ 2123
Exhibit 5.1 Orange County Occupational Employment Distribution .............................................................................................. 2325
Exhibit 5.2 Orange County Occupational and Salary Year‐over‐Year Absolute Growth .................................................................. 2426
Exhibit 5.3 Projected Orange County Employment Growth by Occupational Group and Current Average Salaries (2014‐2024) ..... 2527
Exhibit 5.4 Average Salaries of Fastest‐Growing Occupations in Orange County (2014‐2024)........................................................ 2628
Exhibit 6.1 Orange County Income and Poverty Rates (2000‐2016) .............................................................................................. 2729
Exhibit 6.2 Orange County Household Income Profile .................................................................................................................. 2830
Exhibit 6.3 Percent of Orange County Households Earning Above or Below $50,000 .................................................................... 2830
Exhibit 6.4 Poverty Rates by Region (2014) .................................................................................................................................. 2931
Exhibit 7.1 Orange County Educational Attainment, Population over 25 (2016) ........................................................................... 3032
Exhibit 7.2 Orange County Tech‐Related Degrees Granted (2000 – 2016) ..................................................................................... 3033
Exhibit 7.3 Median Wages by Educational Attainment, Orange County Workers over 25 (2015) ................................................... 3234
Exhibit 7.4 Orange County Unemployment & Poverty Rates by Educational Attainment (2016) ................................................... 3234
Exhibit 8.1 Orange County Median Home Prices (2008‐2017): New vs. Existing Homes ................................................................ 3335
Exhibit 8.2 Southern California Regional Home Prices (All Structures), 2007‐YTD 2017 ................................................................. 3436
Exhibit 8.3 Orange County Home Sales, 2007‐July 2017 ............................................................................................................... 3436
Exhibit 8.4 Orange County Building Permits (2009‐2017) ............................................................................................................. 3537
Exhibit 8.5 Orange County Average Apartment Rental Rates, 2012 – 2017 YTD ............................................................................ 3738
Exhibit 8.6 California Association of Realtors Affordability Index ................................................................................................. 3738
Exhibit 8.7 Orange County Renter and Owner Housing Costs as a Percent of Income (2016) ......................................................... 3839
Exhibit 8.8 Orange County Foreclosures, 2007‐Q2 2017 ............................................................................................................... 3940

Section 1 – Introduction Page | 3
Section1‐Introduction
Commissioned by the Southern California Association of Governments (SCAG), the 2017 Orange
County Economic Update was created to provide an overview of current economic,
demographic, and housing conditions in Orange County, as well as short‐ and long‐term
projections of these conditions. This will help local elected officials, business leaders, and
policymakers better understand current and future economic trends and their potential to
enhance or disrupt local and regional economic strategies. The eighth annual Southern
California Economic Summit, the occasion of this report’s release, will be held on November 9,
2017, co‐hosted by SCAG and the Southern California Leadership Council.
Metrics highlighted in this report include measures and projections of demographics,
employment, industry clusters, educational attainment levels, income and poverty, and the
housing market, broken down into the following sections:
Current Economic Conditions
Key Existing and Emerging Industries
Innovation in Orange County
Occupational Employment and Salary Growth
Income and Poverty Statistics
Educational Attainment Demographics
Housing Market and Construction Activity
This report highlights economic trends at the local, regional, state and national level to provide
elected officials and regional stakeholders with a better understanding of the current economic
landscape, allowing them to better align current and proposed strategies and policies to
maximize their effectiveness leverage these trends while minimizing their potential negative
impacts. While Orange County’s demographics and housing industry have been undergoing
decade‐long shifts, such as an aging population and high housing prices, new trends are
beginning to emerge due to technological advancements and changing generational
preferences. These new shifts include the continued disruption to retail brought on by e‐
commerce, the growing use of artificial intelligence (AI) and computer learning, and a shifting
labor market underscored by changes for in‐demand skills.
While some degree of uncertainty will likely continue looming over parts of the regional
economy, local and regional leaders should continue to look forward and plan for the future.
Crafting strategies to capitalize, leverage, and maximize the upside of economic development
opportunities, while anticipating potential economic disruptions and minimizing the downside
of their negative impacts, will be key to responding and adapting to a changing economic
landscape. Orange County, with its diversified labor market, strong industry clusters, strong

List of Figures Page | 4
business climate, and innovative spirit must continue to act as the engine for regional economic
activity.
Section 2 – Current Economic Conditions Page | 5
Section2–CurrentEconomicConditions
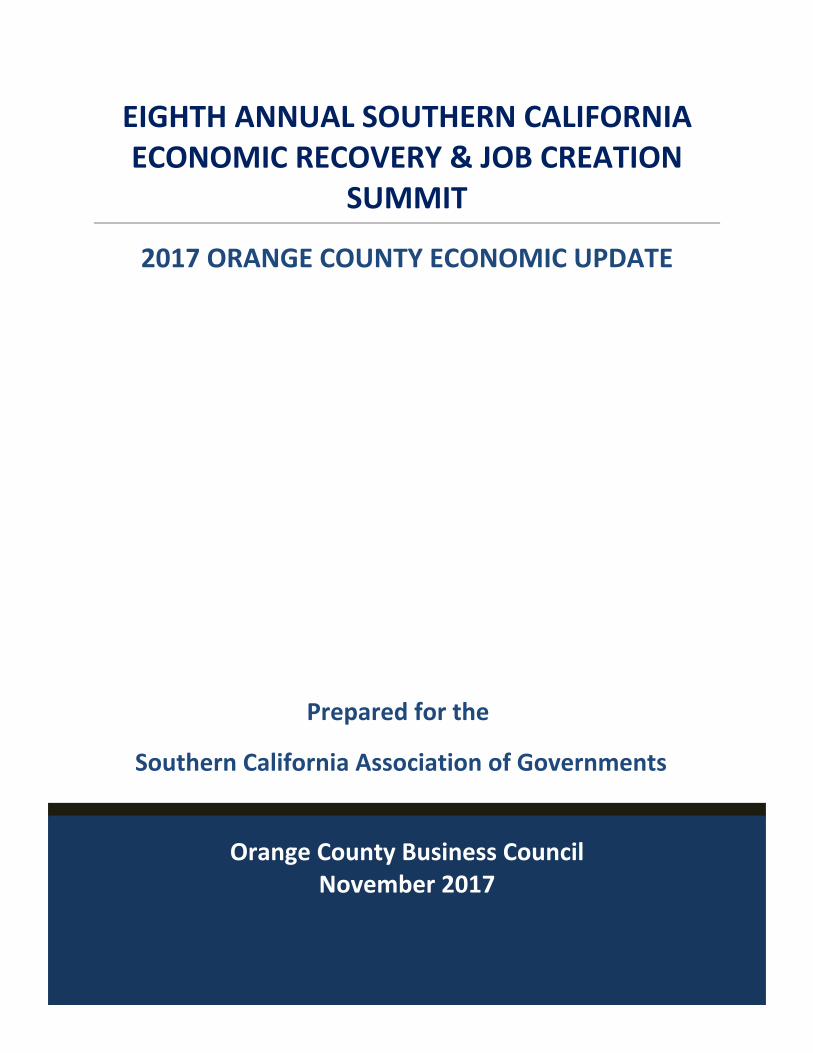
Orange County’s unemployment rate continues to outperform both the state and national rates
as well as rates in peer counties, emphasizing its continued economic growth. The county’s
unemployment rate reached 3.6 percent in September 2017 after hitting a pre‐recession low of
3.1 percent in May; this trend, however, also occurred at the state and national level and
reflects annual shifts in seasonal employment and the yearly influx of college graduates into the
labor market. Orange County’s unemployment rate in September was 1.1 percent lower than
the statewide average and 0.5 percent lower than the national average. Exhibit 2.1 shows
county, state, and national unemployment rates over the past nine years, highlighting Orange
County’s strong recovery from the Great Recession.
Exhibit 2.1 Unemployment Rates (Jan. 2008 – Sept. 2017)
Source: California Employment Development Department
Orange County’s labor force has continued to grow over the past years and the proportion of
employed and unemployed individuals has improved significantly, with the number of
employed individuals has expanded by 24,500 and the number of unemployed individuals has
decreased by 27,600 over the same time period.

Section 2 – Current Economic Conditions Page | 6
Exhibit 2.2 Orange County Labor Force Characteristics (2008‐2017)
Source: California Employment Development Department
Orange County’s labor force participation reflects overall demographic trends. As of September,
the county had a labor force participation rate of 50.5 percent, well below pre‐recession highs
and unchanged compared to last year; Orange County has a growing population of retirees and
a shrinking working‐age population driven in part by high housing costs. These trends are
expected to continue and, alongside automation, will further transform the county’s labor
market.
Exhibit 2.3 Orange County Labor Force Participation Rate (2001 – 2017 YTD)
Source: California Employment Development Department

Section 2 – Current Economic Conditions Page | 7
Exhibit 2.4 SCAG Region GDP Growth (2012 ‐ 2016)
Source: OCBC Analysis of U.S. Department of Commerce, Bureau of Economic Analysis Data
Exhibit 2.4 above shows the sustained growth of the Southern California regional economy.
Total GPD for the SCAG region (including Los Angeles, Orange, San Bernardino, Riverside,
Imperial, and Ventura counties) grew from $951.5 billion in 2012 to $1,204.9 billion in 2016; the
SCAG region’s economy is larger than those of Australia, Mexico, and Indonesia. Orange County
accounted for 23.7 percent of the region’s GDP, $286.5 billion, in 2016, trailing only Los Angeles
County. Exhibit 2.5 breaks down the SCAG GDP by county.

Section 2 – Current Economic Conditions Page | 8
Exhibit 2.5 2016 SCAG Regional GDP ($ in Billions)
Source: OCBC Analysis of U.S. Department of Commerce, Bureau of Economic Analysis Data,
Orange County, as previously mentioned, is currently undergoing several major, long‐term
demographic shifts with significant economic consequences. The California Department of
Finance predicts that the county’s School Age, College Age, and Working Age populations will
shrink by 21 percent, 16 percent, and 0.4 percent, respectively, between 2010 and 2060.
Older age groups, on the other hand, will experience dramatic growth: 103 percent for Young
Retirees, 223 percent for Mature Retirees, and 487 percent for Seniors, as shown in Exhibit. 2.6.
County stakeholders and policymakers must address the impacts of these changes, which will
affect everything from industry employment, as an older population increases demand for
healthcare services, to senior services, to the housing market, as retirees may seek to find
smaller, more affordable living accommodations.

Section 2 – Current Economic Conditions Page | 9
Exhibit 2.6 Orange County Projected Population Change by Age Group (2010‐2060)
Source: California Department of Finance, Demographic Research Unit
Orange County’s demographic makeup is also shifting, as shown in Exhibit 2.7; the California
Department of Finance estimates Orange County will continue to become more diverse over
the coming decades. The county’s diverse population has already provided major economic
benefits by attracting well‐educated and talented workers from around the world. As the
county becomes more diverse, policymakers should ensure world‐class education, training, and
economic opportunity for all ethnic groups. Improving English language programs, for example,
will help guarantee a steady supply of young workers to fill job openings created by the
retirement of older workers.
Exhibit 2.7 Orange County Projected Population Change (2010‐2060)

Section 2 – Current Economic Conditions Page | 10
Source: California Department of Finance, Demographic Research Unit
Before 2000, Orange County’s population growth came from migration into the region rather
than natural increase (births minus deaths), a trend that has since reversed. Since 2000, natural
increase has increased the county’s population by 415,721, an average 24,454 per year, while
net migration (both national and international) has reduced the population by 35,041, an
average of 2,061 per year since 2000. While international migration into Orange County
remains a steady source of population growth, negative domestic migration continues to limit
growth. The county’s net migration first turned negative in 2002 and persisted until 2010,
reflecting the effects of rising home prices and the Great Recession. As the recession took hold,
individuals and families saw their savings depleted, forcing many residents to leave Orange
County for more affordable areas. Since 2010, however, net migration has turned positive,
averaging 8,392 per year due to sustained international migration.
Exhibit 2.8 Orange County Population Growth (2000‐2016)

Section 2 – Current Economic Conditions Page | 11
Source: California Department of Finance, Demographic Research Unit
As the end of 2017 nears, Orange County continues to show economic resilience in the face of
demographic and technological disruption. Alongside demographic shifts, advancing technology
and generational preferences are transforming many of Orange County’s established industries.
In retail, for example, e‐commerce continues to take more and more market share from
traditional “brick‐and‐mortar” malls, a trend that will accelerate growth in logistics and
industrial (warehouse) retail estate. In manufacturing, the emergence of “Industry 4.0” has led
to the Digital Factory, which combines digital and physical systems through automation,
machine learning, and the Internet of Things (IoT) to significantly increase efficiency. These
emerging technologies have the potential to transform a wide variety of industries in addition
to retail and manufacturing.
Technological advances, which provide significant benefits for traditional and emerging
industry clusters, require a strong support system to flourish. Along with the looming skills gap,
they encourage the creation of new educational programs that develop the “hard” technical
skills needed for these new jobs. This focus, however, has led many programs to neglect the
“soft” skills, such as leadership and teamwork, which are equally important in the job market
and play a major role in productivity and career advancement.

Section 3 – Key Existing and Emerging Industries Page | 12
Section3‐KeyExistingandEmergingIndustries
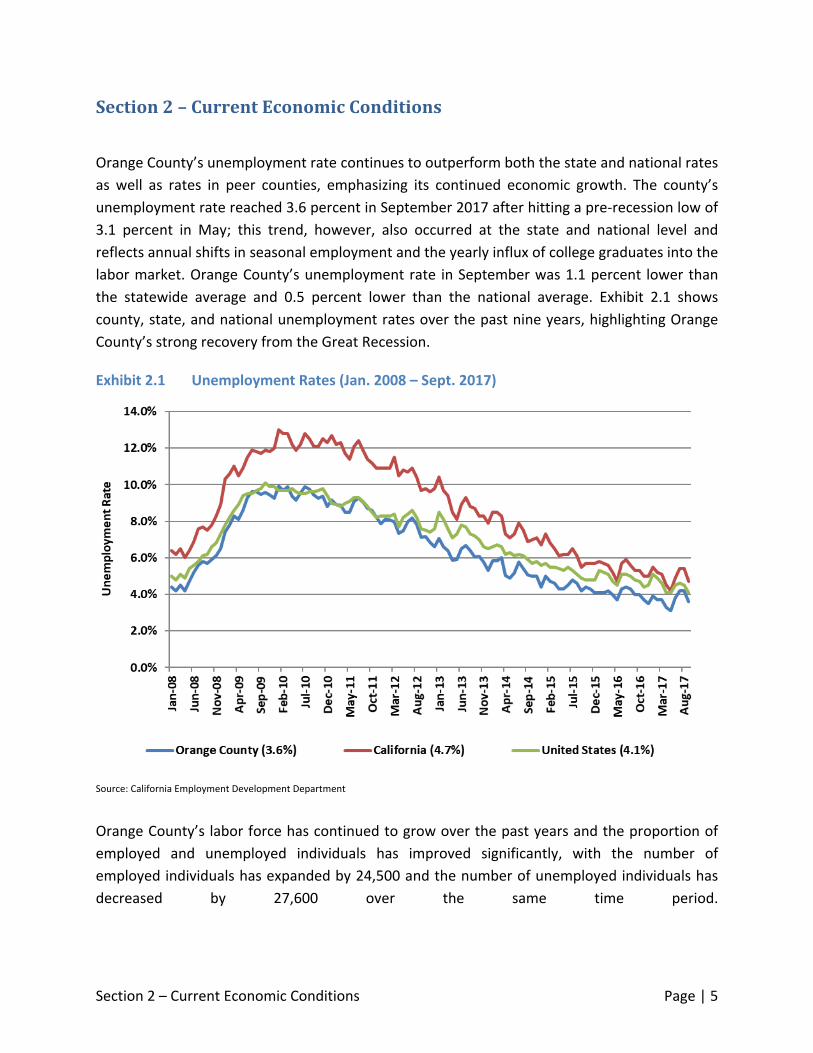
Recent data from the California Employment Development Department (EDD) shows that
Professional & Business Services, Leisure & Hospitality, and Educational & Health Services
continue to be Orange County’s largest industries in terms of employment. Construction saw
the largest percentage growth of employment (7.9 percent) over the past year, followed by
Other Services (3.4 percent) and Leisure and Hospitality (2.1 percent).
Exhibit 3.1 Orange County Industry Employment Breakdown (September 2017)
Source: California Employment Development Department
Section 3 – Key Existing and Emerging Industries Page | 13
Exhibit 3.2 provides a six‐year overview of employment trends by industry in Orange County,
showcasing changes in the county’s key industries. The chart’s employment totals are current
as of September 2017.
Exhibit 3.2 Orange County Annual Industry Trends (2010‐2017 YTD)
Source: California Employment Development Department
In addition to industries, industry clusters provide an equally important picture of Orange
County’s economic climate. Industry clusters occur through the aggregation of similar,
specialized businesses which lead to deeper talent pools, economic growth via high multiplier
effects on other industries, innovation, productivity and employment growth. Industry clusters
also spur economic competitiveness, enable the formation of centers of excellence, increase
employee attraction and retention and encourage the creation of important partnerships
between businesses, local governments and educational institutions. These partnerships, in
turn, lead to increased innovation and patent creation, specialized career training programs,
enhanced research and development capabilities and additional employment growth across a
number of supplemental industries. By encouraging the development of industry clusters,
Source: California EDD

Section 3 – Key Existing and Emerging Industries Page | 14
Orange County can strengthen the regional economy and provide a variety of employment
opportunities both within the clusters themselves and across all industries in the region.
Driven by a growing economy, Orange County’s Tourism cluster added 6,788 jobs between
2015 and 2016, the most of any industry cluster. Construction, benefitting from increasing
housing demand, saw the second largest increase in jobs (5,758), followed by Hotels and
Restaurants (5,608) which also benefited from the county’s status as a world‐class tourist
destination. The Information Technology (IT) and Biotechnology clusters also saw employment
growth; this growth is especially welcome considering the innovative nature of these clusters as
well as their above average wages.
Exhibit 3.3 Orange County Annual Industry Cluster Employment Trends (2009‐2016)
Source: California Employment Development Department, Quarterly Census of Employment and Wages
Wage growth provides another reason for optimism. Orange County’s average 2016 cluster
employment salary was $68,467, a 0.5 percent increase from 2015. All of Orange County’s
major industry clusters experienced salary increases in 2016 except for Biotechnology, which

Section 3 – Key Existing and Emerging Industries Page | 15
experienced a decline due to a significant drop in one sub‐sector, Research and Development in
Physical, Engineering and Life Sciences; this sector experienced a dramatic salary increase in
2015, suggesting that this year’s decrease reflects normalization of data rather than a severe
decline. The highest increase in average percent salary over the past year occurred in Business
and Professional Services, which increased by 8.3 percent or by $7,144 since 2015. The second
highest percent increase in cluster salaries was in the Information Technology industry cluster,
which increased by 6.2 percent, followed by Construction which increased by 3.7 percent and
Tourism which saw salaries increase by 3.5 percent; this is an especially welcome increase for a
regionally important industry typically characterized by traditionally low‐skill, low‐wage
positions.
Exhibit 3.4 Orange County Annual Industry Cluster Salary Trends (2009‐2016)
Source: California Employment Development Department, Quarterly Census of Employment and Wages

Section 3 – Key Existing and Emerging Industries Page | 16
The California Employment Development Department’s (EDD) 2014‐2024 employment
projections predict that the Professional and Businesses Services sector will add almost 50,000
jobs between 2014 and 2024; Educational Services and Healthcare and Leisure and Hospitality
are expected to add 38,999 and 36,200 jobs, respectively, over the same period. The growth in
Healthcare employment reflects Orange County’s aging population, which will require more
and more health services over time.
Exhibit 3.5 Projected Changes in Orange County Employment by Industry (2014 – 2024)
Source: California Employment Development Department

Section 5 – Occupational Employment and Salary Growth Page | 17
Section4–IndustryInnovationinOrangeCounty
Technology, as mentioned before, has evolved at an incredible pace over the recent past,
disrupting industry after industry and forcing stakeholders to rethink their short‐ and long‐term
plans. Orange County, along with the rest of the United States, is the middle of a shift from a
production‐based economy to a knowledge‐based, increasingly interconnected digital economy
fueled by automation, robotics, machine learning, big data and various communication
technologies. These trends are especially apparent in Orange County, which is home to industry
clusters that continue to spur innovation. This section highlights key regional industry clusters,
their recent evolution, and their valuable contributions to the regional economy.
Industry clusters, as mentioned before, are regional concentrations of related organizations
which supplement and complement one another’s operations allowing for increased levels of
innovation, competitiveness, economic growth and job creation. Detroit’s automotive industry,
Hollywood’s film industry and the Napa and Sonoma Valley wine industry are examples of
world‐class industry clusters. These clusters typically provide increased level of economic
activity through high multiplier effects and above‐average wages paid to workers, while their
proximity to customers and complimentary industries leads to collaboration and innovation as a
well as economic growth.
Industry clusters rely on support from suppliers, administrative service providers, venture
capital sources, research organizations, and educational institutions. Together these services
create an innovative ecosystem which drives innovation, provides high‐wage occupations and
greatly enhances regional productivity.
The U.S. Cluster Mapping Project, an interactive website created by Harvard Business School
and the U.S. Economic Development Administration, provides a detailed view of Orange
County’s strongest industries. The concentration of these industries is measured by the
“location quotient:” the ratio of an industry’s share of total state employment in a location
relative to its share of total national employment. The location quotient, in other words,
measures the specialization or concentration of a cluster in a particular location relative to the
national average.
Medical Devices, the most concentrated industry in the county, boasts a location quotient of
5.83, indicating industry employment in Orange County is almost 6 times more concentrated
than at the national level. Orange County’s Medical Devices industry employed 18,625 workers
as of 2015, the highest in the nation and 7.41 percent of national Medical Device employment.
Apparel, the second most concentrated industry in Orange County, employed 3,745 workers, or
2.9 percent of the national share, with an LQ of 2.35. Biopharmaceuticals, IT & Analytical
Instruments, and Hospitality and Tourism also have significant concentrations in Orange

Section 5 – Occupational Employment and Salary Growth Page | 18
County. Exhibit 4.1 shows the industry clusters with the highest Location Quotients in Orange
County, illustrating their local and national importance.
Exhibit 4.1 Top 10 Orange County Industry Clusters by Location Quotient
O.C. Industry Clusters by Location Quotient
Industry Cluster Location Quotient
Employment (2015)
Share of National Employment
National Ranking
Medical Devices 5.83 18,625 7.41% 1 Apparel 2.35 3,745 2.99% 3 Biopharmaceuticals 2.15 6,623 2.73% 6 IT & Analytical Instruments 1.92 26,041 2.44% 5 Hospitality and Tourism 1.89 76,013 2.40% 5 Aerospace Vehicles and Defense 1.88 12,610 2.39% 11 Lighting and Electrical Equipment 1.72 6,377 2.19% 4 Metalworking Technology 1.72 10,737 2.19% 6 Recreational and Electric Goods 1.63 3,159 2.08% 3 Financial Services 1.56 38,169 1.99% 7 Source: U.S. Cluster Mapping, Harvard Business School, U.S. Economic Development Administration
Orange County’s highly concentrated industry clusters drive overall economic activity and
increase the area’s specialization and ability to innovate, as illustrated by the startups that the
county draws like a magnet. Exhibit 4.2 shows annual venture capital investments in Orange
County from 2006 to year‐to‐date 2017. After more than $900 million in venture capital funding
in 2011, investments in Orange County continually decreased, eventually hitting approximately
$500 million in 2014 before jumping back up to $1,151 million in 2015 and $1,140 million in
2016. Orange County venture capital investments in have been focused on high‐tech start‐ups
largely located in the Irvine area, which benefits from a number of incubators and other
business support organizations such as UCI Applied Innovation at the Cove.

Section 5 – Occupational Employment and Salary Growth Page | 19
Exhibit 4.2 Venture Capital Investments in Orange County, 2006 – Q2 2017
Source: National Venture Capital Association, Orange County Register
Taking a closer look at where venture capital investments have been concentrated, Exhibit 4.3
below highlights the total investments by sector in Orange County between 2011 and 2016. The
top three sectors included Software with $1.18 billion, Medical Devices and Equipment with
$1.03 billion and Industrial/Energy with $723 million.
Exhibit 4.3 Venture Capital Investments in Orange County by Sector, 2011‐2016
Source: National Venture Capital Association, Orange County Register

Section 5 – Occupational Employment and Salary Growth Page | 20
In 2016, venture capital investments in Orange County were primarily focused in Software (36
percent), Media and Entertainment (13 percent) and Mobile and Telecommunications (13
percent). Sizeable investments were also seen in Healthcare and Medical Devices and
Equipment which combined represented 19 percent of total investments for the year. These
investments help to highlight the innovation and emerging sectors which are driving economic
activity in the region.
Exhibit 4.4 Proportion of Venture Capital Investments in Orange County by Sector, 2016
Source: National Venture Capital Association, Orange County Register
Exhibit 4.5 shows the number of patents awarded per 10,000 residents in the United States,
California and Orange County, highlighting the state and county’s concentration of innovation.
While Orange County and California rates tracked each other fairly well from 2008 to 2011 and
were consistently more than double that of the nation, in 2012, a small divergence between the
county and state started in 2012 and continually grew, with the most recent reading in 2015
registering 10.3 patents per 10,000 residents at the state level and 9.0 per 10,000 residents in

Section 5 – Occupational Employment and Salary Growth Page | 21
Orange County. This divergence is likely explained by the high level of patent growth in less‐
populated counties such as Santa Clara County and San Mateo County.
Exhibit 4.5 Patent Grants Awarded per 10,000 Residents in the United States, California
and Orange County, 2008‐2015
Source: United States Patent and Trademark Office, U.S. Census Bureau – American Community Survey
As mentioned in the industry clusters section, innovation – as measured by patents and venture
capital investment – is primarily driven by collaboration among stakeholders. Regional
partnerships between economic and workforce development organizations, educational
institutions and businesses create the necessary environment for innovative startups. The
Applied Innovation Program at the University of California, Irvine recently launched “The Cove,”
a 46,000 square foot office space and technological facility. The Cove provides a collaborative
space which leverages the strengths of a world‐class educational institution, resources of
seasoned business leaders and the entrepreneurial spirit of Orange County residents to create
an environment which continually pushes innovation in the region.
UCI’s Applied Innovation Program also provides several other services for entrepreneurs,
including the Wayfinder Incubator, a highly selective support program that provides access to
strategic resources and networks, the Experts‐in‐Residence network, a group of local business
leaders volunteering their time to support entrepreneurship at UCI, and the BioENGINE
program, which fosters collaborative development of digital health solutions. The I‐Corps,
funded by the National Science Foundation (NSF), helps broaden the impact of research
projects, while Tech Surge – a special track of the New Venture Competition – helps UCI
innovators succeed in the commercial market. Finally, the ANTrepereneur Center was founded
in 2014 with the mission of bringing innovative, entrepreneurial thinking to the UCI campus.

Section 5 – Occupational Employment and Salary Growth Page | 22
Together, these institutions and programs are building a strong foundation for Orange County’s
next generation of entrepreneurs.

Section 5 – Occupational Employment and Salary Growth Page | 23
Section5‐OccupationalEmploymentandSalaryGrowth
As seen in Exhibit 5.1, Office & Administrative Support is the largest single occupational
category in Orange County, accounting for 16.8 percent of employment; Sales & Related
occupations at 10.7 percent and Food Preparation & Service‐Related occupations at 9.6 percent
also make up a large proportion of country employment.
Exhibit 5.1 Orange County Occupational Employment Distribution
Source: California Employment Development Department, Occupational Employment Survey
According to the California Employment Development Department’s Occupational Employment
Survey, Orange County has added 39,350 new jobs over the past year, an increase of 2.6
percent over the previous year; average salaries have increased by $1,522 or 2.8 percent. In

Section 5 – Occupational Employment and Salary Growth Page | 24
terms of absolute growth, Business and Financial Operations occupations added 6,6306 jobs, an
increase of 6.5 percent, followed by Construction and Extraction occupations with 6,350, an
increase of 9.7 percent and Food Preparation and Serving‐Related occupations with 5,090 jobs,
a 3.5 percent increase. Only five occupational groups saw decreases in overall employment
with the largest losses in Production occupations (3,890 jobs), Life, Physical and Social Science
occupations (1,050 jobs), and Protective Service occupations (860 jobs).
Most Orange County occupational groups saw salary increases over the past year, a welcome
development considering the county’s high cost of living. The average wage for all county
occupations increased by 2.7 percent, with the largest increases occurring in Management
($3,321), Farming, Fishing and Forestry ($3,266) and Construction and Extraction ($3,045). A
few occupational groups, however, lost salary: Healthcare Practitioners and Technical ($4,840),
Life, Physical and Social Science ($3,790), and Business and Financial Operations ($297).
Exhibit 5.2 Orange County Occupational and Salary Year‐over‐Year Absolute Growth
Source: California Employment Development Department, Occupational Employment Survey

Section 5 – Occupational Employment and Salary Growth Page | 25
Looking forward, to the EDD2014 ‐ 2024 occupational projects predict that overall occupational
employment will grow by 227,900 jobs in Orange County, reaching total employment of
1,829,000 by 2024. The Food Preparation and Serving Related occupational group is expected
to add 27,450 jobs over this period, followed by Construction and Extraction (expected to add
22,160 jobs) and Office and Administrative support (21,840 jobs). These occupational groups,
however, provide relatively low wages. The fastest growing occupational groups which pay
above average wages include Business and Financial Operations (18,430 jobs at an average
annual salary of $82,513), Management (16,000 at $130,559) and Healthcare Practitioners and
Technical (12,910 at $93,972).
Exhibit 5.3 Projected Orange County Employment Growth by Occupational Group and
Current Average Salaries (2014‐2024)
Source: California Employment Development Department, Employment Projections

Section 5 – Occupational Employment and Salary Growth Page | 26
EDD estimates that Web Developers (+48.9%), Floor Layers, Except Carpet, Wood and Hard
Tiles (+45.2%), and Operations Research Analysts (+42.2%) will be the fastest growing
occupations on a percentage basis between 2014 and 2024. The first two occupations are part
of Orange County’s most rapidly expanding industries, Information Technology and
Construction.
Exhibit 5.4 Average Salaries of Fastest‐Growing Occupations in Orange County (2014‐2024)
Source: California Employment Development Department

Section 6 – Income and Poverty Statistics Page | 27
Section6‐IncomeandPovertyStatistics
According to the most recent measures from the U.S. Census Bureau’s American Community
Survey, Orange County’s median household income reached $81,837 in 2016, an increase of
$3,409 or 4.3 percent over the past year. Orange County’s median income was 20.8 percent
higher than the state average of $67,739 and 42 percent higher than the national average of
$57,617. Per capita incomes in Orange County increased by 7.3 percent, more than $2,500,
between 2015 and 2016.
The county poverty rate decreased from 12.7 percent in 2015 to 11 percent in 2016, another
sign of economic growth. This growth is especially important because of Orange County’s rising
cost of living, which has priced many residents – especially young workers and families – out of
the area.
While definitions of poverty differ, the 2017 Orange County Comprehensive Economic
Development Strategy (CEDS) defines struggling or “red‐zone” census tracts as those with a
combination of below‐average income and above‐average unemployment when compared to
national rates. The number of Orange County “red‐zones” fell from 71 in 2016 to 52 in 2017, a
dramatic improvement.
Exhibit 6.1 Orange County Income and Poverty Rates (2000‐2016)
Source: U.S. Census Bureau, 2016 American Community Survey, 1‐Year Estimates
Exhibit 6.2 shows household income distribution across various income groups in 2000, 2015,
and 2016. According to the U.S. Census Bureau, households making between $50,000 and
$74,999 were the largest income group in 2000, accounting for 20.7 percent of the county. This
income group has since declined and now represents only 16.3 percent of Orange County
households; the $100,000 to $149,999 income group now represents the largest portion (18.3

Section 6 – Income and Poverty Statistics Page | 28
percent) of county households. Overall, lower income groups have shrunk since 2000 while
higher income groups have steadily increased. This illustrates the region’s economic growth and
is especially important when Orange County’s high (and rising) cost of living is taken into
account.
Exhibit 6.2 Orange County Household Income Profile
Source: U.S. Census Bureau, 2016 American Community Survey, 1‐Year Estimates
Exhibit 6.3 Percent of Orange County Households Earning Above or Below $50,000
Source: U.S. Census Bureau, 2016 American Community Survey, 1‐Year Estimates

Section 6 – Income and Poverty Statistics Page | 29
Poverty rates also vary depending on the source’s methodology. The two primary Orange
County poverty measures are the U.S. Census Bureau rate using federal‐level standards and the
California Poverty Measure (CPM) developed by the Public Policy Institute of California and
Stanford University. The CPM takes California‐specific economic and demographic trends into
account, providing a potentially more accurate poverty measurement. While Orange County, as
shown in Exhibit 6.4, has the region’s lowest poverty rate according to the U.S. Census, its CPM
was the second highest in Southern California.
Exhibit 6.4 Poverty Rates by Region (2014)
Poverty Rates by Region, 2014
County
Percentage in Poverty, Official Poverty Rate
Measure
Percentage in Poverty, CPM
Measure Differential
Percentage of Children Ages 17 and Below in Poverty, Official Rate
Orange 12.3% 21.5% 9.2% 18.2%
Los Angeles 18.3% 25.6% 7.3% 27.5%
Riverside 16.8% 19.7% 2.9% 24.6%
San Bernardino 19.9% 19.4% 0.5% 28.9%
California 16.1% 21.0% 4.9% 23.7%
United States 14.0% 19.5% Source: U.S Census Bureau, Public Policy Institute of California, Stanford University,

Section 7 – Educational Attainment Demographics Page | 30
Section7‐EducationalAttainmentDemographics
Orange County’s highly educated population is one of its primary competitive advantages; this
deep talent pool supports innovation, industry cluster formation and expansion, and overall
economic growth. Exhibit 7.1 shows the educational attainment of the county’s population over
age 25. In 2016, 47.7 percent of this group had an associate’s degree or higher, an increase of
1.3 percent from 2015. This provides one indicator of county residents’ increasing educational
attainment.
Exhibit 7.1 Orange County Educational Attainment, Population over 25 (2016)
Source: U.S. Census Bureau, 2016 American Community Survey, 1‐Year Estimates
Exhibit 7.2 offers another indicator of this positive trend, the increasing number of tech‐related
degrees awarded at local universities and colleges, such as the University of California, Irvine,
California State University, Fullerton, and Chapman University. The number of undergraduate
tech‐related degrees continues to grow substantially, more than doubling from 2000 to 2015
and increasing further to 3,202 in 2016. Tech‐related graduate degrees have seen even more
dramatic growth over the same time period, increasing from 434 in 2000 to 1,220 in 2015 and
further to 1,564 in 2016. UC Irvine and California State University, Fullerton were major
contributors to this recent, dramatic growth in undergraduate and graduate tech‐related
degrees.
Exhibit 7.2 Orange County Tech‐Related Degrees Granted (2000 – 2016)

Section 7 – Educational Attainment Demographics Page | 31
Source: OCBC Analysis of University of California, Irvine; Chapman University; California State University, Fullerton Data
While Orange County educational attainment has consistently increased over the past decade,
occupational and industry trends are changing the labor market value of these degrees.
Constantly evolving technology, for example, increases demand for specialized education and
training programs focused on “hard” skills. This trend, combined with rising college tuition
costs, has created a demand for certifications or other specialized training programs that
develop the skills necessary for high‐wage technical occupations.
These programs provide access to important employment opportunities at a lower cost than
traditional education, thus expanding access to these lucrative jobs for lower‐income residents.
Specialized “hard” skills programs, however, may neglect the equally important “soft” or
interpersonal skills that are also essential for career advancement. The rapidly evolving 21st
century labor market will require a mix of both “hard” and “soft” skills, making it imperative
that local educators, policymakers, and stakeholders create or improve programs that provide a
well‐rounded education. These improvements would also help close the persistent skills gap
that threatens to limit future economic growth.

Section 7 – Educational Attainment Demographics Page | 32
Exhibit 7.3 Median Wages by Educational Attainment, Orange County Workers over 25
(2015)
Source: U.S. Census Bureau, 2016 American Community Survey, 1‐Year Estimates
Despite labor market changes and the rising cost of education, academic degrees continue to
provide significant economic benefits, as seen in Exhibits 7.3 and 7.4; higher educational
attainment clearly correlates with both higher median wages and lower rates of poverty and
unemployment.
Exhibit 7.4 Orange County Unemployment & Poverty Rates by Educational Attainment (2016)
Source: U.S. Census Bureau, 2016 American Community Survey, 1‐Year Estimates

Section 8 – Housing Market and Construction Activity Page | 33
Section8‐HousingMarketandConstructionActivity
Orange County’s housing market – driven by job creation, rising incomes, and a low interest
rate environment – continues to outperform peer regions and state and national averages. This
trend, which reflects a growing economy, may also have significant negative consequences as
the county’s expensive housing market also continues to price many residents out of the area.
Exhibit 8.1 shows Orange County home prices from January 2008 to August 2017, broken down
into prices paid for new and existing single‐family housing units. The price of new homes sales
have risen to an average price of $789,000 as of August 2017, while existing home prices have
increased by 5.5 percent year over year, reaching a new high of $685,000.
Exhibit 8.1 Orange County Median Home Prices (2008‐2017): New vs. Existing Homes
Source: California Association of Realtors, CoreLogic/DataQuick
Chapman University predicts that a combination of factors – population growth, wage growth,
a limited housing supply and low interest rates – will increase county home prices by 6.2
percent in 2017, significantly more than the 4.3 percent increase in 2016.
The substantial price increases in Orange County, as well as other peer counties, can be seen in
Exhibit 8.2 below. According to CoreLogic and DQNews, Orange County structures sold for a
median price of $675,000 in July 2017, much higher than the average of $550,000 paid for
structures in Los Angeles and Ventura counties. Home prices in coastal counties, as seen in the
graph, have rapidly increased and surpassed pre‐recession highs while prices in inland counties
have seen more moderate growth and have yet to surpass pre‐recession highs.

Section 8 – Housing Market and Construction Activity Page | 34
Exhibit 8.2 Southern California Regional Home Prices (All Structures), 2007‐YTD 2017
Source: CoreLogic, DQNews, September 2017
Exhibit 8.3 shows Orange County home sales between 2007 and July 2017. According to
CoreLogic, county home sales totaled 37,848 in 2016, 34.5 percent more than in 2007.
CoreLogic estimates that Orange County is on track to reach new highs with 22,112 homes sold
thus far in 2017. However, several factors, including high home prices, a lack of supply, and
seasonal trends in home buying may limit sales for the rest of this year.
Exhibit 8.3 Orange County Home Sales, 2007‐July 2017

Section 8 – Housing Market and Construction Activity Page | 35
Source: CoreLogic, DQNews
According to the U.S. Census Bureau’s Building Permit Survey, Orange County building permits
have increased from an average of 182 per month in 2009 to 487 per month in 2012 and
further to almost 1,000 per month in 2016. August 2017 had a total of 599 building permits
with a year‐to‐date total of 6,165, which suggests that the lower monthly total does not reflect
the beginning of a decline. Irvine had 150 building permits in August, the most of any city, with
major levels of construction also occurring in Costa Mesa (70 permits), Anaheim (61), and Lake
Forest (53).
Exhibit 8.4 Orange County Building Permits (2009‐2017)

Section 8 – Housing Market and Construction Activity Page | 36
Source: U.S. Census Bureau, Building Permit Survey
Orange County apartment rental rates have mirrored the rise in home prices, increasing from
$1,967 in 2016 to $2,114 in August 2017, a 7.5 percent increase.

Section 8 – Housing Market and Construction Activity Page | 37
Exhibit 8.5 Orange County Average Apartment Rental Rates, 2012 – 2017 YTD
Source: Apartmentlist.com; Rentbits.com
Affordability, as mentioned before, remains a serious concern for Orange County. The rapid
increases in home prices and lack of available supply have driven apartment rental rates in the
region, further exacerbating this problem. According to the California Association of Realtor’s
Traditional Housing Index and First‐Time Buyer Affordability Index, which measure the
percentage of households which can afford to purchase a median price home in a specific
region, Orange County is the least affordable county in Southern California. Only 21 percent of
Orange County households could afford to purchase a median‐priced home as of Q2 2017, a
slight year‐over‐year decrease. Orange County also ranks well below its neighbors on the First‐
Time Home Buyer Affordability Index, with only 40 percent of households able to afford lower‐
price starter homes.
Exhibit 8.6 California Association of Realtors Affordability Index
California Association of Realtors Affordability Index
Traditional Affordability Index First‐Time Home Buyer Affordability Index
County Q2 2017 Q1 2017 Q2 2016 Q2 2017 Q1 2017 Q2 2016
Orange County 21 21 22 40 42 43
Los Angeles 28 29 30 46 48 49
Riverside County 39 39 41 58 60 61
San Bernardino 51 52 56 68 70 73
San Diego 26 28 28 45 48 48
Ventura 27 28 33 49 51 54

Section 8 – Housing Market and Construction Activity Page | 38
Source: California Association of Realtors
Exhibit 8.7 shows the percentage of income spent by Orange County residents on housing,
illustrating the heavy burden faced by many county renters and homeowners. The primary rule
of thumb when measuring affordability is the 30 percent rule – a person or household should
spend 30 percent of their income or less on housing; currently, according to the U.S. Census’s
2016 American Community Survey, 33 percent of homeowners and 54.1 percent of renters
spend more than 30 percent of their income on housing costs. This, in turn, leads to a
corresponding decrease in discretionary spending ‐‐ and the ability to save for the future ‐‐ and
thus serves to inhibit widespread future economic prosperity in Orange County over time.
Exhibit 8.7 Orange County Renter and Owner Housing Costs as a Percent of Income (2016)
Source: U.S. Census Bureau, 2016 American Community Survey, 1‐Year Estimates
While affordability rates are concerning, county foreclosures have steadily decreased since
peaking at 11,615 in 2008. Only 408 foreclosures took place in Q2 2017, illustrating that,
despite affordability concerns, county homeowners are not facing increased closures.

Section 8 – Housing Market and Construction Activity Page | 39
Exhibit 8.8 Orange County Foreclosures, 2007‐Q2 2017
Source: CoreLogic, DQNews

Section 9 – Final Thoughts Page | 40
Section9‐FinalThoughts
As local, regional and national demographics and industry sectors continue to evolve, Orange
County remains a standout performer in both Southern California and the nation as a whole.
Looking forward, local stakeholders and policymakers must identify opportunities and build on
positive developments of demographic, economic and technological change while mitigating
the potential negative or disruptive effects of these trends. A continually aging population, for
example, will put pressure on the labor market by increasing the ratio of dependents to
providers and driving demand for Healthcare jobs. Technological improvements will continue to
disrupt seemingly resilient industries, such as the Transportation sector with self‐driving
vehicles, the Retail sector with e‐commerce, and restaurants with computerized ordering
kiosks. These changes, while providing higher levels of productivity and efficiency for
organizations, may limit new job growth, especially for low‐skill, entry‐level positions.
Educational attainment – especially the development of both “hard” and “soft” skills – remains
the best defense against automation in the new digital economy.
Orange County’s elected officials, policymakers, and stakeholders will need to act quickly to
ensure future prosperity and further economy growth. Once again, Orange County’s primary
competitive advantage – its well‐educated, talent pool – will pay significant dividends because
these individuals will have a higher level of resilience to automation. While Orange County’s
educational system is already one of the best in the state, local leaders will need to continually
update it in order to prepare students for a rapidly evolving workplace.
Alongside this report, Orange County Business Council and other community and regional
partners also provide a variety of other economic and demographic reports including:
Orange County Workforce Indicators Report: A product of the research partnership
between the Orange County Business Council, County of Orange, and Orange County
Development Board, the Workforce Indicators Report examines the growth of industry
and employment, salary and wage trends, demographic changes and the educational
attainment of Orange County students. Click here for a link to the report.
Orange County Community Indicators Report: The product of a partnership between
Children & Families Commission of OC, Orange County United Way, CalOptima, the
Orange County Community Foundation, PIMCO Foundation, Orange County Department
of Education, Hope through Housing Foundation, Orange County Funders Roundtable,
JPMorgan Chase, the County of Orange, Orange County Business Council, La Jolla
Institutethe 2017 Orange County Community Indicators Report focuses on three pivotal
issues currently facing Orange County: housing, children’s health and wellbeing, and the
opportunity gap between high‐ and low‐income families and their children. The report

Section 9 – Final Thoughts Page | 41
also updates previous reports’ information about population, demographic, and
workforce trends. Click here for a link to the report.
Orange County Workforce Housing Scorecard: The 2015 Workforce Housing Scorecard
analyzes current and projected housing trends and their impacts on the county’s
economy, demographics, and business competitiveness. The OC Workforce Housing
Scorecard report will be updated in 2018. Click here for a link to the report.
Orange County 2013‐2018 Comprehensive Economic Development Strategy (CEDS):
Created through a partnership between the Orange County Development Board and
Orange County Business Council, this report represents an annually updated five‐year
plan for preserving Orange County’s competitive advantages, addressing the county’s
weaknesses, and making the most of future opportunities. As part of the five‐year plan,
this reports identifies census tracts and cities in the region currently underperforming
economically in comparison to national averages allowing policymakers and
stakeholders to create better, more effective strategies and programs aimed at
improving these economically disadvantaged regions. Click here for a link to the report.