EIGENVALUE AND GRAPH-BASED OBJECT EXTRACTION FROM … · volume01, linear05, planar05 and...
6
EIGENVALUE AND GRAPH-BASED OBJECT EXTRACTION FROM MOBILE LASER SCANNING POINT CLOUDS M. Bremer a, * , V. Wichmann b , M. Rutzinger c a Institute of Geography, University of Innsbruck, Innrain 52, 6020 Innsbruck, Austria - [email protected] b alpS Gmbh, Centre for Climate Change Adaptation Technologies, Grabenweg 68, 6020 Innsbruck, Austria – wichmann@alps- gmbh.com c Institute for Interdisciplinary Mountain Research, Austrian Academy of Science, Technikerstr. 21a, 6020 Innsbruck, Austria – [email protected] KEY WORDS: Mobile laser scanning, object based point cloud analysis, eigenvalues, graph based classification ABSTRACT The mapping of road environments is an important task, providing important input data for a broad range of scientific disciplines. Pole-like objects, their visibility and their influence onto local light and traffic noise conditions are of particular interest for traffic safety, public health and ecological issues. Detailed knowledge can support the improvement of traffic management, noise reducing infrastructure or the planning of photovoltaic panels. Mobile Mapping Systems coupled with computer aided mapping work-flows allow an effective data acquisition and provision. We present a classification work flow focussing on pole-like objects. It uses rotation and scale invariant point and object features for classification, avoiding planar segmentation and height slicing steps. Single objects are separated by connected component and Dijkstra-path analysis. Trees and artificial objects are separated using a graph based approach considering the branching levels of the given geometries. For the focussed semantic groups, classification accuracies higher than 0.9 are achieved. This includes both the quality of object aggregation and separation, where the combination of Dijkstra- path aggregation and graph-based classification shows good results. For planar objects the classification accuracies are lowered, recommending the usage of planar segmentation for classification and subdivision issues as presented by other authors. The presented work-flow provides sufficient input data for further 3D reconstructions and tree modelling. 1. 1. 1. 1. INTRODUCTION 1.1 Background The automatic classification of urban road environments and the detection of single objects such as traffic signs and trees is an important task for a variety of topics. Point cloud classification provides a fundamental input to the reconstructions of 3D scenes, which are used in road safety, public health, ecological and micro climatic applications (e.g. Zhou and Vosselman 2012, Pu et. al 2011, Brunner 1998, Endelaw et al. 2009). For road safety issues the mapping of traffic signs, curbstones and trees is of importance. For the management and assessment of urban vegetation, i.e. for above ground biomass and leaf area measures, the extraction and classification of single trees is required. Trees, and their complex transparency properties, are of particular interest for the assessment of light and traffic noise conditions and visibility studies in urban planning. In order to provide appropriate input data for such applications, surveys with mobile mapping systems mounted on cars or other vehicles are combined with automated computer-aided extraction work-flows allowing efficient data processing and mapping of larger areas e.g. along road corridors. 1.2 Related work For the automatic detection of objects from mobile laser scanning (MLS) data a variety of methods is available. For example Zhou and Vosselman (2012) are detecting curbstones by analysing local height jumps. Trees can be detected by the echo ratio measures (Rutzinger et al. 2011) and pole-like structures can be identified by height percentile techniques (Zhong et al. 2013, Pu et al 2011). Many work-flows apply a planar segmentation to the point cloud which is an indirection for the detection of non-planar objects. As poles and trees show rather linear or cylindrical patterns, an alternative approach might be better suited. Gross and Thoennessen (2006) and Jutzi and Gross (2009) provide discriminating features to select points belonging to linear, planar and other structures in point clouds. Object reconstruction approaches relying on graph-analysis such as tree skeletonization (Dai et al. 2009, Dai et al. 2010, Livny et al. 2010, Bremer et al. 2013) or building modeling (Oude-Elberink and Vosselman 2009) allow the separation of complex semantic groups. Especially for trees, the separation of interlinked tree crowns and nearby objects is an important task. While Zhou and Vosselman (2012) and Zhong et al. (2013) use Voronoi-regions and related approaches for the separation of tree crowns, Livny et al. (2010) investigate the suitability of a Dijkstra cost algorithm (Dijkstra 1959) to associate crown points to the tree trunk. 2. 2. 2. 2. METHODS 2.1 Overview Our approach focuses on rotation and scale invariant point and object features for point cloud classification (Gross and Thoennessen 2006) avoiding planar segmentation and height slicing steps. * Corresponding author. ISPRS Annals of the Photogrammetry, Remote Sensing and Spatial Information Sciences, Volume II-5/W2, 2013 ISPRS Workshop Laser Scanning 2013, 11 – 13 November 2013, Antalya, Turkey This contribution has been peer-reviewed. The double-blind peer-review was conducted on the basis of the full paper. doi:10.5194/isprsannals-II-5-W2-55-2013 55
Transcript of EIGENVALUE AND GRAPH-BASED OBJECT EXTRACTION FROM … · volume01, linear05, planar05 and...

EIGENVALUE AND GRAPH-BASED OBJECT EXTRACTION FROM MOBILE LASERSCANNING POINT CLOUDS
M. Bremer a, *, V. Wichmann b, M. Rutzinger c
a Institute of Geography, University of Innsbruck, Innrain 52, 6020 Innsbruck, Austria - [email protected] b alpS Gmbh, Centre for Climate Change Adaptation Technologies, Grabenweg 68, 6020 Innsbruck, Austria – wichmann@alps-
gmbh.comc Institute for Interdisciplinary Mountain Research, Austrian Academy of Science, Technikerstr. 21a, 6020 Innsbruck, Austria –
KEY WORDS: Mobile laser scanning, object based point cloud analysis, eigenvalues, graph based classification
ABSTRACT
The mapping of road environments is an important task, providing important input data for a broad range of scientific disciplines.Pole-like objects, their visibility and their influence onto local light and traffic noise conditions are of particular interest for trafficsafety, public health and ecological issues. Detailed knowledge can support the improvement of traffic management, noise reducinginfrastructure or the planning of photovoltaic panels. Mobile Mapping Systems coupled with computer aided mapping work-flowsallow an effective data acquisition and provision. We present a classification work flow focussing on pole-like objects. It usesrotation and scale invariant point and object features for classification, avoiding planar segmentation and height slicing steps. Singleobjects are separated by connected component and Dijkstra-path analysis. Trees and artificial objects are separated using a graphbased approach considering the branching levels of the given geometries. For the focussed semantic groups, classification accuracieshigher than 0.9 are achieved. This includes both the qualityof object aggregation and separation, where the combination of Dijkstra-path aggregation and graph-based classification shows good results. For planar objects the classification accuracies are lowered,recommending the usage of planar segmentation for classification and subdivision issues as presented by other authors. Thepresented work-flow provides sufficient input data for further 3D reconstructions and tree modelling.
1.1.1.1. INTRODUCTION
1.1 Background
The automatic classification of urban road environments and thedetection of single objects such as traffic signs and trees is animportant task for a variety of topics. Point cloud classificationprovides a fundamental input to the reconstructions of 3Dscenes, which are used in road safety, public health, ecologicaland micro climatic applications (e.g. Zhou and Vosselman2012, Pu et. al 2011, Brunner 1998, Endelaw et al. 2009). Forroad safety issues the mapping of traffic signs, curbstonesandtrees is of importance. For the management and assessment ofurban vegetation, i.e. for above ground biomass and leaf areameasures, the extraction and classification of single trees isrequired. Trees, and their complex transparency properties, areof particular interest for the assessment of light and traffic noiseconditions and visibility studies in urban planning.In order to provide appropriate input data for such applications,surveys with mobile mapping systems mounted on cars or othervehicles are combined with automated computer-aidedextraction work-flows allowing efficient data processingandmapping of larger areas e.g. along road corridors.
1.2 Related work
For the automatic detection of objects from mobile laserscanning (MLS) data a variety of methods is available. Forexample Zhou and Vosselman (2012) are detecting curbstonesby analysing local height jumps.
Trees can be detected by the echo ratio measures (Rutzinger etal. 2011) and pole-like structures can be identified by heightpercentile techniques (Zhong et al. 2013, Pu et al 2011).Many work-flows apply a planar segmentation to the pointcloud which is an indirection for the detection of non-planarobjects. As poles and trees show rather linear or cylindricalpatterns, an alternative approach might be better suited. Gross and Thoennessen (2006) and Jutzi and Gross (2009)provide discriminating features to select points belonging tolinear, planar and other structures in point clouds.Object reconstruction approaches relying on graph-analysissuch as tree skeletonization (Dai et al. 2009, Dai et al. 2010,Livny et al. 2010, Bremer et al. 2013) or building modeling(Oude-Elberink and Vosselman 2009) allow the separation ofcomplex semantic groups. Especially for trees, the separation of interlinked tree crownsand nearby objects is an important task. While Zhou andVosselman (2012) and Zhong et al. (2013) use Voronoi-regionsand related approaches for the separation of tree crowns, Livnyet al. (2010) investigate the suitability of a Dijkstra costalgorithm (Dijkstra 1959) to associate crown points to the treetrunk.
2.2.2.2. METHODS
2.1 Overview
Our approach focuses on rotation and scale invariant point andobject features for point cloud classification (Gross andThoennessen 2006) avoiding planar segmentation and heightslicing steps.
* Corresponding author.
ISPRS Annals of the Photogrammetry, Remote Sensing and Spatial Information Sciences, Volume II-5/W2, 2013ISPRS Workshop Laser Scanning 2013, 11 – 13 November 2013, Antalya, Turkey
This contribution has been peer-reviewed. The double-blind peer-review was conducted on the basis of the full paper.doi:10.5194/isprsannals-II-5-W2-55-2013 55

For this work-flow, we are focusing on the detection andsubdivision of artificial pole based objects (AP) such as lampsand traffic signs, and natural pole supported objects such astrees (T). As additional classes, we separate ground (G), groundinventory (GI) such as curbstones and lower objects, walls (W),wall inventory (WI) such as window-frames, doors and buildingcolumns, roofs (R), and undefined objects (UD) such as movingcars or people. Points associated with mirror effects ofwindows, are treated as undefined objects.In order to extract different object classes from the MLS datawe use a step by step procedure generating primitivegeometrical object classes from simple point informationderived by a multi-scale approach. Using connectivity andgraph-based analysis on primitive objects, more complexobjects are derived and separated. The method consists of fourmain steps
(1) For each raw point the local point neighbourhood inboth a 0.1 m radius and a 0.5 m radius is encoded intoa 3x3 covariance matrix from which eigenvalues andeigenvectors are derived.
(2) Characterizing each point by its eigenvalues derivedfrom both 0.1 m radius and 0.5 m radiusneighbourhoods, two 3-dimensional feature spaces aredefined. For three given feature patterns (linear,planar, volumetric), a proximity analysis is performedfor each point in the feature spaces. On both scalelevels the points are grouped into the three givenprimitive classes. Using the orientation of the longesteigenvector for linear objects and that of the smallesteigenvector for planar structures, vertical andhorizontal sub classes are derived.
(3) By applying conditions to both scale levelclassifications and by a connected componentanalysis, walls, wall-inventory (e.g. window frames),ground and ground-inventory (e.g. poles) areseparated.
(4) Pole objects including trees are separated using aDijkstra region growing approach. Artificial poleobjects such as lamps, traffic signs and traffic lightsare further separated from trees using branching levelsderived from skeletonization (see Bremer et al. 2013)and graph-analysis.
2.2 Multi scale feature computation
For each point, local point neighbourhood features arecomputed. All barycentric coordinates of points lying in aspherical radius around a search point are encoded into acovariance matrix ATA (Eqn. 1). The encoding is done for botha 0.1 m radius (r01) and a 0.5 m radius (r05). The radii werechosen after visual analyses considering the optimizedextraction of smaller poles (e.g. thin branches (r01)) and largerposts (r05). From the covariance matrices, three specific eigenvalues,threeeigenvectors, and the vertical angles of the longest and thesmallest eigenvectors are computed for each radius (r01, r05)respectively. According to the usually high point density of the original MLSdata, a search radius of 0.5 m is increasing the computation timesignificantly. Thus we use a hierarchical approach, analysingthe neighbourhood of a 0.1 m block-thinned point cloud foreach point of the original point cloud. This is reducing the timerequired for computing and leads to a generalization of theinput data, increasing the coarse scale effect of the 0.5 m radiussearch.
(1)
2.3 Primitive classification
The specific relationship of the normalized largest eigenvalue(eL), intermediate eigenvalue (eI) and the smallest eigenvalue(eS) is a characteristic feature for the shape of individualpointsets.In order to classify the raw points into the primitive classes'linear', 'planar', and 'volumetric', we define three specificeigenvalue patterns for each class (values between 0 and 1):
linear: eL = 0.75, eI = 0.16, eS = 0.04planar: eL = 0.45, eI = 0.45, eS = 0.01volumetric: eL = 0.45, eI = 0.45, eS = 0.30
The eigenvalues of the patterns are averaged values derivedfrom small training areas of the selected classes.In the 3-dimensional feature spaces spanned by the eigenvaluesr01 and the eigenvalues r05, each data point is assigned to theprimitive pattern to which the shortest Mahalanobis Distance(D) is observed. The Mahalanobis Distance (Eqn. 2) is thestatistical distance measure (D) where, in addition to theeuclidean distance, the covariance matrix (S) of the dataset isconsidered. Here,S is computed as shown in equation 1 usingthe feature space vectors eL, eI, eS instead of the x,y,zcoordinates.
( ) ( ) ( )yxSyx=y,xD T rrrrrr −− −1 (2)
This leads to the primitive classifications (linear01, planar01,volume01, linear05, planar05 and volume05). The linear and planar classes are further split into vertical,horizontal and other orientations (vert_planar01, hor_planar01,vert_linear01, etc.). For linear structures the orientation of thelongest eigenvector is used. A horizontal structure shows avertical angle of the longest eigenvector < 10°, a verticalstructure > 80°. For planar structures the orientation of thesmallest eigenvector (corresponding to the normal vector)isused. A horizontal structure shows a vertical angle of thesmallest eigenvector > 80°, a vertical structure < 10°. Forvolumetric structures, the orientation is not defined.
2.4 Object classification
In the next step, the multi scale primitive classification is usedto aggregate and separate semantic groups. Based on theprimitive classification, a region growing in object spaceisperformed in order to separate smaller and larger homogeneouspoint clumps.
ISPRS Annals of the Photogrammetry, Remote Sensing and Spatial Information Sciences, Volume II-5/W2, 2013ISPRS Workshop Laser Scanning 2013, 11 – 13 November 2013, Antalya, Turkey
This contribution has been peer-reviewed. The double-blind peer-review was conducted on the basis of the full paper.doi:10.5194/isprsannals-II-5-W2-55-2013 56
The following criteria are used for classifications:Poles: vert_linear05OR (vert_linear01AND NOT planar05)AND clump size > 100
Ground: (hor_planar01OR hor_planar05)AND clump size >30000)
Walls: (vert_planar01AND NOT vert_line05)AND clump size> 3000
Applying the 0.1 m radius leads to small blurring effects.Smaller branches and thin poles are detected as linearstructures. Larger objects appear as vertical planes and not aspoles. Showing a more intense blurring, the 0.5 m radiusclassification is applied in order to also classify larger trunks aslinear structures. Combining both classifications exploits theadvantages of both scales and leads to a reliable extractionofpole-like structures.Due to inhomogeneous point densities and scan patterns inMLS point clouds, single scan lines on the road and other flatsurfaces may be classified as linear or volumetric structuresusing a 0.1 m radius. Therefore, both 0.1 m and 0.5 m radius areused for ground classification. Additionally, ground segmentsare usually large and include a lot of points.Since building walls are mostly vertical, the use of thevert_planar01 feature leads to a sufficient separation of buildingwalls.In order to avoid noise in the object classification results,minimum cluster sizes are introduced. Connected groundclusters need to show a minimum point count of 30.000 pts.wall clusters need to show a minimum point count of 3.000 pts.and pole clusters of 100 pts.For the separation of wall-associated elements (e.g. columnsand window frames) and ground-associated poles (e.g. trafficsigns and tree trunks) we additionally apply distance thresholds.A ground inventory feature needs to show a distance to aground cluster smaller than 1 m and a minimum distance to awall cluster of 3 m. A wall feature needs to show a distance to awall cluster smaller than 1 m
2.5 Graph-based classification for pole supported objects
As a lot of applications need reconstructed 3D models as datainput, automatic mobile mapping work-flows often includelinear and polygonal geometry reconstruction. Thus, weintegrate a skeleton graph reconstruction step into ourclassification work-flow. In order to extract trees and tree trunksfrom the data set, we analyse the point neighbourhood in theupper half-space of a pole feature. Object clumps are groupedusing a Dijkstra region growing procedure.Using the pole as a seed-object for a skeletonization, a graph isbuild for each pole component and its associatedneighbourhood.
3.3.3.3. DATA SET
The test site is located in Rheine, Germany. The MLS data wasaquired by TopScan GmbH in March 2013 using the OptechLynx Mobile Mapper system with two rotating laser scannersmounted in a 45° angle with the driving direction of the vehicle(Optech 2013). For this study an exemplary road segment, 300m in length, is processed. It was scanned in one drivingdirection. The point cloud merged from both sensors contains5,838,701 pts. and shows an averaged point distance of 2 cm.Simultaneously with the scan, panoramic images were shotusing a Ladybug panoramic camera system (Point Grey, 2013).
The threshold values given in section 2 were obtained from asmall training area in the centre of the data set. These valueswere validated against the whole MLS data set. Therefore, thewhole point cloud, was manually classified into the targetclasses (reference) comparable to the automatic classes.
4.4.4.4. RESULTS
4.1 Qualitative results
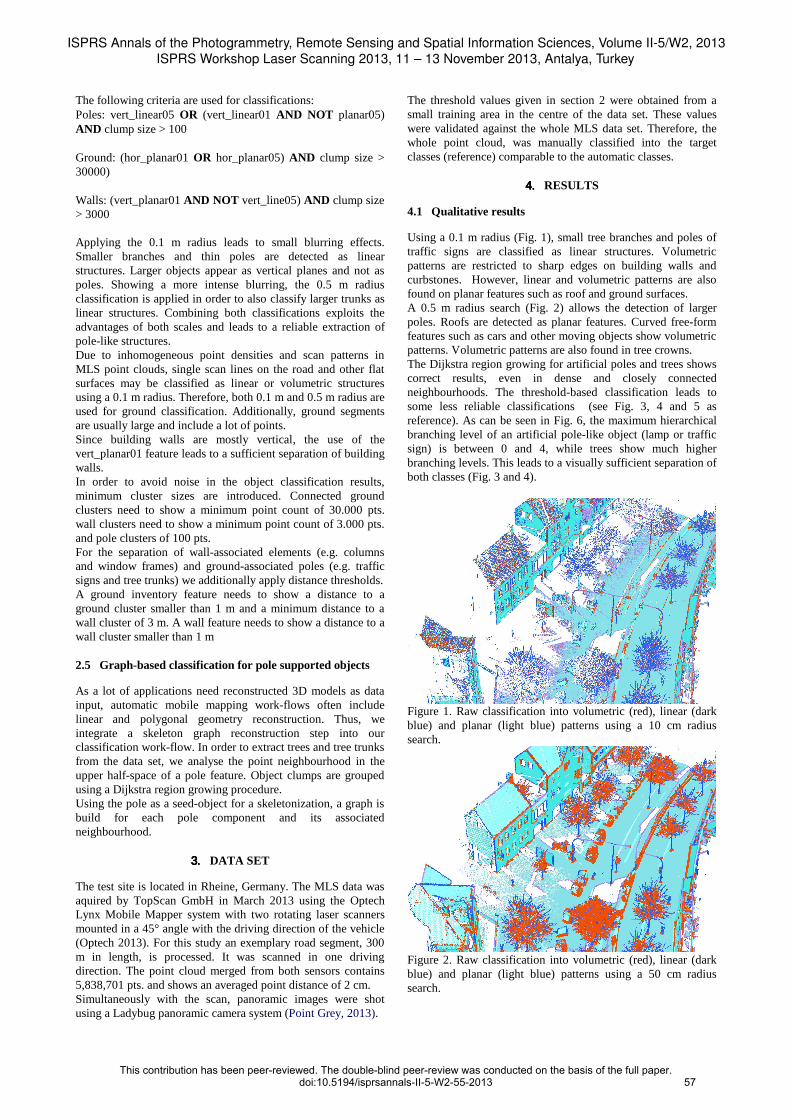
Using a 0.1 m radius (Fig. 1), small tree branches and poles oftraffic signs are classified as linear structures. Volumetricpatterns are restricted to sharp edges on building walls andcurbstones. However, linear and volumetric patterns are alsofound on planar features such as roof and ground surfaces.A 0.5 m radius search (Fig. 2) allows the detection of largerpoles. Roofs are detected as planar features. Curved free-formfeatures such as cars and other moving objects show volumetricpatterns. Volumetric patterns are also found in tree crowns. The Dijkstra region growing for artificial poles and trees showscorrect results, even in dense and closely connectedneighbourhoods. The threshold-based classification leads tosome less reliable classifications (see Fig. 3, 4 and 5 asreference). As can be seen in Fig. 6, the maximum hierarchicalbranching level of an artificial pole-like object (lamp or trafficsign) is between 0 and 4, while trees show much higherbranching levels. This leads to a visually sufficient separation ofboth classes (Fig. 3 and 4).
Figure 1. Raw classification into volumetric (red), linear(darkblue) and planar (light blue) patterns using a 10 cm radiussearch.
Figure 2. Raw classification into volumetric (red), linear(darkblue) and planar (light blue) patterns using a 50 cm radiussearch.
ISPRS Annals of the Photogrammetry, Remote Sensing and Spatial Information Sciences, Volume II-5/W2, 2013ISPRS Workshop Laser Scanning 2013, 11 – 13 November 2013, Antalya, Turkey
This contribution has been peer-reviewed. The double-blind peer-review was conducted on the basis of the full paper.doi:10.5194/isprsannals-II-5-W2-55-2013 57
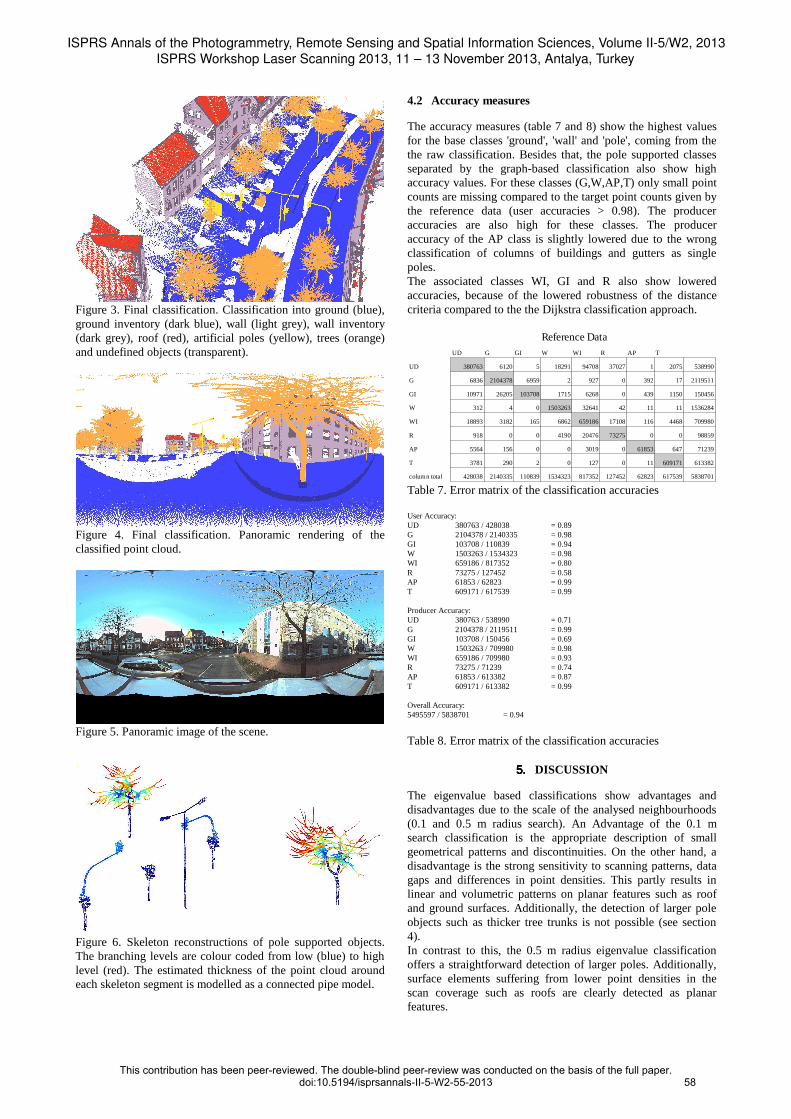
Figure 3. Final classification. Classification into ground (blue),ground inventory (dark blue), wall (light grey), wall inventory(dark grey), roof (red), artificial poles (yellow), trees (orange)and undefined objects (transparent).
Figure 4. Final classification. Panoramic rendering of theclassified point cloud.
Figure 5. Panoramic image of the scene.
Figure 6. Skeleton reconstructions of pole supported objects.The branching levels are colour coded from low (blue) to highlevel (red). The estimated thickness of the point cloud aroundeach skeleton segment is modelled as a connected pipe model.
4.2 Accuracy measures
The accuracy measures (table 7 and 8) show the highest valuesfor the base classes 'ground', 'wall' and 'pole', coming from thethe raw classification. Besides that, the pole supported classesseparated by the graph-based classification also show highaccuracy values. For these classes (G,W,AP,T) only small pointcounts are missing compared to the target point counts givenbythe reference data (user accuracies > 0.98). The produceraccuracies are also high for these classes. The produceraccuracy of the AP class is slightly lowered due to the wrongclassification of columns of buildings and gutters as singlepoles.The associated classes WI, GI and R also show loweredaccuracies, because of the lowered robustness of the distancecriteria compared to the the Dijkstra classification approach.
Table 7. Error matrix of the classification accuracies
User Accuracy:UD 380763 / 428038 = 0.89G 2104378 / 2140335 = 0.98GI 103708 / 110839 = 0.94W 1503263 / 1534323 = 0.98 WI 659186 / 817352 = 0.80R 73275 / 127452 = 0.58AP 61853 / 62823 = 0.99T 609171 / 617539 = 0.99
Producer Accuracy:UD 380763 / 538990 = 0.71G 2104378 / 2119511 = 0.99GI 103708 / 150456 = 0.69W 1503263 / 709980 = 0.98WI 659186 / 709980 = 0.93R 73275 / 71239 = 0.74AP 61853 / 613382 = 0.87T 609171 / 613382 = 0.99
Overall Accuracy:5495597 / 5838701 = 0.94
Table 8. Error matrix of the classification accuracies
5.5.5.5. DISCUSSION
The eigenvalue based classifications show advantages anddisadvantages due to the scale of the analysed neighbourhoods(0.1 and 0.5 m radius search). An Advantage of the 0.1 msearch classification is the appropriate description of smallgeometrical patterns and discontinuities. On the other hand, adisadvantage is the strong sensitivity to scanning patterns, datagaps and differences in point densities. This partly results inlinear and volumetric patterns on planar features such as roofand ground surfaces. Additionally, the detection of largerpoleobjects such as thicker tree trunks is not possible (see section4).In contrast to this, the 0.5 m radius eigenvalue classificationoffers a straightforward detection of larger poles. Additionally,surface elements suffering from lower point densities in thescan coverage such as roofs are clearly detected as planarfeatures.
Reference DataUD G GI W WI R AP T
UD 380763 6120 5 18291 94708 37027 1 2075 538990
G 6836 2104378 6959 2 927 0 392 17 2119511
GI 10971 26205 103708 1715 6268 0 439 1150 150456
W 312 4 0 1503263 32641 42 11 11 1536284
WI 18893 3182 165 6862 659186 17108 116 4468 709980
R 918 0 0 4190 20476 73275 0 0 98859
AP 5564 156 0 0 3019 0 61853 647 71239
T 3781 290 2 0 127 0 11 609171 613382
column total 428038 2140335 110839 1534323 817352 127452 62823 617539 5838701
ISPRS Annals of the Photogrammetry, Remote Sensing and Spatial Information Sciences, Volume II-5/W2, 2013ISPRS Workshop Laser Scanning 2013, 11 – 13 November 2013, Antalya, Turkey
This contribution has been peer-reviewed. The double-blind peer-review was conducted on the basis of the full paper.doi:10.5194/isprsannals-II-5-W2-55-2013 58
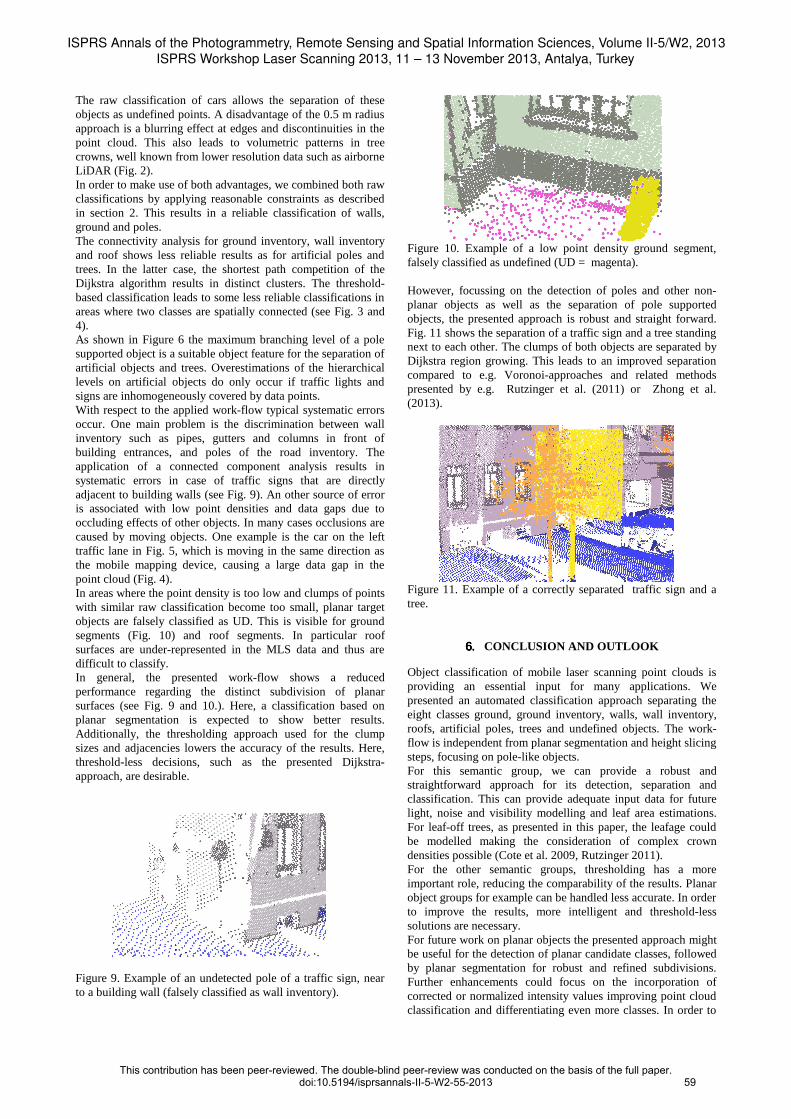
The raw classification of cars allows the separation of theseobjects as undefined points. A disadvantage of the 0.5 m radiusapproach is a blurring effect at edges and discontinuities in thepoint cloud. This also leads to volumetric patterns in treecrowns, well known from lower resolution data such as airborneLiDAR (Fig. 2). In order to make use of both advantages, we combined both rawclassifications by applying reasonable constraints as describedin section 2. This results in a reliable classification of walls,ground and poles.The connectivity analysis for ground inventory, wall inventoryand roof shows less reliable results as for artificial polesandtrees. In the latter case, the shortest path competition of theDijkstra algorithm results in distinct clusters. The threshold-based classification leads to some less reliable classifications inareas where two classes are spatially connected (see Fig. 3 and4).As shown in Figure 6 the maximum branching level of a polesupported object is a suitable object feature for the separation ofartificial objects and trees. Overestimations of the hierarchicallevels on artificial objects do only occur if traffic lightsandsigns are inhomogeneously covered by data points.With respect to the applied work-flow typical systematic errorsoccur. One main problem is the discrimination between wallinventory such as pipes, gutters and columns in front ofbuilding entrances, and poles of the road inventory. Theapplication of a connected component analysis results insystematic errors in case of traffic signs that are directlyadjacent to building walls (see Fig. 9). An other source of erroris associated with low point densities and data gaps due tooccluding effects of other objects. In many cases occlusions arecaused by moving objects. One example is the car on the lefttraffic lane in Fig. 5, which is moving in the same direction asthe mobile mapping device, causing a large data gap in thepoint cloud (Fig. 4).In areas where the point density is too low and clumps of pointswith similar raw classification become too small, planar targetobjects are falsely classified as UD. This is visible for groundsegments (Fig. 10) and roof segments. In particular roofsurfaces are under-represented in the MLS data and thus aredifficult to classify. In general, the presented work-flow shows a reducedperformance regarding the distinct subdivision of planarsurfaces (see Fig. 9 and 10.). Here, a classification based onplanar segmentation is expected to show better results.Additionally, the thresholding approach used for the clumpsizes and adjacencies lowers the accuracy of the results. Here,threshold-less decisions, such as the presented Dijkstra-approach, are desirable.
Figure 9. Example of an undetected pole of a traffic sign, nearto a building wall (falsely classified as wall inventory).
Figure 10. Example of a low point density ground segment,falsely classified as undefined (UD = magenta).
However, focussing on the detection of poles and other non-planar objects as well as the separation of pole supportedobjects, the presented approach is robust and straight forward.Fig. 11 shows the separation of a traffic sign and a tree standingnext to each other. The clumps of both objects are separated byDijkstra region growing. This leads to an improved separationcompared to e.g. Voronoi-approaches and related methodspresented by e.g. Rutzinger et al. (2011) or Zhong et al.(2013).
Figure 11. Example of a correctly separated traffic sign andatree.
6.6.6.6. CONCLUSION AND OUTLOOK
Object classification of mobile laser scanning point clouds isproviding an essential input for many applications. Wepresented an automated classification approach separating theeight classes ground, ground inventory, walls, wall inventory,roofs, artificial poles, trees and undefined objects. The work-flow is independent from planar segmentation and height slicingsteps, focusing on pole-like objects. For this semantic group, we can provide a robust andstraightforward approach for its detection, separation andclassification. This can provide adequate input data for futurelight, noise and visibility modelling and leaf area estimations.For leaf-off trees, as presented in this paper, the leafage couldbe modelled making the consideration of complex crowndensities possible (Cote et al. 2009, Rutzinger 2011). For the other semantic groups, thresholding has a moreimportant role, reducing the comparability of the results.Planarobject groups for example can be handled less accurate. In orderto improve the results, more intelligent and threshold-lesssolutions are necessary.For future work on planar objects the presented approach mightbe useful for the detection of planar candidate classes, followedby planar segmentation for robust and refined subdivisions.Further enhancements could focus on the incorporation ofcorrected or normalized intensity values improving point cloudclassification and differentiating even more classes. In order to
ISPRS Annals of the Photogrammetry, Remote Sensing and Spatial Information Sciences, Volume II-5/W2, 2013ISPRS Workshop Laser Scanning 2013, 11 – 13 November 2013, Antalya, Turkey
This contribution has been peer-reviewed. The double-blind peer-review was conducted on the basis of the full paper.doi:10.5194/isprsannals-II-5-W2-55-2013 59

strengthen the evaluation of point cloud classificationapproaches, further research on appropriate error assessmentstrategies are required. This would allow a decision on thesuitability of point cloud classification results for specificapplications.
ACKNOWLEDGEMENTS
The data used in this study was kindly provided by TopScanGmbH.
REFERENCES
Bremer, M., Rutzinger, M., Wichmann, V., 2013, Derivation oftree skeletons and error assessment using LiDAR point clouddata of varying quality.ISPRS Journal of Photogrammetry andRemote Sensing, 80, pp. 39-50.
Brunner, A., 1998. A light model for spatially explicit foreststand models.Forest Ecology and Management, 107 (1–3), pp.19–46.
Cote, J.-F., Widlowski, J.-L., Fournier, R. A., Verstraete, M.M., 2009. The structural and radiative consistency of three-dimensional tree reconstructions from terrestrial lidar.RemoteSensing of the Environment, 113(5), pp.1067–1081.
Dai, M., Zhang, X., Zhang, Y., Jaeger, M., 2009. Segmentationof point clouds scanned from trees. In: Zha, H., Taniguchi, R.,Maybank, S. (Eds.), Proc. Workshop on 3D Content andApplications with ACCV 2009, Xian, China, pp. 1–12.
Dai, M., Li, H., Zhang, X., 2010. Tree modeling through rangeimage segmentation and 3d shape analysis. In: Zeng, Z., Wang,J. (Eds.), Advances in Neural Network Analysis andApplications Lecture Notes in Electrical Engineering. Springer,Berlin, Heidelberg, pp. 413–422.
Dijkstra, E.W., 1959. A note on two problems in conexxionwith graphs. NumerischeMathematik 1 (1), pp. 269–271.
Endalew, A.M., Hertog, M., Delele, M.A., Baetens, K.,Persoons, T., Baelmans, M., Ramon, H., Nicolai, B.M.,Verboven, P., 2009. Cfd modelling and wind tunnel validationof airflow through plant canopies using 3d canopy architectures.International Journal of Heat and Fluid Flow, 30 (2), pp. 356–368.
Gross, H., Thoennessen, U., 2006, Extraction of lines from laserpoint clouds. The International Archives of thePhotogrammetry, Remote Sensing and Spatial InformationSciences, Istanbul, Turkey, Vol. XXXVI, Part 3, pp. 86-91.
Hu, M. K., 1962. Visual pattern recognition by momentinvariants. IRE Transactions on Information Theory, 12, pp.179 -187.
Jutzi, B., Gross, H., 2009. Nearest neighbour classification onLaser Point clouds to Gain Object Structures from Buildings.ISPRS Hannover Workshop 2009 High resolution earthImaging for geospatial Information, Hannover Germany, 6 pp.
Livny, Y., Feilong, Y., Olson, M., Chen, B., Zhang, H., El-Sana, J., 2010. Automatic reconstruction of tree skeletalstructures from point clouds.ACM Transactions on Graphics,29 (6), pp.1511–1518.
Optech, 2013. Official website, <http://www.optech.ca>,(Accessed 28 June,2013).
Oude-Elberink, S., Vosselman, G., 2009. BuildingReconstruction by Target Based Graph Matching on IncompleteLaser Data: Analysis and Limitations.Sensors, 9(8), pp. 6101-6118.
Point Grey, 2013. Official website, <http://ww2.ptgrey.com>,(Accessed 28 June, 2013).
Pu., S., Rutzinger, M., Vosselman, G., Elberink, S., O., 2011.Recognizing basic structures from mobile laser scanning datafor road inventory studies.ISPRS Journal of Photogrammetryand Remote Sensing, 66, pp. S28-S39.
Rutzinger, M., Pratihast, A.K., Oude Elberink, S., Vosselman,G., 2011. Tree modelling from mobile laser scanning datasets.The Photogrammetric Record, 26 (134),pp. 361–372.
Zhong, R., Wei, J., Su, W.,Chen, Y. F., 2013. A Method forextracting trees from vehicle-borne laser scanning data.Mathematical and Computer Modelling, 58(3-4), pp. 733-742.
Zhou, L., Vosselman, G., 2012. Mapping curbstones in airborneand mobile laser scanning data.International Journal ofApplied Earth Observation and Geoinformation, 18, pp. 293-304.
ISPRS Annals of the Photogrammetry, Remote Sensing and Spatial Information Sciences, Volume II-5/W2, 2013ISPRS Workshop Laser Scanning 2013, 11 – 13 November 2013, Antalya, Turkey
This contribution has been peer-reviewed. The double-blind peer-review was conducted on the basis of the full paper.doi:10.5194/isprsannals-II-5-W2-55-2013 60