EIEIIIEEEEEE *I..EIIIIIIIIIu - Defense Technical … SECURITY CLASSIFICATION OF THIS PAGIMCe. Deja...
114
AG A143018 ENGINEERING PROPERTIES OF CLAY SHALES REPORT 5 STRENGT N / ANI5 DEFORMATION P..U) ARMY ENGINEER WATERWAY EXPERIMENT STATION VICKYSBRG MS W R STROMAN ET AL I EIEIIIEEEEEE IIIIIIIIIIIIIIllflfflf *I..EIIIIIIIIIu
-
Upload
nguyenkhanh -
Category
Documents
-
view
213 -
download
0
Transcript of EIEIIIEEEEEE *I..EIIIIIIIIIu - Defense Technical … SECURITY CLASSIFICATION OF THIS PAGIMCe. Deja...

AG A143018 ENGINEERING PROPERTIES OF CLAY SHALES REPORT 5 STRENGT N /ANI5 DEFORMATION P..U) ARMY ENGINEER WATERWAYEXPERIMENT STATION VICKYSBRG MS W R STROMAN ET AL
I EIEIIIEEEEEE
IIIIIIIIIIIIIIllflfflf*I..EIIIIIIIIIu

II11128 mL25
MICROCOPY RESOLUTION TEST CHARTNA',QNAL BUREAU O S7ANDAR[L) :q A
I

TECHNICAL REPORT ,-71-t
ENGINEERING PROPERTIES OF CLAY SHALESReport 5
STRENGTH AND DEFORMATION PROPERTIESOF PEPPER AND DEL RIO CLAY SHALES
UFROM WACO DAM
William R. Stroman
_U S. Army Engineer Distict. Fort WorthP 0 Box 17300. Fort Worth. Tex 76102
f I Arthur H Feese
U. S Army Engineer Southwestern Division Laboratory1114 Commerce St. Dallas. Tex 75242
t(f jjiJ>'*
April 1984-.. ... ..
Report 5of a Series
.--J
L. Prepared for Office, Chief of Engineers, U. S. ArmyWashington, D. C. 20314
under CWlS Work Unit 31244
Monitored by Geotechnical LaboratoryU. S. Army Engineer Waterways Experiment Station
P. 0. Box 631, Vicksburg, Miss. 39180
84 07 09 030
I ,A, i i i ii I

Destroy this report when no longer needed Do notreturn it to the originator
The findings in this report are not to be constrUed as anofficial Department of the Army posrtton unless so
designated by other authorized documents
Tke contents of this report are not to be used foradvertising, publication, or promotional purposes.Citation of trade names does not constitute anofficial endorsement or approval of the use of such
commercial products.

UnclassifiedSECURITY CLASSIFICATION OF THIS PAGE ("en Dee. EnetI.d)
READ INSTRUCTIONSREPORT DOCUMENTATION PAGE BEFORE COMPLETING FORM
I. REPORT NUMBER . OVT ACCESSION NO. 3. RECIPIENT'S CATALOG NUMBER
Technical Report S-71-6 dkIxA)V 3 61,/4. TITLE (ind .ubtitle) S. TYPE OF REPORT & PERIDO COVERED
ENGINEERING PROPERTIES OF CLAY SHALES; Report 5, Report 5 of a seriesSTRENGTH AND DEFORMATION PROPERTIES OF PEPPER 6. PERFORMING ORG. REPORT NUMBER
AND DEL RIO CLAY SHALES FROM WACO DAM.AUTHOR(@) 8. CONTRACT OR GRANT NUMBER(.)
William R. Stroman
Arthur L. Feese9. PERFORMING ORGANIZATION NAME AND ADDRESS 10. PROGRAM ELEMENT. PROJECT. TASK
AREA & WORK UNIT NUMBERS
U. S. Army Engineer District, Fort WorthFoundations and Materials Br., Engineering Div. CWIS Work Unit 31244
P. 0. Box 17300. Fort Worth. Tex. 76102II. CONTROLLING OFFICE NAME AND ADDRESS 12. REPORT DATE
Office, Chief of Engineers, U. S. Army Aril 1984Washington, D. C. 20314 13. NUMBER OF PAGES
8914. MONITORING AGENCY NAME & ADORESS(lI different from Controlllng Ou.ce) 15. SECURITY CLASS. (o thi report)
U. S. Army Engineer Waterways Experiment Station UnclassifiedGeotechnical Laboratory 1Sm. DECLASSIFICATION/OWNGRA0ING
P. 0. Box 631, Vicksburg, Miss. 39180 SCHEDULE
16. DISTRIBUTION STATEMENT (of thle Report)
Approved for public release; distribution unlimited.
17. DISTRIBUTION STATEMENT (of the Abetrc entered In Block 20, If difleront Iow, Report)
IS. SUPPLEMENTARY NOTES
Available from National Technical Information Service, 5285 Port Royal Road,Springfield, Va. 22161.
19. KEY WORDS (Continue on reveree side It neceeesy end Identify by block number)
Clay shalesPore pressure
ShalesShear strengthSoil tests (laboratory)
2& AwIACT (Camtav a everin at I namoNY = IdentIfy by bloct tnmber)
This report presents results and analyses of laboratory tests whichwere conducted on structured to slightly structured, uncemented to slightlycemented clay shale foundation materials from the foundation strata of WacoDam, Waco, Tex. These materials are commonly called "clay shales" and haveproperties more nearly those of soil than rock. -The investigation was con-
ducted for the purpose of determining the effect of current (1962-1969)
(Continued)
S o 103 £DITIoUOFIWOVSSISOIOLETE UnclassifiedSEcurTY CLASSIFICATION OF' THIS PAGE (When DOwe Entered)

Unclassified
SECURITY CLASSIFICATION OF THIS PAGIMCe. Deja Na006
20. ABSTRACT (Continued).
"standard soil testing techniques on the shear strengtb values of clay shales.The effects of variations in the rate of strain, specimen size, and length ofshear path in the direct shear tests were studied. Results indicate that theshear strength increases as the specimen thickness and the rate of straindecreases.
Consolidation test results show no effects from use of different inunda-tion liquids, no evidence of structural collapse, and no differences in sidefriction under various ring preparations. Values of t5s and expansion pres-sures were different for the specimens of various thicknesses, but causes ofthese differences are not apparent.
Results of triaxial compression tests indicate a significant amount ofnegative pore pressure in the laboratory specimens. It must be assumed thatthe negative pore pressure developed after the samples were obtained since thematerials in situ exhibited pore pressures in excess of the ground-watertable.
The variation in physical properties of the undisturbed test specimens,such as density, water content, plasticity, and structure, contributed ap-preciably to variations in all test results.
Results of this study indicate the need for new test procedures andequipment to determine the shear strength characteristics of clay shales.Additional research is required to develop the most applicable techniques.
7 "-it .. ... :cessionl For
I t 1 T
Distrf~~
Unclassified
SECURITY CLASSIFICATION OF THIS PAGE(WMe Date Entred)
,C , - m m mn . . . ;.. .[I n

PREFACE
The U. S. Army Corps of Engineers has had a long and continuing interest
in construction and maintenance problems associated with clay shales. This
interest exists primarily because of the special slope stability problems en-
countered with these materials and their extensive occurrence as foundations
beneath structures and embankments. In 1961, a major slide in the clay shale
foundation during construction of Waco Dam focused new emphasis on these prob-
lems. To understand more fully the engineering properties and behavior of
these materials, laboratory investigations were authorized by the Office,
Chief of Engineers (OCE), U. S. Army.
The U. S. Army Engineer District, Fort Worth (FWD), initiated laboratory
investigations (1961-1963) in conjunction with the reanalysis and reconstruc-
tion following the slide in Waco Dam. The District expanded these investiga-
tions under Engineering Study (ES) 529, "Shear Strength Characteristics of
Clay Shale Foundations" (1962-1969). The laboratory testing for both investi-
gations was performed by the U. S. Army Engineer Southwestern Division Labora-
tory (SWDL).
The U. S. Army Engineer Waterways Experiment Station (WES) conducted
Engineering Studies under ES 529 and ES 542, "Engineering Properties of Clay
Shales" (1968-1974). These investigations were expanded under the Civil Works
R&D Soils (311) Program Work Units 31151, "Engineering Properties of Clay
Shales" (1975-1978), and 31244, "Strength and Deformation Properties of Clay
Shales" (1979-present).
The research results have been documented in the following technical
reports in the series, "Engineering Properties of Clay Shales": Report 1,
"Development of Classification Indexes for Clay Shales," June 1971; Report 2,
"Residual Shear Strength and Classification Indexes of Clay Shales," August
1974; Report 3, "Preliminary Triaxial Test Program on Taylor Shales from Lane-
port Dam," September 1976; and Report 4, "Laboratory and Computational Pro-
cedures for Prediction of Pore Pressures in Clay Shale Foundations," September
1982.
This report, Report 5, "Strength and Deformation Properties of Pepper
and Del Rio Clay Shales from Waco Dam," documents an investigation initiated
under ES 529 to detect and evaluate the effect of testing techniques on the
strength values of clay shales. The study also addresses the difficulty of
i1

correlating results of laboratory tests on clay shales with the in situ be-
havior. The laboratory test data on the Pepper and Del Rio clay shales from
the foundation of Waco Dam are documented in Appendix A. Part II contains
comments on thu laboratory testing authored by Mr. Arthur H. Feese (SWDL) who
directed the development of laboratory equipment and test procedures used in
the research. Part I, authored by Mr. William R. Stroman (FWD), contains an
engineering analysis of the test data with particular emphasis on application
to construction and performance of Waco Dam prior to 1969.
The report was completed in 1969 as an internal reference by the FWD.
During 1983, the unpublished data were used by WES in support of the Civil
Works R&D Work Unit 31244 in conjunction with additional research tests on
Pepper clay shale sampled in January 1983 by FWD during piezometer installa-
tions at Waco Dam. The report was also reviewed in light of current state-of-
the-art technology by OCE, SWD, FWD, WES, Consultant R. R. W. Beene (retired,
FWD and OCE), and the authors. These reviews were taken into account by the
authors during preparation of this report for publication in support of cur-
rent research by WES and studies by the FWD for the Embankment Criteria, Per-
formance, and Foundation Report (prepared under Engineer Regulations
ER 1110-2-1801, 1901).
During the investigations (1965-1969), Mr. William M. Nichols (deceased,
FWD) was a contributor to the analyses. Mr. Charles F. Swenson was Chief,
Engineering Division, and COL R. P. West (deceased) was the Fort Worth Dis-
trict Engineer. Mr. Shigeru Fujiwara was Chief, Engineering Division, and
COL Theodore G. Stroup was Fort Worth District Engineer during the 1983
studies.
The report was reviewed and published in conjunction with current clay
shale research at WES under Civil Works Work Unit 31244 directed by
Mr. Clifford L. McAnear, Chief, Soil Mechanics Division. Dr. William F.
Marcuson III was Chief, Geotechnical Laboratory. Mr. Fred R. Brown was Tech-
nical Director and COL Tilford C. Creel, CE, was Commander and Director, WES.
2

CONTENTS
PREFACE. .. ............................ .... I
CONVERSION FACTORS, U. S. CUSTOMARY TO METRIC (SI) UNITS OF
MEASUREMENT. .. .............................. 5
PART I: ENGINEERING ANALYSES OF LABORATORY TEST DATA
CHAPTER 1: INTRODUCTION. .. ....................... 6
Purpose ... ........................ 6Scope ... ......................... 6Authority .. ........................ 6Current (1983) Review .. .................. 6
CHAPTER 2: MATERIALS ... ........................ 8
Source. .. ......................... 8Geological History of Materials. .............. 8Sampling, Storage, and Sample Preparation .. ....... 13
CHAPTER 3: ANALYSES AND DISCUSSION .. .................. 14
Identification Tests. ... ................. 14Consolidation Tests .... ................. 18Direct Shear Tests. ... .................. 20Triaxial Compression Tests. .. ............... 24
CHAPTER 4: CONCLUSIONS AND RECOMMENDATIONS ... ............. 26
Conclusions. ................ ....... 26
Recommendations. ................. .... 27
PART II: COMMENTS ON LABORATORY TESTING
CHAPTER 1: INTRODUCTION .. .............. ......... 29
Pepper Shale .. ............... ....... 29Del Rio Shale. ................ ...... 29
CHAPTER 2: IDENTIFICATION TESTS. ... .................. 31
Phase I. .................. ....... 31Phase 2. .................. ....... 31
CHAPTER 3: CONSOLIDATION TESTS. ................ .... 34
PhaselI. .................. ....... 34
Phase 2. ................ ......... 37
CHAPTER 4: DIRECT SHEAR TESTS .. ................ .... 41
Program. .............. ........... 41Procedures .. ................ ....... 41Test Results .. ................ ...... 42Discussion .. ............... ........ 43
3

Page
CHAPTER 5: SHEAR STRENGTH SUMMARY ...... .................. ... 45
Phase 1 ......... ........................ ... 45Phase 2 ............ ........................ 46
CHAPTER 6: DIRECT SHEAR TESTING EQUIPMENT .... .............. ... 48
CHAPTER 7: TRIAXIAL COMPRESSION TESTS ..... ............... .. 50
BIBLIOGRAPHY ........... ............................. ... 51
TABLES 1-6
PLATES 1-23
APPENDIX A: LABORATORY TEST DATA* ......... .................. Al
APPENDIX B: NOTATION ............ ......................... Bi
I.
Plates of Appendix A are on microfiche and have been inserted in a pocket
at the back of the report.
4J.-

CONVERSION FACTORS, U. S. CUSTOMARY TO METRIC (SI)UNITS OF MEASUREMENT
U. S. customary units of measurement used in this report can be converted to
metric (SI) units as follows:
Multiply By To Obtain
degrees Fahrenheit 5/9 Celsius degrees or Kelvins*
feet 0.3048 metres
feet per mile (U. S. 0.18939 metres per kilometrestatute)
inches 2.54 centimetres
miles (U. S. statute) 1.609347 kilometres
pounds (force) per square 6894.757 pascalsinch
pounds (mass) per cubic foot 16.01846 kilograms per cubic metre
tons (force) per square foot 95.76052 kilopascals
To obtain Celsius (C) temperature readings from Fahrenheit (F) readings,
use the following formula: C = (5/9)(F - 32). To obtain Kelvin (K) read-
ings, use K = (5/9)(F - 32) + 273.15.
5

ENGINEERING PROPERTIES OF CLAY SHALES
STRENGTH AND DEFORMATION PROPERTIES OF PEPPER AND
DEL RIO CLAY SHALES FROM WACO DAM
PART I: ENGINEERING ANALYSES OF LABORATORY TEST DATA
CHAPTER 1: INTRODUCTION
Purpose
1. Initially a study was proposed to determine the effect of several
test methods and procedures on shear values of clay shales. Three variable
test procedures were visualized as having an effect on the indicated shear
strength: (a) rate of strain, (b) specimen size, and (c) length of shear path.
The program was later expanded to include determination of variations in basic
properties (moisture content, degree of saturation, and soil indices) and con-
solidation characteristics derived using different test procedures.
Scope
2. The program consisted of conducting a series of laboratory tests de-
signed to provide information as to the effect of variations in test pro-
cedures on two types of clay shales. Variation in test procedures included
type of water used in sample preparation and testing, specimen thickness,
rates of loading, and minor modification of testing equipment.
Authority
3. Authority to perform these investigations was granted in ENGCW-EC
letter dated I November 1962, subject: Civil Works Investigations FY 63.
Current (1983) Review
4. Expansion pressure-values shown on consolidation test void ratio-
pressure curves were determined by saturating the sample at the void ratio as
6

existing in the laboratory. During the past few years it has become evident
that test specimens should first be reloaded to field overburden pressures and
then saturated. This test procedure produces significantly higher expansion
pressures.
4
|7

CHAPTER 2: MATERIALS
Source
5. Materials used in this investigation were from the geological forma-
tions comprising a portion of the embankment and spillway foundations at Waco
Dam, Waco, Tex. Samples used for shear strength, consolidation, moisture con-
tent, density, and soil indices tests were obtained from Borings 8A6C-445,
-446, and -447 beneath and adjacent to the downstream berm and from Borings
DR-I, -2, -3, and -4 in the spillway area. Mineralogical and related identi-
fication tests were performed on samples obtained from Borings 8A6C-352 and
8A6C-354 beneath the main embankment. Locations of the borings are shown in
Plate 1. Subsurface profiles, indicating the zones from which the samples
were obtained, are shown in Plate 2.
Geological History of Materials
Physiography
6. Waco Reservoir lies within the Bosque River drainage system. The
confluence of the North, Middle, and South Bosque Rivers occurs under old Lake
Waco, approximately 1 mile* upstream from the new dam axis. Old Lake Waco Dam
was located about 2,000 ft upstream of the new dam and is now inundated by the
new reservoir. The main stem of the Bosque River empties into the Brazos
River approximately 4 miles downstream from the new dam. The reservoir topog-
raphy consists of rolling plains incised, to varying depths, by the three
forks of the Bosque River and their tributaries. Bosque River terraces occur
as high as 120 ft above the present North Bosque River channel. The North
Bosque is incised approximately 30 ft into a broad (as wide as 4,000 ft within
the reservoir area) floodplain valley which, in turn, is incised from 100 to
150 ft below the upland plains. The Middle Bosque River is incised to depths
of 10 to 20 ft into a poorly developed floodplain valley, which is in turn in-
cised to depths of 70 to 80 ft below the upland plains. The South Bosque
River flows against the Bosque escarpment on its south or right bank and is
* A table of factors for converting U. S. customary units of measurement to
metric (SI) units is presented on page 5.
8

incised to depths of from 70 to 80 ft below the upland plains on its north or
left bank. This double incisement of the Bosque River for considerable depths
below its earlier terraces indicates multiple degradation, aggradation, and
rejuvenation. The incised floodplain of the North Bosque River is better de-
veloped because the direction of flow of the North Bosque nearly parallels the
dip slope of the rock formations. The direction of flow of the Middle and
South Bosque Rivers trends at an angle with and nearly perpendicular to, re-
spectively, the formational dip slope. The Bosque escarpment marks the south-
western limits of the Bosque River drainage system. The escarpment was de-
veloped by the down faulting of erosion-resistant Austin chalk, forcing the
South Bosque River to erode perpendicularly to the formational dip slope on
less resistant shales of the Del Rio, Pepper, and Eagle Ford formations.
Stratigraphy
7. The geologic formations occurring in the area range from the Lower
Cretaceous limestones of the Georgetown group to the Upper Cretaceous Austin
chalk of the Gulf series. The relative position and thickness of each of the
geologic formations encountered in this area is shown in Plate 3. This in-
formation was compiled from numerous boreholes which were drilled for the de-
sign of new Waco Dam. The stratigraphic position of the various zones of
Pepper and Del Rio shales which were used in the tests conducted for this in-
vestigation are shown adjacent to the rock column. The two formations per-
tinent to this report are described in detail below.
8. Del Rio shale. The Del Rio is a soft, calcareous, medium- to thick-
bedded, fossiliferous, nonfissile, medium gray to greenish-gray clay-shale. It
contains occasional marly, highly calcareous zones and argillaceous limestone
seams; occasional thin, disclike, poorly developed clay-ironstone concretions
near the base; and occasional thin, softer, dark gray to black shale seams.
The Del Rio shale is remarkably homogeneous, with only three identifiable per-
sistent marker horizons. These markers are a thin (0.05- to 0.20-ft-thick),
tan-white bentonite seam approximately 3 ft from the top; and two marly, more
calcareous horizons, approximately 18 and 22 ft above the base. Calcareous
clay-ironstone concretions are found in the upper 25 ft of the formation, and
occasional thin (0.1- to 0.5-ft-thick), lenticular limestone beds occur without
continuity throughout the section. The basal contact has been placed 0.5 ft
below a marly limestone bed about 0.8 ft thick. The top of the Del Rio is
marked by an erosional unconformity. The hiatus was of unknown duration, but
9

time and exposure were sufficient to remove the Buda limestone formation of
unknown thickness that had originally overlain the Del Rio. The residual
detritus, consisting of fossil shell and fish fragments, sand, lime and shale
pebbles, and small phosphatic nodules, has been lime cemented into a conglom-
erate varying from 0.10 ft to more than 1 ft (infrequently) in thickness.
Secondary marcasite is present throughout the Del Rio in nodular form and as
fossil replacement.
9. The thickness of the Del Rio varies along the erosional surface,
and has been logged from 64 to 72 ft thick. It apparently thins toward the
southeast, or in the direction of the right abutment.
10. The Del Rio shale is moderately susceptible to weathering. During
construction at Waco Dam, fresh-cut faces of Del Rio shale deteriorated rather
rapidly when exposed to atmospheric conditions. On surfaces that have been
exposed for some time, even with a protective overburden mantle, the Del Rio
shows extensive weathering near the surface. Significantly, the weathering
processes penetrate farther along bedding and fracturing than across them. At
locations where a broad, flat surface is exposed, oxidation and leaching pene-
trated only about 1 ft. Iron oxidation is intense, and the lime-bonded clay
particles evidently break up into clay particle aggregates, which appear some-
what like silt when moistened. Moderate staining penetrated fairly deep into
vertical joints with considerable iron oxidation. Del Rio samples for testing
were obtained from the unweathered zone below the bottom of the spillway chan-
nel as shown in Plate 2.
11. Pepper shale. The Pepper shale is the equivalent of the upper por-
tion of the Woodbine group at the damsite. It is a soft, noncalcareous, thin-
to medium-bedded, fossiliferous, fissile, black compaction shale with occa-
sional beds of hard, nodular claystone, siltstone, and sandy seams. Although
the Pepper shale has not been geologically subdivided, test results show a
distinct difference in the upper and lower sections of the formation; there-
fore, for this investigation, the designations Upper Pepper and Lower Pepper
have been used. Detailed analyses indicated that the Upper Pepper could be
further subdivided into two separate materials, as will be discussed later.
12. The Pepper shale is only mildly susceptible to chemical weathering.
On flat surfaces only a thin, 0.2- to 0.4-ft, veneer of chemically weathered
shale was found covering unweathered shale. Chemical weathering and oxidation
penetrated somewhat deeper along bedding planes and joints. Occasionally,
10
B . .. I II I II I p i . . . .

near the surface siltstone interbeds were found to be highly oxidized while
the shale above and below remained almost unchanged. This condition was found
for as much as 6 ft below the surface of the Pepper, and probably is closely
related to jointing, which would allow the entrance of ground water. Iron oxi-
dation in the form of limonite and hematite is intense only when related to
the interbeds; however, jarosite or melanterite (sulfate of iron) is common on
exposed Pepper surfaces. Mechanical weathering of the Pepper shale is very
rapid; however, when covered by a mantle of overburden and a thin veneer of
weathered shale, the Pepper stays intact. Upon removal of the protective
cover, it gives up moisture readily and deterioration is rapid. This slaking
process extended to more than 3 ft below the surface in places where the
Pepper was exposed to atmospheric conditions. A vertical face of Pepper shale
deteriorates rapidly. In as short a period as I day, vertical exposures of
Pepper have been observed to start spalling or slaking, and alternate wetting
and drying accelerates the slaking process. On flat surfaces, Pepper shale
that has been dried and moistened a few times deteriorates to a mass of small
shale fragments. Even the slightest distortion or disruption of bedding
greatly accelerates mechanical weathering on exposure. It is significant that
no intense weathering is noted on distorted or disrupted bedding that has not
been exposed to the air or to surface water.
Structural geology
13. The structural features in the area are related to, or controlled
by, the tectonic movements which created the Balcones fault zone. A brief
preface to the geologic history is necessary to discuss the Balcones faulting
itself. During Paleozoic time, sediments were being accumulated in the
Llanoria geosyncline, a relatively narrow trough which is associated with the
Ouachita geosyncline and Ouachita synclinorium to the northeast. The sediments
for this deposition were derived from the ancient Llanoria land mass to the
southeast. During late Paleozoic time, strong orogenic movements obliterated
the geosyncline. The sediments were metamorphosed, tightly folded, and sub-
jected to overthrusting to the northwest. Uplift, coupled with this deforma-
tion, forced late Paleozoic deposition farther west, placing a relatively thin
veneer of sediments on the early Paleozoic and pre-Cambrian basement rocks.
In early or mid-Mesozoic the peneplained Llanoria land mass began to subside,
reversing the direction of drainage from the northwest to the southeast. This
created the following structural condition:
11

a. A subsiding paleoplain of basement rocks and deposition ofearly Mesozoic sediments to the southeast.
b. A relatively narrow, thick, orogenically disturbed belt ofPaleozoic geosynclinal metamorphosed sediments in the vicinityof the project.
c. A stable area of basement rocks with a thin cover of Paleozoicrocks to the northwest.
Extensive invasion by Cretaceous seas loaded the area with progressively
greater increments of sediments to the southeast. Subsidence remained strong
to the southeast and relatively minor north of the geosynclinal area. Late
Cretaceous was marked by uplift and sea retreat. The Tertiary was marked by
repeated attempted sea encroachment. Near balance occurred, with sediment-
laden rivers constructing deltas as the sea attempted to encroach overland.
This resulted in continued subsidence with tremendous thicknesses of sediments
deposited in the coastal plain area. In effect, a hinge was created. The
leaf to the northwest was rigid and remained at essentially the same elevation.
The leaf to the southeast was relatively rigid and pivoted downward. The
hinge proper was the weaker, structurally disturbed, geosynclinal sediments.
Extensive normal faulting occurred in the hinge area, developing the Balcones
fault zone. The fault zone in this area consists of a complex system of normal
faults in a generally en echelon pattern, striking northeast. These faults
dip both northeast and southwest. Numerous grabens and horsts occur within
the zone. In the Waco Dam area the fault zone is approximately 15 miles wide
and its northwest limit trends through the damsite. Dip of the rocks, north-
west of the zone, is about 25 ft/mile to the southeast. In the fault zone the
dip varies, but averages 50 ft/mile to the southeast. Total throw in the zone
is approximately 600 ft, of which about 250 ft occur in three faults or fault
zones at the damsite. Warping and dragging of the beds occur adjacent to fault
planes. The first development of the Balcones fault zone probably occurred
during late Cretaceous, and the most recent major movement took place no later
than Pliocene time. Although, in a geologic sense, the Balcones system may
still be active, no evidence indicates recent movement in the Waco area. Loca-
tion of the faults at Waco Dam is shown in Plate 1.
14. Slickensides are common throughout both the Pepper and Del Rio for-
mations, although they are more prevalent in the Pepper. Generally, the
slickensides are considered to be a product of faulting, but many can also be
attributed to differential compaction of the shales. The Pepper shale in the
12

CHAPTER 3: ANALYSES AND DISCUSSION
Identification Tests
General
17. Although the materials used in this investigation have many of the
properties normally attributed to soils, their geological history and the en-
vironment under which they have existed combine to remove them from this strict
category. The materials comprising the Pepper and the Del Rio could be as-
signed into several classifications and groupings. For simplicity both the
materials are called "clay shale" because they disintegrate into a claylike
mass within a short period of time on exposure to the atmosphere. The Pepper
is probably a true "compaction" shale, but the Del Rio, because of its calcium
carbonate content, could be classified as a lightly cemented shale. However,
the reaction of the Del Rio materials to slaking in water and degradation in
atmospheric conditions indicates that strong cementation does not play a major
role in the makeup of its structure.
18. During the investigation of the failure of the Waco Dam, it was
determined that the Pepper formation consisted of two identifiable zones.
Numerous borings and tests indicated that the contact between the two zones
occurred approximately 27 ft above the Del Rio-Pepper contact. It was natural
to call these two zones the Upper and Lower Pepper. This division was made on
the basis of moisture content and density and upon visible characteristics.
In analyzing the results of tests conducted for this investigation, it was
noted that some of the tests on the Upper Pepper did not correlate. Further
investigation into the basic properties showed that the Upper Pepper consists
of at least two additional submembers, readily identifiable by differences in
the Activity Indices of the respective zones (Seed, Woodward, and Lundgren
1964). In this report the Upper Pepper material is divided into zones having
"high activity" and "low activity" colloids. For the purpose of correlating
basic properties and delineating the various zones in the Pepper shale, the
Del Rio-Pepper contact was chosen as the datum. The contact between the zonesof high and low activity has been identified as approximately 40 ft above this
datum.
Mineralogical tests
19. Mineralogical tests were conducted on samples from Borings 6DC-352
14

and 6DC-354. Moisture content and limits tests were conducted on companion
samples. Results of the tests are shown in Plate 4. Also shown in this plate
are the respective zones from which samples were obtained for strength and
other tests. Montmorillonite, illite, and kaolinite were found to be the
principal clay-forming minerals. Pepper shale was found to have considerably
more montmorillonite than the Del Rio, and the Upper Pepper contained slightly
more montmorillonite than the Lower Pepper. Samples of Lower Pepper were
found to contain significantly more illite than samples of Upper Pepper. The
influence of combinations of illite and montmorillonite on properties of pre-
pared materials has been documented by Seed, Woodward, and Lundgren (1962) and
others. This influence on naturally occurring materials has not been investi-
gated, and the results presented here are not sufficient to even suggest what
could be expected except that, with an increase in montmorillonite and de-
crease of illite, the activity index appears to increase.
Moisture contents
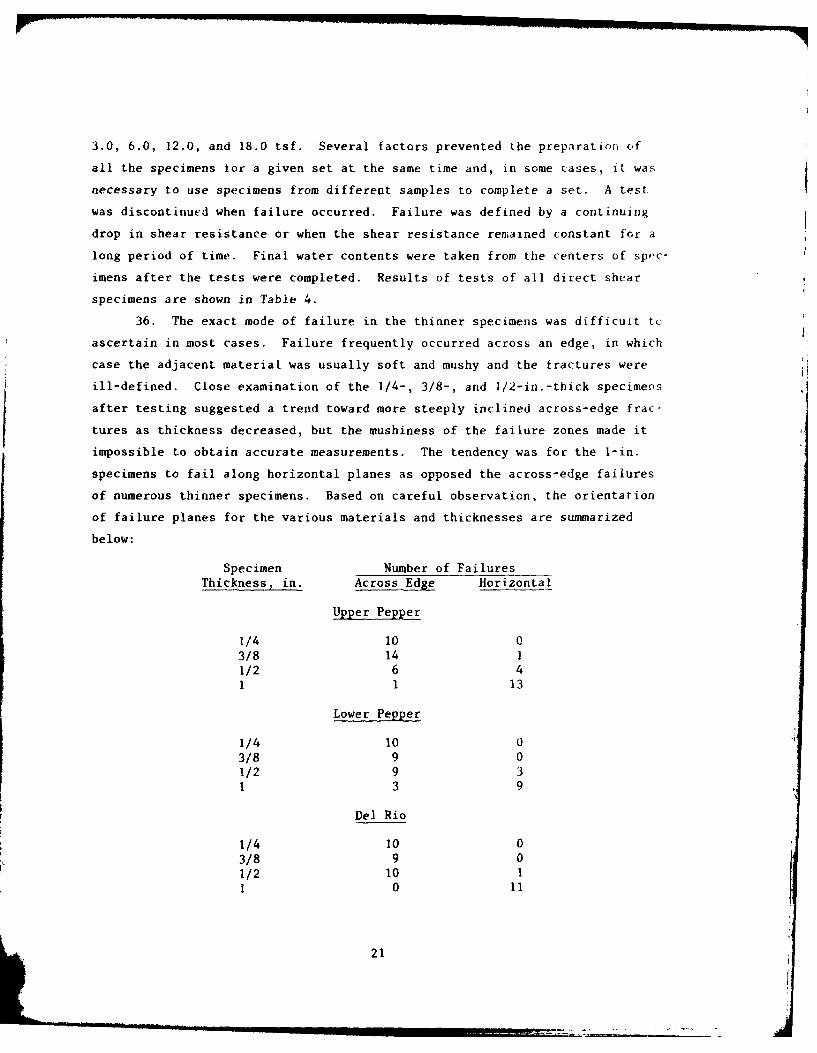
20. Moisture content and density tests were conducted for each entire
sample and for each individual undisturbed test specimen cut from each sample.
The number of individual moisture content tests, the range, and average values
are shown in Table 1. Distribution of average moisture in the Pepper shale
with respect to distance above the Del Rio-Pepper contact is shown in Plate 6.
Except for one sample, the Upper Pepper shows a uniform occurrence of moisture.
Eliminating the highest and lowest test values, the entire range of moisture
content varies from 19.0 to 21.8 percent. The moisture content range for the
zone of high activity is from 19.0 to 20.6 and that for the zone of low ac-
tivity is from 21.0 to 21.8. The Lower Pepper shows a wider range in natural
moisture content than the Upper Pepper. Eliminating the highest and lowest
values, the range for the Lower Pepper is from 21.5 to 28.2. By the same pro-
cedure, the moisture content range for the Del Rio is from 16.0 to 22.8. It
is considered that the Upper Pepper should give the most consistent test re-
sults because the gross physical characteristics of the individual test speci-
mens are closer to the overall characteristics of the material.
21. All moisture contents were determined by drying the materials in a
forced draft oven at 1050 C. Grim (1953) states that this temperature is suf-
ficient to almost completely remove the interlayer water from (dehydrate) mont-
morillonitic clay particles. This lends some confusion as to the meaning of
moisture content and, if bonded water has a density greater than 1.0 as some
15

observers contend, would account for percentages of saturation in exLess of 100
as shown for some of the physical test results. The effect of using high tem-
peratures in other identification tests is discussed in subsequent paragraphs.
Grain-size analyses
22. Specimens for grain-size analyses were oven-dried to 1050 C and
50-g portions were slaked in distilled water for 24 hr. None of the materials
slaked completely, and dispersion was accomplished with a blender. The speci-
mens were washed into standard hydrometer jars, and 10 mf of a stock solution
of a buffered calcium hexametaphosphate believed to contain other phosphates
in various amounts was added to prevent flocculation. Hydrometer readings
were taken at 1, 5, 30, and 120 min and at 24-hr intervals after dispersion.Grain-size distribution curves were developed from the test results. Percent-
ages smaller than selected particle sizes are shown in Table 1.
23. In addition to the more or less standard test, one shale sample was
subjected to special investigation to determine the effect of sample prepara-
tion and additives on test results. Samples of Upper Pepper, from a depth of
31.5 to 32.4 ft in Boring 8A6C-446 which had been dried to 1050 C and which
had not been subjected to drying, were tested using three different defloc-
culants. Results of the tests are as follows:
Percent Colloids (0.002 mn)Dried to Natural
Deflocculant 1050 C Moisture
Calcium hexametaphosphate 44 33
Sodium tripolyphosphate 42 35
Sodium hexametaphosphate 44 35
24. The effect of drying the specimens prior to the test had a more pro-
nounced influence on the test results than the ion exchange capacity of the
additive. It should be noted that sodium or perhaps phosphorous is the most
probable exchangeable ion available. Since the ground water contains an over-
whelming percentage of sodium and potassium as compared to calcium and the
other exchangeable ions, it is concluded that no ion exchange could be ex-
pected. It is not known what effect, if any, would have been observed if the
additive had contained calcium ions available for exchange. Drying the sample
to 1050 C had a considerable effect on the measured amount of colloids. As
stated above, this temperature has been cited as sufficient to remove almost
16

completely the interlayer water. This would, in effect, reduce the particle
size. Grim (1953) states that montmorillonite rehydrates easily unless all
the water is removed from between the soil plates. However, the 24-hr slaking
(rehydration) period allowed before conducting the test is possibly not suf-
ficient time to allow for complete rehydration.
Atterber__limits tests
25. Specimens for Atterberg limits tests were covered with either dis-
tilled water or ground water without the samples having been subjected to
artificial drying and slaked for at least 24 hr. The material was then pro-
cessed in a blender. Excess water was removed by absorption in plaster of
paris bowls. Liquid limit tests conducted in the early stage of this program
(samples from Borings 445 and DR-i, -2, and -4) were conducted by the simpli-
fied (one-point) method. Samples tested later (Borings 446 and 447) were
tested by the four-point method. Values for liquid limits and plasticity
indices are given in Table 1. Figure 1 of Plate 5 shows a plot of liquid limit
versus clay content, and Figure 2 of Plate 5 shows the relation of the liquid
limit versus plasticity index with respect to the "A" and "U" lines. Results
of limits tests with respect to Del Rio-Pepper contact are shown in Plate 7.
26. Three tests were conducted on materials which had been dried to
105 ° C prior to testing. Duplicate tests were conducted on material from the
Lower Pepper which had been prepared at both natural moisture content and after
drying to 1050 C. These tests indicate a significant increase in the liquid
limit value due to oven-drying and showed a change in liquid limits from 78 to
95 percent. Tests on oven-dried material from the Upper Pepper and the Del Rio
did not have duplicate tests conducted on material which had not been dried.
27. As stated above, a number of limits tests were conducted using
ground water as the preparation fluid. Analyses presented in Table 2 show
that the ground water contains considerably more sodium and potassium than
either calcium or magnesium. The effect on test results using water with more
calcium and magnesium ions is not known. Tests using ground water showed d
slight increase in the liquid limit values (averaging approximately 2 percent)
over those using distilled water.
Activity index
28. Skempton (1953) proposed an index property for soil which related
the plasticity index to the clay fraction. The numerical value of this index
was determined by dividing the plasticity index by the percent finer than
17

0.002 mm. Seed, Woodward, and Lundgren (1962) refined the numerical value to
equal the plasticity index divided by the percent finer than 0.002 mm minus a
constant. Laboratory tests indicated this constant to be somewhere between 9
and 11. For the purpose of this study, a constant of 10 has been used and the
activity index has been determined by the ratio:
A = plasticity indexI clay fraction - 10
Values of AI are shown in Table 1.
Consolidation Tests
29. Consolidation tests were conducted on specimens having nominal
thickness of 0.25, 0.375, 0.50, and 1.00 in. All specimens were 4.44 in. in
diameter. The consolidometer ring was of the fixed-ring type. Drainage was
permitted from both the upper and lower sample surface. Results of the con-
solidation tests, in terms of pressure-deformation curves, are presented in
Plates 9 through 12. In these plates the ordinate indicates the average void
ratio of the four test specimens and the unit compression (inches per inch)
for each increment of load. Along with the pressure-deformation curves is
shown the increase in unit compression; that is, the increase in change in
void ratio of the three thinner specimens with respect to the unit deformation
of the 1.00-in.-thick specimens.
30. The tests conducted on the high activity zone of the Upper Pepper,
shown in Plate 9, on the Lower Pepper, shown in Plate 11, and the Del Rio,
shown in Plate 12, were conducted in the earlier phase of the testing. The
laboratory reported that these tests showed extrusion of material between the
consolidometer ring and the upper porous stone. This condition was remedied by
application of a circumferential ring of epoxy resin on the porous stone to re-
duce the clearance to 0.003 in. In addition, the bases of the consolidometers
were remachined to assure a more even contact between the specimen and the
lower porous stone and between the stone and base. Using the repaired con-
solidometers, the Upper Pepper was retested. The results of these tests are
presented in Plate 10. Results of companion tests, using different saturation
fluids, loading times, and using liners, are shown in Table 3. Unfortunately,
the specimens were obtained from the zone which showed low activity, so no
direct comparison could be made as to the benefit from revising the equipment
18

used in the test. However, the deformation-reduction curves shown in Plates 9
through 12 do present an interesting comparison of the materials. According
to Schmertmann (1955), the deformation reduction curves represent a measure-
ment of the relative disturbance of the thinner specimens compared to the
thickest (1.0-in.) specimen. That is to say, the larger the value of deforma-
tion reduction for a given load in terms of deformation, the greater the de-
gree of disturbance. This is not to assume the 1.0-in. specimens represent
undisturbed tests; only that the thinner specimens are disturbed to a greater
degree than the 1.0-in. specimens. As can be seen, the tests conducted on the
more precisely fitting consolidation equipment, which should give the more
consistent test results, generally show the largest values of deformation re-
duction, indicating a greater degree of disturbance. This is contrary to what
should be expected from the improvements made in the test equipment. It is
believed that the disturbance evidenced is from some source other than the ex-
trusion. Possibly it occurs during specimen preparation in the laboratory or
from disturbance during sampling operations in the field or both. Whatever
the cause, it appears to be more noticeable in the low activity material.
This phenomenon will be discussed further in the section on direct shear tests.
31. Another facet of consolidation test results is the differences in
expansion pressures exhibited by specimens of different thickness. For some
reason not understood, the thinner speciw-ns almost invariably required the
lesser load to control expansion. This effects a transfer of the entire e-p
curve to the left for the thinner specimens. Again, specimen disturbance
could be a factor. There are insufficient data to relate expansion character-
istics to activity index, but it can be assumed that the maximum potential ex-
pansion pressure probably was not measured in the laboratory because water was
used to wash the cuttings from the hole during drilling. The core samples had
access to the wash water and, although the permeability of the materials is
very low, they could have absorbed an unknown amount of water at that time.
This would result in lowering the expansion value which could be measured in
the laboratory.
32. Consolidation test data on 1.O-in.-thick specimens for the various
materials tested are presented in Plates 13 through 17. These curves repre-
sent data which could ordinarily be used in design studies.
33. It could be suggested that none of the tests conducted on the Pepper
shale would provide satisfactory answers for problems involving settlement.
19

Although an apparent virgin compression curve was defined in each test, the
indicated maximum past pressures are only a fraction of the value which would
be estimated from the geologic history of the area. The test shown for the
C el Rio shale indicates somewhat higher maximum past pressure, but the value
is still less than what would be estimated from geologic history.
34. On the other hand, the maximum past pressure values from the con-
solidation test data could possibly be the correct values for use in design.
The release of diagenetic bonds during normal degradation of the area in the
geologic past could result in a lowering of the indicated maximum past pres-
sures. This could increase the amount of consolidation which would actually
occur in a stratum reloaded to pressures less than the effective pressure
under which it had once existed. The value of maximum past pressures with re-
spect to hypothesized geological conditions will also be discussed in the fol-
lowing section.
Direct Shear Tests
35. Direct shear tests were conducted on specimens from the Del Rio and
Upper and Lower Pepper shales. Specimens were 3.0 in. square and 1/4, 3/8,
1/2, and 1.0 in. in thickness. Test specimens were trimmed into cutters and
then placed directly into the shear box, inundated with tap water, and con-
solidated under 1.5-tsf normal load for at least 16 hr. The normil loads were
then increased to the full desired levels, and the specimen was permitted to
consolidate for an additional 24 hr. The cutters are split horizontally at
midplane which coincides with the plane in the test specimen along which
stress is applied. At the start of tests the upper frame of the shear box was
raised to a position of 0.05 in. above the lower frame and secured to the
piston. The two halves of the cutter containing the test specimen remained in
contact along lips having a width of 0.1 in. The shear rate was established
to test a set of specimens of each type shale: fast (0.006 in./min), medium
(0.00008 in./min), and slow (0.000004 in./min). The rates actually achieved
varied somewhat from the above, and are shown along with the rest of the test
data in Table 4. The rate of shear was closely controlled during the working
day by manual adjustment of variable speed reducers ("Zero-Max") but tended to
drift during the night and over weekends, resulting in deviations of some mag-
nitude in some instances. Tests were conducted using normal pressures of 1.5,
20
3.0, 6.0, 12.0, and 18.0 tsf. Several factors prevented the preparation of
all the specimens tor a given set at the same time and, in some cases, it was
necessary to use specimens from different samples to complete a set. A test
was discontinued when failure occurred. Failure was defined by a continuing
drop in shear resistance or when the shear resistance remained constant for a
long period of time. Final water contents were taken from the centers of spPc-
imens after the tests were completed. Results of tests of all direct shear
specimens are shown in Table 4.
36. The exact mode of failure in the thinner specimens was difficult te
ascertain in most cases. Failure frequently occurred across an edge, in which
case the adjacent material was usually soft and mushy and the tractures were
ill-defined. Close examination of the 1/4-, 3/8-, and 1/2-in.-thick specimens
after testing suggested a trend toward more steeply inclined across-edge frac-
tures as thickness decreased, but the mushiness of the failure zones made it
impossible to obtain accurate measurements. The tendency was for the 1-in.
specimens to fail along horizontal planes as opposed the across-edge failures
of numerous thinner specimens. Based on careful observation, the orientation
of failure planes for the various materials and thicknesses are summarized
below:
Specimen Number of Failures
Thickness, in. Across Edge Horizontal
Upper Pepper
1/4 10 03/8 14 11/2 6 41 1 13
Lower Pepper
1/4 10 03/8 9 01/2 9 31 3 9
Del Rio
1/4 10 0
3/8 9 01/2 10 11 0 11
21

37. As has been previously mentioned, the Upper Pepper appeared to be
the most consistent of the three shales tested from point to point with respect
to basic properties. Plots in Plate 18 show the results of tests conducted on
samples of four specimen thicknesses at medium rate of strain for the zone of
high activity Upper Pepper. A reduction in shear strength with reduction of
specimen thickness is indicated. Plots in Plate 19 show a similar comparison
for the Lower Pepper shale. The data are not so orderly, probably because of
variations from specimen to specimen, but the same trend is indicated.
38. The across-edge failures create questions as to the validity of the
test data for the thinner specimens since such failures indicate improperly ap-
plied shear stresses. It is assumed in the computation of shear stresses that
strains and stresses are distributed uniformly over the failure surface. To a
great extent this may be true if the shear force is transmitted to the failure
plane only through the porous stones at the top and bottom of the specimen.
However, the geometry of the ordinary direct shear box restricts uniform
straining because of the rigid sides of the box. Hvorslev (1960) presented
data indicating that at low strains, the desired condition of uniformity may
exist in the central portion of a specimen, but with considerable nonuniformity
of strains at both ends. This nonuniformity results from stress concentrations
at the contact between specimen and ends of the box. Hvorslev showed, however,
that with continued shear displacement, the zones of nonuniformity may propa-
gate inward along planes that are oblique to the preselected failure plane and
intersect specimen boundaries at the upper and lower porous stones. Two
failure planes then exist, neither of which is the desired horizontal plane.
39. In the case of the brittle materials tested in this program, the
strains were much smaller than for a normally consolidated clay, and the
strain distribution immediately prior to failure was not known. It is possible
that at very small strains all planes are strained uniformly and remain essen-
tially parallel. The across-edge breaks may thus be the same phenomenon as
noted by Hvorslev in more plastic soils where the tendency is for failure
planes to develop along lines not parallel to the direction of applied force
when subjected to large strains. In such a case, measured deformations im-
mediately prior to across-edge fracturing may represent reasonable estimates
of shear strength, just as in plastic clays.
40. When plastic clays are tested and the ends of the shear box have
begun to cause unequal strains, it is clear that stress concentrations at the
22
. . .. . . . .L I I | I I , , ,

ends make the assumption untenable that unit stress may be computed by divid-
ing force by total area. It appears likely, however, that these concentra-
tions are partially relieved by readjustment of particles, plastic flow, or
remolding, thus effecting some redistribution of stress across the full area.
The occurrence of this action is to some degree substantiated by the fact that
direct shear test results on plastic clays usually check well with the results
of triaxial compression tests in which stress concentrations leading to pro-
gressive failure are not believed to be a major defect. In such a case, use
of the full area of the specimen might lead to only minor errors in strength
determination. But with a more brittle, highly structured material such as
the Pepper shale, plastic readjustment may be so slow that virtually no relief
of stress concentration occurs. If this is the case, the strength values indi-
cated are only relative.
41. Assuming the tests on the l-in.-thick specimens have some degree of
validity, then an interesting comparison can be made between the high activity
and low activity zones of the Upper Pepper. As shown in Plate 21, there is a
considerable difference in shear strength between the two zones; the low ac-
tivity zone having the lower strength. This is related to the higher degree
of disturbance indicated by the consolidation tests conducted on material from
the low activity zone when compared to the tests conducted on the material
from the high activity zone, as shown in Plates 9 and 10. As in the consolida-
tion tests, the material from the low activity zone is considered either more
susceptible to sample disturbance or to have less capacity for retention of
the diagenetic bonds, or both.
42. After eliminating the suspect test results, i.e., tests which showed
across-edge failure, and grouping samples having common basic characteristics,
a comparison of the effect of rate of shear was made on materials from the
high activity zone of the Upper Pepper shale, as shown in Plate 20. Part of
these data are also summarized in Table 5. Apparently the cohesion parameter
is affected most by the rate of shear, or at least, the slowest rate shows the
lowest indicated resistance to shear. Results of tests on 1.0-in.-thick speci-
mens for medium rate of shear on the low activity Upper Pepper material are
shown in Table 5 and in Plate 22. Normal loads for these tests included loads
up to 18.0 tsf. The envelope and stress circle shown in Plate 22 indicate a
maximum past pressure of approximately 19.0 tsf, which approaches the value
indicated from geologic history. From the geologic history discussed in
23

paragraph 13 and assuming that the 600-ft total displacement in the faults
once represented the minimum overburden load on the Pepper formation, then
a maximum past pressure of at least 20 tsf can be inferred. As shown in
Plate 14, a maximum past pressure of 6.0 tsf may be determined from the con-
solidation test data on this material. The apparent contradiction has not
been resolved.
Triaxial Compression Tests
43. Unconsolidated-undrained triaxial compression tests were conducted
on specimens of the Upper Pepper shale. Both constant strain (Q n) and stress
control (Q ss) tests were conducted. Test data are summarized in Table 6. The
test specimens were trimmed from samples taken at approximately equal eleva-
tions since the bedding appeared to be essentially horizontal. The specimens
were trimmed so that the normally horizontal plane was inclined at preselected
angles of 45 and 60 deg. Water content and classification test specimens were
taken from trimmings adjacent to the triaxial specimens. All specimens were
1.4 in. in diameter and 3.0 in. high. Two rubber membranes, separated by a
thin layer of silicone grease, were placed over each specimen pr ir 'o as-
sembly in the triaxial chamber. Tap water was used as the ch:..,'ber fluid. The
induced pore pressures were measured at the top of each specimen through a por-
celain disc having a bubbling pressure of 30 psi; the tubing connecting the
disc to the pore pressure measuring interface was 1/16-in. stainless steel
with an inside diameter of 0.02 in. and a total length of about 30 in. Cham-
ber pressures were 1.5, 3.0, 6.0, and 12.0 tsf. Pore water pressures were al-
lowed to become stable, which required from 1 to 3 days, before axial loading
was commenced. The Q tests were conducted at a rate of strain of 0.001 in./
min, intended to effect failure in 15 to 20 min, except for one set of speci-
mens which was tested at a more rapid rate. Pore pressure measurements were
made during shear. The tests were discontinued after developing a strain of
about 10 percent, and the total specimens were used for final water content
determination. The Qss tests were loaded in axial stress increments of ap-
proximately 0.1 tsf, applied through a dead load system at minimum time inter-
vals of 24 hr. Pore pressure measurements were made during shear. The rates
of loading were believed to be sufficiently slow for equalization of pore pres-
sure. Failure, when it occurred, was total, and no postfailure data could be
24

obtained. Water content determinations were made on each entire specimen.
44. Results of strength determinations were of such erratic nature that
no analyses were possible, but the relationship of pore pressure to chamber
pressure aL various stages in the test, shown in Plate 23, presents some in-
teresting data. The pore pressure values versus the chamber pressure prior to
the application of deviator stress for the Qn and Qss tests are shown in
Figure 1 of Plate 23. In both cases a negative pore pressure of approximately
1.3 tsf (18 psi) at zero chamber pressure is indicated. The rate of increase
of pore pressure with respect to increase in chamber pressure is shown to be
approximately 0.88:1.00. The application of deviator stress induced additional
pore water pressure until, at failure, the ratio of pore pressure to chamber
pressure was slightly greater than 1.00:1.00 in the Qn test and less than
1.00:1.00 on the Qss tests.
25

CHAPTER 4: CONCLUSIONS AND RECOMMENDATIONS
Conclusions
45. The limited number of tests conducted on materials having such a
broad and complex distribution of properties as demonstrated by the subject
materials will not produce final conclusions. However, this investigation re-
affirmed that uniform visual and tactile characteristics of a clay shale mask
a bewildering array of subvisual and subtactile, but extremely important
properties. Rather than conclusions, the results will be treated as leading
to inferences and suggestions.
Identification tests
46. Based on the results of the tests conducted on the subject mate-
rials, it can be inferred that the use of solutions in testing that contain
ions which were present in the natural environment has no material effect on
either the Atterberg limits or grain-size distribution tests. This is sug-
gested by the results of limits tests conducted with natural ground water and
the results of hydrometer tests with deflocculants containing ions which were
also present in the ground water. The deflocculants and the natural ground
water were both heavily charged with sodium; therefore, any affinity of the
clay minerals for sodium would have been satisfied in their natural environ-
ment. The use of distilled or tap water probably would not change the char-
acteristics of the clay minerals because no leaching process was performed;
the material was simply given access to the "foreign" water.
47. Drying the materials prior to preparation of test specimens for
Atterberg limits and grain-size analysis had a significant effect on the test
results. The effect was to increase the value of the liquid limit and to in-
crease the percent of colloids.
48. The activity index proved to be valuable in identifying differences
in materials which otherwise appeared to have fairly uniform characteristics.
Consolidation tests
49. All consolidation tests showed some degree of disturbance. It is
noteworthy that the tests conducted in the more precisely fitting test equip-
ment showed a greater degree of disturbance than did the other tests which
were conducted in test equipment which had not been repaired. The major dif-
ference in properties of these specimens is that they exhibited a very low
26

activity index. Apparently, the lower the activity index, the more susceptible
the material is to disturbance. It should be noted that "disturbance" as used
here does not necessarily mean a distortion or physical manipulation of the
material which would result in visible disturbance but is used to mean a re-
laxation of diagenetic bonds or intergranular stresses which would probably be
invisible to the eye and not physically obvious in the texture of the material.
It is recognized that some small disturbance may have occurred to the entire
sample in the field operation. This small disturbance, therefore, is re-
flected in all the test results.
50. Consolidation tests conducted on the noncemented Pepper shale
showed preconsolidation pressures only a fraction of that which could be in-
ferred from the geological history of the area. Although the tests were
loaded to only 64 tsf, it would be difficult to conceive of a change in the
slope of the e-log p curve which would result in higher indicated preconsoli-
dation pressure than had the specimens been loaded to ten times this load.
Consolidation tests conducted on the lightly cemented Del Rio shale indicated
preconsolidation pressures somewhat higher than those on the Pepper shale.
Direct shear tests
51. Direct shear tests showed a significant decrease in shear strength
with decrease in specimen thickness and a slight decrease in shear strength
with the slower rate of strain. The tests indicated that both friction angle
and cohesion were affected by specimen thickness, but only the cohesion com-
ponent was affected by the rate of strain.
52. The direct shear test on the high activity Upper Pepper zone showed
a higher shear strength than did comparable tests on the low activity Upper
Pepper zone.
53. The maximum past pressure for the Pepper shale estimated from the
direct shear tests is several times the amount which could be determined from
the consolidation test results.
Triaxial compression tests
54. Based on analysis of triaxial compression test results, a signifi-
cant change in the state of the material is suggested by the changes in pore
water stresses from in situ to laboratory conditions.
Recommendations
55. Recommendations are as follows:
27

4. high temperatures should not be used in testing specimens con-Lining the mineral montmorillonite. This would include testsrplatel to moisturp content, Atterberg limits, grain-size anal-ysis, and apparent specific gravity. There are sufficient data4n existing literature to support these recommendations, andthe tests conducted for this investigation merely offer furthersupport.
b. Additional tests should be conducted to investigate the ap-pareat relation of activity index and sample disturbance inhighly overconsolidated clays.
c. Investigations should be conducted to determine the expansionpressures exhibited by clay shales, especially those containingmontmorillonite. This appears to be one of the more elusiveproperties of the materials and one which has a profound effecton consolidation and strength test results. The consolidationtests show successively larger expansion pressure for increas-
ing thicker specimens. The triaxial compression tests indicatehigh suction pressures. These two inconsistencies have notbeen resolved.
d. Specimens no thinner than 1.0 in. should be used for directshear tests on clay shales. The across edge failures demon-strated by many of the thinner specimens cast considerabledoubt on the validity of these tests. It is recommended thatother types of shear tests (torsional or plane strain) be con-ducted on similar material so that the size and shape of thefailure plane can be related to the indicated unit shearing
resistance.
e. The use of a nonpolar fluid should be investigated to makedrill mud when drilling in potentially expansive soils. Also,the drill mud should be made by mixing natural material fromthe shale with a nonpolar fluid rather than a commercialproduct.
28

PART II: COMMENTS ON LABORATORY TESTING
CHAPTER 1: INTRODUCTION
56. Materials used for the investigation consisted of three clay sha,-
from the Waco Dam area. The materials are identified as (a) Upper Pepper.
(b) Lower Pepper, and (c) Del Rio shales. The materials are described geo-
logically in the following paragraphs.
Pepper Shale
57. The Pepper is a soft, noncalcareous, thin- to medium-bedded, tos-
siliferous, fissile, black, compaction shale with occasional nodular claystonc
seams, siltstone seams, and sandy seams throughout. It slakes readiiy upon ex-
posure. Although the Pepper shale is not geologically subdivided, test results
show a distinct difference in the upper and lower portions of the materials.
Del Rio Shale
58. The Del Rio is a soft, calcareous, medium- to thick-bedded, fos-
siliferous, nonfissile, medium gray to greenish gray, clay shale with one thin
bentonite seam near the top. It contains occasional marly, highly caiareous
zones and argillaceous limestone seams; occasional thin, disclike po ri, de-
veloped clay-ironstone concretions near the base; and occasional ttiin, softer,
dark gray to clay shale seams throughout.
59. The testing consisted of classification, consoliddt1i'n, di-ect tri-
axial compression shear, and triaxial compression tests. A-l spet~meits for
consolidation, direct shear, and triaxial compressic te!tir, were U 'nird in
the laboratory moist room, which is kept at high humidit.y bv cot,_h.y v operat-
ing spray nozzles and an air-conditioning unit. During worx on t, ,.v shale
materials, the room was kept closed off from the rest ut the laboi,,orv, and
no samples were opened nor specimens prepared when the me~isIred rei.L ve
humidity was below 90 percent. Trimming tools were those ordinarily used for
soils materials, such as, knives of various kinds and straightedges. Speci-
mens were trimmed directly into the test containers and were never pusied from
a cutting ring into the testing device. All moisture contert w!e obtained
29

from specimens dried at approximately 1050 C temperatures in a forced-draft
type oven.
60. Mineralogical composition of the three materials was as follows:
Composition, Percent by Weight
Upper Pepper Lower Pepper Del Rio
Montmorillonite 30-50 25-30 15
Illite 3-10 10-25 20
Kaolinite 20-25 25-30 15
Calcite 0 0 20
Quartz 15 10-15 20
30

CHAPTER 2: IDENTIFICATION TESTS
Phase 1
61. Grain-size analysis specimens were oven-dried and 50-g portions
were slaked for a minimum period of 24 hr. None of the materials slaked com-
pletely, and dispersion was accomplished with a blender. The specimens were
worked into standard hydrometer jars. Ten millilitres of a stock solution
(41 g/0) of Calgon were added to prevent flocculation. Hydrometer readings
were taken 1, 5, 30, and 120 min, and 24 hr after shaking and setting. Test
results are shown in Plates Al through A6.*
62. Atterberg limits specimens were covered with distilled water for at
least 24 hr, processed in the blender, and washed through a No. 40 screen.
Excess water was removed by the use of plaster of paris bowls. Liquid limits
were obtained by the simplified (one-point) method. Plate A6 shows the rela-
tionship between the liquid limits and plasticity indices. Three tests were
conducted on material after oven-drying; it is noted that the Upper Pepper
specimen showed an increased value for liquid limit after drying, with the
plastic limit remaining unchanged. The effect of drying upon the Atterberg
limits of montmorillonite clays has been described by Lambe (1951) as
unpredictable.
Phase 2
63. Additional identification tests were conducted on the Upper Pepper
shale. The results shown in Plates A7 through A14 were obtained on material
which had been oven-dried prior to testing with the curves adjusted to show no
more than 100 percent of any size particles. The deflocculant used in these
tests was "Calgon," a buffered sodium hexametaphosphate with other phosphates
in various amounts. Plate A14 shows the effect of oven-drying on grain size.
The reduction of grain size is thought to be the effect of reducing the basal
spacing of the montmorillonite particles upon drying. Also shown in Plate A14
is the effect of different manual-recommended deflocculants. There was no
* Plates referred to in Part II have been microfilmed and are included in
Appendix A.
31 j

notable difference in test values when using either Calgon, sodium tripoly-
phosphate, or sodium hexametaphosphate.
64. Additional Atterberg limits tests were conducted, using distilled
water and natural ground water in preparing the samples. As before, the speci-
mens were not oven-dried prior to testing. The liquid limit values obtained
using the ground water as the preparation fluid showed values ranging from
0 to 5 percent greater than the values obtained by using distilled water as
the preparation fluid.
65. The ground water was obtained from wells drilled into the Pepper
shale formation. A comparison of the chemical analyses of the ground water
with Dallas tap water is shown below.
Ground-water Tap-water
Water Analysis Test Results, ppm Results, ppm
Total solids 1275 170
Dissolved solids 1275 170
Calcium, as Ca 0.1 23
Magnesium, as Mg 2.7 4.6
Sodium and Potassium, as Na 553 27
Sulfates, as SO4 0.0 44
Chlorides, as C1 54 30
Carbonates, as CO3 108 14
Bicarbonates, as HCO3 1115 10
Nitrates, as NO3 0.3 4.0
Alkalinity (phenolphthelein), as CaCO 90 12(methyl-orange), as CaCO 3 1094 32
Iron, as Fe (total) 0.04 0.01
Iron, as Fe (dissolved) 0.01 0.01
Silica, as SiO 2 14 6.2
Fluoride, as F 9.5 0.60
Manganese, as Mn (total) 0.00 0.00
Manganese, as Mn 0.00 0.00
Total hardness, as CaCO3 16 76
Carbonate hardness, as CaCO3 16 32
Noncarbonate hardness, as CaCO3 0 44
Free carbon dioxide, as CO2 16 0.00
(Continued)
32

Ground-water Tap-waterWater Analysis Test Results, ppm Results, ppm
Resistivity, ohm/cm 3 , at 250 C 660 3486
Dissolved solids, as NaC1 (by conductance) 700 137
pH value 8.2 9.6Specific gravity at 600 F (by pycnometer) 1.001 1.000
(by hydrometer) 0.999 0.997
Computations of a hypothetical nature indicate that the chief mineral compound
present in the ground water is sodium carbonate or bicarbonate; in tap water
calcium carbonate, sodium chloride, and sodium or calcium sulphate are present
in nearly equal amounts.
33

CHAPTER 3: CONSOLIDATION TESTS
Phase I
Procedure
66. Controlled-expansion consolidation tests were conducted on speci-
mens of 1/4, 3/8, 1/2, and 1 in. nominal thickness. The actual initial thick-
ness of each specimen was determined by 0.001-in. dial gage measurements at
four points near the circumference and at a center point. The thickness of a
given specimen did not vary more than plus or minus 0.001 in. from point to
point. Wetted filter papers were placed over each face of a specimen and the
consolidometer assembly completed, with saturated porous stones above and
below the specimen.
67. The consolidometer was placed in the loading device. A 0.2-tsf
pressure was applied and the specimen inundated with de-aired distilled water.
Expansion was controlled by the addition of pressure in increments of 0.25 tsf.
The total pressure required to contain expansion is shown on the applicable
Consolidation Test Report sheets.
68. The loading schedule was 0.25, 0.5, 1.0, 2.0, 4.0, 8.0, 16.0, 32.0,
64.0, 16.0, 4.0, and 0.1 tsf, with loading beginning at the pressure next
above the expansion pressure. The Upper Pepper (Plates A15 through A27) and
the Del Rio (Plates A48 through A62) specimens were loaded at 24-hr intervals,
except on weekends. Not all of the latter, however, completed rebound under
reduced pressure in 24 hr, and rebound loads remained unchanged for periods up
to 7 days. The third clay shale, the Lower Pepper (Plates A28 through A47)
did not reach equilibrium in 24 hr under any of the applied pressure incre-
ments, and the rate of load application was determined by the shapes of the
time-consolidation curves. The time interval between load increments was from
3 to 6 days.
69. Southwestern Division laboratory loading devices are not designed
to permit rebound at zero load, and the final rebound occurred under pressure
of 0.1 tsf. When time curves indicated completion of rebound, the water jacket
was drained, the 0.l-tsf pressure was removed, and the consolidometer was dis-
assembled. Free water was carefully blotted from the specimen ring. Material
which had extruded around the edge of the upper porous stone was removed and
placed in a moisture tin. The thickness of the specimen was then measured, as
34

described above. The specimen was pressed from the ring and surface material
scraped away and placed in a moisture tin for oven-drying. The remainder of
the specimen was placed in another tin. The water content determined from the
latter was later used as the "final" water content.
Computations
70. Void ratios corresponding to the various pressures were computed
from the dial readings. These values are plotted on the Consolidation Test
Report forms. It is noted that two curves appear on most of the void ratio-
log pressure plots, one a solid line and the other line broken. These curves
represent the void ratios attained by a specimen 24 hr after load application
and at the end of the total time under that pressure. Curves for the Del Rio
and Upper Pepper tests indicate no appreciable differences in the 24-hr total
curves except in the rebound lag of the Upper Pepper 1-in. test, where side
friction is believed to have been large. The Lower Pepper, however, presents
a different picture, particularly for the 1-in. specimen, where substantial
amounts of consolidation and rebound occurred after the first 24 hr.
71. Following the consolidation test data are Plates A63 through A68,
which show the variation in unit deformation with specimen thickness. One of
each pair of plates corresponds to the 24-hr e-log p curves; the second plates
correspond to the total time e-log p curves. Unit compression is shown to in-
crease greatly with decrease in initial specimen thickness, as shown in
Plates A69 through A71.
Analysis
72. The variations in unit deformation were considered to have several
possible causes, among them the error resulting from the extraction of mate-
rial from the ring, disturbance of specimens caused by trimming, or some form
of structural breakdown.
73. Initial study did not support extrusion as the total explanation
because the quantities of extruded material bore no constant relation to
specimen thickness, as indicated by the following tabulation.
Extruded MaterialNominal Initial Total Grams/Inch
Material Thickness, in. Grams of Thickness
Upper Pepper 1/4 1.4 6.1
3/4 2.4 5.7
1/2 3.7 7.51 3.1 3.1(Continued)
35p'

Extruded MaterialNominal Initial Total Grams/Inch
Material Thickness, in. Grams of Thickness
Lower Pepper 1/4 3.9 17.13/8 4.7 12.81/2 5.4 10.91 22.7 22.7
Del Rio 1/4 1.6 7.23/8 1.4 3.7
1/2 ....
1 3.3 3.3
74. An effort was made to evaluate trimming disturbance, using the
methods of Van Zelst (1948). The shapes of the e-log p curves did not indi-
cate that this could be accomplished, but a number of trials were made. No
reasonable assumptions could be made, however, which would result in credible
results.
75. A test devised to evaluate the possibility of structural failure
under load was not successful. A cylindrical specimen having a diameter of
about 2.5 in. and a height of 1.5 in. was placed in a metal chamber similar to
a triaxial chamber, but with provisions for measuring internal pore pressure
and volume change. Chamber pressures exceeding 30 tsf were applied, with very
considerable pore pressure lags, despite the likelihood of the specimen having
been nearly saturated. The maximum pore pressure measured was equal to about
one-half the chamber pressure; as time continued, however, pore pressure fell
off consistently to a value of about one third of the chamber pressure. The
occurrences described occurred over a period of several months. Volume change
measurements indicated a constant though slight decrease in specimen volume.
76. Plates A69 through A71 show the relationship between specimen thick-
ness and deformation in another manner. If specimen thickness had no effect
on unit compression, the curves of these three plates would be horizontal
lines. If the e-log p curves of Upper Pepper shale are re-examined, it will
be noted that they are typically shaped up to a point: each curve is initially
more or less horizontal, then bends downward into its virgin compression curve.
However, the 3/4- and 1/2-in. curves bend more steeply downward after the
32-tsf increment, and the 1/4-in. curve bends after the 16-tsf increment. If
these sudden increases in deformation are attributed to extrusion and the
earlier straight-line portion of each curve is extended to 64 tsf, deformation
versus specimen thickness curves for the Upper Pepper become as shown by the
36

dashed lines. The remaining curvature in all the curves is attributable to
minor amounts of extrusion or to specimen disturbance.
77. Additional weight is given the extrusion hypothesis by final satura-
tion computations. Using thickness changes as measured by test dials, Sf
values range as high as 130 percent. When, however, final saturations were
computed using the directly measured final thicknesses, values ranging from 91
to 107 percent as reported on the individual Test Report forms were obtained.
An effort was made early in the study to correct final volumes by the amount
of extruded material; since reasonable Sf values were not obtained, it must
be assumed that only a portion of the extruded material was recovered.
Phase 2
78. Additional consolidation tests were conducted on samples of Upper
Pepper shale during Phase 2. Four series of tests were conducted as follows:
a. Series 1: 1/4-, 3/8-, and 1/2-in. thick specimens; inundation
fluid was ground water.
b. Series 2: 1/4-, 3/8-, and 1/2-in. thick specimens; inundationfluid was de-aired distilled water.
c. Series 3: 1/4- and i-in. specimens; 1/4-in. loads changed
daily; 1-in. loads changed every 13 to 14 days.
d. Series 4: 1-in. specimens; Teflon-lined ring and greased ring.
79. Results of consolidation tests are presented graphically in
Plates A72 through A142.
a. Series 1: Plates A72 through A79 show standard time plots. Nocorrections have been made for apparatus deformations. The samedata are presented in Plates A96 through A106 with certain ad-justments to permit direct comparison of unit deformation withthickness. First, it was assumed that all the deformation oc-curring in the first 0.1 min after loading is apparatus deforma-tion. Also, the time scale for the various thickness is com-
pacted from the theoretical relationship t2/t1 = (H2 )2 /(H1 )2
In Plate A137 are shown pressure-deformation curves. The left-hand plot is a standard plot, based on the adjusted time curvesshown in Plates A96 through A136. The plots shown on theright-hand side of the plate are curves based on primary con-solidation only.
b. Series 2: Plates A80 through A87 show the standard time plots.These data are presented in Plates A108 through A119 with theadjustments noted above. The pressure-deformation curves areshown in Plate A138; the right-hand set of curves are based onprimary consolidation alone.
37

c. Series 3: Plates A88 through A91 show the standard time plots.These data are presented in Plates A120 through A130 with theadjustments noted above. The pressure-deformation curves areshown in Plate A139; the right-hand set of curves is based on
primary consolidation alone.
d. Series 4: Plates A92 through A95 show the standard time plots.These data are presented in Plates A131 through A136 with theadjustments noted above. The pressure-deformation curves areshown in Plate A140; the right-hand set of curves is based on
primary consolidation alone.
80. Plates A137 and A138 indicate the major cause of the offset pres-
sure deformation curves (left-hand plots) to be the result of the larger ef-
fect of secondary compression in the 1/4-in. specimens, etc. Series 3 tests
were conducted to check this. Actual initial specimen thicknesses of the
Series 3 specimens were 0.275 and 1.000 in.; the ratio of times required for
equivalent U values is theoretically (1.000) 2/(0.275)2 = 13.2 . The thinner
specimen was therefore loaded daily and the thicker specimen every 13 or
14 days. Series 4 tests were conducted for the purpose of checking side fric-
tion effects. The grease used contained molybdenum disulfide (Bansbo 1960).
In plotting the primary-only pressure-deformation curves, it was assumed that,
in cases where the time plot did not fit the theoretical pattern (i.e., sec-
ondary compression masked out the primary, as in Plate A36), primary was so
small as to be insignificant, and was called zero.
81. Omitting Series 3 tests, which do not match the other tests in sev-
eral respects, the following observations are made:
a. C has a maximum value of 0.0015 to 0.0018 at pressures to2.0 tsf and an average value near 0.0025 at pressures of4.0 tsf and above, indicating the maximum past pressure isbetween 2.0 and 4.0 tsf.
b. Values of t5 0 for the 1/4-, 3/8-, and 1/2-in. specimens
of Series I and 2 are similar.
c. Values of t50 for 1-in. specimens of Series 1, 2, and 4 arein good agreement.
d. Values of t for 1-in. specimens are consistently lower than
for the 1/4-, 3/8-, and 1/2-in. specimens, with the differenceincreasing with pressure to 8.0 and 16.0 tsf, then decreasingagain:
38
. .. . . ..4i , . . I I II I I i , .. . I "

t 5 0 , 'Din
Pressure Average Averagetsf 1/4, 3/8, 1/2 in. 1 in.
1.0 9 --
2.0 8 64.0 20 168.0 28 15
16.0 20 932.0 14 964.0 12 9
82. The offset between pressure-deformation curves still apparent after
adjustment for secondary compression is a result of the difference in expan-
sion pressure. Expansion pressures appear to vary with thickness as shown
below:
Expansion Pressure, tsfSeries 1/4 in. 3/8 in. 1/2 in. I in.
1 0.25 0.5 0.75 1.02 0.25 0.5 0.75 1.253 0.75 1.04 0.75 (Teflon)4 1.0 (Greased)
Plate A139 illustrates this point. The 1.0-tsf pressure increment gave a time
curve in the 1/4-in. test permitting definition of primary consolidation of
about 0.012 in. The same load on the 1-in. specimen, however, resulted only
in secondary, and primary consolidation was zero. The two curves remain sepa-
rated by about this distance over their full lengths. It may be that applica-
tion of the methods of Hansen (1961), Wahls (1962), or Crawford (1964) may
permit some less restrictive assumption as to what constitutes primary and
secondary compression, but all of these methods have not yet been investigated.
The differences in expansion pressure defy explanation but could reflect ap-
paratus inadequacies.
83. Plate A141 shows, for convenience and as a matter of interest, the
magnitude of primary compression corresponding to individual loads. Plate A142
is a summation of pressure-deformation (primary only) curves for all of the
I-in. thick specimens. Only the Series 3 test is appreciably different. There
is no readily available explanation for the results of Series 3 tests, which
have Ca values as high as 0.0051 and t50 values to 50 min. Apparently the
material itself is different, but the difference is unknown.
84. The initial moisture contents for all specimens averaged
39

21.3 percent with a range of plus or minus 0.2 percent. The initial dry den-
sity averaged 108 pcf with an average of 0.5 pcf and initial saturation aver-
aged 100 percent with a range of plus or minus 2 percent. Final saturation
values were near 100 percent for the thicker specimens and as high as 108 to
109 percent for the 1/4-in. specimens. For all Sf values to be 100, all
pressure-deformation curves should match the curve for the 1-in. specimens.
40

CHAPTER 4: DIRECT SHEAR TESTS
Program
85. Twelve sets of 3- by 3-in. specimens were trimmed from each of the
materials. A set consisted of three specimens to be sheared under normal
stresses of 1.5, 3.0, and 6.0 tsf. Thicknesses and times to failure for the
twelve sets are tabulated below.
Specimen Desired TimeNet Thickness, in. to Failure
1 1/4 (nominal) 6 min2 6 hr3 6 days
4 3/8 (nominal) 6 min5 6 hr6 6 days
7 1/2 (nominal) 6 min8 6 hr9 6 days
10 1 (nominal) 6 min11 6 hr12 6 days
Actual specimen thicknesses did not vary from the desired thicknesses by more
than 0.004 in., except for the 1-in. specimens, which measured from 1.000 to
1.020 in. Because the rate of shear required to effect failure in the listed
times could not be accurately estimated, the tests corresponding to 6-min,
6-hr, and 6-day failure are hereinafter referred to as fast, medium, and slow
tests. In some cases more than one test was conducted.
Procedures
86. Test specimens were trimmed into "cutters" which are split horizon-
tally at the midplane. The cutter with the specimen is placed directly into
the shear box. The plane along which shear stress is applied coincides with
the plane between halves of the cutter. These features are shown on the shear
box diagram. The specimens were then inundated with tap water and permitted
to consolidate under 1.5-tsf normal pressure for at least 16 hr, after which
the normal pressures on two of the three specimens of a set were increased to
3.0 and 6.0 tsf.
41

87. After 24 hr of consolidation under the full load, the upper half of
the shear box, hereafter referred to as the yoke, was raised to a position
about 0.05 in. above the lower half of the box. The yoke was clasped to the
piston by means of machine screws. The two halves of the cutter remained in
contact along lips having about 0.1-in. width.
88. Shear was begun, with the following nominal rates having been
selected:
Fast tests 0.006 in./min
Medium tests 0.00008 in./min
Slow tests 0.000004 in./min
The rates actually achieved varied somewhat from the above, and are shown on
the individual Test Report forms. The rates reported on these plates are aver-
aged values from:
Rate (Final horizontal dial reading) - (initial horizontal dial reading)Total elapsed time to failure
The rate of shear was closely controlled during the working day by manual ad-
justment of variable speed reducers ("Zero-Max") but tended to drift during
the night and over weekends, resulting in deviations of considerable magnitude
in some instances.
89. A test was discontinued when failure had occurred. Failure was con-
sidered to have occurred either when a continuing drop in shear resistance was
noted or when the shear resistance remained at a constant level for a long pe-
riod of time. Water contents were taken from the centers of specimens after
test.
Test Results
90. Test data are shown on Direct Shear Test Report forms (Plates A143
through A181). Several factors prevented the preparation of all of the speci-
mens of a given set at the same time and, in some cases, it was necessary to
use portions of several samples to complete a set. The samples used and their
depths are shown across the bottoms of the Test Report forms.
91. Failure sketches are shown in the upper right-hand blocks of the
Direct Shear Test Report forms. The mode of failure in the thinner specimens
42

was difficult to distinguish in most instances. Where failure across edges
was indicated, the adjacent material was usually soft and mushy and the frac-
tures ill-defined. The same condition or mushiness existed around the entire
periphery of many of the specimens. It is also noted that the pictured dis-
placement between upper and lower halves of the specimens is not a scale repre-
sentation; in some instances the apparent movement was extremely small, result-
ing from compression rather than shear. A point of interest is the tendency
of the 1-in. specimens to fail along horizontal planes, as against the across-
corner failures of the thinner specimens. Close examination of the 1/2-, 3/8-,
and 1/4-in. specimens showed a trend toward more steeply inclined fractures as
thickness decreased, but the mushiness of the failure zones made it impossible
to obtain measurements sufficiently accurate to verify this completely.
Discussion
92. While the investigation herein reported was intended chiefly to in-
vestigate the effects of varying specimen thickness and varying rate of shear,
other variables might be expected to affect strength properties. Among these
variables are density, water content, and plasticity.
93. Density and water content were found to vary as follows:
Upper Lower
Pepper Pepper Del Rio
Number of specimens tested 45 43 41
Average initial dry density, pcf 109 100 112
Number of specimens not within2 pcf of average 5 15 18
Average initial water content,
percent 20 26 18
Number of specimens not within
1 percent of average 3 18 10
The density and water content of the Upper Pepper specimens are relatively con-
sistent from sample to sample.
94. Plasticity characteristics are shown in the following tabulation of
liquid limits:
43
I L ... .. , , ...... - , lii I I I II I Ii II

Upper Lower
P Pepper Del Rio
Number of tests 5 7 6
Range of values 72-82 54-103 56-74
Average value 76 83 68
Number of tests not within5 percent of average 1 5 4
The Upper Pepper is again shown to be the more uniform material.
44

CHAPTER 5: SHEAR STRENGTH SUMMARY
Phase 1
95. In Plates A182 through A184 are plots summarizing all the strengths
obtained in each test series with the shear strength scale doubled to spread
the points. Comparison of individual test strengths suggests that shear
strength depends on both specimen thickness and rate of shear. Straight-line
envelopes, if plotted between all similar points, are found to be predominantly
convex upward and to the left in shape. If it is assumed that strength in-
creases with normal stress as in ordinary soils, several points not meeting
this requirement may be disregarded and the number of possible envelopes re-
duced. When this is done, a trend toward parallelness of envelopes is dis-
tinguishable. Envelopes which demonstrate this feature particularly well are
shown with solid lines for the Upper Pepper and Del Rio shales. The dashed
lines for Lower Pepper are discussed in a later paragraph.
96. In Plates A185 through A193 are plots showing the relationship be-
tween shear strength and time to failure. As might be expected from examina-
tion of the other data, the curves are erratic and do not lend themselves to
other than arbitrary interpretation. The figures adjacent to symbols are
liquid limits, and indicate that no statement of relationship between strength
and liquid limit is justified by the data. The only one of the three mate-
rials in which a wide range of plasticity exists is the Lower Pepper, and a
question exists as to whether liquid limit specimens were representative of
the materials at the specific elevations at which the various direct shear
specimens were taken.
97. Because of the high degree of parallelism exhibited by some of the
straight-line envelopes shown on the summary plates, a working assumption was
made that all the envelopes for a given material should be more or less paral-
lel regardless of specimen thickness, rate of shear, or mode of failure. Fric-
tional components of strengths are thus assumed to vary only slightly. Be-
cause of the uniformity of the Upper Pepper shale, these tests were selected
for analysis according to this hypothesis. As noted earlier, the solid lines
shown in Plate A194 are drawn between actual test points. The dashed lines
are interpolated through at least one actual test point. The resulting family
45
kO

of curves indicates generally parallel envelopes with slopes slightly increas-
ing with specimen thickness.
98. Application of the interpolated values for the Upper Pepper shale
to a shear strength versus log time plot is shown in Plate A194. Shear
strength is shown to be a straight-line function of the logarithm of time to
failure, over the range of times and pressures used. The single departure
from this rule occurs in the curves representing the 1-in.-thick specimens.
These curves bend downward between the symbols representing the medium and
slow tests, shown respectively by open triangles and squares. The strengths
used for the slow tests were defined by a dashed envelope, but if the interpo-
lated envelope had been drawn through the unused test point at 1.5-tsf normal
and 2.02-tsf shear stress, the resulting strength-time relationships would be
represented by the dashed lines.
99. The spacing of the curves on this plate might be expected to
follow some mathematical formula, and visual examination suggests that the
spacing may be logarithmic. Accordingly, Plate A195 shows strengths at 10 min
and 1,000 min plotted against the logarithm of specimen thickness.
100. The data for the Lower Pepper and Del Rio shales do not lend them-
selves to similar analyses because of the lack of uniformity between test
specimens. Because this report is intended to present and discuss only the
results of the tests conducted specifically under ES-529, the results of
earlier tests of similar materials have not been considered, and a detailed
study of the effects of such variables as plasticity, water content, and den-
sity has not been undertaken.
Phase 2
101. The direct shear tests conducted for Phase 2 of this investigation
were conducted in much the same way as those in Phase 1. The major difference
was in the use of natural ground water for the inundating fluid; whereas, in
Plate 1 tests, tap water was used. In Phase 2 some of the specimens were sub-
jected to normal loads of 12.0 and 18.0 tsf. The initial moisture content of
the test specimens averaged 21.5 percent with a range of plus or minus 0.3 per-
cent, densities averaged 106.9 pcf with a range of 1.0 pcf, and the initial
saturation averaged 98 percent with a range of 2.0 percent.
102. Plate A202 shows results from Tests 1 through 9 at 1.5, 3.0, and
46

6.0 tsf normal pressures. The rate of shear was 0.0001 to 0.0002 in./min,
thickness was I in., and the failure planes were horizontal. Shear stress was
applied at the end of the specimen. The U. S. Army Engineer Waterways Experi-
ment Station's view is that this invalidates the test results because the
shear stress should properly be transmitted across the whole area through the
porous stones. In the same way, strengths of the thin specimens, which failed
across the corners, may lack significance because of slipping between specimen
surfaces and porous stones, resulting again in stress concentration at the
ends of the specimens. The different strengths for the different thicknesses
may thus be functions of the length of failure path across corners.
103. Plate A203 presents results from tests 10 through 14 at 12.0 and
18.0 tsf normal pressures. For tests 10 and 11, at 18 tsf, the rate of shear
was 0.001 to 0.002 in./min. For tests 12 and 13, at 18 tsf, and test 14, at
12 tsf, the rate of shear was 0.000004 in./min. Thickness was 1 in. and the
failure planes were horizontal. The same remarks as in paragraph 102 also
apply.
104. Plate A204 presents shear strength envelopes for all 14 tests
Envelopes of tests 1 through 9 were below original envelopes, depicting a
similar strength angle. Envelopes through an average of 18.0-tsf strength and
the origin are parallel to other envelopes.
105. It is of note that a single, smooth, curved envelope can be drawn
through all the points up to normal pressure of approximately 14 tsf. This
would suggest that all these points lie below the prestress effective pressure
(U. S. Army Engineer Waterways Experiment Station 1961) or, in effect, the
effective maximum past pressure is equal to or slightly greater than 14 tsf.
This value approaches the magnitude of the load which is thought to have been
applied to the Pepper shale in geologic history, but is strongly contradictory
to the values obtained from consolidation testing. The values, derived from
consolidation tests, were obtained from tests loaded up to 64.0 tsf and ranged
from 2 to 5 tsf.
47

CHAPTER 6: DIRECT SHEAR TESTING EQUIPMENT
106. Early in the testing program it was decided to mount additional
dials above the yoke to check tilting of the box during shear. The dial man-
agement is shown in Plate A196. Two extra 0.0001-in. dials were mounted and
movement recorded during about one-fourth of the tests. Computations of ver-
tical movement of the front and rear edges of the pistons were made using the
formulas shown on the plate. Plates A197 through A199 show the computed move-
ment at the front, middle, and center of the piston for three typical tests of
3/8-in. specimens. Plate A200 presents similar data for a l-in.-thick speci-
men. The four plots are discussed separately as follows.
107. Plate A197 shows the tipping of the piston during Test 3
(Plate A146). The front edge of the piston is indicated to have moved down-
ward initially while the rear edge moved upward. At the horizontal deforma-
tion approximately corresponding to failure, movement at both edges had vir-
tually ceased, but resumed upon failure. The dial located at the center of
the piston indicated a net downward movement; the computed movement at the
center, however, was upward.
108. Plate A198 shows the tipping of the piston during Test 1
(Plate A160). The initial movement at the front edge of the piston was ap-
parently downward and, at the rear, upward. Near failure, the curves reversed
direction and, at the end of the test, the front edge had seemingly risen con-
siderable distance, while the rear edge had returned to its initial elevation.
The measured upward movement at the center of the piston was less than that
actually measured.
109. Plate A199 shows the tipping of the piston during Test 3
(Plate A148). Movement at the front edge was upward; at the rear edge, move-
ment was downward. Both actual and computed movements at the center of the
piston were downward, with the actual movement greater than the computed.
110. Plate A200 shows the tipping of the yoke during Test I (Plate A152).
All tests of 1-in.-thick specimens were conducted slightly differently from
those of the thinner specimens. The design of the Southwestern Division direct
shear boxes is such that the yoke cannot be secured to the piston by the end
screws when the specimen thickness exceeds about 0.75 in. The yoke was there-
fore suspended from the piston by three hangers bearing on the surface of the
piston, and the movement of the yoke was thus semi-independent of the piston.
48
I.

The curves plotted on Plate A200 represent the movement of the yoke at points
corresponding to the front and rear edges of the piston. Both front and rear
moved upward during the test. The upper curve, representing the front of the
yoke, rose sharply at the beginning, flattened out at a point corresponding to
failure, then began an up-and-down cycling in which the crests and troughs
were approximately repeated. The lower curve showed the same cyclic movement,
but is offset about one-fourth of a cycle and had a much decreased magnitude.
The movement at the rear is undoubtedly restricted by friction at the contact
between the rear of the piston and the yoke.
Ill. The shapes of the curves of the above plates are dependent upon
the mode of failure, and the pivot point concept utilized in obtaining values
for Af and Ar (change in height at front and rear edges of piston, respec-
tively) is not totally valid, particularly after failure. Nonetheless, the
curves demonstrate that tipping of the yoke and piston occur before as well
as after failure.
112. The tipping of the yoke is caused by the action of two systems of
couples which exist in the devices. These are shown in Plate A201. These
couples have little effect in the usual direct shear test, because the force
is relatively small and because couple 1 is relieved in some degree by plastic
deformation of the specimen. In a brittle, high-strength material, however,
both couples can be of considerable magnitude. Plate A200 may be used to
demonstrate that the action of each couple brings about an answering action
from the other, so that a self-perpetuating system of ups and downs exists.
Two possibilities are raised by the recognition of yoke tipping: (a) the varia-
tion in normal stress distribution may affect failure, and (b) the edges of
the specimens may be broken off by the rotational movement of the yoke.
49

CHAPTER 7: TRIAXIAL COMPRESSION TESTS
113. Unconsolidated-undrained triaxial compression tests (Plates A205
through A236) were conducted during the program's second phase. Both quick
shear and slow shear tests were conducted. The quick shear is identified as
Qn P the slow as Q ss Test procedures were further modified so that the nor-
mally horizontal plane was inclined at 60 and 45 deg from the horizontal. The
specimens were placed in the triaxial chamber and the indicated chamber pres-
sure was applied. Induced pore water pressure was allowed to stabilize before
the shear test. The Q tests were conducted by strain control at the raten
of 0.001 in./min. The Q tests were conducted by stress control, at thess
rate of 0.1 tsf/day or less.
114. Results of tests are summarized as follows:
Q (60 deg) 2.4± tsf
Qn (45 deg) 1.8± tsf
Qn (45 deg) 1.0± tsf (along visible joint)1.8± tsf (secondary failure)
Qss (60 deg) 1.8± tsf
Qss (45 deg) 1.0± tsf
It is noted that the Qn tests exhibit greater strength than the Qss tests
and the Qn tests exhibit a much more brittle type stress-strain curve.
Physical properties of the test specimens are shown below:
Initial water contents, all tests = 21.0 ± 0.31 percent
Initial dry densities, all tests, exceptQn (45 deg with visible joint) = 108.2 ± 0.7 pcf
Initial dry densities, Qn (45 degwith visible joint) = 107.2 ± 0.1 pcf
Initial saturation, all tests butQn (45 deg with visible joint) = 99 - 101 percent
Initial saturation, Qn (45 deg withvisible joint) = 97 percent
115. At the end of the earlier Qss tests, the chamber water smelled
strongly of hydrogen sulfide and the membrane and inside of the cifamber were
stained black. A test gave a pH value of 6.4 against the initial 9.6. A very
small amount of disinfectant was added to the chamber water on following tests,
resulting in the clearing up of this problem.
5o

BIBLIOGRAPHY
Bansbo. 1960. "Consolidation of Clay, with Special Reference to Influence ofVertical Sand Drains," Proceedings No. 18, Swedish Geotechnical Institute.
Bjerrum, L. 1967. "Progressive Failure in Slopes of Overconsolidated PlasticClay and Clay Shales," Journal of Soil Mechanics and Foundations Division,American Society of Civil Engineers, Vol 93, No. SM5.
Casagrande, A., and Hirschfeld, R. C. 1960. First Progress Report on Investi-gation of Stress-Deformation and Strength Characteristics of Compacted Clays,Soil Mechanics Series No. 74, Harvard University, Cambridge, Mass.
Casagrande, A., and Poulos, S. J. 1964. Fourth Progress Report on Investiga-tion of Stress-Deformation and Strength Characteristics of Compacted Clays,Soil Mechanics Series No. 74, Harvard University, Cambridge, Mass.
Crawford, C. B. 1964. "Interpretation of the Consolidation Test," Journal ofSoil Mechanics and Foundations Division, American Society of Civil Engineers,Vol 90, No. SM5, Proceedings Paper 4056.
Grim, R. E. 1953. Clay Mineralogy, McGraw-Hill, New York.
Hansen, B. 1961. "A Model Law for Simultaneous Primary and Secondary Consoli-dation," Proceedings of 5th International Conference on Soil Mechanics andFoundation Engineering, Vol 1, Paris.
Hvorslov, M. J. 1960. "Physical Components of the Shear Strength of SaturatedClays," Research Conference on Shear Strength of Cohesive Soils, Boulder, Colo.
Lambe, T. W. 1951. Soil Testing for Engineers, John Wiley & Sons, New York.
Means, R. E., and Parcher, J. V. 1963. Physical Properties of Soils,Charles E. Merrill Books, Columbus, Ohio.
Schmertmann, J. H. 1955. "The Undisturbed Consolidation Behavior of Clay,"Transactions, American Society of Civil Engineersl Vol 120, Paper No. 2775.
Seed, H. B., Woodward, R. J., and Lundgren, R. 1962. "Prediction of SwellingPotential for Compacted Clays," Journal of Soil Mechanics and FoundationsDivision, Vol 88, No. SM3.
. 1964. "Clay Mineralogical Aspects of the Atterberg Limits,"Journal of the Soil Mechanics and Foundations Division, American Society ofCivil Engineers, Vol 90, No. SM4.
Skempton, A. W. 1953. "The Colloidal 'Activity' of Clays," Proceedings ofthe 3rd International Conference of Soil Mechanics and Foundation Engineering,Vol 1, Switzerland.
Underwood, L. B. 1967. "Classification and Identification of Shales,"Journal of the Soil Mechanics and Foundation Division, American Society ofCivil Engineers, Vol 93, No. SM6.
51

U. S. Army Corps of Engineers. 1965. "Laboratory Soils Testing," EngineerManual EM 1110-2-1906, Washington, D. C.
U. S. Army Engineer District, Fort Worth. 1963. "Shear and ConsolidationTests on Foundation Material," Report on Embankment Slide and Reanalysis ofDesign (Waco Dam), Vol IV, Fort Worth, Tex.
U. S. Army Engineer Waterways Experiment Station. 1961. "Physical Componentsof the Shear Strength of Saturated Clays," Miscellaneous Paper 3-428, Vicks-burg, Miss.
Van Zelst, T. W. 1948. "An Investigation of the Factors Affecting LaboratoryConsolidation of Clays," Proceedings of 2nd International Conference on SoilsMechanics and Foundation Engineering, Vol III, Rotterdam.
Wahls, If. E. 1962. "Analysis of Primary and Secondary Consolidation,"Journal of the Soil Mechanics and Foundations Division, American Society ofCivil Engineers, Vol 88, No. SM6, Proceedings Paper 3373.
52

4,1C,
Ia.'
C)0 .o1 04
I' eri CD:j - - 0 - - -
0 1
010
Qc 14 c n. cc -- c, - 0m-c - c4
0ia
>Jw 0,
'D %0V
cc
co £I .4tI I cn 1 4)ccn r- c r ic c i o m - i mf T Lm m m m 'T I i I
ou K0jo<I 0
V c-4
-~G -.T LM .J t
C..! '-* 0 C.
-CI LI C!C
Ln %o 4, v. 10.%0 1. '.% CuT
c in Le nm mc m m m N4u~ 4cn r fn en en um
4, 1.1 in Lm .. m mm N
o j "o
IT 0 00 - 1 -
0-0
cu NN N N.'o44

0
u aA
4.10
-TL nL 0~~c tn -Tr It en An' (n en
5.-
4C
u \I,0 a 00 o c C\I '0 '0 -l)N .0N(10 )C \O % O NC
(12 4j 00
A 4 $
W 04 %0%00(ra, o 0 % I C,0 0 % ON %
- 4.1LMI I
ul 1d 4 Lns0 or . 0 \0 0 LM
00 % 0(% COOQC0 0% Go r- r0CJ~ lc-q 44
IA1 V -t'0 c4
1M4.Go 0% 40
\0 0 M 04 Q G.4II II II I I 141.. M
%00 N(NCOO% 0C*4r N N
ZI 4))
an100 m41 ( 4J.OO~ a 0 04 en 0 IwowJ -. m -c %t
2 -. I m
.4.4
(4 -S

Table 2
Water Analyses
Results*Tests Ground Water Tap Water
Total solids 1275 170
Dissolved solids 1274 "- " 170
Calcium, as Ca 2.1 23
Magnesium, as Mg 2.7 4.6
Sodium and Potassium, as Na (by difference) 553 27
Sulfates, as SO4 0.0 44
Chlorides, as C1 54 30
Carbonates, as CO3 108 14
Bicarbonates, as HCO3 1115 10
Nitrates, as NO3 0.3 4.0
Alkalinity (phenolphthalein), as CaCO 3 90 12(methyl-orange), as CaCO3 1094 32
Iron, as Fe (total) 0.04 0.01
Iron, as Fe (dissolved) 0.01 0.01
Silica, as SiO2 14 6.2
Fluoride, as F 9.5 0.60
Manganese, as Mn (total) 0.00 0.00
Manganese, as Mn (dissolved) 0.00 0.00
Total hardness, as CaCO3 16 76
Carbonate hardness, as CaCO3 16 32
Noncarbonate hardness, as CaCO3 0 44
Free carbon dioxide, as CO2 16 0.00
Resistivity, ohm/cm, at 250 C 660 3486
Dissolved solids, as NaCl (by conductance) 760 137
pH value 8.2 9.6
* All results are in parts per million (ppm) except the pH value.** Computations of a hypothetical nature indicate that the chief mineral com-
pound present in the ground water is sodium carbonate or bicarbonate; intap water calcium carbonate, sodium chloride, and sodium or calciumsulphate are present in nearly equal amounts.

1400 00I4,~C 0 CSt 0 0 4 0
go 00 .1 a, a, 0 .0 0 0
I) 4. ~ NO0NO
4- .9999
00 000000OO0 I O C'44 I 00 0
- - .. I..'N'C.? ~ ~ I. 0000
go .q -7 M' .N4
0000000
W' 000000, DO CO
00 000 14OONO0OODO O
0 0000 M 00
M .9 .99999 I
4,~~L 10 00 a 0 0.'0.0. (D~N'0 0 0 00.0 - 1''Z4OO C
4,~~c -..~ -- -
GN 00 0
0~~~C IT)00 0 0
0) 0 w.'0N' wN O 'a000000
44 N
2 o');-4 4 00000000.0~ ~~~ a, -4 N -. ' O 440 0 0 0
43 w w O ) NOO
0' 00 00
a) NO NO ---uaa
a~ ~ ~ N. N N4 N0 N:a0 uata 00000 0 a 40
N .4 u' a O d 'M ,0a00000
W 'A4 V- NOONC 8tO4co r rc
N C3. C" a ' ' '.,4. . . M aN N N NN L 0. 0000000l

Table 4
Direct Shear Tests
t Rate ofThickness Shear w. Id a tf ra of1 Strain Depth
in. Rate percent pcf tsf tsf min in./min ft
Upper Pepper, Boring 8A6C-445
0.25 Fast 20.0 108 1.5 0.86 16 0.005 55.4-56.220.6 105 3.0 1.05 6 0.003 55.4-56.219.7 108 6.0 1.87 6 0.001 55.4-56.2
Medium 20.1 108 1.5 0.71 20 0.0001 54.5-55.419.8 110 3.0 1.17 350 0.00007 54.5-55.420.2 109 6.0 1.73 310 0.00006 54.5-55.420.7 108 1.5 0.62 95 0.00007 50.0-50.9
Slow 20.0 110 1.5 0.62 3,200 0.000004 50.9-51.820.6 108 3.0 0.97 3,100 0.000007 50.9-51.820.5 109 6.0 1.77 1,500 0.000003 52.7-53.3
0.375 Fast 20.4 109 15 1.17 6 0.003 53.5-54.520.6 108 3.0 1.76 9 0.002 53.5-54.520.2 108 6.0 2.02 13 0.003 53.5-54.5
Medium 19.0 110 1.5 1.01 700 0.00006 54.5-55.420.0 108 3.0 1.46 600 0.00007 54.5-55.420.2 108 6.0 2.06 112 0.0002 54.5-55.419.8 111 6.0 1.57 240 0.00008 50.0-50.9
Slow 20.7 109 1.5 0.89 2,200 0.000004 53.5-54.5 p
20.1 109 3.0 0.84 1,400 0.000004 53.5-54.520.0 108 6.0 1.81 4,400 0.000004 53.5-54.520.3 108 3.0 1.34 14,300 0.000001 53.5-54.5
0.5 Fast 20.2 109 1.5 1.43 15 0.006 54.5-55.420.1 109 3.0 2.78 15 0.003 54.5-55.420.1 109 6.0 2.79 12 0.003 54.5-55.418.9 112 3.0 1.98 5 0.004 50.0-50.9
Medium 20.1 109 1.5 1.05 460 0.00007 53.5-54.520.6 109 3.0 1.98 900 0.00008 53.5-54.520.6 109 6.0 2.72 300 0.00008 53.5-54.5
Slow 16.7 115 1.5 1.35 10,000 0.000004 50.9-51.816.9 115 3.0 1.98 5,700 0.000005 50.9-51.818.1 113 6.0 2.91 11,000 0.000004 50.9-51.8
(Continued)(Sheet 1 of 5)L

Table 4 (Continued)
w tf Rate ofThickness Shear Strain Depth
in. Rate percent pcf tsf tsf min in./min ft
Upper Pepper, Boring 8A6C-445 (Continued)
1.0 Fast 20.5 108 1.5 1.65 8 0.004 50.0-50.920.5 108 3.0 2.76 10 0.003 50.0-50.919.0 109 6.0 3.60 16 0.003 50.0-50.9
Medium 20.2 108 1.5 1.99 340 0.00008 52.7-53.319.7 110 3.0 2.74 480 0.00008 52.7-53.320.0 109 6.0 2.45 270 0.00009 50.9-51.820.0 109 1.5 1.88 410 0.00009 55.4-56.220.0 110 3.0 2.66 1,700 0.00004 55.4-56.220.2 109 6.0 3.63 1,500 0.00004 55.4-56.2
Slow 19.7 109 1.5 1.70 3,100 0.000004 52.7-53.320.3 109 3.0 2.18 4,900 0.000005 50.9-51.820.2 108 6.0 2.11 2,900 0.000006 50.9-51.820.0 110 6.0 3.25 21,500 0.000002 51.8-52.719.0 ill 1.5 2.02 29,100 0.000002 51.8-52.7
Upper Pepper, Borings 8A6C-446 and -447
1.0 Medium 21.6 107 1.5 1.31 75 0.0001 33.3-34.221.2 108 1.5 1.44 1,200+ 0.00009 32.5-34.221.5 107 1.5 1.55 420 0.0002 31.6-32.521.6 108 3.0 1.81 75 0.00008 33.3-34.221.4 107 3.0 1.90 480 0.0002 31.6-32.521.6 105 6.0 2.51 320 0.0002 32.4-33.421.3 107 6.0 2.56 250 0.0002 31.6-32.521.2 108 6.0 2.72 700± 0.00008 32.5-33.321.4* 106 6.0 2.81 320 0.0002 32.4-33.4
Fast 21.8 106 18.0 4.76 40 0.002 33.3-34.221.7 107 18.0 4.76 35 0.001 33.5-33.3
Slow 21.7 107 18.0 4.26 18,000 0.000004 32.5-33.321.6 107 18.0 4.49 13,270 0.000004 32.5-33.3
Fast 21.4 107 12.0 3.61 28 0.002 33.3-34.2
(Continued)
* This inundation fluid was tap water; on all other tests ground water wasused.
(Sheet 2 of 5)

Table 4 (Continued)
a T t Rate ofThickness Shear . Strain Depth
in. Rate percent pcf tsf tsf min in./min ft
Lower Pepper, Boring 8A6C-445
0.25 Fast 22.4 99 1.5 0.63 5 0.006 92.2-93.123.0 105 3.0 1.00 4 0.005 92.2-93.124.0 105 6.0 1.99 4 0.003 92.2-93.1
Medium 28.7 97 1.5 0.25 7 0.0004 90.1-91.028.2 96 3.0 0.61 200 0.00008 90.1-91.027.6 98 6.0 1.50 200 0.00009 90.1-91.023.0 105 1.5 0.45 90 0.00007 92.3-93.1
Slow 26.0 100 1.5 0.52 1,600 0.000004 86.5-87.326.4 98 3.0 0.83 8,800 0.000003 89.2-90.126.2 99 6.0 1.23 1,000 0.000004 89.2-90.1
0.375 Fast 27.0 98 1.5 0.83 5 0.003 88.2-89.126.8 98 3.0 1.13 8 0.003 88.2-89.127.8 97 6.0 2.16 8 0.002 88.2-89.1
Medium 26.7 99 1.5 0.59 800 0.00007 88.2-89.127.8 98 3.0 0.83 240 0.00008 88.2-89.127.1 98 6.0 1.44 360 0.00008 88.2-89.1
Slow 26.2 98 1.5 0.75 5,700 0.000005 89.2-90.126.4 99 3.0 0.79 2,800 0.000007 89.2-90.130.1 91 6.0 1.11 10,000 0.000004 91.3-92.2
0.5 Fast 24.8 101 1.5 0.95 3 0.004 91.3-92.225.1 101 3.0 1.80 6 0.004 91.3-92.225.4 100 6.0 1.95 4 0.004 91.3-92.2
Medium 26.1 99 1.5 0.44 75 0.00008 89.2-90.125.8 97 3.0 0.62 500 0.00008 89.2-90.126.1 99 6.0 1.80 380 0.00008 89.2-90.124.6 102 1.5 1.00 200 0.00007 91.3-92.224.6 102 3.0 1.42 95 0.00008 91.3-92.224.6 102 6.0 2.24 330 0.00008 91.3-92.2
Slow 27.8 97 1.5 0.93 2,400 0.000004 88.2-89.127.8 98 3.0 0.60 300 0.000001 88.2-89.127.3 97 6.0 1.76 13,000 0.000003 86.2-89.1
(Continued)
(Sheet 3 of 5)
I

Table 4 (Continued)
Rate ofThickness Shear wI a tf Strain Depth
in. Rate percent pcf tsf tsf min in./min ft
Lower Pepper, Boring 8A6C-445 (Continued)
1.0 Fast 21.5 106 1.5 1.81 7 0.003 84.6-85.521.0 108 3.0 2.78 9 0.001 85.6-85.523.5 104 6.0 2.18 10 0.004 92.2-93.1
Medium 26.7 99 1.5 1.50 60 0.0001 89.2-90.126.3 99 3.0 1.34 250 0.00009 86.5-87.325.1 102 6.0 1.80 600 0.00008 90.1-91.024.0 104 6.0 2.02 500 0.00008 91.3-92.222.7 106 1.5 1.33 1,400 0.00006 92.2-93.127.4 99 6.0 1.70 440 0.00008 89.2-90.1
Slow 25.2 102 1.5 0.42 1,500 0.000006 90.1-91.024.9 102 3.0 1.85 6,600 0.000004 90.1-91.024.8 102 6.0 2.26 5,700 0.000003 90.1-91.021.8 107 1.5 0.79 25,800 0.000001 92.2-93.1
Del Rio, Borings DR-I and DR-4
0.25 Fast 18.8 111 1.5 0.94 18 0.005 11.7-12.722.8 102 3.0 1.25 7 0.003 11.7-12.716.7 116 6.0 2.54 10 0.003 12.7-13.5
Medium 20.2 109 1.5 0.66 45 0.0001 9.9-10.820.3 110 3.0 1.31 180 0.00007 9.9-10.819.1 112 6.0 2.00 420 0.00009 9.9-10.818.4 113 1.5 0.91 120 0.00007 11.8-12.7
Slow 17.5 115 1.5 0.97 14,000 0.000005 12.7-13.517.1 114 3.0 1.46 4,200 0.000006 12.7-13.517.0 117 6.0 2.12 4,800 0.000005 12.7-13.5
0.375 Fast 17.7 111 1.5 1.40 9 0.005 10.8-11.715.5 116 3.0 2.08 10 0.004 10.8-11.718.9 110 6.0 2.79 9 0.003 12.7-13.5
Medium 17.2 116 1.5 1.28 150 0.00009 11.7-12.717.5 115 3.0 2.16 190 0.00009 11.7-12.717.2 114 6.0 3.15 400 0.00009 11.7-12.7
Slow 17.5 113 1.5 1.26 5,700 0.000004 12.7-13.518.2 113 3.0 1.98 7,300 0.000004 12.7-13.517.6 114 6.0 2.82 11,000 0.000004 12.7-12.5
(Continued)
(Sheet 4 of 5)

Table 4 (Concluded) i
Thickness Shear T.bed ( Rate ofi d f Strain Depthin. Rate percent pcf tsf tsf min in./min ft
Del Rio, Borings DR-I and DR-4 (Continued)
0.5 Fast 18.0 113 1.5 1.64 11 0.004 10.8-11.717.2 116 3.0 2.46 25 0.004 10.8-11.720.9 108 6.0 4.38 20 0.004 10.8-11.7
Medium 21.6 106 1.5 0.46 16 0.0002 10.6-11.722.3 105 3.0 1.78 280 0.0001 10.8-11.722.6 105 6.0 2.51 100 0.0002 10.8-11.716.0 119 1.5 2.33 280 0.00008 9.9-10.8
Slow 19.1 il1 1.5 1.29 4,200 0.000006 9.9-10.819.2 112 3.0 1.23 2,900 0.00001 9.9-10.8
17.7 113 6.0 3.28 4,000 0.000006 9.9-10.817.5 114 3.0 2.41 2,900 0.000003 11.8-12.7
1.0 Fast 16.0 115 1.5 3.02 20 0.002 11.7-12.7
17.1 113 3.0 1.87 2 0.020 11.7-12.718.1 113 6.0 3.54 16 0.002 11.7-12.716.8 110 1.5 3.26 9 0.005 11.8-12.7
Medium 17.3 115 1.5 1.28 55 0.0002 9.9-10.818.5 113 3.0 3.73 150 0.0001 9.9-10.817.3 115 6.0 3.58 160 0.0002 9.9-10.816.5 115 3.0 2.74 300 0.00008 11.8-12.719.0 iI 1.5 1.61 270 0.00006 9.5-10.4
Slow 17.8 112 1.5 1.33 4,400 0.000003 11.7-12.718.9 113 3.0 2.49 4,300 0.000005 11.7-12.7
17.1 113 6.0 4.14 13,000 0.000004 11.7-12.7
(Sheet 5 of 5)

Table 5
Direct Shear Tests, Upper Pepper Shale Specimen
Thickness = 1.0 in., Medium Rate of Shear
Boring Test wi Yd a tf LL
No. Depth, ft No. percent pcf tsf tsf min percent
High Activity
8A6C-445 55.4-56.2 1 20.0 109 1.5 1.88 410 --
55.4-56.2 2 20.0 110 3.0 2.66 1700 --
55.4-56.2 3 20.2 109 6.0 3.63 1500 --
52.7-53.3 1 20.2 108 1.5 1.99 340 86
52.7-53.3 2 19.7 110 3.0 2.74 480 86
50.9-51.8 3 20.0 109 6.0 2.45 270 82
Low Activity
8A6C-447 33.3-34.2 1 21.6 107 1.5 1.31 75 69
32.5-33.3 2 21.2 108 1.5 1.44 1200± 68
31.6-32.5 3 21.5 107 1.5 1.55 420 67
33.3-34.2 4 21.6 108 3.0 1.81 75 69
31.6-32.5 5 21.4 107 3.0 1.90 480 67
8A6C-446 32.4-33.4 6 21.6 105 6.0 2.51 320 69
8A6C-447 31.6-32.5 7 21.3 107 6.0 2.56 250 67
32.5-33.3 8 21.2 108 6.0 2.72 700± 68
8A6C-446 32.4-33.4 9* 21.4 106 6.0 2.81 320 69
* In test 9, the inundation fluid was tap water; in all other tests ground
water was used.

.- N N ) - - - 0lje
2-) )0 0 '.0C -- m4r-Dra-0 0 a 'a t o
n - In -D co -v r-0 To nI ,' z'
207 ' m o2L 2 c' 2~-7 1'40-.tc'r m0a~' c- 0 rcI C MO-. r,44~ - C J 0- 4- c c , L
a 04 ITu1 -. t.CT J c 14a '
UlC2- I r O 0 -r cN 10 0N C' J o
m ~ ~ - .4 a, 0 M0~0 0 cma ;cn ON
s. 'O C14 - 0n Mft '0 r- C-4C~ -4%0'(14 c n ,41 4 Jul6 1 c4J C''00C. ID .4 IT I - IT IT~ IT4-- 1 10 10 - 0
06 .j -=1
C. 00 cma) C (A 0 4 e C~S m C?- 'T nCD e a ~ 4) o--Co : Cr0s m c n j
c L 0a,(D Le 0Q r% Ln 40 0, - .U n 00 - 0
04 CU)*c c, 'v; u - Cn )
000 0 , C 0a 0 a, 0 000 000 0
w oc oo ,o N0 - -, - -, (Cr4o o r-G o o-
Q 0 0 C) Q Q 0 0Q -( 0 0 C 0 0 C) 0 C%0 .
- - -N -" - -" C- - - -N Nr .4-N.0
- j
00 L), Q nu0 ,
0 *a .J -
to >C4*4 .4 W (
0 0 .4) .4
aoCC 0n- y 0 5w 4
C7%C
00 'A 0V
favU eq I

CORPS OF ENGINEERS
0/
.0
0
A
'00,0
0ioto 50200 A 25;C A 3O,00 A ON 3 4,00 45* ,00
ON 2 5 v v
ON N
GC-167
.1000
%00

/4'AS,
N r Mr -
A A A
_1' N MI
8 A G C - A5 Ai A - A A 7 0
Ax o 1A' 55*o -5Cc 0 5OA _* A + A A
/t.5
avN
I AN A0
0c. 3 ', MEXIC
A AC
SA6C-354
00
00
'00
SCALE FEET
0 300 600

U.S. ARM05. 03 '0' t* m 0
*: o,, ,A OKLARK
-~~~ M 404 - L
A
, T E' 4 x - <_ A s
A * * ,'e,,, \ *,40034
" , " " .MEXICO "/ -S , COYJu
/ / " , 0V IC IN IT Y M A P
O ,04 5 SCALE OF MILES0 0 -00
4 .o , o " *.
A A -A -- - - - - - - - -A o t 0
6t A -O 75;0
ON 45SAL0~ IE
AG \ , ".>""00
D U0
0, 60
,,I " IVorfh F 0 ,u

T- --7 S10W
-0 '1A1
zo'Co
A MEXICO
VICINITY MAP
- SCALE OF MILES
G0-. 65.0 ?'20 A 0
45
I ON 3
45
*0
SHEAR STRENGTH CHARACTERISTICS
CLAY SHALE FOUNDATIONS
ES -529
BORING LOCATIONS
U.S ARMY ENGINEER DISTRICT, PORT -WORTH-
PLATE I-

PS OF ENGINEERS
04
4 ~ ~ ~ ~ ~ ~ ~ ~ E RI -SHALE ---- __~ -_---
-2
uCY
4z - _______------~

*0
d)
EARTH EMBANKMENT
------------ OvERBuRDEN 0
PEPRSAE P Oboble LoCrlion of E-, ann~rt ~ UPPER PEPPER -
Shde Fcilue Rio-______
,iscm;~es cf
J o.~e' Pep ,e, 'lie
DEL RIO SHALE
2 .0 400n 500 Goo> -0k) s800 -
SECTION 4-A
-Thp 0/ 1Awe "s A
LL

00
IfITH,,e EMBAN(MEN wHg i ~
ER~~1 SHL
80) _ 0
ER SHAE UPERPPPR4201 .j

€,n: :. e T , . , ,:
0LL
OVERBURDEN
PEPPER SHALE
40
DEL RIO SHALE
.180
tL
04 0
w-J
500 400 -
SECTION B-

44
EARTH EMBAN'KMENT 1
OVER BURDENT
-EPRSAE Prot2obe LC orio of FE-non - UPPER PEPPER1S51de F,iure Pl ___ ___ -
________________________ _______________________________ I ________________________P EPLO E R P E P E
DEL RIO SHALE
2 20 u400 50)60. '. 0 0
SECTION A-A
4~LL
rJMfle5 uf D" F'i S/ole
-DEL RIO SHALE 4<: 0
F~caolio/n for Sp://*oy L*j
C onstruCl~on
wn Llmestone
00 0 1.. '00 3,0
SECTION B3- BUSARMY

'0
520
4680 w
00
RTH EMBANKMENT N ,.
qJJ
ERBUROEN
' o'e rnpfes of
j er Pepper (Hgh Ai) Upper Pe /er /
PER SHALE Proonle Locihon of E -ntnr UPPER PEPPER (-o4 -I
S1,de Frure Pir . -
LOWER PEPPER
iSmples ofiower Pepper Shole
L RIO SHALE
I2500 60 ?CG 80 .00
180
V) /Vote2 See 0te / tor LoCo.oOn of
of sha/e SeCtons 4-A ond 8-8440 .
zL RIO SHALE 4 -3_
n for SpHilwoy ulraClOn 400 SHEAR STRENGTH CHARACTERISTICS
40r, OFCLAY SHALE FOUNDATIONS
ES -529
300 o0 LOCATIONS OF SAMPLES
US ARMY ENGINEER DISTRICT, FORT WORTH
PLATE 2

CORPS OF ENGINEERS
AUTN~ ~ K Un0 EAGLE FORD SHALE
4 O 0- 04' Lenticuior, FosshfiC-onglomerate
104
140 -7
220-234' EAGLE FORD GC Composed of the SOUTH B0
i FORMAT!ON ovo the LAKE- -- FORMATION
(00'- AUSTIN CHALKModerately hard, 7
}50 argilloceous, medium tomassive bedded, ton.groy tOron togray, highly fossiliferous morl-Chalk with occosional shole and 101' SOUTH BOSQUE Fjbentonite seams Top 138' removed : Soft, slghtly CaOCOreous, thin
- by erosion medium bedoeD, fssle. occal--I sandy, tossrhfercus, dorK groy
'.1 bosCe compocton shale thatS
' 160101 sowiy on enpostre
30O 160
.4.L
170 40
0 0
0 U2 '.
ac 6
, C 1 :*~j
o 80- 50,v
.:
190--
-0'70-090 Light Gray hentontfe -)m
0 60a.- - -010-095 Light Gray Benton te -
C S I - e,, *,-A C,. o -200-
JE0 . * 4°. l
v 210 '
(4 , ', '
*1
. ;'2 . go!
20. 6 Moderotply Hard, thaly,4 "o.':-

Match LineEG ORSttE nClirr
0 - PEPPEFSH-ALE0.10-02 Detritol Conglomerate, Coic
Cment, laord BlaCk Pebbles, Sand,133'LAK WAO FOMATN -and Fosil Fragments, iLent Cula,
Unconformity - ott oeoeyhrFORD HALEhighrly calcareous,
1Lenticutor, Fossiliferous 20Lti omdu edd erntcsm
dark gray to black, highly tossiliferous, IC04-IC ~.yZone witht r04-C20occasionally liqeltic, writh many bentonite 10 one Sa Ircluaea 0seams, marl seams, and argillaceouslimestone seams
Ef!4PFPPER S,-it.E:
---- bri'de"1 tos',lIterous. fiss e&,
o:,os~onal iod,iar c~ytc~ne
3 EAGLE FORD GROUP ~ 4515Lrof the SOUTH BOSOUE ____20- Faris trirouqnri2A siares reodil,6
TON Ford Group above tnis point-
rV== SH.rpes of Upper Pepper Shale(HhActivity)
C'02-0' ' y zone, c(Cos'onald tn,i__~-a Sttrone Searns
OUTH BOSQUE FORMATION-:zil o c)slightly calcareous, thin to 31 09- 2 S .ts',e Se n, o oijs on'
bedded, fissle, occasionally ~fossiliferous, dark gray to a:-
compctin s~letha sllte ~= 0.2-0.4' Argillaceous Limestone ond/or Marl ns -,ect or cortars i-5 nueref,,on exposure _----- 003_009L Dork Blue- Gray Bentorite 35-23 .'I-
uLi 3 -o- eorris, clo-a es aI- 0 - Fes. )s ri 5 ns? q9S
Coie of -pper Pepper Sroie040 (_(LW Act"ity) 9
I i L 0 S - S srore- -004- 014' Blue- Gray Gicoceous Bentritte 15-0) I
15-23 MlLimestone (Stialyl Fossiterous L0 50 - 1Thrier Moils above and below (LSXI a-
013-020' Gray -White Bentonite lb - 123
r0 0 70-120' Blue Gray Benton-te, -u.ls o -Qer Pepper Str0o0J S nd/ar Bentonitic Shale (8- 16) (4clv-- -arSe I~0T 'O30-050' Argillaceous Limestone SodtntOPiLIC'
-1-0508 LtBlue Gray Beritonte lB-l -080'~ Lf pp rs r ,ara' 0 t f I, w
040-060' Lt Gray Bentonite (B-19)
-5c 009-013: Dark GrayMicaceous Bentonite (6-20)
j- I PEPPER~ -'s ,F
704. )sDP, .E A
Hard Sanidstonti Seam r~'-'--~ 0-014 Ruve Grrey Reto te I- - 25il )EPE 2 VCD "Ly-s~i,~'ij n--.,
D~EL R Sltt-' -- ''~-s 0 -05 ori I n-' ro~ ~terr
v 008-014' Blue Gray Beniori~re B - 26 rrt F'-- , Frajmer's. o-u is jiIritL,-, Iidy
90C ,j 00(9' Marl
-- 0(3'i 01' Hlue Grov Bentorire f. 273
10 1 1eu ee; rI , 9-n, li-i20- ' it , rirr-u aI'- iI-e.t,--~~iI
n4 015.02' DakBlue Gray Bentonte i5
3546vnt emma i iiCt.i 'lmr5 it
lOG _-06-3 Blu Gra Beiareovs 1oes 4r81 ,
010-02' Dakblue Gray entonEl 'it,- 49
008-02' DaBlue Gra Beonte -540
tty Hard, Sttaty, It1-00-l10-_ry etnt iSottdstore 30.; '-
- i..A-1

U. S'MY
EAGLE ORD SH-ALE0 -l T EPPE;R SHZtLE -- Icnforniy10.10-021 Detrital Conglomerate, Call:
Cement, lard Block Pebbles, Sand,4 and FosbI Fragments, Lenticulor
33' LAKE WACO FORMATONSoft to moderately h~ard, \atch Linehighly calcareous,thin to medium bedded, benontic,sonlesofter zones fissle and stake slowly,dark gray to black, highly tossliferou-,, 0pw , -o il y Zone .. it) C04 -0 20 14-2 3 m-Ihyv Ci o ,noie(1.occasionally lignitic, with many bentonite stone Sear Included 5 aida 1/O
seams, marl seams, and argillaceous ' EPRSA5 K A 722Hgl oaou fa
____PE__PE SAL and Marl$,r, oonccoreous, tirn to med~u s
bniidedloossi, fe'sus fissie,
-Imfrs, siltstone Semand Sandy L .Sims throuqho~l, slakes readily
No bentonite seams noted in Eagle ammc~e601Ford Group aboie this point 1
S tpies of Upper Pepper SholeI
02-0'; ;;y Zone, occasional thin,qO-lar Sitotione Seams
L '8M0, a -g s 'eO('00r
301 F J
009-(.2)' S~tci O soSe, Occ]or'lY 7> ~ n,(allyl '
02-0.4' Argillaceous Limestone ond/o, Marl u-003-009' Darn Blue- Gray Bentootle (8-2) a r"lI' Tns section contains numerous
uA sltilo~i eams, nodules ariaa - Fes. IS'r as ?C' 'oggel
- cifopie of ipper Pepper Sl~ale 11 ' c"'
(_(w Act ,fyo ,mUr 'I 411l't, 1, 0c.-jr ,-er
mesaone oli (>-' ar~i
004-014' Blue- Gray Micaceous Bentorite (8-101 ~sas n a~ 1 d~ I* '' r
a15- 23' Marl -Limestone (S~aly), FosOiliferous aj 50 '~"~' 2000'Slsrn
reman, Mans above and below (LSX) a-
013-020' Gray- White Bentonite (8-;2) o
070-1 20' Blue Gray Benlonrte,030-0o0 Arg~ilae L(eBon 60 16-) -Soriples of -ower Pepper Shole
03d-0.5 BentoceoSl Limeton 6) (,Ctivi ly Varies
050-080' LI Blue Gray Benlonite (8-17 ~ ~ a~w 020,04"' Sandstone - Stltslone,occos analvlebbes toard neft abutment
040-060' LI Gray Bentonite (8-19)
0,09-013! Dark GrayrMicaceous Benlonite (8-2G) (
* ,PEPPER SHALE _
0 *) 2' F,-'uginus, 'i,30y ,1 0,Sol', Ine ' m~Ol0-0 14 Blue Gray Betn le In13 - 25iPERWOD3N
I. I. DEL RIC SHALEC ~ ir~0-'- - 01- 05' lard rIn-I- me - C r oiaerale.
008- 014 Blue Gray Bentonite 18- 26; 'iany Fosw' Fragments, occis-na-,i Pebble, .n
L '005 0 2C' in Gray Bentnl e
1009' Marl005-015' Blue Gray Elentarste fa 271)
64-72 :)EL RIO SriALE
Solt11, -"ail~o-araa, indion, -a trick s.-died fossil. fenais,DarkBlueGra Benonte18-51 '' inon iwse, roedom gray to greenish gray, with~ one 1 i
013 -016 Dr leGa etnt (8 35 bin-otite seam near the top, 0000 .ionol mar15s, h Ih1y
cat.arnous zones/mnd org ip! 100 ',mt-, 'cne' '. ,,ti
(7o1sonal tn-n, disc - irke, Poor y Jevc'aPed i r 1 rfi' no[ i'1Ors near the base, oCc isatill tin, >Ir, toro
qvto block 015J - shale? Sea- 'hrCi,iqsut
015-022' Blue Gray HentOnte (lB -46),016-03" Bluen Gray Bentonire (B 4181
-025' Dark Blue Gray Bentonitir 'B -49)
.060014' Blue Gray Bentone9 (B- 5i)
30,;

S -220-234' EF
-- J. r ornosed of
L. -- R -M_ L.ON
- 00' AuSTIN CHALK
- - -. Moderotely hard,, argi Ioceous medium 10 20i,
massive bedded, ton-gray to Drown To
gray, highly fossih efous marl-
. chalk with occasional shale and 0, S,,THbentonite seams Top 138' removed S Sof. ,
A- by erosion--
mned mf Decided2. 54 ndV, I- s,
le. .. aCfiE:.
s. S;,.y onexp-
40'170 4.
04,
4..:
o0
I.-
-i
4.
jj E
L.L
00 -
_jj
2019 1 .- i J
-- 070-090'~ LMohderratelys~r
'' ---- 10-t5'Ligt Gay ema,:t ,.-- " 30 ' oeel
100 S-.HBqL
LAK WC FA, I S d
4,) TI -Q co fo -
- 210- Lij L
L 000 et ua oslfru
2 2 0m M t
/- 1 i ' - 6 oderately "
--I _ I S~ eosS
23 c. j __ '00-
.I _-.
4l 1 t .5 'M d r tl
L EAGLEKFORD SHALE
__00-0 4 Lent~culor Fossildferouy O1 J
Conglomerate Mat-h Line

220-23 4 EA GLE FO0 RD GROU P i,.as thraguglj,. Slakes reodYConosed of me SOUTH BOSOUE -
F0RAO an Ir AKE _~C ---- No ber'torule seomb noted in F age n,.rFORM .T ON alJ the LAKE WACO ... '" '
FORMATION ,,J G,'up aoe ns pont
-rpes f Upper Pepper Stoale--pt. Act-ty)
• ] ; ..'.3t ,t! n S a r
40
iOl' SOUTH BOSQUE FORMATION
Stslightly calcareous, thrn to -.. ,- 's ccnmeediumn bedded, fGssle, occasionally c-c -- J yr;
sandy, fOss lferous, dOrk gray toVlock com pocton snale tha
t slo es , 0 2 -0 4 Arg,laceo s Lim estone l/ , M r. r
slowly on exposure -. -003-209 o,ar .ue- Gray Bentcr, te 9-2. 'Ia rS'iI, te 7
e' 1 1
i-
- 0 014 9 e Groy ococeo-s Bermon me 8B- l
60.
.5-2 3 Mor.- L mesione (rSnoy), Foss.,,ferousTn-er M ,,S oboe a-a below -_SX) 0
-- 013 020 Gray-White Benlonte R - 2
I-L -
L -
7, 4 0-i 20 Bl e ?ce Ben on !E, 'SL o. -f - e, e, SriC
J" and of Be-moni c S t-' e (6 - 6 ) C',.,e y u e s '
"'- 030-050' ArglaceoJs Limestone e "T - 4 . " ,l
'1050-080' Li Biue Gray Sertonie 8- .- . s ' .. "
.*-eu-
040-060' Lt
Gray Bentonie (B- 9)
- .-~~ 009-013' ODark Gray. Micoceous Bentonite 9B-2,
80t
±7000 Hail Sondstone Seam L C ,; B.,ue Gray Be,,r ' q - -
S - . EP ,_ I-- -_ .. .. .i O -c ,',l n -, ,lo,...'
-- '- .'--!' 26-04 Ble Gray Be o,'te 9-26 £ ,,', - Cl '-. • .
90 0
" 39 t,-mr f -
-C -- 0 015' Bue 5oiy Ben'onle (1- 271 ±
11, 1. logL " *.-, 72 'E: qC S '
II• " " 1 ~~--., 3] i e,> C% "<,3 Am 'o ir -~ .t i, t 3e .1,, ]. n, ' ss'e, ,-el. r, 'Cd 'o Mreet s .'-,, wth4
--, 1 013 016' Dark Blue Gray Benton me (B-35- . - " i,-onmle sear nea' e 2cl, .7..
10 ~20- d po.'3~ Ie.S ' ~ n edI0--1_ ,. ng ,i'J- 5 0C n iC -, ,to.,-ed]
[.- __ _"L ,C';tZ r'- it'r 'st "5e, : 3 tntil
b,3 ,
015-022' Ble Gray Benton,te (B-46)
:-L016-031' Blue Gray Bentonite (8 481
020-025 airk Blue Gray Bentonie ,B-49I
-Moderately Hrd, Sh-ly, 008-014' Blue Gray Bentonite (B-50,
Fassiliferous Sandstone
30' Moderately Hard, Shaly Sandstone :
SOUTH BOSQUE FORMATION - ±
LAKE WACO FORMATION 120-
- 0' Marl - , -. -05-07' Argilloceous Limestone
32' Sandy, Fossiliferous Marl - - - -018-21' Dork Blue Gray Bentonite (8-62) .
"'-'' 010-024' Blue Gray Bentonste (8-65) ' .L'
:-L--- s-l-ls o t e2 -0 ,hale
130 012-020' Lght Blue Gray Bentonlre B-6 , Mo'" , no
EAGLE FORD SHALE Uncolto-,v
-- PEPPER SHALE
.I00-020' OetrItal Conalomerate, Calc CementHard Black Pebbles, Sand.and Fossil cCO
1. S lfE
t
IER'CC
Fragments, Lenticular
IT i il ii.. . . .

- - bc:k. compaction shale * ti
7 -rogpes of Upper Pepper Shale4'h Act-ty)
M I y -J- '/2i 1r,
15 -' 'I' - 5- .
-3 to er~ Berlr -e- pC Sr2n* ' " .- '--
Cri,~~ Fl *o-' ,
009 - '3' -ir rrjn I,' oeu Ber( lant' I-r,
C-
030 50 nj -ale .5 ~melaen4 Gna 'r~ InC.1 : fl050 80
1 B'C Gay erlo InB '-~ ''-IO L
1.t " [).5e'A4 ~ ~ ~ ~ ~ ~ ~ ~ ~ ~ ~ ~ r aerBna e 2.I - ~ fmA -. 'I C
0)2' 'aa "t nr, Con CD' L', c)- , e
L e r i r e -11 11, n, 6' 82 3r G
- - - I '''-arQ-, 'en I r '3I". c-'_t t1 'r ,
043',2 *.nrrBP rl Seal, ;1 [1"nse'e-1 4,rareS~aiI -e01- i I" , Gray,- near-f Ir 4b, c,,4-lm r,
020,G25 C0'ak Bt-C Oia eItortC h, ''-
08 0,4 Blur'Gray H-elaon te r , L,
00 7' Ce ii-..- ;ra Betone 40, 10.18-021' Dark Blue Gray 8enomte-- 8A SH L F U DA IN
00 24 Blue Gray Bentate (B 6a5 -
TYP IIHLI COUM
LE FO D SHA E U SAR HEAN R DSTRNG OT CHARTERSTC
018021 Dar Blue Gul ra Be(tArnf IN 8T CO SH LE FOU DATON
010-024~~~~~~PLT BleGa3et~e 86;: S-2

CORPS OF ENGINEERSII
MINERAL CONTENT IN PERCENT MINERA.OGICAL COMPOSITION IN PERCENT
6C1 10 20 30 40 50 60 70 so 9) 2$1 40 60 8
R f
70 - - - - ---
wz- 90-
Ia-
0
11 To of~ -_ _ . . .
Del Rio
BORING BA6C -354STA 55+00, 55' Rt
Top El 4533
MINERAL CONTENT IN PERCENT M NEPR,_3 CAL COMPOSITION ir PERCENT3 2-c 3c 4C 50 60 K$ K 9$ 2I 4- 6. 8-
50 -rop of Peper .
60 "
J pper Pepper ,
0 orimples of -.-
. ! upper Pepper60 *,jjjow9Act"it)
-4 Montmorillonte
90---------------e--I---C---0 .
-jLoWer Pepper
jA ctlat Varils)110- Top of eRo ----....-- ---- -----
1-i20 .. . . --w
. iMontmorfIonifeZ -ife
°30 .. -V - o-4 .. .. . ... . . . .
Cal
CA 07,
ass__,IaTSample of Del io
160

ALOGICAL COMPOSITION IN PERCENT40 6 0 I
MINERAL CONTENT IN PERCENT MINERoc '0 20 30 6 70 80 90
,ottom of Eagle Ford:
Top of Pepper
120 ------
130--
monfmord/onlfe-I
140- 0 -
o a I
15 0 - - - - - - 6 ---..
GICAL COMPOSITION IN PERCENT u o40 60 80 0) ' , \
- 160 -- - - . . . .I-
Ii 00
0 6
&90
BORING 6C-167STA 31 +00,"Op
Li
---

U.S. ARMY '
,I COTENTIN PLCE/
MINERALCNETNPRCT MINERALOCICAL COMPOSITION IN PERCENT0 20 30 4 0 60 70) 80 9 ________________
Bonm of Eagle Ford
op0 of Pepper
'0A a
0 .
' '4.
0 1 0
o a-7
TcQ, of DOI R~o
BORING 6Q-167STA 31+00,
Top E: 409 0
LEGENDP111j0 Monl ordontle
Koolinite
)Dole'v't
- Amoqo .c~
WN
W,6
A 60

00
O a R io1
, .I ___,
BORING 8A6C -354STA 55+00, 55' RtTop El 453 3
MINERAL CONTENT IN PERCENT MINE 'A.3 CAL COMPOSITION40 0 20 30 40 50 60 70 80 90 1 40 60
60 + 4 A _o_
o1
( ' pies of o
' , I Upder Pepper ..
Up er Pepopero A
( L~ o Ac to P
0 0
fontmorillonde
I "&
I 9
D|0 .
-_
oi nple of
A "'4 Loer PepperS III Ac c iiy Vorils) I
,I0 Top Of Del Rio --- -----
1200
-Montmorillondfe
N. I
: i I I I " - -
1401
1 041b-- i :' /A Go
I ! qII '- I . SorI pie of DeR0 I I -1 .. "
1I 70-
118 --- --4 Io------+- T -
4 .
190
BORING 8A6C-352
STA 55+00 .25'LtTop El 4b54 6

1301- 0
140
MINERALOGICAL COMPOSITION IN PERCENT Lu90 0 20 40 60 80 00o Li
160 - -o -P
0o ofo> R
19OAK
O0N 6C 67
170 --- - -- -
72//
77A

00
0 0
0 0
0
00
of Del/Rlo
BORING 6C-167STA 31+00, ~
Top 4)9 0
LEGENDImw MonimormIon~ie
I lifte[~Kaoolite
-- Ouartz
*7]Calcote]Dohem,te
r ~ Gypsum-z--]Amovpho,,s
WL
S WP
,HEAR STRENGT H CHARACTERISTICSOF
CLAY SHALE FOUNDATIONSES -529
MINERALOGICAL COMPOSITION
V f' AS SHOWN
US ARMY ENGINEER DISTRICT, FORT WORTH
PLATE 4

AA 0
El,
400 0 0 0
o 0
_ 20 I I
l.-
U.
.-
4-J _ _ __
0 20 40 60 80 lO0
LIQUID LIMIT %
FIGURE I
100 -
LEGEND
0 DEL RIO SHALE /
A UPPER PEPPER SHALE
80 03 LOWER PEPPER SHALE
ALL TESTS CONDUCTED WITH /DISTILLED WATER SAME SAMPLE
SOLID SYMBOLS INDICATE RESULTS , 0AFTER OVEN DRYING AT 2156F.
x / -M -1312
w 60
<40
20,o
4_80 oo
SHEAR STRENGTH CHARACTERISTICSOFCLAY-SHALE FOUNDATIONS
ES-529
O. PLASTICITY CHART0 20 40 60
LIQUID LIMIT % ANDFIGURE 2 PERCENT COLLOIDS
U S ARMY ENGINEER UlSTRICT, FT WORTH 9se
PLATE 5
0 l0 20 30 40 (MOISTURE CONTENT %) 0
80 90 100 110 120 (DENSITY PC.F 2 0
r/
I_U80
0
0
00" .UPPER
w-u LOWER
w
40000- DL--
R o SL C T T
I DATUM I
0 MOISTURE CONTENT %/* DENSITY PC F.
SHEAR STRENGTH CNARACTErRISflCS;
CLAY -SHALEr
FOUNDA TIO NSES-u 2
PEPPER SHALE* MOISTURE CONTENT AND DENSITY
US ARMY NRIN R CISTRICT, FT WOICTH 9S
PLATE 6

LIQUID LIMIT AND PLASTICITY INDEX
0 20 40 60 80 100 120
0.60
0
a 40 *0 0
o .UPPER
LOWER
20
SAME SPECIMEN0 0
* 0
0 *
DEL RIO - PEPPER SHALE CONTACT(DATUM)
LIQUID LIMIT 0PLASTICITY INDEX 0
SHEAR STRENGTH CHARACTERISTICS
OF
CLAY-SHALE FOUNDATION3
ES-529
PEPPER SHALE
SOIL INDICES
US ARMY ENGINEER DISTRICT,FT WORTH 966
PLATE 7

ACTIVITY INDEX
0.0 0.5 1.0 1.5 2.0 2.5 3.0
4u 80
I-0
w0
o J6 0
00
< UPPER
j.. LOWER00
-,J
00
DATUM
* UPPER PEPPER
L LOWER PEPPER
$HErAR STRENGTH CHA/RACTERISTICSOF
CLAY-SHALE[ FOUNDATIONS[S-5 2 2
PEPPER SHALE
ACTIVITY INDEX
U.S. A M Y ENGINE EN iSTRICT FT WO TH 19,
PLATE 8
.... CTII IINDEX

0
0 )
gj4
W~ *- 2 Z i(Ouv ~ ~ ~ ~ ~ ~ M S3IJJ3idN SrT
W)NIS3HDI NO1~~iO40Sf* InP@~ $RATfIYC
w L'i .1 inWO a,ca-LAY SAL OPSAI
z -Ia
13PLATA

SAM111 NOli13fO3d NOIILVW80I30
IfL
0
-:u
0D 00
CFA SHL FOULE TIOFS
ES7tCOSLmTO TET
UPPER P2PE SALELVIMW ., BORZI N A C-.
zEr 32r.4--3.4
0SRYEGNE ITIC.F OT A11
PLATE 1

S3A~fl3 Nouon0l3 NOILVIlOz3O- 0
0
0
_____ ____ ____ __ U
WW~cZ
0 01
(3i~~~~~~~~~ <IA3~V3 3313V iSf~ASS3)4I~. iIINIiOH~N /3HNfNOILVdN~w
SHA TEGHCHRCEITC
BOIN 8f) - 44
IEPT fn70 3-88.C
cL E 1PLATEf 1

07 'p--UAhnol NO'±ofla3U NOIIVW80,13a
LL
P. c'j
- 0 0
r ' 6-6-4 zw_ _ _ _> _ _ _ _ z
-o x-- -, =
ov) 0 wO Z 0 wwN
(OI.LVNOIOA 39z3V3VSSH±3dN 3~SS3NN~H± ~VLINI j H~NIS)H~N ~N~V4IO3SHEA SwENT CHRCCRST
BOIN )R- 4rDET 1-f.
U. C3YISWE IYI~,P.OT A.5PLATE 12<

ANEP DEFORMATION P..U) ARMY ENGINEER WATERWAYIEXPERIMENT STATION VICKSBURG MS W R STROMAN ET AL
UNCASFE APR 84 WES/TR/S-7 -R/ 8/3S
* f l N I4

NAI L BRA1111'*' 11111j2.
MICROCOPY RESOLUTION TEST CHART

APPENDIX B: NOTATION
A Cross-sectional area of test specimen
AI Activity index (plasticity index/percent-O.002 mm - 10)
C Compression indexc
C Coefficient of secondary compression
e Void ratio
e Initial void ratio
G Specific gravity of soil solidssH Height of test specimen
LL Liquid limit
LS Linear shrinkage
N Number of blows of liquid limit cup
p Pressure
P Shear force
PI Plasticity index
PL Plastic limit
Q Unconsolidated, undrained triaxial, constant strainn
Qss Unconsolidated, undrained triaxial, stress control
s Shear stress
s Shear stress on the failure plane at failure
S Final saturationf
Si, S Initial saturation10
t Time
t Time subjected to all-around stress prior to applying deviatocstress
tf Time to failure after first application of shear stress
t50 Time at 50 percent primary consolidation
u Pore pressure
wf Final water content
wi, w Initial water content
wN Water content at N blows of cup
Yd' Yi Initial dry density, pcf
o Angle between major principal plane and failure plane
a Normal stress, tsf
Major principal stress
Bi

73 Minor principal stress
a Effective major principal stress
&3 Effective minor principal stress
ach Chamber pressure, tsf
i 1 -o 3 Deviator stress
jrl/& 3 Principal stress ratio
T, Emax Maximum shear strength, tsf
B2

APPENDIX A
LABORATORY TEST DATA*
* Plates of Appendix A are on microfiche and have been inserted in a pocket
at the back of the report.

0 _ u.____
'a:
S
100
__ __ _ __ _ __0 v )2
m~c OIVc OO
xNA V) CNT CN0C(ITC
CLA zM~ PONaR,ES 0 2
CONSLIDTIONTESUPPR PPPE SHLE 404A
(S la. wUSNI *gS0 WC. YSO
PLTE1

Q:0.
0j
CL _ _ _ __ _ _ _
u; 0__________ Ile_____________
x
0 00N
0 ___
; C
U. c LL;(u U
miw Zw j -- _
C0 (r -Ur4 0I
oa 0o~~ Da.b-toA
CLAY _N& FOU4 x t; .Sto -H I * 3
coCONODTon TSTmUPPE PEPE SNALE-LO_ W _
PL T 14: _j 0

0_____
Ii.fl_
cc __ _ __,
0x (n
8 *OtL~ OIj
cc(A wT (c',C.WC(,?r
% o VCLA SA. OJzA,
00IA e
COSLDTINTS+OE in PR HL
- -SY L A M -k, . t -. ? . V r ' i
PlATE 1

&0
w
U. _. _ _
0 a__ _ _ _ _
Q.. z~ q Jq g
00
R. IPD+ ILI
bCONOLDA IN fES
LCEE PE HAE IHA
usatM HIIIDSR~.F ot
___ ___ ___ __ ___ ___ ___ __ ___ ___ ___ _ w wLATIn10

0
x -2
0 a
0.0
00
acI.- U;.JO.0
CLAY~ ~
Sw~ O N A A N
IL R SHALE
zOM CUIH( OSI . m P05
ePAT 17i

X-.
0 V)
00
.l °
III
4 L
"h"'SS . V3NS
SHEAR STRENGTH CHARACTERISTICSOF
CLAY-3"ALE FOUNDATIONS
UPPER PErPPER SHALE
SHEAR STRENGTH
SPECI MEN THICKNESS
tLSARM ENINE 00 RTzTWO
PLAT 18

00
bi
t 01
0 I0
Ia 0!II I o 0 v ~
0, C0
X 4Z
I-
G x 0
in1 J4
*sImavvH
SHEA STRNGT CHARCTERSTIC4 I -_ ___Of
CS50
LOWE PEPR HL
US ARMY EN INR D ISTRCT T.WRTH 1*C
CL~~r-SPLATE 19N0TI

cn cn
In
x
~ILu-
0
0 •0
0,
61.' aJ w C4I/S llY
0 I
1. 0)
'oi
z 2
0 4 ox
CLAY-SHALIE FOUNDATIONS
ES-S29
UPPER PE.PPER S HALE
$"E AR STRENGTH
RATE OF STRAINUS ARMY ENGINEER DISTICT. FT.'&OPT" l
IRATE 20
2 0,

_ _ ILEGEND
* 0
-t109.1 t06 a
Wi - 20.0 21 .4
A1 2 . 5 + 1 .1
BORING ---- - 445 4468 447
DEPTH 51.8-56.2- !1.6-34.2HT ABOVEPEPPER-DEL RIOCONTACT 42- 48 FT 34-36 FT
SPECIMEN THICKNESS I"MEDIUM RATE OF STRAIN
W6
I42
~HIGH ACTIVITYz
0 110
0 24 6 1O
NORMAL STRESS TS.F.
SHEAR STRENGTH CHARACTERISTICSOF
CLAY-SHALE FOUNOATIONSES- 529
UPPER PEPPER SHALE
SHEAR STRENGTH-ACTIVITY INDEX
uS ARMY ENGINEER DISTRICT, FT WORTH 16
PLATE 21

o I i-
U))
atI -0. C
hi a-I.O0 -J
45o
(A 0t 4 C
a hi
3w
",)- m o/
w a
o 0 w
OCHAMBE PRESSUR TOAL PORE U) CABRPESJEoh
-A .U I ft*
12 1 1 0 .
a- 450RINATO
in h
U.
O-°,-0 45) 450NATO
ox 0
4 4TOTA TE4TECAB PRS UR E 2T
. .I URE.
CL_j
0 5
12 a-4aa1
CHABE TOTALUR ORE ____HABR__ESR~ch
a-ATO PRSSR CATBRPESR O OEPESR
PIT 2

. . ..S a.. . . . . . . . . . . . . .. . . . . . .
CZM R2RSSRE¢chTS FABE RSUEOc
In w
12In
x w
o 7
a: 0.
w 4 801
RELTIN FIGURMER PRI SR FIUR 2OEPE R
7' o.884
40.
5.TIAIA CMPESIO3TST
CHABE PESSREac TS CAMER PESSR PPERc TSA
045
0.
CHME PESR ss TETSFCAERPSUE c TPLAE2
32
0FIUR
0 1'
0 -1
CHME PESR OC S
REATO OFHME RSUET-OEPESR
SHA TENIHRnIITCIor
CLAV /N EFUNAINcs52
0.AXA COPESO/ET
UPERPPPRSHL
U. lnttefam ITIT T OT
Os ET.PAE2