Eide 2009 Cost-Effectiveness Assessment of CO2
19
This article was downloaded by: [University College London] On: 19 April 2012, At: 10:23 Publisher: Routledge Informa Ltd Registered in England and Wales Registered Number: 1072954 Registered office: Mortimer House, 37-41 Mortimer Street, London W1T 3JH, UK Maritime Policy & Management: The flagship journal of international shipping and port research Publication details, including instructions for authors and subscription information: http://www.tandfonline.com/loi/tmpm20 Cost-effectiveness assessment of CO 2 reducing measures in shipping Magnus S. Eide a , Øyvind Endresen a , Rolf Skjong a , Tore Longva a & Sverre Alvik a a Det Norske Veritas Research & Innovation, 1322 Høvik, Norway Available online: 23 Jul 2009 To cite this article: Magnus S. Eide, Øyvind Endresen, Rolf Skjong, Tore Longva & Sverre Alvik (2009): Cost-effectiveness assessment of CO 2 reducing measures in shipping, Maritime Policy & Management: The flagship journal of international shipping and port research, 36:4, 367-384 To link to this article: http://dx.doi.org/10.1080/03088830903057031 PLEASE SCROLL DOWN FOR ARTICLE Full terms and conditions of use: http://www.tandfonline.com/page/terms-and- conditions This article may be used for research, teaching, and private study purposes. Any substantial or systematic reproduction, redistribution, reselling, loan, sub-licensing, systematic supply, or distribution in any form to anyone is expressly forbidden. The publisher does not give any warranty express or implied or make any representation that the contents will be complete or accurate or up to date. The accuracy of any instructions, formulae, and drug doses should be independently verified with primary sources. The publisher shall not be liable for any loss, actions, claims, proceedings, demand, or costs or damages whatsoever or howsoever caused arising directly or indirectly in connection with or arising out of the use of this material.
-
Upload
lucy-aldous -
Category
Documents
-
view
52 -
download
6
Transcript of Eide 2009 Cost-Effectiveness Assessment of CO2
This article was downloaded by: [University College London]On: 19 April 2012, At: 10:23Publisher: RoutledgeInforma Ltd Registered in England and Wales Registered Number: 1072954 Registeredoffice: Mortimer House, 37-41 Mortimer Street, London W1T 3JH, UK
Maritime Policy & Management: Theflagship journal of internationalshipping and port researchPublication details, including instructions for authors andsubscription information:http://www.tandfonline.com/loi/tmpm20
Cost-effectiveness assessment of CO2
reducing measures in shippingMagnus S. Eide a , Øyvind Endresen a , Rolf Skjong a , Tore Longva a
& Sverre Alvik aa Det Norske Veritas Research & Innovation, 1322 Høvik, Norway
Available online: 23 Jul 2009
To cite this article: Magnus S. Eide, Øyvind Endresen, Rolf Skjong, Tore Longva & Sverre Alvik(2009): Cost-effectiveness assessment of CO2 reducing measures in shipping, Maritime Policy &Management: The flagship journal of international shipping and port research, 36:4, 367-384
To link to this article: http://dx.doi.org/10.1080/03088830903057031
PLEASE SCROLL DOWN FOR ARTICLE
Full terms and conditions of use: http://www.tandfonline.com/page/terms-and-conditions
This article may be used for research, teaching, and private study purposes. Anysubstantial or systematic reproduction, redistribution, reselling, loan, sub-licensing,systematic supply, or distribution in any form to anyone is expressly forbidden.
The publisher does not give any warranty express or implied or make any representationthat the contents will be complete or accurate or up to date. The accuracy of anyinstructions, formulae, and drug doses should be independently verified with primarysources. The publisher shall not be liable for any loss, actions, claims, proceedings,demand, or costs or damages whatsoever or howsoever caused arising directly orindirectly in connection with or arising out of the use of this material.

MARIT. POL. MGMT., AUGUST 2009,VOL. 36, NO. 4, 367–384
Cost-effectiveness assessment of CO2 reducingmeasures in shipping
MAGNUS S. EIDE*, ØYVIND ENDRESEN, ROLF SKJONG,
TORE LONGVA and SVERRE ALVIK
Det Norske Veritas Research & Innovation, 1322 Høvik, Norway
International shipping is a significant contributor to global greenhouse gas(GHG) emissions, and is under mounting pressure to contribute to overall GHGemission reductions. There is an ongoing debate regarding how much the sectorcould be expected to reduce emissions and how the reduction could be achieved.This paper details a methodology for assessing the cost-effectiveness of technicaland operational measures for reducing CO2 emissions from shipping, throughthe development of an evaluation parameter called the Cost of Averting a Tonneof CO2-eq Heating, CATCH, and decision criterion, against which the evalua-tion parameter should be evaluated. The methodology is in line with theIntergovernmental Panel on Climate Change (IPCC) and with regulatory workon safety and environmental protection issues at the International MaritimeOrganization (IMO).
The results of this study suggest that CATCH550 $/tonne of CO2-eq shouldbe used as a decision criterion for investment in emission reduction measuresfor shipping. In total, 13 specific measures for reducing CO2 emissions have beenanalysed for two selected case ships to illustrate the methodology. Results fromthis work shows that several measures are cost effective according to the proposedcriterion. The results suggest that cost effective reductions for the fleet may wellbe in the order of 30% for technical measures, and above 50% when includingspeed reductions. The results of this study show that the cost effectivenessapproach for the regulation of shipping emissions is viable and should be pursuedin the ongoing regulatory process.
1. Introduction
International shipping is a significant contributor to global greenhouse gasemissions, and is under pressure to bear its share of the burden and contributeto overall GHG emission reductions. International shipping contributes about 3% ofglobal CO2 emissions [1, 2]. In fact, if global shipping was a country, as opposed toa sector, it would be the sixth largest producer of greenhouse gas emissions,exceeding Germany’s emissions [3]. The International Maritime Organization(IMO), the UN organization regulating international shipping, is currently workingto establish GHG regulations for international shipping [4], and is under pressure,e.g. from the EU, to implement regulations with substantial impact on emissions.The European Commission has announced that it will implement regulations of itsown if the IMO fails to act [5–8], and the United Nations Framework Convention onClimate Change (UNFCCC) process is considering shipping (along with aviation)for inclusion in the global CO2 reduction targets for the period from 2012 [9].
*To whom correspondence should be addressed. e-mail: [email protected]
Maritime Policy & Management ISSN 0308–8839 print/ISSN 1464–5254 online � 2009 Taylor & Francishttp://www.tandf.co.uk/journalsDOI: 10.1080/03088830903057031
Dow
nloa
ded
by [
Uni
vers
ity C
olle
ge L
ondo
n] a
t 10:
23 1
9 A
pril
2012

The increasing pressure on shipping is not unique. Reducing climate changeresulting from anthropogenic GHG emissions is high on the international agenda,across all sectors and industries. Global temperature increases above 2�C areexpected to dramatically increase the risk of catastrophic global consequences, andare likely to occur if the concentration of CO2-equivalents in the atmosphere exceed450 parts per million (ppm) [10]. To avoid this scenario, swift and decisive actionis needed. The EU has adopted the 2�C stabilization level as a goal [11], and isworking to gain a global agreement on this [10]. In order to achieve stabilisationat 450 ppm, GHG emissions need to have been reduced by 50%–85% in 2050compared with today’s level [12]. However, all scenarios indicate significant increasesin GHG emissions up to 2050, which means that achieving the needed reductionswill be very challenging.
For shipping, there is an ongoing debate regarding how much the sector could beexpected to reduce emissions and how the reduction could be achieved [6, 7, 13, 4].As for the global GHG emissions, growth is expected also for shipping and achievingsignificant reductions will be challenging [2]. However, a number of measuresare available for shipping to reduce GHG emissions, and key questions relate to howmuch emissions should be reduced, how the reduction should be regulated, whichmeasures are effective, how a global scheme can be implemented and how shippingemissions compare with other sector’s emission. What seems clear is that some formof shipping CO2 regulations will be implemented in the near future, either agreedvia the IMO or the UNFCCC process, or possibly on regional level (e.g. the EU).
In the shipping industry there is general consensus that the IMO is the regulatorybody best suited to ensure that shipping’s contribution to emission reductions ismanaged effectively and in a way that ensures a level playing field (i.e. regulationswhich are neutral across all nations and ship categories to avoid market distortions).Maintaining a level playing field is of primary concern to industry actors. A sectorbased approach is thus desirable. Generally speaking, sector based approachesmay have a disadvantage of not being cost effective in that there may be measures inother sectors which are more cost effective [15]. However, this can be mitigated bytrading mechanisms or, as suggested in this study, by using a decision criterion basedon cross-sector reduction potential and costs. It is also an advantage that the IMOhas a lot of experience with sector wide legislation. Historically, the IMO hasadopted a wide range of legislation in an attempt to raise the performance of theworld fleet consistently in the pursuit of a safer and cleaner shipping industry.
In recent years the decision process at IMO and in particular at the MaritimeSafety Committee (MSC) has moved towards an increasingly transparent andrational regime based on risk analysis and cost-effectiveness assessments. Theprincipal tool for the IMO in this regard is the Formal Safety Assessment (FSA).FSA is a standardized risk analysis and cost benefit assessment, with the aimof developing maritime regulations in a structured and systematic way. Clear andspecific cost effectiveness criteria for the adoption of new requirements have beendefined or are under development (e.g. [16–20]). One of the benefits of using thisapproach for regulatory development is that the resulting regulations for maritimesafety and environmental protection will be based on a sound rationale, and thatpertinent costs imposed by new requirements may be defended based on achievablerisk reductions. A large number of such studies have been submitted e.g. [21, 22].
The advantages of the cost-effectiveness approach for safety, raises the questionif a similar approach should be extended to decisions regarding accidental pollution
368 M. S. Eide et al.
Dow
nloa
ded
by [
Uni
vers
ity C
olle
ge L
ondo
n] a
t 10:
23 1
9 A
pril
2012

and regular releases like emissions to air, in particular GHG emissions [23]. Indeed,the IPCC is using cost-effectiveness in its reasoning for dealing with GHG reduction,and has documented the level of cost-effectiveness which will be necessary to attainatmospheric stabilization [12]. At IMO, the Marine Environmental ProtectionCommittee (MEPC) is currently discussing a criterion for the prevention ofaccidental releases of oil from ships [24].
This paper presents a method for assessing the cost-effectiveness of GHGemission reducing measures in shipping (section 3). Furthermore, based on the globalcost-effectiveness considerations of the IPCC, a decision criterion for the selectionof measures in shipping is presented (section 4). The method is applied to severalselected measures for CO2 emission reduction (section 5). Finally the paper discussesthe applicability of the method in regulations (section 6).
The methodology presented in this paper is valid for all GHG, and thereforethe unit CO2 equivalent is used (CO2-eq). However, in the modelling cases, only CO2
is considered. Furthermore, only CO2 emissions from ships in operation areconsidered in the analysis, as they dominate ship emissions in a lifecycle perspective.
2. Cost effectiveness approach
The potential reduction for CO2 emissions by ships has been addressed by severalstudies (e.g. [25, 26]. However, limited data are available in the literature oncost/benefit ratios of different CO2 reduction options for shipping, althoughcost-effectiveness data and methods are reported for other emissions such as NOx
and SOx (e.g. [27, 28]). This section presents a model by which individual measuresfor emission reduction, or alternatively several measures combined, may be ratedin terms of cost-effectiveness. The method builds on the FSA approach presentlyin use at IMO.
In an FSA, one or several risk reducing measures are analysed with respect torisk-reducing performance (expected statistical reduction in loss of lives; DR) costof implementation (DC) and expected commercial benefit from the measure(other than risk reduction in terms of life saved; DB). The performance measure,or decision parameter, the NCAF (Net Cost of Averting a Fatality), is calculatedas follows:
NCAF ¼DC� DB
DRð1Þ
The FSA guidelines [16] state that all risk reducing measures with an NCAFbelow $3 million should be made mandatory by the IMO. This is the marginal costper life saved discounted to present value using a risk free discounting rate. By now,a number of FSA studies have been performed and reported to IMO accordingto these guidelines, and decisions have been made based on such submissions [22].A similar performance measure has been developed for assessing measures for oilspill reduction; the CATS (Cost of Averting a Tonne of oil Spill) [24].
By the same logic, a decision parameter for emission reduction is established:the CATCH (Cost of Averting a Tonne of CO2-eq Heating) [$/tonne]. Thecalculation of the CATCH is as follows:
CATCH ¼DC� DB
DEð2Þ
CO2 reducing measures in shipping 369
Dow
nloa
ded
by [
Uni
vers
ity C
olle
ge L
ondo
n] a
t 10:
23 1
9 A
pril
2012
where:
DE is the expected reduction of CO2-eq emissions during the expected operational
lifetime of a ship due to the implementation of a measure [tonnes]DC is the cost of implementing a measure on a ship [$]DB is the benefit (other than emission reduction) during the operational lifetime
of a ship, due to the implementation of a measure [$].
The cost of implementing a measure, DC, includes both initial costs (e.g.
installation cost, design cost) and operational costs (e.g. maintenance, training, lost
revenue). DC, as well as the benefit from the measure, DB (e.g. fuel cost savings,
increased revenue), is calculated annually during the expected operational lifetime
of a vessel, and discounted to a present value. If the measure under evaluation
applies to existing ships (as opposed to new buildings) then the costs, benefits and
emission reductions are calculated using the expected remaining lifetime of the ship.
Essentially, the CATCH is a measure of cost-effectiveness in terms of the present
value of the sum of the discounted current and future benefits and costs arising
from implementing a given proposal at the ship level.
3. Cost effectiveness decision criterion
For transparent and rational decision-making, the decision parameter (the CATCH
value) must be linked to well-defined decision criterion. Measures which can be
demonstrated to fulfil the criterion are viable for implementation. The following
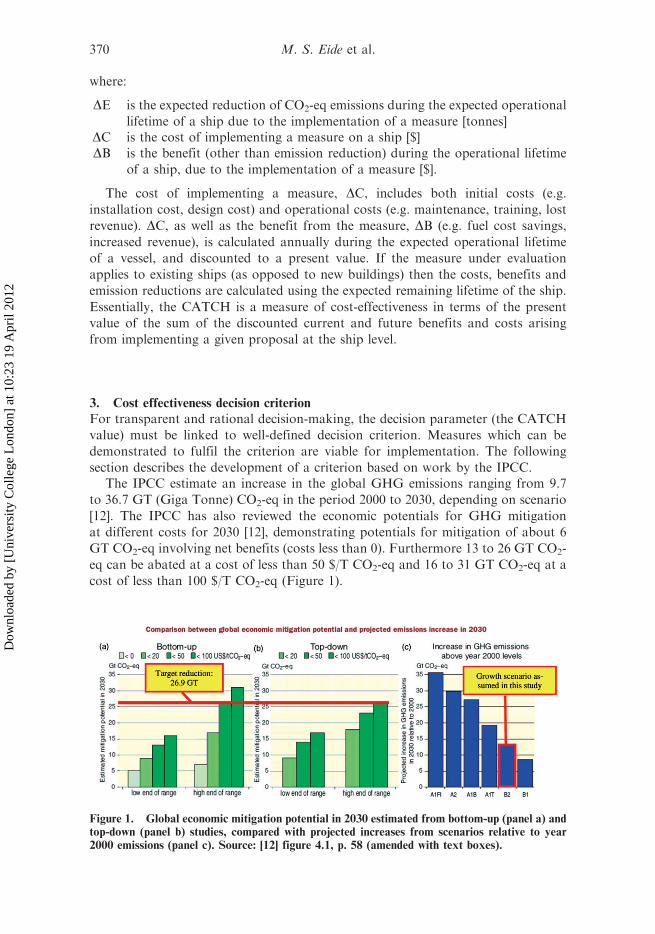
section describes the development of a criterion based on work by the IPCC.The IPCC estimate an increase in the global GHG emissions ranging from 9.7
to 36.7 GT (Giga Tonne) CO2-eq in the period 2000 to 2030, depending on scenario
[12]. The IPCC has also reviewed the economic potentials for GHG mitigation
at different costs for 2030 [12], demonstrating potentials for mitigation of about 6
GT CO2-eq involving net benefits (costs less than 0). Furthermore 13 to 26 GT CO2-
eq can be abated at a cost of less than 50 $/T CO2-eq and 16 to 31 GT CO2-eq at a
cost of less than 100 $/T CO2-eq (Figure 1).
Figure 1. Global economic mitigation potential in 2030 estimated from bottom-up (panel a) andtop-down (panel b) studies, compared with projected increases from scenarios relative to year
2000 emissions (panel c). Source: [12] figure 4.1, p. 58 (amended with text boxes).
370 M. S. Eide et al.
Dow
nloa
ded
by [
Uni
vers
ity C
olle
ge L
ondo
n] a
t 10:
23 1
9 A
pril
2012

The question to be answered is: What must shipping or any other industry expect
to pay per tonne abated emissions to help bridge the gap between the expected global
baseline emissions in 2030 and the target emissions needed in order to limit
temperature increase of 2�C?In order to successfully arrive at a specific cost-effectiveness criterion, it is
assumed that global adoption of the goal of stabilizing the GHG concentration in the
atmosphere at 445–490 ppm (Category I, Figure 2) is needed to limit temperature
increases to 2�C. Furthermore, the assessment is built on the B2 Scenario, which is
a conservative assumption in the sense that most other scenarios have higher
emission growth estimates up to 2030. In broad strokes, there are four scenario
alternatives, the A1, A2, B1 and B2. The B2 scenario family describes a world with
a relatively high emphasis on local solutions to economic, social, and environmental
sustainability. It is a world with continuously increasing global population at a rate
lower than A2, intermediate levels of economic development, and less rapid and
more diverse technological change than in the B1 and A1 storylines. While
the scenario is also oriented toward environmental protection and social equity,
it focuses on local and regional levels [29].
3.1. Determining stabilization target levelFigure 2 illustrates that in order to achieve a Category I stabilization level, the
necessary reduction in CO2 emissions from 2000 to 2030 is 10 GT CO2 (midpoint
estimate in 2030 range). This indicates a relative reduction of 34% in 2030 relative
to the 2000 emissions levels of 29 GT CO2. This assessment is independent of growth
scenarios, but assumes a given path to stabilization in Category I.The stabilization pathway is not described for gases other than CO2. However,
assuming that the required reduction in CO2 is proportional to other GHG, this
implies that the total GHG emissions must also fall by 34%, or 13.9 GT CO2-eq,
from its 2000 level of 40.8 GT CO2-eq [12] to 26.9 GT CO2-eq in 2030.
Figure 2. Global CO2 emissions for 1940 to 2000 and emission ranges for categories
of stabilization scenarios from 2000 to 2100 (left) and equilibrium temperature increasesfor a range of stabilization levels (right). Source: [12] figure 5.1, p. 66 (amended with text
boxes).
CO2 reducing measures in shipping 371
Dow
nloa
ded
by [
Uni
vers
ity C
olle
ge L
ondo
n] a
t 10:
23 1
9 A
pril
2012

3.2. Determining 2030 baselineThe amount of reductions required to reach the emission target level of 26.9 GTCO2-eq in 2030 depends on what the 2030 baseline emission level is assumed to be.The B2 Scenario indicates an increase in GHG emissions of 13 GT CO2-eq above2000 levels to 53.8 GT CO2-eq in 2030 (Figure 1, panel c). Using this as a baseline, itis evident that a reduction of 26.9 GT CO2-eq or 50% of the baseline value of 53.8GT CO2-eq in 2030 is required in order to attain Category I stabilization. Note thatmost other baseline choices (Figure 1, panel c) would lead to considerably moreambitious reduction targets.
3.3. Determining cost of reaching stabilization level, given 2030 baselineFrom Figure 1 (panel a) it is clear that a reduction in the order of 26.9 GT CO2-eq in2030 is achievable at a cost of 50 $/T CO2-eq, judging by the optimistic assessmentpresented in the ‘high end of range’, bottom-up approach (see [30] for a descriptionof the different approaches). It is noted that using some of the more pessimisticassessments (Figure 1, panel b), the target may be hard to achieve even at 100 $/TCO2-eq. It should also be noted that several options for mitigation are not includedin the IPCC estimates for reduction potential, and that these omitted optionsrepresent significant reduction potentials in the order of 10 to 15% of the potentialreported [31].
The above considerations show that the marginal cost of achieving Category Istabilization levels under the B2 scenario can be optimistically assessed to be 50 $/TCO2-eq. This figure may thus be used to describe the investment criterion which theworld must aim for in order to mitigate global warming. The shipping sector is noexception to this in the IPCC reasoning. It is therefore suggested that CATCH550$/T CO2-eq should be used as a decision criterion for investment in emissionreduction measures for shipping.
However, it is possible that this criterion should be higher and that even 100 $/TCO2-eq may not be enough to achieve the stated goal. The criterion should thereforebe subject to adjustments, as science progresses and more evidence are provided.
It should be noted that although the cost criterion is built on IPCC figuresfor abatement costs, as described above, it is acknowledged that other approachesare available, potentially yielding different results. The (marginal) abatement cost(as shown in Figure 1, panels a and b) is the cost of introducing measures whichreduces the emissions by a given amount (per ton abated). This is typicallytechnology dependent, and independent of the baseline emissions. Abatement costsare also discounted to a present value. The International Energy Agency [32] reportsthat to achieve stabilization at 450 ppm a quota price of $180 per ton of CO2
is required in 2030. Quota prices are comparable to marginal abatement cost.In contrast, the (marginal) social cost of CO2 is the cost of damages (due to flooding,heat waves, etc.) resulting from increased GHG concentration and global heating(per tonne emitted). All future damages are discounted to a present value, and iscalculated in relation to a baseline emission scenario (such as in Figure 1, panel c).The Stern review [32] reports a social cost of CO2 at about $85 per ton of CO2 (year2000 prices). Nordhaus [34] argues an optimal social cost of carbon at $7 per tonCO2 in 2005, rising to 95 $ in 2050. The optimal social cost is where the marginal costof reducing more CO2 emission is equal to the marginal damage cost of emittinga tonne of CO2, and is as such not linked to a particular stabilization scenario.
372 M. S. Eide et al.
Dow
nloa
ded
by [
Uni
vers
ity C
olle
ge L
ondo
n] a
t 10:
23 1
9 A
pril
2012

The above discussion illustrates that the definition of a criterion is highlydependant on the methodology chosen, as well as on the many underlyingassumptions and choices regarding input parameters. The differences depend notonly on discounting rates, but also on assessments of when society best can affordto make investments to curb emissions. It should also be noted that the chosenapproach of using present values of economic costs and benefits and comparing itwith the total CO2 reduction over the lifetime of the vessel (in line with the methodused by the IPCC [35]), is not the only approach to evaluating the cost-effectivenessof a measure. An alternative approach is to calculate an annual cost and benefit andcompare it to the annual CO2 emission reduction such as is done by McKinsey [36].In the second approach the CATCH value of the measure would be a real valuewhere the investment costs are calculated into annuities, while the first approach willgive a present value where future costs and benefits are discounted into a presentvalue. The difference between the two approaches is not only technical. A presentvalue criterion means that it does not matter whether you reduce a tonne of CO2
in 10 years or in 20 years if you invest now, whereas a real value criterion means thata reduction in 20 years must cost less than a reduction in 10 years, as 50 $/T in20 years is considered less than 50 $/T in 10 years. To adjust for this effect, a realvalue criterion should be adjusted for inflation, complicating the calculations.Both approaches will give the same result provided a consistency in comparingvalues—real values can not be compared with present values. To induce an actionoriented implementation a present value approach is used in this study.
4. Case description and modelling results
4.1. Modelling casesAs a first approach to study the cost-effectiveness of CO2 reducing measuresfor shipping, a set of measures are analysed considering implementation on newbuildings. Two vessels are considered; a 74 000 DWT (deadweight tonnage) bulkcarrier and an 8 000 TEU (twenty-foot equivalent unit) container ship. Bulk carriersmake up 7% of the world fleet in numbers, but represent 14% of total fuelconsumption, while the corresponding figures for container vessels are 4% and 22%[37]. The two vessels types are thus representing more than one-third of worldshipping fleet emissions.
For each of the two ships the following measures are analysed with respect to theCATCH value (Equation 2):
. Optimized hull design: it has been assumed that the only cost associated withthis measure is an additional design cost before the ship is built. The benefit isreduced fuel consumption as a result of better hydrodynamic properties whichamounts to an annual fuel cost reduction. The annual CO2 emission reduction,DE, is a direct consequence of reduced fuel consumption.
. The weather routing system is assumed to be a subscription based service, whichincurs a start up cost (installation of equipment, etc.) and an annualsubscription fee. The benefit is reduced fuel consumption and reduced CO2
emission as a consequence of avoiding harsh weather.. The Kite system has an installation cost, as well as considerable maintenancecosts. The benefit is reduced fuel consumption and reduced CO2 emission as aconsequence of harnessing wind power to drive the ship forward. The costs
CO2 reducing measures in shipping 373
Dow
nloa
ded
by [
Uni
vers
ity C
olle
ge L
ondo
n] a
t 10:
23 1
9 A
pril
2012

and benefits will vary with the sail size, which must be adjusted to ship size.(The effect of this measure when applied to a container vessel travelling at25 knots is assumed to be low, and is thus only considered for the bulk carrier.)
. Silicon based coating has an initially extra cost and lead to less resistance in thewater due to sea weed and shell growth on the hull. It may also reducehull maintenance, but this effect is not taken into account here. The initial costis dependent on the hull size.
. Pre-swirl stator: by reducing the energy lost in wake rotation the fuelconsumption is reduced. This installation only has an initial cost which doesnot vary much with the ship size, but if the ship has a twin propeller thecost may increase.
. Propeller polishing: with regular propeller cleaning the effectiveness of thepropeller is increased. This has an increased maintenance cost.
. Electronically controlled engine: the engine can be optimized to run better atpart loads through electronic control. This measure has an initial increasedcost for the engine.
. Optimal trim: this is an operational measure that must be used after eachloading and ballasting, and require good loading computers and weight control.The only direct cost of this measure is an initial design cost, and the benefitderives from reduced fuel consumption by reduced resistance in water.
. Waste heat recovery: this measure consists of gathering waste heat from themain engine and using it to generate electric power. The generated electricpower may be used for ship utilities and/or ship propulsion via an electric shaftmotor. To simplify calculations it has been assumed that all power fromthe waste heat recovery is used for propulsion. Only fuel cost reductions areincluded in the benefits.
. Fuel cells run on natural gas can potentially replace conventional powergeneration. At this early development stage the costs are considerable. Thereare also maintenance costs as the fuel cells stacks need to be replaced at fouryears intervals. The CO2 reduction will come from lower carbon content andhigher effectiveness of the energy production. The fuel costs will be reduced.
. Solar panels: this measure is installed on the ship exterior (deck), and convertssolar power directly into electric power with the use of photoelectric technology.It has been assumed that for the small system considered herein, enough deckspace can be made available also on the container ship. The generated electricpower may be used for ship utilities and/or ship propulsion via an electricshaft motor. To simplify calculations it has been assumed that all power fromthe panels is used for propulsion.
. Speed reduction: the fuel consumption of a vessel is assumed to be proportionalto the cube of the vessel speed. This is a common assumption, in reality thiswill wary with the specific designs. Thus, moderate reductions in speed willgreatly reduce fuel consumption and thus emissions. The cost of reduced speedis calculated as the extra cost of more ships to compensate for the lost transportcapacity. By reducing the speed from, e.g., 14.5 to 13.5 knots, 6.9 % of thetransport capacity is lost (in terms of tonne-miles pr day). The cost of replacingthis capacity is then 6.9% of the vessels capital and operating costs.
The data (e.g. cost, reduction effect) for the measures have been collected fromvarious industry and literature sources, including the IMO GHG study [25]. In cases
374 M. S. Eide et al.
Dow
nloa
ded
by [
Uni
vers
ity C
olle
ge L
ondo
n] a
t 10:
23 1
9 A
pril
2012

where a low and high bound on the cost and reduction effect is presented in thedata, the high cost and low effect is assumed. Furthermore, all measures havebeen assumed to be implemented separately. Should more than one measure beimplemented on one ship, the combined effects must be considered.
For all measures an operational life of 25 years has been assumed, and a riskfree discount rate of 5% (real) is used to discount future costs and economic benefits.The activity level of the ships—measured in days at sea is set to 210 and 230 days peryear for the bulk ship and container ship respectively [37]. Furthermore, a fuel costof 243 $/T has been assumed. This is based on an average of the IFO180 price inRotterdam from 2000 to 2008 [38, 39], and is considered to be a low, but realistic,estimate for future fuel prices (the effect of fuel price is discussed more thoroughlyin Section 5.5). Furthermore, in the calculations of emissions, activity based modelsare used, as described e.g. by IMO [1], Dalsøren et al. [37] and Endresen et al. [40].The installed maximum continuous rated engine power (MCR) for the containership is 65 000 kW, while the bulk carrier MCR is at 10 400 kW. An engine load of 75% of MCR; 190 g/kWh as the specific fuel consumption SFC; and 3.13 g CO2/g fuelas the carbon factor CF of residual fuel oil is assumed [41, 42]. For the containervessel, 25 knots is used as baseline speed. For the bulk carrier, 14.5 knots is used.
Although the calculations of the above measures will not be shown in full, oneexample will be presented in detail to illustrate the methodology. For this purposeoptimized hull design is selected. The background figures for this measure areavailable from the IMO GHG study [25]. For the 74 000 DWT bulk carrier,and given the input parameter listed above, the fuel consumption is found to be6090T/year, with corresponding CO2 emissions of 18 900T/year (rounded). For thespecific ship in question the fuel reduction effect of optimizing the hull design can beassumed to be 5%. Thus, an annual reduction in fuel costs of $74 000(243 � 6 090 � 5%) is expected. In net present value this translates to a benefit ofDB¼ $1 033 000. Furthermore, the cost of this measure is limited to a one-time initialexpense for the design effort DC¼ $200 000. The emission reduction over the lifetimeof the vessel achieved is DE¼ 23 600T (18 900 � 5% � 25). Thus the CATCH value isfound to be CATCH¼�35 $/T ((200 000–1 033 000)/23 600).
It should be noted that the assumptions made regarding operational activity level(days at sea, engine load), ship lifetime and engine efficiency (SFC) are averagefigures, based on statistics, and are known to vary considerably from ship to ship.This variation depends on the technical specifics of the ships, but also the tradein which the vessel operates and other operational aspects. Similar variation ispresent in the effects of the measures under consideration.
4.2. ResultsFigure 3 illustrates the results, calculating the CATCH values (equation 2) for theselected measures, as applied to the two case ships. The results clearly illustrate thatseveral cost effective options exist for reducing CO2 emissions from shipping, as theystay below the cost-effectiveness criterion of 50 $/T. Several options come at negativecost for both the bulk carrier and the container vessel. It is noted that the CATCHvalue for the optimal trim, weather routing, silicon coating and optimized hulloptions are close to constant for the two ships. This is due to relatively low costs,such that the CATCH fraction is dominated by the benefit and the emissionreduction, which are proportional to each other. For the bulk carrier it is evidentthat the waste heat recovery system is well above the cost-effectiveness criterion.
CO2 reducing measures in shipping 375
Dow
nloa
ded
by [
Uni
vers
ity C
olle
ge L
ondo
n] a
t 10:
23 1
9 A
pril
2012

This is because the waste heat recovery system has a relatively large investment cost,which is not fully recouped by fuel savings for a ship with a smaller engine.This option is thus not recommended for implementation on the bulk ship. However,the kite, the speed reductions and the propeller polishing options, for which thecost are higher than the benefit when implemented on the bulk carrier, these optionshave CATCH-values below the suggested cost-effectiveness criterion, and shouldthus be considered for implementation. For the large container ship, it is evidentthat all analysed emission control options except the most immature technologies(fuel cell and solar panels) should be recommended for implementation on the basisof pure economic gain (negative CATCH values).
Figure 3. CATCH values ($/T) for emissions reduction measures applied to a 74 000 DWT bulk
ship (top), and a 8000 TEU container ship (bottom). All measures are assumed independent
(implemented one at a time). The green colour illustrate the CATCH values below the cost-
effectiveness criteria of 50 $/T CO2-eq. Red colour illustrate that the cost-effectiveness criteriahas not been met.
376 M. S. Eide et al.
Dow
nloa
ded
by [
Uni
vers
ity C
olle
ge L
ondo
n] a
t 10:
23 1
9 A
pril
2012

4.3. Considerations for the world fleetFrom the literature (e.g. [25, 26]), the estimated short-term CO2 reduction potentialfor operational measures is up to 40%. This order of reduction could be achieved byfleet optimization, routing and speed reduction. The potential of technical measuresto reduce CO2 emissions has been estimated at up to 30% in new ships. The technicalmeasures include designing hulls with less resistance, more efficient aft-ship,propeller and rudder arrangements, shift from oil to natural gas as main fuel, zeroor minimum ballast configurations, marine fuel cells (longer term) and hybrid ships(e.g. wind power, solar panels, use of lightweight materials, etc.). The combinedeffects of technical and operational measures are not known from the literature,but they are clearly not independent. Furthermore, the cost of many of the measuresis not known.
The results of this study go a long way to confirm the figures for potentialemission reductions found in the literature as described above, at least for the twoexample ships used in this study. In addition, the results also indicate that much ofthis potential is achievable in a cost-effective manner. Assuming independencebetween the measures, the cost-effective measures (not including speed reduction)considered in this study add up to an emission reduction in the order of 30% for thebulk carrier, and close to 40% for the container vessel. The marginal reductionsfor each measure ranges from 1% to 11%, and the effects of interdependence is notconsidered significant with numbers of this order. The most ambitious speedreduction considered herein could further halve the emissions.
Acknowledging that the vessels analysed in this study do not adequately representthe world fleet, this study can not accurately assess fleet reduction potentials or costlevels. The results will vary with ship type, trade and operational profile (e.g. engineload), and most of the technologies and measures considered in this study are likelynot to be cost-effective for smaller vessels. It is also likely that the results may changefor other major ship types such as general cargo ships and tankers, although tankersshould resemble the bulk vessel results. Given the large differences in emissionsbetween ship segments [1, 37], it is clear that cost effectiveness modelling should becarried out on a number of ship segments in order to gain an overview of thefleet potential. It is therefore difficult to make an assessment of the potential forcost-effective reductions in the world fleet as a whole. However, the vessels selectedfor analysis in this study both belong to the ship segments responsible for a majorityof emissions from the world fleet. As such, the results shown here may be indicativeof what can be achieved by cost-effective reductions. In the opinion of the authorsthe potential for measures with a CATCH550$/T CO2-eq may well be in the orderof 30% for technical measures, and above 50% when including speed reductions.
4.4. UncertaintyIt should be noted that the measures analysed herein differ significantly from eachother in terms of technological maturity, ease of implementation, and costs.Novel technologies face a set of barriers [43] which must be overcome in order toobtain widespread use. Typically, the price of the technology declines as it matures.Among the technologies presented in this study, fuel cells are among the leastmature, and have yet to be implemented in merchant ships, let alone for applicationsof the magnitude suggested in this study. Thus, comparing the cost-effectivenessof these technologies might seem unfair. Nevertheless, the results shown may beindicative of what can be achieved, and serve as illustration of the proposed method.
CO2 reducing measures in shipping 377
Dow
nloa
ded
by [
Uni
vers
ity C
olle
ge L
ondo
n] a
t 10:
23 1
9 A
pril
2012

It is acknowledged that some measures, such as the speed reductions, have beentreated in a simplified manner, and the results should thus be considered as goodindications, rather that precise estimates. For instance, in the calculation of costrelated to speed reductions, no added inventory cost for cargo owners or impactson contractual obligations has been included.
It is recognized that the list of measures analysed in this study is not exhaustive.One of the most promising options in a short-term perspective not considered in thisstudy is the use of natural gas as fuel. Natural gas has been successfully introducedin marine applications as an alternative to the diesel oil. The world’s first gas drivenferry M/F Glutra has been operated since 2000 and by the end of 2007 Norwayhad six gas-ferries in operation. The supply vessel M/S Viking Energy has been inoperation since 2003 and the ship-owner Eidesvik AS reports a NOx reduction of89% and reduced emissions of CO2 by 21%. Its engines are dual-fuel engines withthe possibility of running on diesel oil as well as liquefied natural gas (LNG). Suchdual-fuel engines are also becoming increasingly popular in new LNG-carriers asthey are proven to be more energy efficient than present gas turbine installations [44].A sufficiently detailed study of this option for the case ships used in this studyis beyond the scope of this article, but is recommended for later work. Other optionsnot considered herein include sustainable biofuels, hydrogen, nuclear power andcarbon capture and storage, which could potentially eliminate or drastically reduceCO2 emissions. However, these options are not considered feasible in the short termperspective.
4.5. SensitivityMany of the choices made regarding input parameters used in the calculations,e.g. technology price, effect of measure and interest rate, will impact the resultsof this study. Also, the assumptions made regarding operational activity level (daysat sea, engine load), ship lifetime and engine efficiency (SFC) are based on averagefigures, and are known to vary considerably from ship to ship. For ships with veryhigh activity levels (e.g. 270 days at sea) the cost effectiveness will be better. Forship operating frequently on reduced engine loads (e.g. 50% of MCR) the costeffectiveness will be reduced.
In the following, the sensitivity of the results with regard to fuel price, whichis considered one of the most influential parameters, is investigated. In Figure 4the CATCH values for the selected measures are shown, using the average price of243 $/T fuel as before (blue bars), but also recalculated CATCH values using a priceof 600 $/T fuel (left error-bar mark) and 100 $/T fuel (right error-bar mark). Thesefuel prices reflect a historic average of the IFO180 price in Rotterdam from 2000to 2008 [38, 39], as well as approximate maximum and minimum prices for the sameperiod. The 100 $/T fuel level is low historically, and illustrates the ‘least desirable’scenario from an environmental perspective. Prices have peaked above 600 $/T fuelin the last years and this could be considered a realistic upper bound for the futureprice level.
For the container vessel, the results show that although the CATCH valueschange significantly with the fuel price, the conclusions for most of the measuresremain the same. For waste heat and electrically controlled engines, the CATCHvalue becomes positive with a low fuel price. However, both measures remainbelow the criterion proposed in this study. The solar panels and fuel cells remainnot cost-effective even at 600 $/T fuel. The rest of the measures all remain at negative
378 M. S. Eide et al.
Dow
nloa
ded
by [
Uni
vers
ity C
olle
ge L
ondo
n] a
t 10:
23 1
9 A
pril
2012

CATCH values, even at low fuel prices. This indicates that the conclusions for thecontainer vessel are robust.
For the bulk carrier, the fuel price has a larger impact on the results. The solarpanels, fuel cells and waste heat remain not cost-effective even at 600 $/T fuel,although waste heat is close to the cost effective criterion at this price. Electronicallycontrolled engines become cost effective with high fuel prices, whereas the remainingoptions remain below the criterion even at 100 $/T fuel, although some measurescross from negative to positive CATCH values. These results also indicate robustnessfor the bulk vessel conclusions.
The above sensitivity analysis assumes the 50 $/T CO2-eq criterion proposedin this study is unchanged. However, a change in this criterion can be caused,
Figure 4. Sensitivity analysis of the CATCH values for emission reduction measures, using
a fuel price of 243 $/T fuel (blue bars), but also the recalculated CATCH values using fuel price
of 600 $/T fuel (left error-bar mark) and 100 $/T fuel (right error-bar mark).
CO2 reducing measures in shipping 379
Dow
nloa
ded
by [
Uni
vers
ity C
olle
ge L
ondo
n] a
t 10:
23 1
9 A
pril
2012
e.g. by choosing a different baseline scenario in the IPCC report, as a higher growthscenario will imply higher marginal costs for achieving stabilization, or by applyingupdated analysis, e.g. from the next update of the IPCC report. It should also be keptin mind that the IMO process for implementing a regulation takes time, typicallyin the order of 5 years. However, the speed of implementation will depend heavily onthe political circumstances. For instance, the International Ship and Port FacilitySecurity (ISPS) code was passed with speed and urgency in about a year afterthe events of 9/11 2001 [45]. Clearly, if a substantial delay time occurs before theproposed CATCH is implemented, the criterion may have to be revised. However,once the principle is established in IMO, updating the criterion could be doneannually by IMO/MEPC.
From Figure 1, and the discussion in Sections 4.2 and 4.3, it is not unlikely thatthe criterion should be 100 $/T CO2-eq. Using this criterion in combination withFigure 4, the waste heat recovery for the bulk carrier becomes cost effective underassumptions of high fuel prices, and that the electronically controlled engine optionis cost-effective unless the fuel price is very low. Although not apparent from thetwo examples shown in this study, it is likely that the selection of the criterion aswell as the assumed average fuel price may change the conclusions reached for someof the measures, in particular for smaller vessels.
5. Use of CATCH in regulations
The use of a cost-effectiveness decision parameter (CATCH) coupled with adecision criterion (CATCH550$/T CO2-eq) allows for several approaches to regulateemissions. The options may be illustrated using examples from earlier IMOregulations: First, the decision to make ECDIS (Electronic Chart Display andInformation Systems) mandatory for large segments of the world fleet is an exampleof how the cost-effectiveness approach was used to justify a prescriptive regulation[46, 47]. The criterion developed herein is obviously applicable to regulationsconcerning explicit measures for ships, such as described in the modelling cases.It would for instance be easy for IMO to mandate compulsory use of, e.g., siliconcoating for ships in certain segments.
A second regulatory option of using cost-benefit is to regulate levels ofperformance, as it has been done for safety and accidental pollution at IMO.When IMO mandated a ballast water discharge concentration standard, the policywas performance-based, meaning that any technology that can meet the requiredperformance level is allowed. New performance based regulations have beensuggested for damage stability (survivability in case of collision or grounding) forpassenger vessels using a similar approach [48].
One example of how environmental performance can be linked to the proposedcriterion is described by Longva et al. [49] for the IMO energy efficiency design index(formerly known as the CO2 design index). However, the criterion could prove usefulin the implementation of several available solutions for emissions regulation underconsideration, not only the design index. Several investigations have examineddifferent schemes for the regulation of carbon dioxide emissions from ships(e.g. [50]). The schemes include some market-based instruments, such as emissionstaxes and emissions trading, as well as some ‘command-and-control’ instruments,such as mandating emissions standards that ships must meet. Hybrid schemes arealso considered; for instance, a standard combined with a tax for not meeting the
380 M. S. Eide et al.
Dow
nloa
ded
by [
Uni
vers
ity C
olle
ge L
ondo
n] a
t 10:
23 1
9 A
pril
2012

standard, or a credit for operating at a higher level than the standard requires. In oneway or the other, these schemes will require the establishment of targets, standardsor caps, and the cost effectiveness criterion defined herein could be used to do this.
By implementing only measures that are cost effective according to the criterion,and at the same time using a criterion that deliver the necessary reduction in GHGemissions, optimum use of resources is ensured. In principle, this is the same basicidea as was intended to be used according to the Kyoto protocol. The differencerelates to implementation: the Kyoto mechanisms have implicitly expected thatthe CATCH should be established by market mechanisms rather than analysis.As shown in this paper, the analytical approach to determining a criterion forCATCH is viable. This means that shipping is in a position to avoid the introductionof complex marked based mechanisms as a means for regulation—the traditionalIMO approach is an option. The application of marked based mechanisms to theshipping sector has been extensively debated, given the global nature of the industryand the domination of non-Annex I countries among the flag states.
6. Conclusions
International shipping is a significant contributor to global greenhouse gasemissions, and is under mounting pressure to bear its share of the burden andcontribute to overall GHG emission reductions. This paper presents a methodologyfor assessing the cost-effectiveness of technical and operational measures forreducing CO2 emissions from shipping, through the development of a decisionparameter called the CATCH (Cost of Averting a Tonne of CO2-eq Heating). Thedevelopment is in line with the Intergovernmental Panel on Climate Change (IPCC)and with regulatory work using Formal Safety Assessment at the IMO.
A decision criterion for the implementation of measures, against which thedecision parameter should be evaluated, is also developed based on the globalcost-effectiveness considerations of the IPCC. The results of this study suggest thatCATCH550 $/T CO2-eq should be used as a decision criterion for investmentin GHG emission reduction measures for shipping.
A number of specific technical and operational measures for reducing CO2
emissions has been analysed for selected ships to illustrate the methodology. Thiswork shows that several measures are cost effective according to the proposedcriterion. Assuming independence between the measures, the cost effective measures(not including speed reduction) considered in this study add up to an emissionreduction in the order of 30% for the bulk carrier, and 40% for the container vessel.The most ambitious speed reduction considered herein could further halve theemissions.
It is difficult to make an assessment of the potential for cost-effective reductionsin the world fleet as a whole. However, the vessels selected for analysis in thisstudy both belong to the ship segments responsible for a majority of emissions fromthe fleet, namely large container and bulk ships. As such, cost-effective reductionsfor the fleet may well be in the order of 30% for technical measures, and well above50% when including speed reductions. Details of the fleet potential need to befurther investigated by upcoming studies.
The use of a cost-effectiveness decision parameter coupled with a decisioncriterion allows for several approaches to regulate emissions, and by introducingCATCH550 $/T CO2-eq as a decision criterion for regulations, shipping may
CO2 reducing measures in shipping 381
Dow
nloa
ded
by [
Uni
vers
ity C
olle
ge L
ondo
n] a
t 10:
23 1
9 A
pril
2012

contribute significantly to the global emission reductions in a cost-effective manner.The cost effectiveness approach for the regulation of shipping emissions is viableand should be pursued. One of the benefits of using this approach for regulatorydevelopment is that the resulting regulations will be based on a sound rationale,and that pertinent costs imposed by new requirements may be defended based onachievable emission reductions.
References1. IMO, 2008, MEPC 58/INF.6, Updated Study on Greenhouse Gas Emissions from Ships:
Phase I Report, International Maritime Organization (IMO) London, UK, 1 September.2. ENDRESEN, Ø., DALSØREN, S., EIDE, M., ISAKSEN, I. S. and SØRGARD, E., 2008, The
environmental impacts of increased international maritime shipping, past trends andfuture perspectives. OECD/ITF Global Forum on Transport and Environment in aGlobalising World, 10–12 November, Guadalajara, Mexico.
3. OCEANA, 2008, Shipping impacts on climate: a source with solutions, Washington, DC,USA. Available at http://www.oceana.org/fileadmin/oceana/uploads/Climate_Change/Oceana_Shipping_Report.pdf
4. IMO, 2008, Emissions from fuel used for international aviation and maritime transport.Information by the International Maritime Organization (IMO), FCCC/SBSTA/2008/MISC.9, 28th session, 4–13 June, Bonn, Germany.
5. REUTERS, 2007, EU confirms to propose ships join emissions trade, Monday16 April. Available at http://www.reuters.com/article/environmentNews/idUSL1639411220070416.
6. VAN DENDER, K. and CRIST, P., 2008, Policy instruments to limit negative environmentalimpacts from increased international transport: an economic perspective, Global Forumon Transport and Environment in a Globalising World, November, Guadalajara, Mexico.
7. GEHRING, M., 2008, Policy instruments to limit negative environmental impacts fromincreased international transport—constraints and opportunities in international law.Global Forum on Transport and Environment in a Globalising World. November,Guadalajara, Mexico.
8. CE DELFT, GERMANISCHER LLOYD, MARINTEK, DET NORSKE VERITAS, 2006, GreenhouseGas Emissions for Shipping and Implementation of the Marine Sulphur Directive, CE DelftPublication No. 06.4103.61.
9. UNFCCC, 2008, United Nations Framework Convention on Climate Change/Subsidiary body for scientific and technological advice, Provisional agenda andannotations, 29th session, Poznan, 1–10 December, FCCC/SBSTA/2008/7.
10. WALKER, G. and KING, D., 2008, The Hot Topic—How to Tackle Global Warming andStill Keep the Lights On (London: Bloomsbury Publishing).
11. EUROPEAN COUNCIL, 2007, Presidency Conclusions—Brussels European Council 8/9 March2007, 7224/07.
12. IPCC, 2007, IPCC 4th assessment report—Synthesis Report, Emissions of long-livedGHGs, http://www.ipcc.ch/pdf/assessment-report/ar4/syr/ar4_syr.pdf.
13. KAGESEN, 2007, Linking CO2 Emissions from International Shipping to the EU ETS.14. ICCT (THE INTERNATIONAL COUNCIL ON CLEAN TRANSPORTATION), 2007, Air pollution and
greenhouse gas emissions from ocean-going ships: impacts, mitigation options andopportunities for managing growth.
15. SCHMIDT, J., HELME, N., LEE, J. and HOUDASHELT, M., 2007, Sector-based approach tothe post-2012 climate. Climate Policy, 8(5).
16. IMO, 2007, Formal Safety Assessment – Consolidated text of the Guidelines for FormalSafety Assessment (FSA) for use in the IMO rule-making process (MSC/Circ. 1023-MEPC/Circ. 392), Note by the Secretariat, MSC 83/INF.2.
17. SKJONG, R. and RONOLD, K. O., 1998, Societal indicators and risk acceptance. OffshoreMechanics and Arctic Engineering Conference, OMAE.
18. NORWAY, 2000, Formal safety assessment – decision parameters including risk accep-tance criteria, Submitted by Norway, MSC 72/16.
382 M. S. Eide et al.
Dow
nloa
ded
by [
Uni
vers
ity C
olle
ge L
ondo
n] a
t 10:
23 1
9 A
pril
2012

19. SKJONG, R., 2002, Risk acceptance criteria: current proposals and IMO position. SurfaceTransport Technologies for Sustainable Development, 4–6 June, Valencia, Spain.
20. VANEM, E., ENDRESEN, Ø. and SKJONG, R., 2007, Cost-effectiveness criteria for marine oilspill preventive measures. Reliability Engineering & System Safety, 93(9), 1354–1368.
21. DENMARK, 2008, Formal safety assessment—RoPax ships, submitted to the InternationalMaritime Organization, IMO MSC85/17/2 and MSC85/INF.3.
22. IACS, 2004, Experience with formal safety assessment at IMO, Submitted by theInternational Association of Classification Societies (IACS), MSC 78/19/1.
23. SKJONG, R., 2009, Regulatory Framework, in Risk-based Ship Design: Methods, Tools andApplications, edited by A. Papanikolaou (Berlin, Germany: Springer Publishing).
24. SKJONG, R., VANEM, E. and ENDRESEN, Ø., 2005, Risk evaluation, Safedor deliverable4.5.2, Integrated project 516278 in the 6th framework programme of the EuropeanCommission.
25. IMO, 2000, MEPC 45/8, Report on the outcome of the IMO Study on Greenhouse GasEmissions from Ships, 29 June.
26. AEA ENERGY ENVIRONMENT, 2007, Low carbon commercial shipping, Report for theDepartment for Transport. ED05465 Issue 3. Available at http://www.dft.gov.uk/pgr/scienceresearch/technology/lctis/reportaeanewcastleunipdf.
27. NERA, 2005, Economic instruments for reducing ship emissions in the European UnionEuropean Commission, Directorate-General Environment, 26 September. Available at:http://ec.europa.eu/environment/air/pdf/task3_final.pdf.
28. COFALA, J., AMANN, M., HEYES, C., WAGNER, F., KLIMONT, Z., POSCH, M., SCHOPP, W.,TARASSON, L., JONSON, J. E., WHALL, C. and STAVRAKAKI, A., 2007, Analysis of policymeasures to reduce ship emissions in the context of the revision of the national emissionsceilings Directive. Service Contract No. 070501/2005/419589/MAR/C1, EuropeanCommission, International Institute for Applied Systems Analysis (IIASA),Laxenburg, Austria. Available at: http://www.iiasa.ac.at/rains/reports/IR06-107_Ships.pdf.
29. IPCC, 2000, Special Report on Emissions Scenarios. Available at http://www.grida.no/climate/ipcc/emission/ (including summary for policymakers. Available at http://www.grida.no/climate/ipcc/spmpdf/sres-e.pdf).
30. IPCC, 2007, IPCC fourth assessment report—summary for policymakers, in ClimateChange 2007: Mitigation (Chapter D. Mitigation on long term), Contribution ofWorking Group III. Available at: http://www.ipcc.ch/pdf/assessment-report/ar4/wg3/ar4-wg3-spm.pdf.
31. IPCC, 2007, IPCC fourth assessment report—Working Group III Report, Mitigationfrom a cross-sectoral perspective, Chapter 11.
32. IEA (INTERNATIONAL ENERGY AGENCY), 2008, World Energy Outlook 2008.33. STERN, N., 2006, The economics of climate change—the Stern Review (Part III: The
economics of stabilisation). Cabinet Office, HM Treasury (Cambridge: CambridgeUniversity Press).
34. NORDHAUS, W., 2008, A Question of Balance—Weighing the Options on Global WarmingPolicies, (Yale University Press).
35. HALSNÆS, K., SHUKLA, P., AHUJA, D., AKUMU, G., BEALE, R., EDMONDS, J., GOLLIER, C.,GRUBER, A., HA DUONG, M., MARKANDYA, A., MCRARLAND, M., NIKITINA, E., SUGIYAMA,T., VILLAVICENCIO, A. and ZOU, J., 2007, Framing issues, in Climate Change 2007:Mitigation. Contribution of Working Group III to the Fourth Assessment Report of theIntergovernmental Panel on Climate Change, edited by B. Metz, O. R. Davidson, P. R.Bosch, R. Dave and L. A. Meyer (Cambridge, New York: Cambridge University Press).
36. MCKINSEY, A cost curve for greenhouse gas reduction, The McKinsey Quarterly 2007Number 1.
37. DALSØREN, S., EIDE, M., ENDRESEN, Ø., MJELDE, A., GRAVIR, G. and ISAKSEN, I. S. A.,2009, Update on emissions and environmental impacts from the international fleet. Thecontribution from major ship types and ports. Atmos. Chem. Phys., 9, 2171–2194.
38. INTERNATIONAL ENERGY AGENCY (IEA), 2007, Energy Prices and Taxes—Marine BunkerSpot Prices (US$/tonne), Vol2007, release 02.
39. BUNKERWORLD, 2008, Monthly bunker prices in Rotterdam – IFO180 (RME25,RMF25). Available at: http://www.bunkerworld.com/markets/prices/nl/rtm/monthly.
CO2 reducing measures in shipping 383
Dow
nloa
ded
by [
Uni
vers
ity C
olle
ge L
ondo
n] a
t 10:
23 1
9 A
pril
2012
40. ENDRESEN, Ø., SØRGARD, E., BEHRENS, H. L., BRETT, P. O. and ISAKSEN, I. S. A., 2007,A historical reconstruction of ships fuel consumption and emissions. Journal ofGeophysical Research, 112, D12301.
41. IPCC, 2006, 2006 IPCC Guidelines for National Greenhouse Gas Inventories, NationalGreenhouse Gas Inventories Programme.
42. INTERNATIONAL MARITIME ORGANIZATION, MARINE ENVIRONMENT PROTECTION COMMITTEE,2008, Report of the Marine Environment Protection Committee in its 58th Session, MEPC58/23.
43. IEA (INTERNATIONAL ENERGY AGENCY), 2006, Energy technology perspectives. Scenarios& Strategies up to 2050, Section 3, Chapter 3.
44. MARINE PROPULSION, 2008, Operational feedback from DF-electric fleet. MarinePropulsion, April/May, 23–26.
45. IMO, 2004, SOLAS, Chapter XI-2 Reg 1 (London: IMO).46. NORWAY, 2008, ECDIS and ENC coverage—application of carriage requirements for
ECDIS. Submitted by Norway, NAV 54/14.47. VANEM, E, EIDE, M. S., LEPSØE, A., GRAVIR, G. and SKJONG, R., 2007, Electronic chart
display and information systems for navigational safety in maritime transportation.European Journal of Navigation.
48. DENMARK, 2008, Formal safety assessment—cruise ships. Submitted to the InternationalMaritime Organization, MSC 85/17/1 and MSC 85/INF.2.
49. LONGVA, T., EIDE, M. S. and SKJONG, R., 2009, A cost–benefit approach for determininga required CO2 index level for future ship design. In preparation.
50. TORVANGER, A., BOGSTRAND, B., BIELTVEDT SKEIE, R. and FUGLESTVEDT, J., 2007, Climateregulation of ships, CICERO Report, 2007:7.
384 M. S. Eide et al.
Dow
nloa
ded
by [
Uni
vers
ity C
olle
ge L
ondo
n] a
t 10:
23 1
9 A
pril
2012