EIA – 411 Report (((RRR ddd rVVV nnn***))) spp 411 report - redacted...S PP EIA – 411 Report...
61
S S P P P P E E I I A A – – 4 4 1 1 1 1 R R e e p p o o r r t t ( ( ( R R R e e e d d d a a a c c c t t t e e e d d d V V V e e e r r r s s s i i i o o o n n n * * * ) ) ) * * * I I I t t t e e e m m m 2 2 2 h h h a a a s s s b b b e e e e e e n n n r r r e e e m m m o o o v v v e e e d d d f f f r r r o o o m m m t t t h h h i i i s s s r r r e e e p p p o o o r r r t t t f f f o o o r r r c c c o o o n n n f f f i i i d d d e e e n n n t t t i i i a a a l l l i i i t t t y y y p p p u u u r r r p p p o o o s s s e e e s s s Published: June, 2008 A Report to the Office of Energy Emergency Operations Department of Energy Under EIA-411 All questions concerning this data should be directed to: Technical Studies and Modeling Southwest Power Pool 415 N. McKinley, #140 Plaza West Little Rock, AR 72205-3020 www.spp.org
Transcript of EIA – 411 Report (((RRR ddd rVVV nnn***))) spp 411 report - redacted...S PP EIA – 411 Report...
S
SPPPP EEIIAA –– 441111 RReeppoorrtt
(((RRReeedddaaacccttteeeddd VVVeeerrrsssiiiooonnn***))) ***IIIttteeemmm 222 hhhaaasss bbbeeeeeennn r rreeemmmooovvveeeddd fffrrrooommm ttthhhiiisss rrreeepppooorrrttt fffooorrr cccooonnnfffiiidddeeennntttiiiaaallliiitttyyy pppuuurrrpppooossseeesss
Published: June, 2008
A Report to the Office of Energy Emergency Operations Department of Energy Under EIA-411
All questions concerning this data should be directed to:
Technical Studies and Modeling Southwest Power Pool
415 N. McKinley, #140 Plaza West Little Rock, AR 72205-3020
www.spp.org
Table of Contents
Introduction Introduction Identification of Reporting Utilities Definitions
Item 1 Projected Energy & Peak Demand for the First Ten Years & Actual Data for the Previous Year
Item 3 Projected Capacity & Demand for Ten Years Item 3.1 Summer Item 3.2 Winter Item 4 Projected Capacity Purchases and Sales Item 5 Bulk Electric Transmission System Map Item 6 Proposed Bulk Electric Transmission Line Additions Item 7 Annual Data on Transmission Line Outages for EHV
Lines
Page 1 of 60 Redacted Version 2008 EIA-411

INTRODUCTION
Page 2 of 60 Redacted Version 2008 EIA-411

INTRODUCTION
The following table shows a five-year comparison of the Summer Peak Demand, the Winter Peak Demand and the Annual Energy for Southwest Power Pool.
Section 1
Table 1 – Historical Demands Summer Demand
(MW) Winter Demand
(MW) Annual Energy
(GWh)
2003(4-1-04) 40367 28450 186136 2004(4-1-05) 40106 29490 191829 2005(4-1-06) 41727 30042 201548 2006(4-1-07) 42882 30792 201521 2007(4-1-08) 43167 31322 205675 %/Change* 0.7% 1.7% 2.0%
* Percentage change from 2006 to 2007
The following table shows the ten-year capacity margin projections for a five-year period.
Table 2 – Present and Historical Capacity Margins OE411
4-1-04 OE411 4-1-05
OE411 4-1-06
OE411 4-1-07
OE411 4-1-08
2004 20.39%
2005 18.39% 15.98%
2006 18.11% 15.59% 15.50%
2007 18.02% 14.98% 14.50% 14.70%
2008 15.70% 14.31% 14.60% 14.40% 14.10%
2009 15.47% 12.98% 12.70% 12.95% 14.40%
2010 14.53% 12.95% 13.40% 14.24% 14.00%
2011 13.45% 13.09% 13.10% 14.29% 12.40%
2012 12.62% 13.52% 13.50% 13.50% 12.00%
2013 10.80% 12.31% 11.30% 12.21% 11.20%
2014 11.58% 10.10% 12.21% 9.70%
2015 8.60% 11.33% 9.10%
2016 11.03% 8.00%
2017 6.50%
Page 3 of 60 Redacted Version 2008 EIA-411

IDENTIFICATION OF REPORTING UTILITIES
SPP SYSTEMS REPORTING CODES
AEP West
Public Service Company of Oklahoma PSOK
Southwestern Electric Power Company SOEP
Missouri Public Service Company MIPU
Arkansas Electric Cooperative Corporation AECC
Board of Public Utilities, Kansas City, Kansas KACY
Central Louisiana Electric Company CELE
City of Clarksdale, Mississippi CLWL
City of Lafayette, Louisiana LAFA
City Power & Light, Independence, Missouri INDN
City Utilities, Springfield, Missouri SPRM
Empire District Electric Company EMDE
Grand River Dam Authority GRRD
Kansas City Power & Light Company KCPL
Louisiana Energy & Power Authority LEPA
Midwest Energy Inc. MIDW
Northeast Texas Electric Cooperative NTEC
Oklahoma Gas & Electric Company OKGE
Oklahoma Municipal Power Authority OMPA
Public Service Comm. Of Yazoo City YAZO
Southwestern Power Administration SWPA
Southwestern Public Service Company SWPS
Sunflower Electric Power Corp. SUNC
Western Farmers Electric Cooperative WEFA
Western Resources, Inc. Kansas Power & Light Company KAPL
Kansas Gas & Electric Company KAGE
Page 4 of 60 Redacted Version 2008 EIA-411

GENERAL DEFINITIONS
These definitions are intended for use in the preparation of a response to Form EIA-411. They are not intended to conflict with or replace definitions used in other reporting forms, glossaries, or dictionaries. 1. REPORTING YEAR The calendar year in which the report is filed. For instance, 2008 is the Reporting Year for a report filed April 1, 2008. 2. PREVIOUS YEAR Is the calendar year immediately before the reporting year. For a report filed April 1, 2008, the Previous Year is 2007. 3. SUMMER PEAK PERIOD For the purposes of this report, the summer peak period begins on June 1 and extends through September 30. 4. WINTER PEAK PERIOD For the purposes of this report, the winter peak period begins on December 1 and extends through March 31 of the following year. For instance, winter 2007 begins December 1, 2007, and extends through May 31, 2008. It is convenient to describe the winter peak period by means of two years. Thus, the winter referred to here would be winter 2007/08. 5. CAPACITY A measure of the ability to generate electric power is usually expressed in megawatts (MW). Capacity can refer to the output of a single generator, a plant, an entire electric system, a power pool, or a Region. Summer or Winter Capacity is a reference to the expected generator capacity at the time of the summer or winter peak demand period. 6. NET CAPABILITY The maximum load-carrying ability of the equipment, exclusive of station use, under specified conditions for a given time interval independent of the characteristics of the load. (Capability is determined by design characteristics, physical condition, adequacy of prime mover, energy supply, and operating limitations such as cooling a circulating water supply and temperature, headwater and tailwater elevations, and electrical use.) 7. NET CAPACITY The maximum capacity (or effective rating) modified for ambient limitations, that a generating unit, power plant, or electric system can sustain over a specified period of time (such as a month or season), less the capacity used to supply the demand of station or auxiliary needs (such as fan motors, pump motors, and other equipment essential to operation of the generating units).
Page 5 of 60 Redacted Version 2008 EIA-411
8. DISTRIBUTED GENERATION
Small-scale generating units located in close proximity to the load being served, and connected to the grid at distribution voltages, typically less than 69kV. Such units may be, for example, reciprocating engines, micro turbines, small combustion gas turbines, fuel cells, or photovoltaic. These units may be applied in a variety of ways, including back-up, power quality, peak shaving, or stand-by.
Page 6 of 60 Redacted Version 2008 EIA-411

This page intentionally left blank.
Page 7 of 60 Redacted Version 2008 EIA-411
ITEM 1
PROJECTED ENERGY & PEAK DEMAND FOR THE FIRST TEN YEARS
AND ACTUAL DATA FOR THE PREVIOUS
YEAR
Page 8 of 60 Redacted Version 2008 EIA-411

ITEM 1
PROJECTED ENERGY AND PEAK DEMAND FOR THE FIRST TEN YEARS AND
ACTUAL DATA FOR THE PREVIOUS YEARS
This item reports actual annual Net Energy for Load and seasonal Peak Demand for the previous year and estimated values for the reporting year and for each of the nine additional years. Peak Hour Demand in Megawatts (MW) should correspond to “Total Internal Demand” as reported on line 2 of Item 3. Net Energy for Load is to be reported in gigawatthours (Gwh). It is the electrical energy requirements of an electric system, defined as system net generation plus energy received from others less energy delivered to others through interchange. It includes system losses but excludes energy required for the storage at energy storage facilities. For the purposes of this report, the summer period extends from June 1 through September 30 and the winter period from December 1 through March 31 of the following year. For example, winter 2007 begins December 1, 2007 and extends through March 31, 2008.
Page 9 of 60 Redacted Version 2008 EIA-411

Item 1Projected Energy and Peak Demand for the First Ten Years
and Actual Data for the Previous YearSPPMonthly DataActual Data 2007 Jan Feb Mar Apr May June July Aug Sept Oct Nov Dec01 Peak Hour Demand-MW 30141 31028 25629 26746 31495 36775 38965 43167 36887 33537 26610 2956002 Net Energy-GWh 17137 15237 14661 14570 16155 18075 20639 23062 17821 16164 15112 17042Monthly DataReporting Year 2008 Jan Feb Mar Apr May June July Aug Sept Oct Nov Dec03 Peak Hour Demand-MW 30972 30042 27761 28546 34026 39211 42479 43571 38708 32634 28238 3072604 Net Energy-GWh 17322 15652 15351 14963 16370 18874 21619 22081 17886 15861 15370 17183Monthly DataNext Year 2009 Jan Feb Mar Apr May June July Aug Sept Oct Nov Dec05 Peak Hour Demand MW 31655 30879 28322 29362 34859 40074 43436 44580 39591 33525 28922 3154006 Net Energy-GWh 17520 15773 15674 15311 16746 19289 22134 22579 18339 16229 15779 17511Yearly DataTen Year Projection Actual07 Peak Hour Demand 2007 2008 2009 2010 2011 2012 2013 2014 2015 2016 2017Summer-MW 43167 43800 44784 45657 46355 47011 47715 48427 49152 49878 50640Yearly DataTen Year Projection Actual08 Peak Hour Demand 2007/08 2008/09 2009/10 2010/11 2011/12 2012/13 2013/14 2014/15 2015/16 2016/17 2017/18Winter-MW 31322 31954 32585 33293 33932 34515 35204 35938 36629 37371 38106 Yearly Data Ten Year Projection Actual09 Net Annual Energy 2007 2008 2009 2010 2011 2012 2013 2014 2015 2016 2017Annual-GWh 205675 208532 212884 218946 222719 226747 230306 234054 238189 242443 246409
Page 10 of 60 Redacted Version 2008 EIA-411
cjh1006
Stamp
ITEM 1Projected Energy and Peak Demand for the First Ten Years
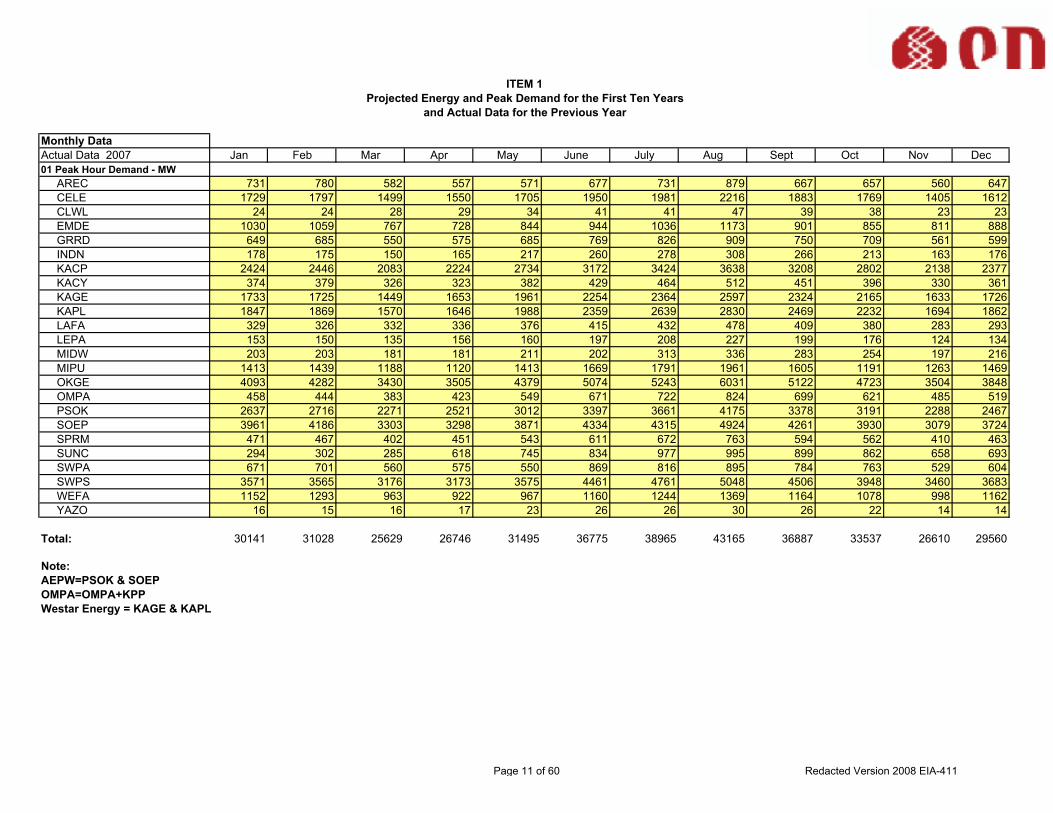
and Actual Data for the Previous Year Monthly DataActual Data 2007 Jan Feb Mar Apr May June July Aug Sept Oct Nov Dec01 Peak Hour Demand - MW AREC 731 780 582 557 571 677 731 879 667 657 560 647 CELE 1729 1797 1499 1550 1705 1950 1981 2216 1883 1769 1405 1612 CLWL 24 24 28 29 34 41 41 47 39 38 23 23 EMDE 1030 1059 767 728 844 944 1036 1173 901 855 811 888 GRRD 649 685 550 575 685 769 826 909 750 709 561 599 INDN 178 175 150 165 217 260 278 308 266 213 163 176 KACP 2424 2446 2083 2224 2734 3172 3424 3638 3208 2802 2138 2377 KACY 374 379 326 323 382 429 464 512 451 396 330 361 KAGE 1733 1725 1449 1653 1961 2254 2364 2597 2324 2165 1633 1726 KAPL 1847 1869 1570 1646 1988 2359 2639 2830 2469 2232 1694 1862 LAFA 329 326 332 336 376 415 432 478 409 380 283 293 LEPA 153 150 135 156 160 197 208 227 199 176 124 134 MIDW 203 203 181 181 211 202 313 336 283 254 197 216 MIPU 1413 1439 1188 1120 1413 1669 1791 1961 1605 1191 1263 1469 OKGE 4093 4282 3430 3505 4379 5074 5243 6031 5122 4723 3504 3848 OMPA 458 444 383 423 549 671 722 824 699 621 485 519 PSOK 2637 2716 2271 2521 3012 3397 3661 4175 3378 3191 2288 2467 SOEP 3961 4186 3303 3298 3871 4334 4315 4924 4261 3930 3079 3724 SPRM 471 467 402 451 543 611 672 763 594 562 410 463 SUNC 294 302 285 618 745 834 977 995 899 862 658 693 SWPA 671 701 560 575 550 869 816 895 784 763 529 604 SWPS 3571 3565 3176 3173 3575 4461 4761 5048 4506 3948 3460 3683 WEFA 1152 1293 963 922 967 1160 1244 1369 1164 1078 998 1162 YAZO 16 15 16 17 23 26 26 30 26 22 14 14
Total: 30141 31028 25629 26746 31495 36775 38965 43165 36887 33537 26610 29560
Note:AEPW=PSOK & SOEPOMPA=OMPA+KPPWestar Energy = KAGE & KAPL
Page 11 of 60 Redacted Version 2008 EIA-411
cjh1006
Stamp

ITEM 1
Projected Energy and Peak Demand for the First Ten Yearsand Actual Data for the Previous Year
Monthly DataActual Data 2007 Jan Feb Mar Apr May June July Aug Sept Oct Nov Dec02 Net Energy - GWh AREC 367 321 264 265 274 321 369 432 312 282 279 348 CELE 862 782 753 753 885 1009 1033 1159 972 885 739 812 CLWL 14 13 13 12 17 20 22 25 19 17 13 13 EMDE 494 468 395 392 409 461 527 595 442 407 410 486 GRRD 373 340 327 326 363 392 425 495 387 357 333 365 INDN 96 87 83 79 93 108 129 149 101 86 82 97 KACP 1395 1272 1189 1153 1294 1457 1686 1927 1392 1231 1192 1401 KACY 222 203 195 189 200 218 243 288 216 199 191 214 KAGE 1064 922 921 935 1032 1135 1292 1437 1134 1007 974 1067 KAPL 1079 978 941 916 1018 1140 1353 1522 1123 1001 950 1059 LAFA 154 135 142 142 173 196 204 231 193 170 139 149 LEPA 75 64 66 68 83 98 99 115 96 81 64 71 MIDW 125 112 112 108 110 133 181 180 132 126 120 118 MIPU 774 712 626 604 657 750 874 993 660 635 651 810 OKGE 2428 2137 2057 2014 2226 2464 2819 3155 2501 2228 2030 2331 OMPA 257 214 214 218 246 293 356 407 292 262 252 277 PSOK 1560 1388 1403 1360 1529 1689 1957 2174 1676 1467 1346 1482 SOEP 2094 1812 1724 1667 1932 2155 2249 2620 2131 1889 1690 1907 SPRM 245 240 238 229 261 290 334 387 276 252 232 262 SUNC 168 174 181 371 411 444 541 553 445 437 405 427 SWPA 318 304 282 264 309 372 431 470 354 326 269 298 SWPS 2291 1958 2022 1998 2102 2340 2829 2995 2362 2271 2207 2377 WEFA 674 594 505 500 521 577 673 737 593 539 537 663 YAZO 8 7 8 7 10 13 13 16 12 9 7 8
Total: 17137 15237 14661 14570 16155 18075 20639 23062 17821 16164 15112 17042
Note:AEPW=PSOK & SOEPOMPA=OMPA+KPPWestar Energy = KAGE & KAPL
Page 12 of 60 Redacted Version 2008 EIA-411
cjh1006
Stamp

ITEM 1Projected Energy and Peak Demand for the First Ten Years
and Actual Data for the Previous Year Monthly DataReporting Year 2008 Jan Feb Mar Apr May June July Aug Sept Oct Nov Dec03 Peak Hour Demand - MW AREC 818 906 721 651 683 814 849 945 790 772 714 796 CELE 1805 1551 1501 1563 1837 1886 1934 1992 1878 1593 1448 1559 CLWL 24 24 28 29 34 42 42 48 39 38 23 23 EMDE 1029 994 851 844 904 1070 1160 1171 1058 841 920 1042 GRRD 685 699 561 587 699 784 843 927 765 723 572 611 INDN 179 173 156 152 233 282 324 324 264 166 170 183 KACP 2506 2387 2233 2177 2761 3240 3600 3543 3142 2547 2391 2616 KACY 354 349 336 341 402 461 500 512 434 385 341 362 KAGE 1858 1850 1554 1773 2103 2417 2535 2785 2492 2322 1751 1851 KAPL 1880 1903 1598 1676 2024 2402 2687 2881 2513 2272 1725 1896 LAFA 340 314 286 344 391 433 453 456 436 388 301 306 LEPA 154 151 136 157 161 198 209 220 200 177 125 135 MIDW 213 213 190 190 222 235 329 338 285 260 207 227 MIPU 1486 1313 1228 1153 1436 1733 1929 1926 1646 1224 1299 1510 OKGE 4078 4002 4072 3791 4839 5611 5858 6106 5884 4506 3783 4054 OMPA 523 505 468 559 720 822 910 947 810 671 507 546 PSOK 2465 2439 2284 2555 3061 3678 4112 4135 3552 2836 2344 2390 SOEP 3943 3731 3452 3491 4076 4540 4927 4879 4482 3690 3254 3781 SPRM 463 451 410 450 545 672 732 796 680 570 492 482 SUNC 679 678 699 731 775 867 1016 1035 935 896 684 721 SWPA 678 708 566 581 556 878 824 904 792 771 534 610 SWPS 3511 3456 3403 3764 4524 4899 5369 5231 4380 3829 3589 3788 WEFA 1286 1231 1013 970 1017 1220 1309 1440 1224 1134 1050 1222 YAZO 15 14 15 17 23 27 28 30 27 23 14 15
Total: 30972 30042 27761 28546 34026 39211 42479 43571 38708 32634 28238 30726
Note:AEPW=PSOK & SOEPOMPA=OMPA+KPPWestar Energy = KAGE & KAPL
Page 13 of 60 Redacted Version 2008 EIA-411
cjh1006
Stamp
ITEM 1Projected Energy and Peak Demand for the First Ten Years
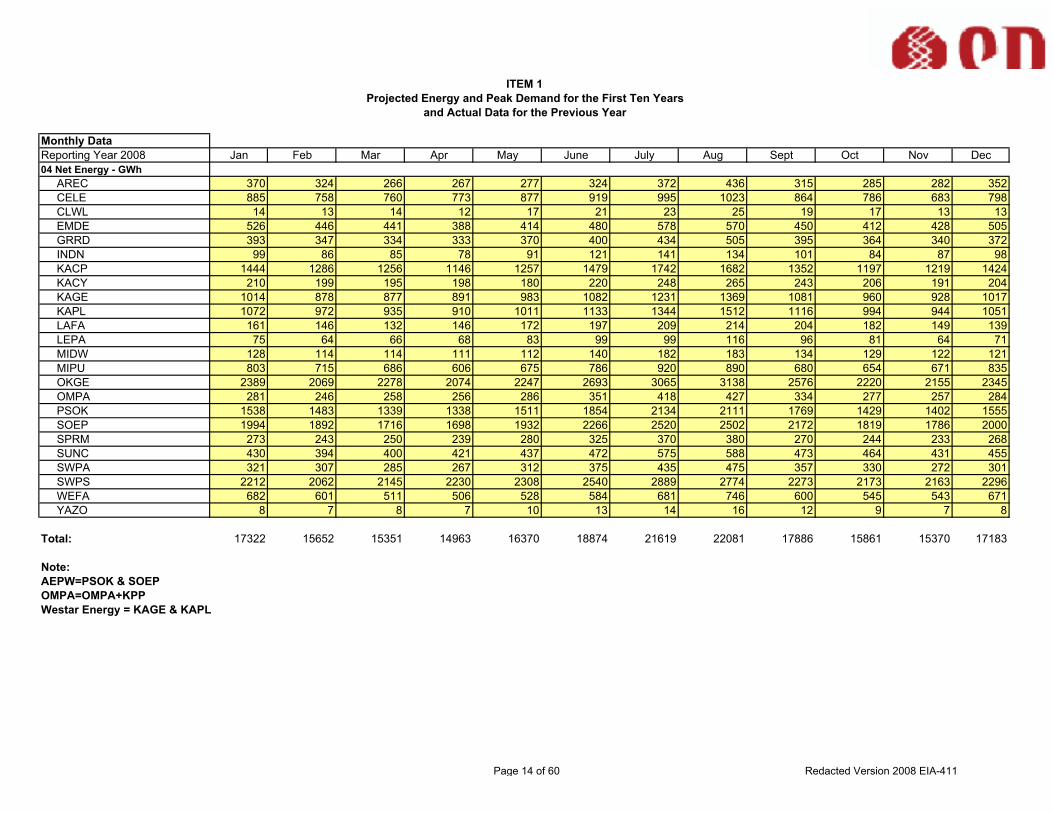
and Actual Data for the Previous Year Monthly DataReporting Year 2008 Jan Feb Mar Apr May June July Aug Sept Oct Nov Dec04 Net Energy - GWh AREC 370 324 266 267 277 324 372 436 315 285 282 352 CELE 885 758 760 773 877 919 995 1023 864 786 683 798 CLWL 14 13 14 12 17 21 23 25 19 17 13 13 EMDE 526 446 441 388 414 480 578 570 450 412 428 505 GRRD 393 347 334 333 370 400 434 505 395 364 340 372 INDN 99 86 85 78 91 121 141 134 101 84 87 98 KACP 1444 1286 1256 1146 1257 1479 1742 1682 1352 1197 1219 1424 KACY 210 199 195 198 180 220 248 265 243 206 191 204 KAGE 1014 878 877 891 983 1082 1231 1369 1081 960 928 1017 KAPL 1072 972 935 910 1011 1133 1344 1512 1116 994 944 1051 LAFA 161 146 132 146 172 197 209 214 204 182 149 139 LEPA 75 64 66 68 83 99 99 116 96 81 64 71 MIDW 128 114 114 111 112 140 182 183 134 129 122 121 MIPU 803 715 686 606 675 786 920 890 680 654 671 835 OKGE 2389 2069 2278 2074 2247 2693 3065 3138 2576 2220 2155 2345 OMPA 281 246 258 256 286 351 418 427 334 277 257 284 PSOK 1538 1483 1339 1338 1511 1854 2134 2111 1769 1429 1402 1555 SOEP 1994 1892 1716 1698 1932 2266 2520 2502 2172 1819 1786 2000 SPRM 273 243 250 239 280 325 370 380 270 244 233 268 SUNC 430 394 400 421 437 472 575 588 473 464 431 455 SWPA 321 307 285 267 312 375 435 475 357 330 272 301 SWPS 2212 2062 2145 2230 2308 2540 2889 2774 2273 2173 2163 2296 WEFA 682 601 511 506 528 584 681 746 600 545 543 671 YAZO 8 7 8 7 10 13 14 16 12 9 7 8
Total: 17322 15652 15351 14963 16370 18874 21619 22081 17886 15861 15370 17183
Note:AEPW=PSOK & SOEPOMPA=OMPA+KPPWestar Energy = KAGE & KAPL
Page 14 of 60 Redacted Version 2008 EIA-411
cjh1006
Stamp

ITEM 1Projected Energy and Peak Demand for the First Ten Years
and Actual Data for the Previous Year Monthly DataNext Year 2009 Jan Feb Mar Apr May June July Aug Sept Oct Nov Dec05 Peak Hour Demand - MW AREC 838 929 739 668 701 835 871 969 810 791 732 816 CELE 1757 1605 1420 1635 1787 1897 1969 2019 1856 1695 1422 1710 CLWL 25 25 29 30 35 42 42 48 40 39 24 24 EMDE 1060 1025 875 867 928 1091 1181 1204 1087 864 943 1072 GRRD 699 713 572 599 713 800 860 946 780 737 583 623 INDN 188 178 161 157 239 287 329 329 270 170 175 188 KACP 2566 2448 2277 2211 2799 3241 3604 3551 3148 2583 2438 2676 KACY 357 351 338 343 404 464 503 515 437 387 343 364 KAGE 1890 1882 1581 1803 2139 2459 2579 2833 2535 2362 1781 1883 KAPL 1936 1959 1646 1726 2084 2473 2767 2967 2589 2340 1776 1952 LAFA 341 319 291 349 397 440 460 463 442 394 305 311 LEPA 155 152 137 158 162 199 210 221 201 178 126 136 MIDW 214 214 191 191 223 236 330 340 286 261 208 228 MIPU 1504 1359 1258 1210 1475 1768 1985 1977 1749 1246 1344 1479 OKGE 4163 4086 4158 3870 4940 5729 5981 6234 6008 4601 3863 4139 OMPA 538 518 481 572 739 836 925 962 824 682 518 558 PSOK 2568 2510 2346 2661 3201 3833 4262 4301 3733 2980 2449 2460 SOEP 4049 3843 3563 3639 4241 4673 5066 5028 4563 3816 3370 3903 SPRM 480 460 420 455 580 684 750 813 690 575 500 505 SUNC 713 712 734 768 814 911 1067 1087 982 941 719 757 SWPA 684 715 571 587 561 886 832 913 800 778 540 616 SWPS 3597 3561 3490 3860 4640 5023 5505 5367 4490 3930 3682 3883 WEFA 1318 1300 1029 985 1033 1240 1329 1463 1244 1152 1067 1242 YAZO 15 15 15 18 24 27 29 30 27 23 14 15
Total: 31655 30879 28322 29362 34859 40074 43436 44580 39591 33525 28922 31540
Note:AEPW=PSOK & SOEPOMPA=OMPA+KPPWestar Energy = KAGE & KAPL
Page 15 of 60 Redacted Version 2008 EIA-411
cjh1006
Stamp

ITEM 1Projected Energy and Peak Demand for the First Ten Years
and Actual Data for the Previous Year Monthly DataNext Year 2009 Jan Feb Mar Apr May June July Aug Sept Oct Nov Dec06 Net Energy - GWh AREC 364 321 263 253 289 341 391 444 287 293 302 346 CELE 766 746 749 762 868 911 1010 1039 877 796 693 811 CLWL 14 13 14 13 17 21 23 26 19 17 13 13 EMDE 540 458 453 399 426 493 594 585 462 424 440 519 GRRD 401 354 341 340 377 408 443 515 403 371 347 379 INDN 101 88 87 80 93 124 144 136 103 87 90 101 KACP 1479 1272 1283 1168 1279 1501 1765 1704 1373 1219 1244 1455 KACY 211 200 196 199 181 222 249 267 244 207 192 205 KAGE 1023 886 885 899 992 1091 1242 1382 1091 968 936 1025 KAPL 1081 980 943 918 1019 1142 1355 1524 1125 1003 952 1062 LAFA 160 148 134 148 174 200 212 217 207 185 152 141 LEPA 75 65 66 69 84 99 100 116 97 82 65 71 MIDW 130 116 116 113 114 143 186 187 137 132 125 123 MIPU 811 745 705 643 696 804 953 917 745 665 699 809 OKGE 2437 2111 2324 2116 2292 2748 3128 3202 2628 2266 2199 2394 OMPA 290 253 265 263 295 358 427 436 341 282 264 291 PSOK 1583 1471 1383 1394 1581 1932 2215 2202 1852 1496 1469 1602 SOEP 2043 1878 1773 1768 2001 2336 2606 2583 2245 1876 1853 2064 SPRM 275 248 257 245 288 335 384 385 275 250 238 279 SUNC 451 414 420 442 459 495 604 618 497 488 453 477 SWPA 324 310 288 269 315 379 440 479 361 333 275 304 SWPS 2260 2078 2202 2288 2360 2600 2957 2841 2349 2226 2219 2350 WEFA 693 611 519 514 536 593 692 758 609 554 552 682 YAZO 8 7 8 8 10 13 14 16 12 9 7 8
Total: 17520 15773 15674 15311 16746 19289 22134 22579 18339 16229 15779 17511
Note:AEPW=PSOK & SOEPOMPA=OMPA+KPPWestar Energy = KAGE & KAPL
Page 16 of 60 Redacted Version 2008 EIA-411
cjh1006
Stamp

ITEM 1Projected Energy and Peak Demand for the First Ten Years
and Actual Data for the Previous Year
Actual Previous Year ActualTen Year Projection 2007 2008 2009 2010 2011 2012 2013 2014 2015 2016 201707 Peak Hour Demand Summer - MW AREC 879 945 969 1012 1056 1099 1142 1185 1228 1272 1313 CELE 2216 1992 2019 2079 2116 2147 2183 2221 2262 2304 2335 CLWL 47 48 48 49 50 50 51 52 52 53 54 EMDE 1173 1176 1207 1239 1272 1305 1339 1373 1409 1445 1481 GRRD 909 927 946 965 984 1004 1024 1044 1065 1086 1108 INDN 308 324 329 333 337 341 345 349 353 357 361 KACP 3638 3600 3604 3613 3621 3637 3665 3705 3739 3771 3796 KACY 512 512 515 519 526 528 532 537 542 544 546 KAGE 2597 2785 2833 2928 2964 2997 3031 3066 3101 3137 3171 KAPL 2830 2881 2967 3052 3064 3075 3088 3098 3110 3126 3139 LAFA 478 456 463 470 477 484 491 498 505 513 517 LEPA 227 220 221 222 223 224 225 226 227 228 229 MIDW 336 339 343 316 350 353 357 360 364 367 371 MIPU 1961 1929 1985 2027 2073 2122 2170 2220 2271 2324 2378 OKGE 6031 6106 6234 6328 6426 6507 6619 6725 6845 6955 7111 OMPA 830 947 962 1037 1053 1069 1085 1101 1118 1135 1152 PSOK 4175 4135 4281 4318 4351 4403 4447 4491 4523 4551 4583 SOEP 4920 4904 5047 5143 5210 5277 5340 5403 5465 5536 5611 SPRM 763 796 813 830 848 865 884 904 923 942 960 SUNC 995 1035 1087 1097 1106 1115 1125 1135 1146 1155 1165 SWPA 895 904 913 922 931 941 950 960 969 979 989 SWPS 5048 5369 5505 5643 5779 5909 6041 6173 6313 6456 6608 WEFA 1369 1440 1463 1485 1507 1528 1550 1570 1590 1610 1630 YAZO 30 30 30 30 31 31 31 31 32 32 32
Total: 43167 43800 44784 45657 46355 47011 47715 48427 49152 49878 50640
Note:AEPW=PSOK & SOEPOMPA=OMPA+KPPWestar Energy = KAGE & KAPL
Page 17 of 60 Redacted Version 2008 EIA-411
cjh1006
Stamp
ITEM 1
Projected Energy and Peak Demand for the First Ten Yearsand Actual Data for the Previous Year
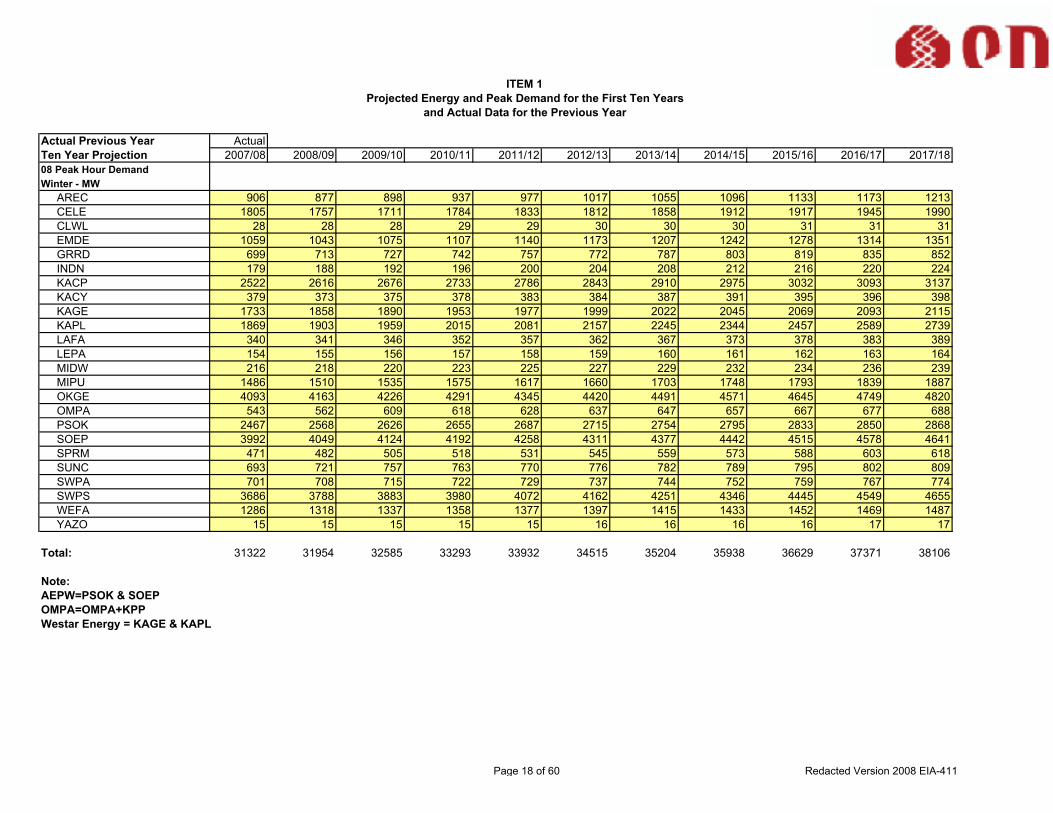
Actual Previous Year ActualTen Year Projection 2007/08 2008/09 2009/10 2010/11 2011/12 2012/13 2013/14 2014/15 2015/16 2016/17 2017/1808 Peak Hour Demand Winter - MW AREC 906 877 898 937 977 1017 1055 1096 1133 1173 1213 CELE 1805 1757 1711 1784 1833 1812 1858 1912 1917 1945 1990 CLWL 28 28 28 29 29 30 30 30 31 31 31 EMDE 1059 1043 1075 1107 1140 1173 1207 1242 1278 1314 1351 GRRD 699 713 727 742 757 772 787 803 819 835 852 INDN 179 188 192 196 200 204 208 212 216 220 224 KACP 2522 2616 2676 2733 2786 2843 2910 2975 3032 3093 3137 KACY 379 373 375 378 383 384 387 391 395 396 398 KAGE 1733 1858 1890 1953 1977 1999 2022 2045 2069 2093 2115 KAPL 1869 1903 1959 2015 2081 2157 2245 2344 2457 2589 2739 LAFA 340 341 346 352 357 362 367 373 378 383 389 LEPA 154 155 156 157 158 159 160 161 162 163 164 MIDW 216 218 220 223 225 227 229 232 234 236 239 MIPU 1486 1510 1535 1575 1617 1660 1703 1748 1793 1839 1887 OKGE 4093 4163 4226 4291 4345 4420 4491 4571 4645 4749 4820 OMPA 543 562 609 618 628 637 647 657 667 677 688 PSOK 2467 2568 2626 2655 2687 2715 2754 2795 2833 2850 2868 SOEP 3992 4049 4124 4192 4258 4311 4377 4442 4515 4578 4641 SPRM 471 482 505 518 531 545 559 573 588 603 618 SUNC 693 721 757 763 770 776 782 789 795 802 809 SWPA 701 708 715 722 729 737 744 752 759 767 774 SWPS 3686 3788 3883 3980 4072 4162 4251 4346 4445 4549 4655 WEFA 1286 1318 1337 1358 1377 1397 1415 1433 1452 1469 1487 YAZO 15 15 15 15 15 16 16 16 16 17 17
Total: 31322 31954 32585 33293 33932 34515 35204 35938 36629 37371 38106
Note:AEPW=PSOK & SOEPOMPA=OMPA+KPPWestar Energy = KAGE & KAPL
Page 18 of 60 Redacted Version 2008 EIA-411
cjh1006
Stamp

ITEM 1Projected Energy and Peak Demand for the First Ten Years
and Actual Data for the Previous Year
Actual Previous Year ActualTen Year Projection 2007 2008 2009 2010 2011 2012 2013 2014 2015 2016 201709 Net Annual Energy GWh AREC 3834 3869 3895 5629 5726 5841 5910 5822 6088 6180 6261 CELE 10644 10011 10028 10277 10405 10528 10668 10810 10954 11100 11248 CLWL 198 200 203 206 208 211 213 216 219 221 224 EMDE 5486 5638 5793 5934 6064 6198 6339 6484 6631 6782 6937 GRRD 4483 4573 4664 4757 4852 4949 5048 5149 5252 5357 5464 INDN 1190 1205 1234 1255 1277 1299 1322 1344 1367 1389 1412 KACP 16589 16499 16776 17077 17360 17702 17959 18295 18603 18943 19143 KACY 2589 2559 2572 2596 2634 2645 2668 2697 2722 2734 2745 KAGE 12921 12311 12420 12619 12852 13112 13368 13615 13867 14124 14387 KAPL 13080 12994 13104 13363 13601 13841 14072 14293 14519 14749 14983 LAFA 2029 2051 2078 2110 2141 2173 2205 2237 2270 2302 2324 LEPA 978 983 988 993 998 1003 1008 1013 1018 1023 1028 MIDW 1527 1550 1573 1597 1621 1645 1670 1695 1720 1746 1772 MIPU 8745 8922 9190 9408 9675 9959 10236 10524 10819 11125 11433 OKGE 28390 29249 29845 30425 30985 31547 32084 32701 33379 34104 34872 OMPA 3288 3674 3763 4144 4214 4283 4355 4427 4502 4577 4654 PSOK 19032 19465 20182 20561 20795 21165 21394 21669 21888 22148 22303 SOEP 23868 24297 25026 25447 25849 26335 26643 27023 27394 27881 28243 SPRM 3246 3375 3459 3541 3625 3711 3800 3891 3988 4078 4171 SUNC 5283 5482 5877 5939 6004 6072 6142 6214 6289 6366 6446 SWPA 3996 4036 4076 4117 4158 4200 4242 4284 4327 4370 4414 SWPS 27752 28066 28729 29409 30024 30575 31102 31694 32317 32991 33697 WEFA 7111 7197 7314 7422 7530 7632 7737 7835 7934 8031 8126 YAZO 118 119 120 120 121 121 121 122 122 122 122
Total: 206377 208325 212909 218946 222719 226747 230306 234054 238189 242443 246409
Note:AEPW=PSOK & SOEPOMPA=OMPA+KPPWestar Energy = KAGE & KAPL
Page 19 of 60 Redacted Version 2008 EIA-411
cjh1006
Stamp
ITEM 3
PROJECTED CAPACITY AND DEMAND FOR
TEN YEARS SUMMER AND WINTER
Page 20 of 60 Redacted Version 2008 EIA-411

ITEM 3
Projected Capacity and Demand for Ten Years
Report Capacity and Demand projected for the summer and winter peak periods of the ten-
year period. Peak demands reported here should agree with the corresponding entries in Item
1.
Capacity data reported in Item 3 is consistent with Item 2.
The information in Item 3 is to be reported in megawatts (MW) for each peak period on the
same basis as reported in Item 1 as follows:
Column number:
02 Total Internal Demand
Peak hour integrated megawatt demand is defined as the sum of the demands of all
customers that a system serves, including the demands of the organization providing the
electric service, plus the losses incidental to that service. Total Internal Demand is the
sum of the metered (net) outputs of all generators within the system and the metered line
flows into the system, less the metered line flows out of the system. The demand of
station service or auxiliary needs (such as fan motors, pump motors, and other equipment
essential to the operation of the generating units) is not included.
Internal Demand includes adjustments for utility indirect demand-side management pro-
grams such as conservation programs, improvements in efficiency of electric energy use,
rate incentives, and rebates. Internal Demand should not be reduced by Demand Side
Management, which is reported on Lines 2a through 2d.
The Internal Demand of nonmember systems of the Council or Reporting Party should be
included to the extent known.
2a Direct Control Load Management
The magnitude of customer demand that can be interrupted at the time of the Council or
Reporting Party seasonal peak by direct control of the System Operator by interrupting
power supply to individual appliances or equipment on customer premises. This type of
control usually reduces the demand of residential customers. Direct Control Load
Management as reported here does not include Interruptible Demand (Line 2b).
Line 02 (Internal Demand) should not incorporate the effect of this reduction in demand.
Page 21 of 60 Redacted Version 2008 EIA-411
2b Interruptible Demand
The magnitude of customer demand that, in accordance with contractual arrangements,
can be interrupted at the time of the Council or Reporting Party seasonal peak by direct
control of the System Operator or by action of the customer at the direct request of the
System Operator. In some instances, the demand reduction may be effected by direct
action of the System Operator (remote tripping) after notice to the customer in
accordance with contractual provisions. For example, demands that can be interrupted to
fulfill planning or operating reserve requirements normally should be reported as
Interruptible Demand. Interruptible Demand as reported here does not include Direct
Control Load Management (Line 2a).
Line 02 (Internal Demand) should not incorporate the effect of this reduction in demand.
2c Critical Peak-Pricing (CPP) with Control
The magnitude of demand-side management that combines direct remote control with a
pre-specified high price for use during designated critical peak periods, triggered by
system contingencies or high wholesale market prices.
Line 02 (Internal Demand) should not incorporate the effect of this reduction in demand.
2d Load as a Capacity Resource
The magnitude of demand-side resources that commit to pre-specified load reductions for
certain system conditions.
Line 02 (Internal Demand) should not incorporate the effect of this reduction in demand.
03 Net Internal Demand
Total Internal Demand less Direct Control Load Management and Interruptible Demand
and Critical Peak-Pricing with Control, and Load as a Capacity Resource.
Line 02 minus Line 2a minus Line 2b minus Line 2c minus Line 2d.
05 Total Internal Capacity
Is the sum of the values reported on Schedule 2, Column 8, for all generators
included by the reporting region.
5a Jointly Owned Unit Capacity
Is the capacity of all jointly owned units. The controlling area with the jointly
owned unit will have a negative value.
Page 22 of 60 Redacted Version 2008 EIA-411

5a1 Total Control Area Capacity
The sum of lines 5 and 5a.
6a Certain Capacity
Currently existing resources reasonably anticipated to be available to operate and is deliverable to or into the region.
6b Uncertain Capacity
Uncertain Capacity includes the total amount of generating resources that are
physically located in the Region, but are not dedicated to or contractually
committed to serve load in the Region. Includes mothballed and portion of
variable generation not included in “Certain”. GUIDANCE: This should include
all other existing capacity not considered certain (line 6a).
7a Planned Capacity Additions
This category is for capacity which has achieved one or more of the following
milestones:
• Construction has started
• At least one of the following regulatory permits approved
o Site permit
o Construction permit
o Environmental permit
• Corporate management has approved at least one of the following
o Included in a capital budget
o BOD approved
7b Proposed Capacity Additions
This category includes generation that is not in a prior listed category, but has been
identified through one or more of the following sources:
• Corporate announcement
• Included in integrated resource plan
• Generator Interconnection Queues
• Interconnection study requested
Page 23 of 60 Redacted Version 2008 EIA-411
09 Deliverable Internal Capacity
Total Control Area Capacity less Proposed less Transmission-Limited Resources less all
Derates less Energy Only less Inoperable.
10 Firm and Expected Purchases
The total of all capacity purchases where a firm contract has been signed and may be
recalled or where no contract has been executed, but in negotiation and is expected to be
firm.
11 Firm and Expected Sales The total of all capacity sales where a firm contract has been signed and may be recalled
or where no contract has been executed, but in negotiation and is expected to be firm.
12 Net Capacity Resources
Deliverable Internal Capacity plus the net of purchases and incoming
adjustment and sales and outgoing adjustments that are expected to be
firm. This excludes non-firm contracts.
Page 24 of 60 Redacted Version 2008 EIA-411

This page intentionally left blank.
Page 25 of 60 Redacted Version 2008 EIA-411

ITEM 3.1
PROJECTED CAPACITY AND DEMAND FOR
TEN YEARS
SUMMER
Page 26 of 60 Redacted Version 2008 EIA-411

02 2a 2b 2c 2d 03 05 5a 5a1 6b 7a 7b 9 10 11 12Direct Critical Load as a Total Jointly Total Proposed Firm and Firm and Net
Total Internal Control Load Interruptible Peak-Pricing Capacity Net Internal Internal Owned Control Area Capacity Expected Expected CapacitySystem Demand Management Demand with Control Resource Demand Capacity Units Capacity Additions Purchases Sales Resources
AREC 879 0 17 0 0 862 341 264 605 0 0 0 605 345 0 950 9.3% CELE 2216 0 184 0 0 2032 4208 -698 3510 1655 0 0 1855 250 0 2105 3.5% CLWL 47 0 0 0 47 0 376 0 376 0 0 0 376 22 308 90 99.7% EMDE 1173 0 0 0 0 1173 1377 85 1462 0 0 0 1462 162 204 1420 17.4% GRRD 909 0 0 0 0 909 1612 -198 1414 108 0 0 1306 163 207 1262 28.0% INDN 308 0 0 0 0 308 288 0 288 50 0 0 238 120 0 358 14.0% KACP 3638 0 0 0 71 3568 4513 -341 4172 85 0 0 4087 281 141 4227 15.6% KACY 512 0 0 0 0 512 753 0 753 140 0 0 613 94 58 649 21.1% KAGE 2597 0 88 0 0 2509 2704 263 2967 336 0 0 2631 90 90 2631 4.6% KAPL 2830 0 21 0 0 2809 3816 200 4016 116 0 0 3900 466 712 3654 23.1% LAFA 478 0 0 0 0 478 493 262 755 0 0 0 755 19 0 774 38.2% LEPA 227 0 0 0 0 227 188 105 293 0 0 0 293 6 58 241 5.8% MIDW 336 0 40 0 0 296 30 0 30 0 0 0 30 338 0 368 19.5% MIPU 1961 0 0 0 0 1961 1930 293 2223 369 0 0 1854 495 100 2249 12.8% OKGE 6031 0 112 0 0 5919 8463 -109 8354 1473 0 0 6881 31 95 6817 13.2% OMPA 830 0 0 0 0 830 475 239 714 43 0 0 671 339 9 1001 17.1% PSOK 4175 0 0 0 0 4175 7427 101 7528 3358 0 0 4170 614 0 4784 12.7% SOEP 4920 0 0 0 0 4920 5579 -2 5577 1090 0 0 4487 1177 70 5594 12.0% SPRM 763 0 0 0 0 763 788 0 788 0 0 0 788 131 39 880 13.3% SUNC 995 0 0 0 0 995 1035 0 1035 0 0 0 1035 174 0 1209 17.7% SWPA 895 0 0 0 0 895 2409 0 2409 153 0 0 2256 383 1662 977 8.4% SWPS 5048 114 15 0 0 4919 5932 0 5932 130 0 0 5802 90 133 5759 14.6% WEFA 1369 0 0 0 0 1369 1300 0 1300 95 0 0 1205 279 0 1484 7.7% YAZO 30 0 0 0 0 30 33 0 33 0 0 0 33 0 0 33 9.1%
Total: 43167 114 477 0 118 42459 56070 464 56534 9200 0 0 47334 6068 3886 49516 14.3%
Note:AEPW=PSOK & SOEPWestar Energy = KAGE & KAPLOMPA = OMPA+KPP
Deliverable Internal
Capacity
Item 3.1Projected Capacity and Demand for Ten Years
Summer 2007
Uncertain Capacity
Planned Capacity Additions
Control Area Capacity Margins
Page 27 of 60 Redacted Version 2008 EIA-411
cjh1006
Stamp
02 2a 2b 2c 2d 03 05 5a 5a1 6b 7a 7b 9 10 11 12Direct Critical Load as a Total Jointly Total Proposed Firm and Firm and Net
Total Internal Control Load Interruptible Peak-Pricing Capacity Net Internal Internal Owned Control Area Capacity Expected Expected CapacitySystem Demand Management Demand with Control Resource Demand Capacity Units Capacity Additions Purchases Sales Resources
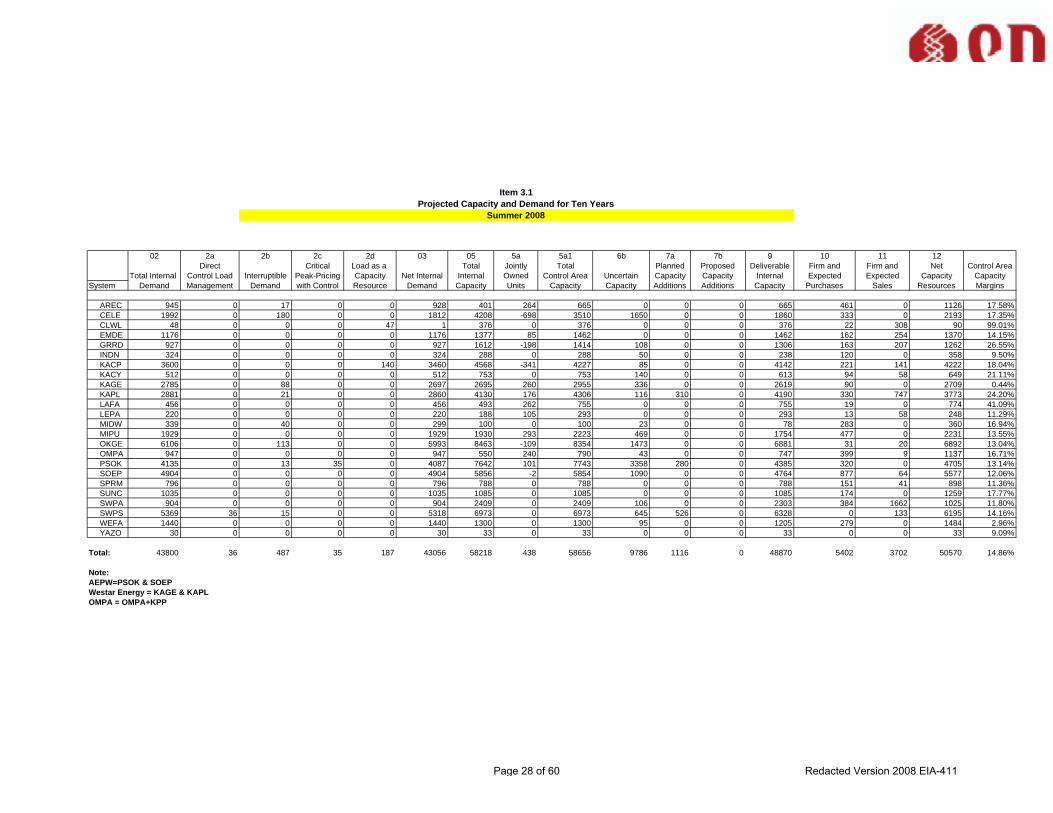
AREC 945 0 17 0 0 928 401 264 665 0 0 0 665 461 0 1126 17.58% CELE 1992 0 180 0 0 1812 4208 -698 3510 1650 0 0 1860 333 0 2193 17.35% CLWL 48 0 0 0 47 1 376 0 376 0 0 0 376 22 308 90 99.01% EMDE 1176 0 0 0 0 1176 1377 85 1462 0 0 0 1462 162 254 1370 14.15% GRRD 927 0 0 0 0 927 1612 -198 1414 108 0 0 1306 163 207 1262 26.55% INDN 324 0 0 0 0 324 288 0 288 50 0 0 238 120 0 358 9.50% KACP 3600 0 0 0 140 3460 4568 -341 4227 85 0 0 4142 221 141 4222 18.04% KACY 512 0 0 0 0 512 753 0 753 140 0 0 613 94 58 649 21.11% KAGE 2785 0 88 0 0 2697 2695 260 2955 336 0 0 2619 90 0 2709 0.44% KAPL 2881 0 21 0 0 2860 4130 176 4306 116 310 0 4190 330 747 3773 24.20% LAFA 456 0 0 0 0 456 493 262 755 0 0 0 755 19 0 774 41.09% LEPA 220 0 0 0 0 220 188 105 293 0 0 0 293 13 58 248 11.29% MIDW 339 0 40 0 0 299 100 0 100 23 0 0 78 283 0 360 16.94% MIPU 1929 0 0 0 0 1929 1930 293 2223 469 0 0 1754 477 0 2231 13.55% OKGE 6106 0 113 0 0 5993 8463 -109 8354 1473 0 0 6881 31 20 6892 13.04% OMPA 947 0 0 0 0 947 550 240 790 43 0 0 747 399 9 1137 16.71% PSOK 4135 0 13 35 0 4087 7642 101 7743 3358 280 0 4385 320 0 4705 13.14% SOEP 4904 0 0 0 0 4904 5856 -2 5854 1090 0 0 4764 877 64 5577 12.06% SPRM 796 0 0 0 0 796 788 0 788 0 0 0 788 151 41 898 11.36% SUNC 1035 0 0 0 0 1035 1085 0 1085 0 0 0 1085 174 0 1259 17.77% SWPA 904 0 0 0 0 904 2409 0 2409 106 0 0 2303 384 1662 1025 11.80% SWPS 5369 36 15 0 0 5318 6973 0 6973 645 526 0 6328 0 133 6195 14.16% WEFA 1440 0 0 0 0 1440 1300 0 1300 95 0 0 1205 279 0 1484 2.96% YAZO 30 0 0 0 0 30 33 0 33 0 0 0 33 0 0 33 9.09%
Total: 43800 36 487 35 187 43056 58218 438 58656 9786 1116 0 48870 5402 3702 50570 14.86%
Note:AEPW=PSOK & SOEPWestar Energy = KAGE & KAPLOMPA = OMPA+KPP
Item 3.1Projected Capacity and Demand for Ten Years
Summer 2008
Uncertain Capacity
Planned Capacity Additions
Deliverable Internal
Capacity
Control Area Capacity Margins
Page 28 of 60 Redacted Version 2008 EIA-411
cjh1006
Stamp

02 2a 2b 2c 2d 03 05 5a 5a1 6b 7a 7b 9 10 11 12Direct Critical Load as a Total Jointly Total Proposed Firm and Firm and Net
Total Internal Control Load Interruptible Peak-Pricing Capacity Net Internal Internal Owned Control Area Capacity Expected Expected CapacitySystem Demand Management Demand with Control Resource Demand Capacity Units Capacity Additions Purchases Sales Resources
AREC 969 0 17 0 0 952 401 264 665 0 0 0 665 463 0 1128 15.60% CELE 2019 0 181 0 0 1838 4208 -698 3510 1650 0 0 1860 275 0 2135 13.92% CLWL 48 0 0 0 47 1 376 0 376 0 0 0 376 22 308 90 98.34% EMDE 1207 0 0 0 0 1207 1389 85 1474 0 12 0 1474 162 204 1432 15.68% GRRD 946 0 0 0 0 946 2046 -198 1848 108 434 0 1740 13 231 1522 37.84% INDN 329 0 0 0 0 329 288 0 288 0 0 0 288 145 0 433 24.02% KACP 3604 0 0 0 158 3446 4568 -358 4210 85 0 0 4125 221 141 4205 18.05% KACY 515 0 0 0 0 515 753 0 753 140 0 0 613 44 58 599 14.02% KAGE 2833 0 88 0 0 2745 2695 260 2955 336 0 0 2619 109 0 2728 -0.62% KAPL 2967 0 21 0 0 2946 4580 176 4756 116 760 0 4640 484 747 4377 32.69% LAFA 463 0 0 0 0 463 493 262 755 0 0 0 755 19 0 774 40.18% LEPA 221 0 0 0 0 221 188 105 293 0 0 0 293 13 58 248 10.89% MIDW 343 0 41 0 0 302 149 0 149 44 0 0 105 283 0 388 22.06% MIPU 1985 0 0 0 0 1985 1930 293 2223 469 0 0 1754 177 0 1931 -2.78% OKGE 6234 0 116 0 0 6118 8514 -694 7820 1214 0 0 6606 31 20 6617 7.54% OMPA 962 0 0 0 0 962 550 395 945 43 0 0 902 319 9 1212 20.57% PSOK 4281 0 13 35 0 4233 7642 101 7743 3358 280 0 4385 456 0 4841 12.56% SOEP 5047 0 0 0 0 5047 5856 -2 5854 1090 0 0 4764 1018 64 5718 11.73% SPRM 813 0 0 0 0 813 788 0 788 0 0 0 788 101 44 845 3.79% SUNC 1087 0 0 0 0 1087 1109 0 1109 0 0 0 1109 174 0 1283 15.25% SWPA 913 0 0 0 0 913 2409 0 2409 80 0 0 2329 386 1662 1053 13.30% SWPS 5505 36 15 0 0 5454 7303 0 7303 645 526 330 6328 0 133 6195 11.96% WEFA 1463 0 0 0 0 1463 1435 0 1435 95 135 0 1340 279 0 1619 9.64% YAZO 30 0 0 0 0 30 33 0 33 0 0 0 33 0 0 33 9.09%
Total: 44786 36 492 35 205 44018 59703 -9 59694 9472 2147 330 49891 5193 3679 51406 14.37%
Note:AEPW=PSOK & SOEPWestar Energy = KAGE & KAPLOMPA = OMPA+KPP
Item 3.1Projected Capacity and Demand for Ten Years
Summer 2009
Uncertain Capacity
Planned Capacity Additions
Deliverable Internal
Capacity
Control Area Capacity Margins
Page 29 of 60 Redacted Version 2008 EIA-411
cjh1006
Stamp
02 2a 2b 2c 2d 03 05 5a 5a1 6b 7a 7b 9 10 11 12Direct Critical Load as a Total Jointly Total Proposed Firm and Firm and Net
Total Internal Control Load Interruptible Peak-Pricing Capacity Net Internal Internal Owned Control Area Capacity Expected Expected CapacitySystem Demand Management Demand with Control Resource Demand Capacity Units Capacity Additions Purchases Sales Resources
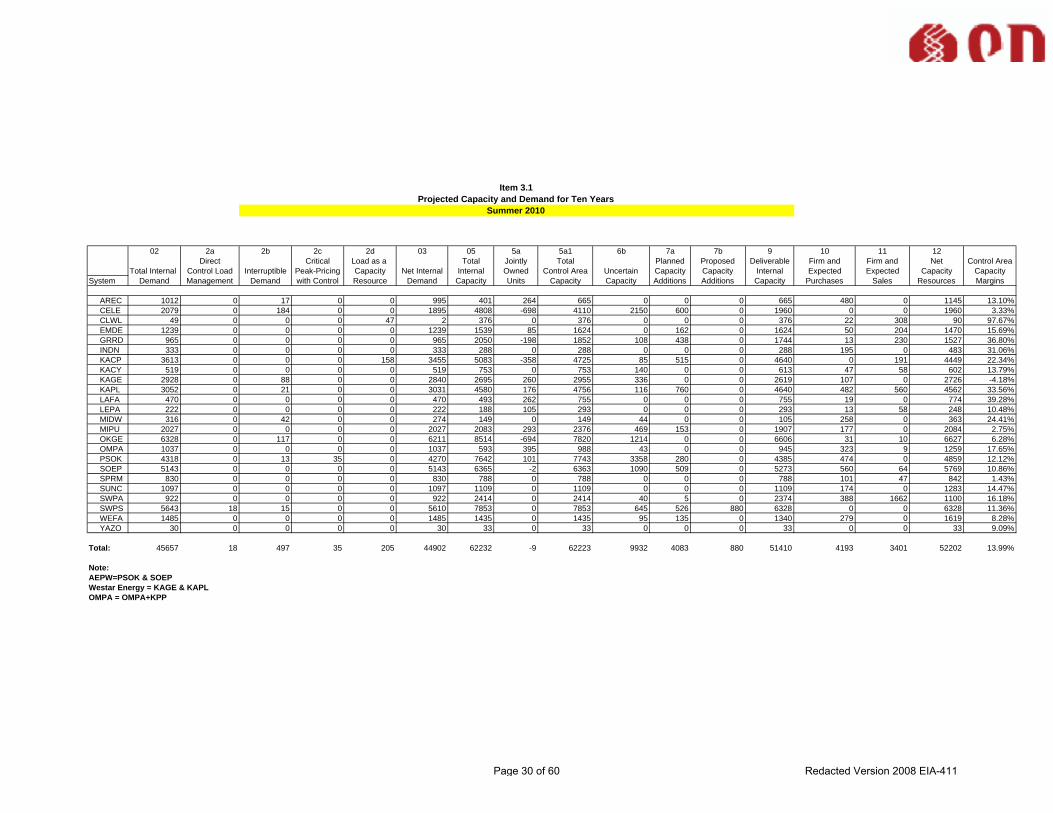
AREC 1012 0 17 0 0 995 401 264 665 0 0 0 665 480 0 1145 13.10% CELE 2079 0 184 0 0 1895 4808 -698 4110 2150 600 0 1960 0 0 1960 3.33% CLWL 49 0 0 0 47 2 376 0 376 0 0 0 376 22 308 90 97.67% EMDE 1239 0 0 0 0 1239 1539 85 1624 0 162 0 1624 50 204 1470 15.69% GRRD 965 0 0 0 0 965 2050 -198 1852 108 438 0 1744 13 230 1527 36.80% INDN 333 0 0 0 0 333 288 0 288 0 0 0 288 195 0 483 31.06% KACP 3613 0 0 0 158 3455 5083 -358 4725 85 515 0 4640 0 191 4449 22.34% KACY 519 0 0 0 0 519 753 0 753 140 0 0 613 47 58 602 13.79% KAGE 2928 0 88 0 0 2840 2695 260 2955 336 0 0 2619 107 0 2726 -4.18% KAPL 3052 0 21 0 0 3031 4580 176 4756 116 760 0 4640 482 560 4562 33.56% LAFA 470 0 0 0 0 470 493 262 755 0 0 0 755 19 0 774 39.28% LEPA 222 0 0 0 0 222 188 105 293 0 0 0 293 13 58 248 10.48% MIDW 316 0 42 0 0 274 149 0 149 44 0 0 105 258 0 363 24.41% MIPU 2027 0 0 0 0 2027 2083 293 2376 469 153 0 1907 177 0 2084 2.75% OKGE 6328 0 117 0 0 6211 8514 -694 7820 1214 0 0 6606 31 10 6627 6.28% OMPA 1037 0 0 0 0 1037 593 395 988 43 0 0 945 323 9 1259 17.65% PSOK 4318 0 13 35 0 4270 7642 101 7743 3358 280 0 4385 474 0 4859 12.12% SOEP 5143 0 0 0 0 5143 6365 -2 6363 1090 509 0 5273 560 64 5769 10.86% SPRM 830 0 0 0 0 830 788 0 788 0 0 0 788 101 47 842 1.43% SUNC 1097 0 0 0 0 1097 1109 0 1109 0 0 0 1109 174 0 1283 14.47% SWPA 922 0 0 0 0 922 2414 0 2414 40 5 0 2374 388 1662 1100 16.18% SWPS 5643 18 15 0 0 5610 7853 0 7853 645 526 880 6328 0 0 6328 11.36% WEFA 1485 0 0 0 0 1485 1435 0 1435 95 135 0 1340 279 0 1619 8.28% YAZO 30 0 0 0 0 30 33 0 33 0 0 0 33 0 0 33 9.09%
Total: 45657 18 497 35 205 44902 62232 -9 62223 9932 4083 880 51410 4193 3401 52202 13.99%
Note:AEPW=PSOK & SOEPWestar Energy = KAGE & KAPLOMPA = OMPA+KPP
Item 3.1Projected Capacity and Demand for Ten Years
Summer 2010
Uncertain Capacity
Planned Capacity Additions
Deliverable Internal
Capacity
Control Area Capacity Margins
Page 30 of 60 Redacted Version 2008 EIA-411
cjh1006
Stamp

02 2a 2b 2c 2d 03 05 5a 5a1 6b 7a 7b 9 10 11 12Direct Critical Load as a Total Jointly Total Proposed Firm and Firm and Net
Total Internal Control Load Interruptible Peak-Pricing Capacity Net Internal Internal Owned Control Area Capacity Expected Expected CapacitySystem Demand Management Demand with Control Resource Demand Capacity Units Capacity Additions Purchases Sales Resources
AREC 1056 0 17 0 0 1039 401 335 736 0 0 0 736 457 0 1193 12.91% CELE 2116 0 186 0 0 1930 4808 -698 4110 2150 600 0 1960 0 0 1960 1.55% CLWL 50 0 0 0 47 3 376 0 376 0 0 0 376 13 308 81 96.64% EMDE 1272 0 0 0 0 1272 1589 85 1674 0 162 50 1624 50 204 1470 13.48% GRRD 984 0 0 0 0 984 2054 -198 1856 108 442 0 1748 13 230 1531 35.73% INDN 337 0 0 0 0 337 288 0 288 0 0 0 288 105 0 393 14.25% KACP 3621 0 0 0 158 3463 5083 -340 4743 85 515 0 4658 0 101 4557 24.01% KACY 526 0 0 0 0 526 828 0 828 140 75 0 688 47 58 677 22.30% KAGE 2964 0 88 0 0 2876 2729 243 2972 336 0 0 2636 107 0 2743 -4.85% KAPL 3064 0 21 0 0 3043 4580 177 4757 116 760 0 4641 481 560 4562 33.30% LAFA 477 0 0 0 0 477 493 262 755 0 0 0 755 19 0 774 38.37% LEPA 223 0 0 0 0 223 188 105 293 0 0 0 293 13 58 248 10.08% MIDW 350 0 42 0 0 308 149 0 149 44 0 0 105 258 0 363 15.03% MIPU 2073 0 0 0 0 2073 2083 293 2376 469 153 0 1907 77 0 1984 -4.46% OKGE 6426 0 119 0 0 6307 8514 -694 7820 1214 0 0 6606 31 10 6627 4.83% OMPA 1053 0 0 0 0 1053 593 395 988 43 0 0 945 323 9 1259 16.41% PSOK 4351 0 13 35 0 4303 7642 101 7743 3358 280 0 4385 82 0 4467 3.68% SOEP 5210 0 0 0 0 5210 6365 -2 6363 1090 509 0 5273 561 64 5770 9.71% SPRM 848 0 0 0 0 848 1063 0 1063 0 275 0 1063 101 50 1114 23.88% SUNC 1106 0 0 0 0 1106 1109 0 1109 0 0 0 1109 174 0 1283 13.77% SWPA 931 0 0 0 0 931 2414 0 2414 40 5 0 2374 388 1662 1100 15.36% SWPS 5779 18 15 0 0 5746 7853 0 7853 645 526 880 6328 0 0 6328 9.20% WEFA 1507 0 0 0 0 1507 1435 0 1435 95 135 0 1340 279 0 1619 6.92% YAZO 31 0 0 0 0 31 33 0 33 0 0 0 33 0 0 33 6.06%
Total: 46354 18 501 35 205 45594 62670 64 62734 9932 4437 930 51871 3579 3314 52136 12.55%
Note:AEPW=PSOK & SOEPWestar Energy = KAGE & KAPLOMPA = OMPA+KPP
Item 3.1Projected Capacity and Demand for Ten Years
Summer 2011
Uncertain Capacity
Planned Capacity Additions
Deliverable Internal
Capacity
Control Area Capacity Margins
Page 31 of 60 Redacted Version 2008 EIA-411
cjh1006
Stamp

02 2a 2b 2c 2d 03 05 5a 5a1 6b 7a 7b 9 10 11 12Direct Critical Load as a Total Jointly Total Proposed Firm and Firm and Net
Total Internal Control Load Interruptible Peak-Pricing Capacity Net Internal Internal Owned Control Area Capacity Expected Expected CapacitySystem Demand Management Demand with Control Resource Demand Capacity Units Capacity Additions Purchases Sales Resources
AREC 1099 0 17 0 0 1082 401 335 736 0 0 0 736 474 0 1210 10.58% CELE 2147 0 188 0 0 1959 4808 -698 4110 2150 600 0 1960 0 0 1960 0.04% CLWL 50 0 0 0 47 3 376 0 376 0 0 0 376 13 308 81 95.87% EMDE 1305 0 0 0 0 1305 1589 85 1674 0 162 50 1624 50 204 1470 11.22% GRRD 1004 0 0 0 0 1004 2058 -198 1860 108 446 0 1752 13 230 1535 34.59% INDN 341 0 0 0 0 341 288 0 288 0 0 0 288 105 0 393 13.23% KACP 3637 0 0 0 158 3479 5070 -334 4736 85 515 0 4651 0 101 4550 23.53% KACY 528 0 0 0 0 528 828 0 828 140 75 0 688 47 58 677 22.01% KAGE 2997 0 88 0 0 2909 2729 243 2972 336 0 0 2636 107 0 2743 -6.05% KAPL 3075 0 21 0 0 3054 4580 177 4757 116 760 0 4641 480 560 4561 33.04% LAFA 484 0 0 0 0 484 493 262 755 0 0 0 755 19 0 774 37.47% LEPA 224 0 0 0 0 224 188 105 293 0 0 0 293 13 58 248 9.68% MIDW 353 0 43 0 0 310 149 0 149 44 0 0 105 258 0 363 14.48% MIPU 2122 0 0 0 0 2122 2083 293 2376 469 153 0 1907 77 0 1984 -6.93% OKGE 6507 0 121 0 0 6386 8514 -694 7820 1214 0 0 6606 31 10 6627 3.64% OMPA 1069 0 0 0 0 1069 634 395 1029 43 41 0 986 323 9 1300 17.83% PSOK 4403 0 13 35 0 4355 8077 101 8178 3358 280 492 4328 123 0 4451 2.17% SOEP 5277 0 0 0 0 5277 6811 -2 6809 1090 956 0 5719 561 97 6183 14.65% SPRM 865 0 0 0 0 865 1063 0 1063 0 275 0 1063 101 53 1111 22.14% SUNC 1115 0 0 0 0 1115 1109 0 1109 0 0 0 1109 174 0 1283 13.07% SWPA 941 0 0 0 0 941 2414 0 2414 20 5 0 2394 388 1662 1120 15.98% SWPS 5909 18 15 0 0 5876 7853 0 7853 645 526 880 6328 0 0 6328 7.14% WEFA 1528 0 0 0 0 1528 1435 0 1435 95 135 0 1340 279 0 1619 5.62% YAZO 31 0 0 0 0 31 33 0 33 0 0 0 33 0 0 33 6.06%
Total: 47012 18 506 35 205 46248 63583 70 63653 9912 4929 1422 52318 3636 3350 52604 12.08%
Note:AEPW=PSOK & SOEPWestar Energy = KAGE & KAPLOMPA = OMPA+KPP
Item 3.1Projected Capacity and Demand for Ten Years
Summer 2012
Uncertain Capacity
Planned Capacity Additions
Deliverable Internal
Capacity
Control Area Capacity Margins
Page 32 of 60 Redacted Version 2008 EIA-411
cjh1006
Stamp

02 2a 2b 2c 2d 03 05 5a 5a1 6b 7a 7b 9 10 11 12Direct Critical Load as a Total Jointly Total Proposed Firm and Firm and Net
Total Internal Control Load Interruptible Peak-Pricing Capacity Net Internal Internal Owned Control Area Capacity Expected Expected CapacitySystem Demand Management Demand with Control Resource Demand Capacity Units Capacity Additions Purchases Sales Resources
AREC 1142 0 17 0 0 1125 401 329 730 0 0 0 730 411 0 1141 1.40% CELE 2183 0 190 0 0 1993 4808 -698 4110 2150 600 0 1960 0 0 1960 -1.69% CLWL 51 0 0 0 47 4 376 0 376 0 0 0 376 13 308 81 95.09% EMDE 1339 0 0 0 0 1339 1589 85 1674 0 162 50 1624 50 204 1470 8.92% GRRD 1024 0 0 0 0 1024 2058 -198 1860 108 446 0 1752 13 230 1535 33.29% INDN 345 0 0 0 0 345 288 0 288 0 0 0 288 105 0 393 12.21% KACP 3665 0 0 0 158 3507 5056 -327 4729 85 515 0 4644 0 50 4594 23.67% KACY 532 0 0 0 0 532 828 0 828 140 75 0 688 47 58 677 21.42% KAGE 3031 0 88 0 0 2943 2729 243 2972 336 0 0 2636 107 0 2743 -7.29% KAPL 3088 0 21 0 0 3067 4730 177 4907 116 760 150 4641 479 510 4610 33.47% LAFA 491 0 0 0 0 491 493 262 755 0 0 0 755 19 0 774 36.56% LEPA 225 0 0 0 0 225 188 105 293 0 0 0 293 13 58 248 9.27% MIDW 357 0 43 0 0 314 149 0 149 44 0 0 105 283 0 388 18.97% MIPU 2170 0 0 0 0 2170 2083 293 2376 469 153 0 1907 77 0 1984 -9.35% OKGE 6619 0 123 0 0 6496 8500 -694 7806 1214 0 0 6592 31 0 6623 1.92% OMPA 1085 0 0 0 0 1085 634 395 1029 43 41 0 986 323 9 1300 16.59% PSOK 4447 0 13 35 0 4399 8385 101 8486 3358 280 808 4320 90 0 4410 0.24% SOEP 5340 0 0 0 0 5340 6799 -2 6797 1090 956 0 5707 561 64 6204 13.92% SPRM 884 0 0 0 0 884 1063 0 1063 0 275 0 1063 50 56 1057 16.37% SUNC 1125 0 0 0 0 1125 1109 0 1109 0 0 0 1109 174 0 1283 12.29% SWPA 950 0 0 0 0 950 2409 0 2409 0 0 0 2409 388 1662 1135 16.30% SWPS 6041 18 15 0 0 6008 7853 0 7853 645 526 880 6328 0 0 6328 5.06% WEFA 1550 0 0 0 0 1550 1769 0 1769 95 510 0 1674 279 0 1953 20.63% YAZO 31 0 0 0 0 31 33 0 33 0 0 0 33 0 0 33 6.06%
Total: 47715 18 510 35 205 46947 64330 71 64401 9892 5299 1888 52620 3513 3209 52924 11.29%
Note:AEPW=PSOK & SOEPWestar Energy = KAGE & KAPLOMPA = OMPA+KPP
Item 3.1Projected Capacity and Demand for Ten Years
Summer 2013
Uncertain Capacity
Planned Capacity Additions
Deliverable Internal
Capacity
Control Area Capacity Margins
Page 33 of 60 Redacted Version 2008 EIA-411
cjh1006
Stamp

02 2a 2b 2c 2d 03 05 5a 5a1 6b 7a 7b 9 10 11 12Direct Critical Load as a Total Jointly Total Proposed Firm and Firm and Net
Total Internal Control Load Interruptible Peak-Pricing Capacity Net Internal Internal Owned Control Area Capacity Expected Expected CapacitySystem Demand Management Demand with Control Resource Demand Capacity Units Capacity Additions Purchases Sales Resources
AREC 1185 0 17 0 0 1168 401 329 730 0 0 0 730 373 0 1103 -5.89% CELE 2221 0 192 0 0 2029 4808 -698 4110 2150 600 0 1960 0 0 1960 -3.51% CLWL 52 0 0 0 47 5 376 0 376 0 0 0 376 13 308 81 94.30% EMDE 1373 0 0 0 0 1373 1689 85 1774 0 162 150 1624 50 204 1470 6.57% GRRD 1044 0 0 0 0 1044 2058 -198 1860 108 446 0 1752 13 230 1535 31.99% INDN 349 0 0 0 0 349 288 0 288 0 0 0 288 105 0 393 11.20% KACP 3705 0 0 0 158 3547 5056 -327 4729 85 515 0 4644 0 50 4594 22.79% KACY 537 0 0 0 0 537 828 0 828 140 75 0 688 47 58 677 20.68% KAGE 3066 0 88 0 0 2978 2729 243 2972 336 0 0 2636 107 0 2743 -8.57% KAPL 3098 0 21 0 0 3077 4730 177 4907 116 760 150 4641 478 450 4669 34.10% LAFA 498 0 0 0 0 498 493 262 755 0 0 0 755 19 0 774 35.66% LEPA 226 0 0 0 0 226 188 105 293 0 0 0 293 13 58 248 8.87% MIDW 360 0 44 0 0 316 149 0 149 44 0 0 105 283 0 388 18.45% MIPU 2220 0 0 0 0 2220 2083 293 2376 469 153 0 1907 2 0 1909 -16.27% OKGE 6725 0 125 0 0 6600 8500 -694 7806 1214 0 0 6592 31 0 6623 0.35% OMPA 1101 0 0 0 0 1101 634 395 1029 43 41 0 986 297 0 1283 14.16% PSOK 4491 0 13 35 0 4443 8385 101 8486 3358 280 808 4320 90 0 4410 -0.75% SOEP 5403 0 0 0 0 5403 6782 -2 6780 1090 956 0 5690 561 64 6187 12.66% SPRM 904 0 0 0 0 904 1063 0 1063 0 275 0 1063 50 59 1054 14.23% SUNC 1135 0 0 0 0 1135 1109 0 1109 0 0 0 1109 174 0 1283 11.51% SWPA 960 0 0 0 0 960 2409 0 2409 0 0 0 2409 388 1662 1135 15.42% SWPS 6173 18 15 0 0 6140 7853 0 7853 645 526 880 6328 0 0 6328 2.97% WEFA 1570 0 0 0 0 1570 1769 0 1769 95 510 0 1674 279 0 1953 19.61% YAZO 31 0 0 0 0 31 33 0 33 0 0 0 33 0 0 33 6.06%
Total: 48428 18 515 35 205 47655 64413 71 64484 9892 5299 1988 52603 3372 3143 52832 9.80%
Note:AEPW=PSOK & SOEPWestar Energy = KAGE & KAPLOMPA = OMPA+KPP
Item 3.1Projected Capacity and Demand for Ten Years
Summer 2014
Uncertain Capacity
Planned Capacity Additions
Deliverable Internal
Capacity
Control Area Capacity Margins
Page 34 of 60 Redacted Version 2008 EIA-411
cjh1006
Stamp

02 2a 2b 2c 2d 03 05 5a 5a1 6b 7a 7b 9 10 11 12Direct Critical Load as a Total Jointly Total Proposed Firm and Firm and Net
Total Internal Control Load Interruptible Peak-Pricing Capacity Net Internal Internal Owned Control Area Capacity Expected Expected CapacitySystem Demand Management Demand with Control Resource Demand Capacity Units Capacity Additions Purchases Sales Resources
AREC 1228 0 17 0 0 1211 901 329 1230 0 500 0 1230 225 0 1455 16.77% CELE 2262 0 194 0 0 2068 4808 -698 4110 2150 600 0 1960 0 0 1960 -5.49% CLWL 52 0 0 0 47 5 376 0 376 0 0 0 376 13 308 81 93.50% EMDE 1409 0 0 0 0 1409 1739 85 1824 0 212 150 1674 50 204 1520 7.33% GRRD 1065 0 0 0 0 1065 2058 -198 1860 108 446 0 1752 13 230 1535 30.62% INDN 353 0 0 0 0 353 288 0 288 0 0 0 288 105 0 393 10.18% KACP 3739 0 0 0 158 3581 5056 -327 4729 85 515 0 4644 0 50 4594 22.05% KACY 542 0 0 0 0 542 828 0 828 140 75 0 688 47 58 677 19.94% KAGE 3101 0 88 0 0 3013 2619 243 2862 336 0 0 2526 107 0 2633 -14.43% KAPL 3110 0 21 0 0 3089 5080 177 5257 116 760 500 4641 477 275 4843 36.22% LAFA 505 0 0 0 0 505 493 262 755 0 0 0 755 19 0 774 34.75% LEPA 227 0 0 0 0 227 188 105 293 0 0 0 293 13 58 248 8.47% MIDW 364 0 44 0 0 320 149 0 149 44 0 0 105 283 0 388 17.42% MIPU 2271 0 0 0 0 2271 2083 293 2376 469 153 0 1907 2 0 1909 -18.94% OKGE 6845 0 127 0 0 6718 8500 -694 7806 1214 0 0 6592 31 0 6623 -1.44% OMPA 1118 0 0 0 0 1118 634 395 1029 43 41 0 986 309 0 1295 13.67% PSOK 4523 0 13 35 0 4475 8385 101 8486 3358 280 808 4320 90 0 4410 -1.46% SOEP 5465 0 0 0 0 5465 6782 -2 6780 1090 956 0 5690 569 64 6195 11.78% SPRM 923 0 0 0 0 923 1063 0 1063 0 275 0 1063 50 62 1051 12.18% SUNC 1146 0 0 0 0 1146 1109 0 1109 0 0 0 1109 174 0 1283 10.65% SWPA 969 0 0 0 0 969 2409 0 2409 0 0 0 2409 388 1662 1135 14.63% SWPS 6313 18 15 0 0 6280 7853 0 7853 645 526 880 6328 0 0 6328 0.77% WEFA 1590 0 0 0 0 1590 1769 0 1769 95 510 0 1674 279 0 1953 18.59% YAZO 32 0 0 0 0 32 33 0 33 0 0 0 33 0 0 33 3.03%
Total: 49152 18 519 35 205 48375 65203 71 65274 9892 5849 2338 53043 3243 2971 53315 9.27%
Note:AEPW=PSOK & SOEPWestar Energy = KAGE & KAPLOMPA = OMPA+KPP
Item 3.1Projected Capacity and Demand for Ten Years
Summer 2015
Uncertain Capacity
Planned Capacity Additions
Deliverable Internal
Capacity
Control Area Capacity Margins
Page 35 of 60 Redacted Version 2008 EIA-411
cjh1006
Stamp

02 2a 2b 2c 2d 03 05 5a 5a1 6b 7a 7b 9 10 11 12Direct Critical Load as a Total Jointly Total Proposed Firm and Firm and Net
Total Internal Control Load Interruptible Peak-Pricing Capacity Net Internal Internal Owned Control Area Capacity Expected Expected CapacitySystem Demand Management Demand with Control Resource Demand Capacity Units Capacity Additions Purchases Sales Resources
AREC 1272 0 17 0 0 1255 901 329 1230 0 500 0 1230 253 0 1483 15.37% CELE 2304 0 196 0 0 2107 4808 -698 4110 2150 600 0 1960 0 0 1960 -7.52% CLWL 53 0 0 0 47 6 376 0 376 0 0 0 376 13 308 81 92.69% EMDE 1445 0 0 0 0 1445 1739 85 1824 0 212 150 1674 50 204 1520 4.96% GRRD 1086 0 0 0 0 1086 2058 -198 1860 108 446 0 1752 13 230 1535 29.25% INDN 357 0 0 0 0 357 288 0 288 0 0 0 288 105 0 393 9.16% KACP 3771 0 0 0 158 3612 5056 -327 4729 85 515 0 4644 0 50 4594 21.37% KACY 544 0 0 0 0 544 828 0 828 140 75 0 688 47 58 677 19.65% KAGE 3137 0 88 0 0 3049 2635 238 2873 336 0 0 2537 107 0 2644 -15.32% KAPL 3126 0 21 0 0 3105 5080 178 5258 116 760 500 4642 476 200 4918 36.86% LAFA 513 0 0 0 0 513 493 262 755 0 0 0 755 19 0 774 33.72% LEPA 228 0 0 0 0 228 188 105 293 0 0 0 293 13 58 248 8.06% MIDW 367 0 45 0 0 322 149 0 149 44 0 0 105 283 0 388 16.90% MIPU 2324 0 0 0 0 2324 2083 293 2376 469 153 0 1907 2 0 1909 -21.71% OKGE 6955 0 129 0 0 6826 8493 -694 7799 1214 0 0 6585 31 0 6616 -3.17% OMPA 1135 0 0 0 0 1135 634 395 1029 43 41 0 986 321 0 1307 13.17% PSOK 4551 0 13 35 0 4503 8385 101 8486 3358 280 808 4320 90 0 4410 -2.10% SOEP 5536 0 0 0 0 5536 7152 -2 7150 1090 956 370 5690 569 64 6195 10.64% SPRM 942 0 0 0 0 942 1063 0 1063 0 275 0 1063 50 65 1048 10.12% SUNC 1155 0 0 0 0 1155 1109 0 1109 0 0 0 1109 174 0 1283 9.95% SWPA 979 0 0 0 0 979 2409 0 2409 0 0 0 2409 388 1662 1135 13.74% SWPS 6456 18 15 0 0 6423 7853 0 7853 645 526 880 6328 0 0 6328 -1.50% WEFA 1610 0 0 0 0 1610 1769 0 1769 95 510 0 1674 279 0 1953 17.56% YAZO 32 0 0 0 0 32 33 0 33 0 0 0 33 0 0 33 3.03%
Total: 49876 18 524 35 205 49094 65582 67 65649 9892 5849 2708 53048 3282 2899 53431 8.12%
Note:AEPW=PSOK & SOEPWestar Energy = KAGE & KAPLOMPA = OMPA+KPP
Item 3.1Projected Capacity and Demand for Ten Years
Summer 2016
Uncertain Capacity
Planned Capacity Additions
Deliverable Internal
Capacity
Control Area Capacity Margins
Page 36 of 60 Redacted Version 2008 EIA-411
cjh1006
Stamp

02 2a 2b 2c 2d 03 05 5a 5a1 6b 7a 7b 9 10 11 12Direct Critical Load as a Total Jointly Total Proposed Firm and Firm and Net
Total Internal Control Load Interruptible Peak-Pricing Capacity Net Internal Internal Owned Control Area Capacity Expected Expected CapacitySystem Demand Management Demand with Control Resource Demand Capacity Units Capacity Additions Purchases Sales Resources
AREC 1313 0 17 0 0 1296 901 329 1230 0 500 0 1230 254 0 1484 12.67% CELE 2335 0 198 0 0 2136 4808 -698 4110 2150 600 0 1960 0 0 1960 -9.00% CLWL 54 0 0 0 47 7 376 0 376 0 0 0 376 13 308 81 91.87% EMDE 1481 0 0 0 0 1481 1789 85 1874 0 212 200 1674 50 204 1520 2.55% GRRD 1108 0 0 0 0 1108 2058 -198 1860 108 446 0 1752 13 230 1535 27.82% INDN 361 0 0 0 0 361 288 0 288 0 0 0 288 105 0 393 8.14% KACP 3796 0 0 0 158 3638 5021 -323 4698 85 515 0 4613 0 50 4563 20.28% KACY 546 0 0 0 0 546 828 0 828 140 75 0 688 47 58 677 19.35% KAGE 3171 0 88 0 0 3083 2643 234 2877 336 0 0 2541 107 0 2648 -16.43% KAPL 3139 0 21 0 0 3118 5080 178 5258 116 760 500 4642 476 200 4918 36.60% LAFA 517 0 0 0 0 517 493 262 755 0 0 0 755 19 0 774 33.20% LEPA 229 0 0 0 0 229 188 105 293 0 0 0 293 13 58 248 7.66% MIDW 371 0 45 0 0 326 149 0 149 44 0 0 105 283 0 388 15.87% MIPU 2378 0 0 0 0 2378 2083 293 2376 469 153 0 1907 2 0 1909 -24.54% OKGE 7111 0 132 0 0 6979 8493 -694 7799 1214 0 0 6585 31 0 6616 -5.49% OMPA 1152 0 0 0 0 1152 634 395 1029 43 41 0 986 333 0 1319 12.67% PSOK 4583 0 13 35 0 4535 8385 101 8486 3358 280 808 4320 90 0 4410 -2.83% SOEP 5611 0 0 0 0 5611 7131 -2 7129 1090 956 370 5669 577 64 6182 9.23% SPRM 960 0 0 0 0 960 1063 0 1063 0 275 0 1063 50 68 1045 8.14% SUNC 1165 0 0 0 0 1165 1109 0 1109 0 0 0 1109 174 0 1283 9.17% SWPA 989 0 0 0 0 989 2409 0 2409 0 0 0 2409 388 1662 1135 12.86% SWPS 6608 18 15 0 0 6575 7853 0 7853 645 526 880 6328 0 0 6328 -3.90% WEFA 1630 0 0 0 0 1630 1769 0 1769 95 510 0 1674 279 0 1953 16.54% YAZO 32 0 0 0 0 32 33 0 33 0 0 0 33 0 0 33 3.03%
Total: 50640 18 529 35 205 49853 65584 67 65651 9892 5849 2758 53000 3303 2902 53402 6.65%
Note:AEPW=PSOK & SOEPWestar Energy = KAGE & KAPLOMPA = OMPA+KPP
Item 3.1
Uncertain Capacity
Planned Capacity Additions
Deliverable Internal
Capacity
Projected Capacity and Demand for Ten YearsSummer 2017
Control Area Capacity Margins
Page 37 of 60 Redacted Version 2008 EIA-411
cjh1006
Stamp

ITEM 3.2
PROJECTED CAPACITY AND DEMAND FOR
TEN YEARS
WINTER
Page 38 of 60 Redacted Version 2008 EIA-411
02 2a 2b 2c 2d 03 05 5a 5a1 6b 7a 7b 9 10 11 12Direct Critical Load as a Total Jointly Total Proposed Firm and Firm and Net
Total Internal Control Load Interruptible Peak-Pricing Capacity Net Internal Internal Owned Control Area Capacity Expected Expected CapacitySystem Demand Management Demand with Control Resource Demand Capacity Units Capacity Additions Purchases Sales Resources
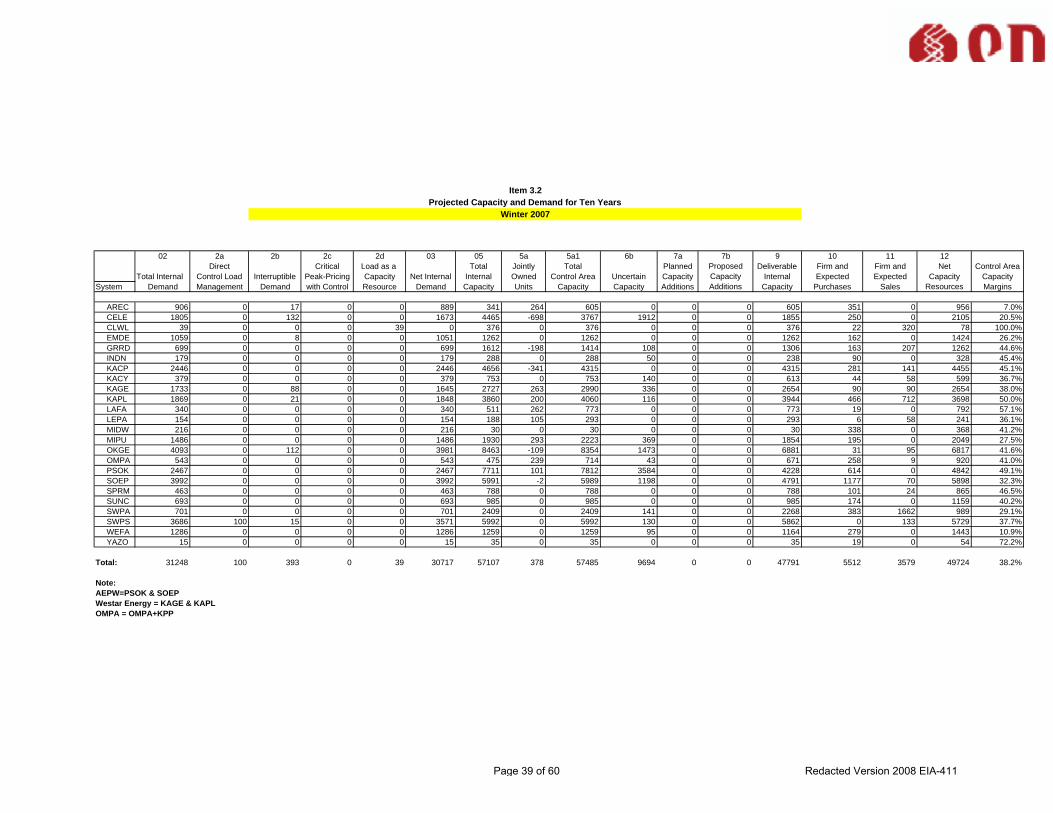
AREC 906 0 17 0 0 889 341 264 605 0 0 0 605 351 0 956 7.0% CELE 1805 0 132 0 0 1673 4465 -698 3767 1912 0 0 1855 250 0 2105 20.5% CLWL 39 0 0 0 39 0 376 0 376 0 0 0 376 22 320 78 100.0% EMDE 1059 0 8 0 0 1051 1262 0 1262 0 0 0 1262 162 0 1424 26.2% GRRD 699 0 0 0 0 699 1612 -198 1414 108 0 0 1306 163 207 1262 44.6% INDN 179 0 0 0 0 179 288 0 288 50 0 0 238 90 0 328 45.4% KACP 2446 0 0 0 0 2446 4656 -341 4315 0 0 0 4315 281 141 4455 45.1% KACY 379 0 0 0 0 379 753 0 753 140 0 0 613 44 58 599 36.7% KAGE 1733 0 88 0 0 1645 2727 263 2990 336 0 0 2654 90 90 2654 38.0% KAPL 1869 0 21 0 0 1848 3860 200 4060 116 0 0 3944 466 712 3698 50.0% LAFA 340 0 0 0 0 340 511 262 773 0 0 0 773 19 0 792 57.1% LEPA 154 0 0 0 0 154 188 105 293 0 0 0 293 6 58 241 36.1% MIDW 216 0 0 0 0 216 30 0 30 0 0 0 30 338 0 368 41.2% MIPU 1486 0 0 0 0 1486 1930 293 2223 369 0 0 1854 195 0 2049 27.5% OKGE 4093 0 112 0 0 3981 8463 -109 8354 1473 0 0 6881 31 95 6817 41.6% OMPA 543 0 0 0 0 543 475 239 714 43 0 0 671 258 9 920 41.0% PSOK 2467 0 0 0 0 2467 7711 101 7812 3584 0 0 4228 614 0 4842 49.1% SOEP 3992 0 0 0 0 3992 5991 -2 5989 1198 0 0 4791 1177 70 5898 32.3% SPRM 463 0 0 0 0 463 788 0 788 0 0 0 788 101 24 865 46.5% SUNC 693 0 0 0 0 693 985 0 985 0 0 0 985 174 0 1159 40.2% SWPA 701 0 0 0 0 701 2409 0 2409 141 0 0 2268 383 1662 989 29.1% SWPS 3686 100 15 0 0 3571 5992 0 5992 130 0 0 5862 0 133 5729 37.7% WEFA 1286 0 0 0 0 1286 1259 0 1259 95 0 0 1164 279 0 1443 10.9% YAZO 15 0 0 0 0 15 35 0 35 0 0 0 35 19 0 54 72.2%
Total: 31248 100 393 0 39 30717 57107 378 57485 9694 0 0 47791 5512 3579 49724 38.2%
Note:AEPW=PSOK & SOEPWestar Energy = KAGE & KAPLOMPA = OMPA+KPP
Control Area Capacity Margins
Deliverable Internal
Capacity
Item 3.2Projected Capacity and Demand for Ten Years
Winter 2007
Uncertain Capacity
Planned Capacity Additions
Page 39 of 60 Redacted Version 2008 EIA-411
cjh1006
Stamp
02 2a 2b 2c 2d 03 05 5a 5a1 6b 7a 7b 9 10 11 12Direct Critical Load as a Total Jointly Total Proposed Firm and Firm and Net
Total Internal Control Load Interruptible Peak-Pricing Capacity Net Internal Internal Owned Control Area Capacity Expected Expected CapacitySystem Demand Management Demand with Control Resource Demand Capacity Units Capacity Additions Purchases Sales Resources
AREC 877 0 17 0 0 860 401 264 665 0 0 0 665 466 0 1131 23.96% CELE 1757 0 130 0 0 1627 4465 -698 3767 1907 0 0 1860 333 0 2193 25.82% CLWL 39 0 0 0 39 0 376 0 376 0 0 0 376 22 320 78 100.00% EMDE 1043 0 8 0 0 1036 1262 0 1262 0 0 0 1262 162 0 1424 27.28% GRRD 713 0 0 0 0 713 1612 -198 1414 108 0 0 1306 163 207 1262 43.50% INDN 188 0 0 0 0 188 288 0 288 50 0 0 238 90 0 328 42.68% KACP 2616 0 0 0 0 2616 4741 -341 4400 85 0 0 4315 221 141 4395 40.47% KACY 373 0 0 0 0 373 753 0 753 140 0 0 613 44 58 599 37.73% KAGE 1858 0 88 0 0 1770 2718 260 2978 336 0 0 2642 90 0 2732 35.21% KAPL 1903 0 21 0 0 1882 4174 176 4350 116 310 0 4234 330 747 3817 50.69% LAFA 341 0 0 0 0 341 511 262 773 0 0 0 773 19 0 792 56.94% LEPA 155 0 0 0 0 155 188 105 293 0 0 0 293 13 58 248 37.50% MIDW 218 0 0 0 0 218 125 0 125 23 0 0 103 283 0 385 43.38% MIPU 1510 0 0 0 0 1510 1930 293 2223 469 0 0 1754 177 0 1931 21.82% OKGE 4163 0 113 0 0 4050 8463 -109 8354 1473 0 0 6881 31 20 6892 41.24% OMPA 562 0 0 0 0 562 550 240 790 43 0 0 747 394 9 1132 50.40% PSOK 2568 0 13 35 0 2520 7955 101 8056 3584 280 0 4472 320 0 4792 47.41% SOEP 4049 0 0 0 0 4049 5988 -2 5986 1198 0 0 4788 877 64 5601 27.72% SPRM 482 0 0 0 0 482 788 0 788 0 0 0 788 101 25 864 44.21% SUNC 721 0 0 0 0 721 985 0 985 0 0 0 985 174 0 1159 37.77% SWPA 708 0 0 0 0 708 2409 0 2409 106 0 0 2303 384 1662 1025 30.93% SWPS 3788 30 15 0 0 3743 7033 0 7033 645 526 0 6388 0 133 6255 40.17% WEFA 1318 0 0 0 0 1318 1259 0 1259 95 0 0 1164 279 0 1443 8.66% YAZO 15 0 0 0 0 15 35 0 35 0 0 0 35 19 0 54 72.22%
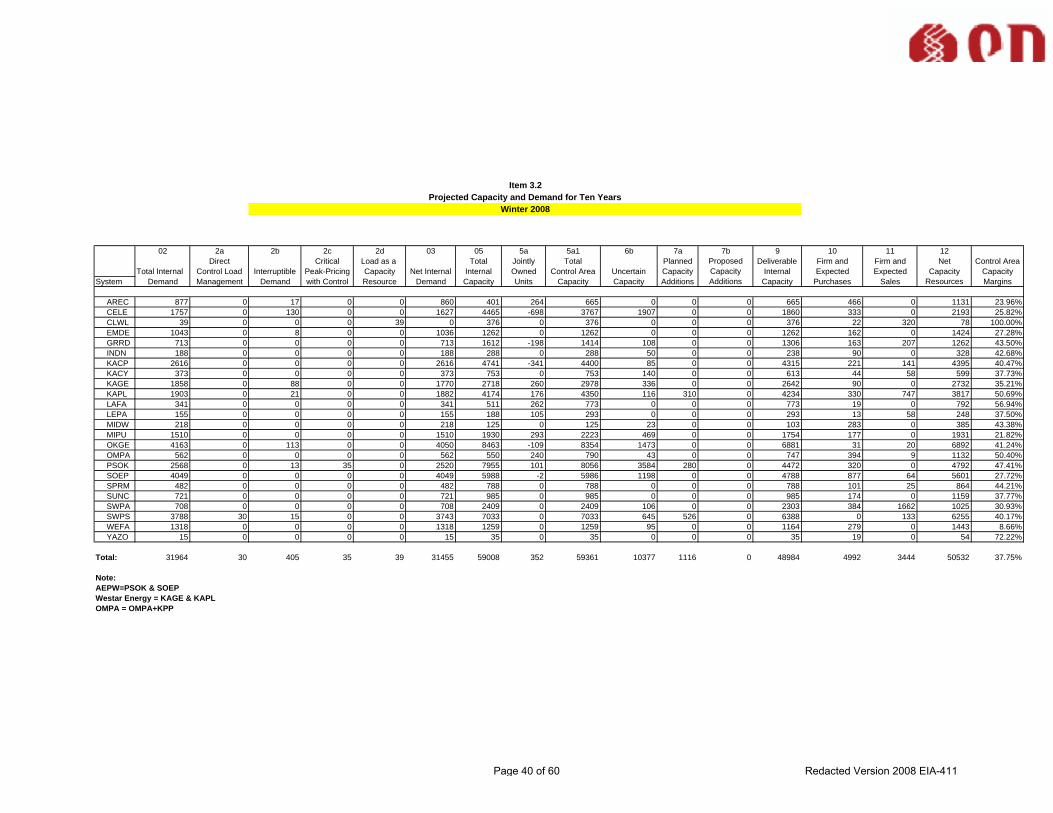
Total: 31964 30 405 35 39 31455 59008 352 59361 10377 1116 0 48984 4992 3444 50532 37.75%
Note:AEPW=PSOK & SOEPWestar Energy = KAGE & KAPLOMPA = OMPA+KPP
Control Area Capacity Margins
Uncertain Capacity
Planned Capacity Additions
Deliverable Internal
Capacity
Item 3.2Projected Capacity and Demand for Ten Years
Winter 2008
Page 40 of 60 Redacted Version 2008 EIA-411
cjh1006
Stamp

02 2a 2b 2c 2d 03 05 5a 5a1 6b 7a 7b 9 10 11 12Direct Critical Load as a Total Jointly Total Proposed Firm and Firm and Net
Total Internal Control Load Interruptible Peak-Pricing Capacity Net Internal Internal Owned Control Area Capacity Expected Expected CapacitySystem Demand Management Demand with Control Resource Demand Capacity Units Capacity Additions Purchases Sales Resources
AREC 898 0 17 0 0 881 401 264 665 0 0 0 665 468 0 1133 22.24% CELE 1711 0 128 0 0 1583 5065 -698 4367 1907 600 0 2460 0 0 2460 35.66% CLWL 39 0 0 0 39 0 376 0 376 0 0 0 376 22 320 78 100.00% EMDE 1075 0 8 0 0 1067 1274 0 1274 0 12 0 1274 162 0 1436 25.68% GRRD 727 0 0 0 0 727 2073 -198 1875 108 461 0 1767 13 231 1549 53.07% INDN 192 0 0 0 0 192 288 0 288 0 0 0 288 145 0 433 55.66% KACP 2676 0 0 0 0 2676 4796 -358 4438 85 0 0 4353 221 141 4433 39.65% KACY 375 0 0 0 0 375 753 0 753 140 0 0 613 44 58 599 37.40% KAGE 1890 0 88 0 0 1802 2718 260 2978 336 0 0 2642 109 0 2751 34.50% KAPL 1959 0 21 0 0 1938 4174 176 4350 116 310 0 4234 484 747 3971 51.20% LAFA 346 0 0 0 0 346 511 262 773 0 0 0 773 19 0 792 56.31% LEPA 156 0 0 0 0 156 188 105 293 0 0 0 293 13 58 248 37.10% MIDW 220 0 0 0 0 220 149 0 149 44 0 0 105 283 0 388 43.23% MIPU 1535 0 0 0 0 1535 1930 293 2223 469 0 0 1754 177 0 1931 20.52% OKGE 4226 0 116 0 0 4110 8514 -694 7820 1214 0 0 6606 31 20 6617 37.89% OMPA 609 0 0 0 0 609 550 405 955 43 0 0 912 314 9 1217 49.98% PSOK 2626 0 13 35 0 2578 7955 101 8056 3584 280 0 4472 456 0 4928 47.69% SOEP 4124 0 0 0 0 4124 5988 -2 5986 1198 0 0 4788 1018 64 5742 28.17% SPRM 505 0 0 0 0 505 788 0 788 0 0 0 788 101 26 863 41.48% SUNC 757 0 0 0 0 757 985 0 985 0 0 0 985 174 0 1159 34.66% SWPA 715 0 0 0 0 715 2409 0 2409 40 0 0 2369 386 1662 1093 34.58% SWPS 3883 14 15 0 0 3854 7363 0 7363 645 526 330 6388 0 133 6255 38.39% WEFA 1337 0 0 0 0 1337 1394 0 1394 95 135 0 1299 279 0 1578 15.27% YAZO 15 0 0 0 0 15 35 0 35 0 0 0 35 19 0 54 72.22%
Total: 32594 14 406 35 39 32101 60676 -84 60593 10023 2324 330 50240 4938 3469 51708 37.92%
Note:AEPW=PSOK & SOEPWestar Energy = KAGE & KAPLOMPA = OMPA+KPP
Control Area Capacity Margins
Uncertain Capacity
Planned Capacity Additions
Deliverable Internal
Capacity
Projected Capacity and Demand for Ten YearsWinter 2009
Item 3.2
Page 41 of 60 Redacted Version 2008 EIA-411
cjh1006
Stamp

02 2a 2b 2c 2d 03 05 5a 5a1 6b 7a 7b 9 10 11 12Direct Critical Load as a Total Jointly Total Proposed Firm and Firm and Net
Total Internal Control Load Interruptible Peak-Pricing Capacity Net Internal Internal Owned Control Area Capacity Expected Expected CapacitySystem Demand Management Demand with Control Resource Demand Capacity Units Capacity Additions Purchases Sales Resources
AREC 937 0 17 0 0 920 401 335 736 0 0 0 736 485 0 1221 24.65% CELE 1784 0 131 0 0 1652 5065 -698 4367 2407 600 0 1960 0 0 1960 15.70% CLWL 39 0 0 0 39 0 376 0 376 0 0 0 376 22 320 78 100.00% EMDE 1107 0 8 0 0 1099 1424 0 1424 0 162 0 1424 50 0 1474 25.41% GRRD 742 0 0 0 0 742 2077 -198 1879 108 465 0 1771 13 230 1554 52.25% INDN 196 0 0 0 0 196 288 0 288 0 0 0 288 195 0 483 59.42% KACP 2733 0 0 0 0 2733 5261 -358 4903 85 465 0 4818 0 141 4677 41.57% KACY 378 0 0 0 0 378 753 0 753 140 0 0 613 47 58 602 37.21% KAGE 1953 0 88 0 0 1865 2718 260 2978 336 0 0 2642 107 0 2749 32.16% KAPL 2015 0 21 0 0 1994 4624 176 4800 116 760 0 4684 482 560 4606 56.71% LAFA 352 0 0 0 0 352 511 262 773 0 0 0 773 19 0 792 55.56% LEPA 157 0 0 0 0 157 188 105 293 0 0 0 293 13 58 248 36.69% MIDW 222 0 0 0 0 222 149 0 149 44 0 0 105 258 0 363 38.76% MIPU 1575 0 0 0 0 1575 2083 293 2376 469 153 0 1907 177 0 2084 24.44% OKGE 4291 0 117 0 0 4174 8514 -694 7820 1214 0 0 6606 31 10 6627 37.02% OMPA 618 0 0 0 0 618 593 405 998 43 0 0 955 319 9 1265 51.13% PSOK 2655 0 13 35 0 2607 7955 101 8056 3584 280 0 4472 474 0 4946 47.28% SOEP 4192 0 0 0 0 4192 6566 -2 6564 1198 578 0 5366 560 64 5862 28.50% SPRM 518 0 0 0 0 518 1063 0 1063 0 275 0 1063 101 28 1136 54.40% SUNC 763 0 0 0 0 763 985 0 985 0 0 0 985 174 0 1159 34.14% SWPA 722 0 0 0 0 722 2414 0 2414 40 5 0 2374 388 1662 1100 34.36% SWPS 3980 14 15 0 0 3951 7913 0 7913 645 526 880 6388 0 0 6388 38.16% WEFA 1358 0 0 0 0 1358 1394 0 1394 95 135 0 1299 279 0 1578 13.94% YAZO 15 0 0 0 0 15 35 0 35 0 0 0 35 15 0 50 70.00%
Total: 33301 14 410 35 39 32803 63350 -13 63337 10523 4404 880 51934 4208 3140 53002 38.11%
Note:AEPW=PSOK & SOEPWestar Energy = KAGE & KAPLOMPA = OMPA+KPP
Uncertain Capacity
Planned Capacity Additions
Deliverable Internal
Capacity
Projected Capacity and Demand for Ten YearsWinter 2010
Item 3.2
Control Area Capacity Margins
Page 42 of 60 Redacted Version 2008 EIA-411
cjh1006
Stamp

02 2a 2b 2c 2d 03 05 5a 5a1 6b 7a 7b 9 10 11 12Direct Critical Load as a Total Jointly Total Proposed Firm and Firm and Net
Total Internal Control Load Interruptible Peak-Pricing Capacity Net Internal Internal Owned Control Area Capacity Expected Expected CapacitySystem Demand Management Demand with Control Resource Demand Capacity Units Capacity Additions Purchases Sales Resources
AREC 977 0 17 0 0 960 401 335 736 0 0 0 736 463 0 1199 19.93% CELE 1833 0 133 0 0 1700 5065 -698 4367 2407 600 0 1960 0 0 1960 13.27% CLWL 39 0 0 0 39 0 376 0 376 0 0 0 376 13 320 69 100.00% EMDE 1140 0 8 0 0 1132 1474 0 1474 0 162 50 1424 50 0 1474 23.18% GRRD 757 0 0 0 0 757 2081 -198 1883 108 469 0 1775 13 230 1558 51.41% INDN 200 0 0 0 0 200 288 0 288 0 0 0 288 105 0 393 49.11% KACP 2786 0 0 0 0 2786 5261 -340 4921 85 465 0 4836 0 51 4785 41.77% KACY 383 0 0 0 0 383 828 0 828 140 75 0 688 47 58 677 43.43% KAGE 1977 0 88 0 0 1889 2752 243 2995 336 0 0 2659 107 0 2766 31.71% KAPL 2081 0 21 0 0 2060 4624 177 4801 116 760 0 4685 481 560 4606 55.28% LAFA 357 0 0 0 0 357 511 262 773 0 0 0 773 19 0 792 54.92% LEPA 158 0 0 0 0 158 188 105 293 0 0 0 293 13 58 248 36.29% MIDW 224 0 0 0 0 224 149 0 149 44 0 0 105 258 0 363 38.21% MIPU 1617 0 0 0 0 1617 2083 293 2376 469 153 0 1907 77 0 1984 18.51% OKGE 4345 0 119 0 0 4226 8514 -694 7820 1214 0 0 6606 31 10 6627 36.23% OMPA 628 0 0 0 0 628 593 405 998 43 0 0 955 319 9 1265 50.39% PSOK 2687 0 13 35 0 2639 7955 101 8056 3584 280 0 4472 82 0 4554 42.04% SOEP 4258 0 0 0 0 4258 6566 -2 6564 1198 578 0 5366 561 64 5863 27.38% SPRM 531 0 0 0 0 531 1063 0 1063 0 275 0 1063 101 30 1134 53.18% SUNC 770 0 0 0 0 770 985 0 985 0 0 0 985 174 0 1159 33.54% SWPA 729 0 0 0 0 729 2414 0 2414 40 5 0 2374 388 1662 1100 33.73% SWPS 4072 14 15 0 0 4043 7913 0 7913 645 526 880 6388 0 0 6388 36.72% WEFA 1377 0 0 0 0 1377 1394 0 1394 95 135 0 1299 279 0 1578 12.74% YAZO 15 0 0 0 0 15 35 0 35 0 0 0 35 9 0 44 65.91%
Total: 33940 14 414 35 39 33439 63513 -11 63502 10523 4483 930 52049 3589 3052 52586 36.41%
Note:AEPW=PSOK & SOEPWestar Energy = KAGE & KAPLOMPA = OMPA+KPP
Uncertain Capacity
Planned Capacity Additions
Deliverable Internal
Capacity
Projected Capacity and Demand for Ten YearsWinter 2011
Item 3.2
Control Area Capacity Margins
Page 43 of 60 Redacted Version 2008 EIA-411
cjh1006
Stamp

02 2a 2b 2c 2d 03 05 5a 5a1 6b 7a 7b 9 10 11 12Direct Critical Load as a Total Jointly Total Proposed Firm and Firm and Net
Total Internal Control Load Interruptible Peak-Pricing Capacity Net Internal Internal Owned Control Area Capacity Expected Expected CapacitySystem Demand Management Demand with Control Resource Demand Capacity Units Capacity Additions Purchases Sales Resources
AREC 1017 0 17 0 0 1000 401 329 730 0 0 0 730 480 0 1210 17.36% CELE 1812 0 132 0 0 1679 5065 -698 4367 2407 600 0 1960 0 0 1960 14.31% CLWL 39 0 0 0 39 0 376 0 376 0 0 0 376 13 320 69 100.00% EMDE 1173 0 8 0 0 1166 1474 0 1474 0 162 50 1424 50 0 1474 20.91% GRRD 772 0 0 0 0 772 2085 -198 1887 108 473 0 1779 13 230 1562 50.58% INDN 204 0 0 0 0 204 288 0 288 0 0 0 288 105 0 393 48.09% KACP 2843 0 0 0 0 2843 5248 -334 4914 85 465 0 4829 0 51 4778 40.50% KACY 384 0 0 0 0 384 828 0 828 140 75 0 688 47 58 677 43.28% KAGE 1999 0 88 0 0 1911 2752 243 2995 336 0 0 2659 107 0 2766 30.91% KAPL 2157 0 21 0 0 2136 4624 177 4801 116 760 0 4685 480 560 4605 53.62% LAFA 362 0 0 0 0 362 511 262 773 0 0 0 773 19 0 792 54.29% LEPA 159 0 0 0 0 159 188 105 293 0 0 0 293 13 58 248 35.89% MIDW 226 0 0 0 0 226 149 0 149 44 0 0 105 258 0 363 37.66% MIPU 1660 0 0 0 0 1660 2083 293 2376 469 153 0 1907 77 0 1984 16.35% OKGE 4420 0 121 0 0 4299 8514 -694 7820 1214 0 0 6606 31 10 6627 35.13% OMPA 637 0 0 0 0 637 634 405 1039 43 41 0 996 319 9 1306 51.21% PSOK 2715 0 13 35 0 2667 8440 101 8541 3584 280 542 4415 123 0 4538 41.24% SOEP 4311 0 0 0 0 4311 7018 -2 7016 1198 1031 0 5818 561 97 6282 31.37% SPRM 545 0 0 0 0 545 1063 0 1063 0 275 0 1063 101 32 1132 51.86% SUNC 776 0 0 0 0 776 985 0 985 0 0 0 985 174 0 1159 33.02% SWPA 737 0 0 0 0 737 2409 0 2409 20 0 0 2389 388 1662 1115 33.90% SWPS 4162 14 15 0 0 4133 7913 0 7913 645 526 880 6388 0 0 6388 35.30% WEFA 1397 0 0 0 0 1397 1394 0 1394 95 135 0 1299 279 0 1578 11.47% YAZO 16 0 0 0 0 16 35 0 35 0 0 0 35 9 0 44 63.64%
Total: 34523 14 415 35 39 34021 64477 -11 64466 10503 4976 1472 52491 3646 3087 53050 35.87%
Note:AEPW=PSOK & SOEPWestar Energy = KAGE & KAPLOMPA = OMPA+KPP
Uncertain Capacity
Planned Capacity Additions
Deliverable Internal
Capacity
Projected Capacity and Demand for Ten YearsWinter 2012
Item 3.2
Control Area Capacity Margins
Page 44 of 60 Redacted Version 2008 EIA-411
cjh1006
Stamp

02 2a 2b 2c 2d 03 05 5a 5a1 6b 7a 7b 9 10 11 12Direct Critical Load as a Total Jointly Total Proposed Firm and Firm and Net
Total Internal Control Load Interruptible Peak-Pricing Capacity Net Internal Internal Owned Control Area Capacity Expected Expected CapacitySystem Demand Management Demand with Control Resource Demand Capacity Units Capacity Additions Purchases Sales Resources
AREC 1055 0 17 0 0 1038 401 329 730 0 0 0 730 417 0 1147 9.50% CELE 1858 0 134 0 0 1724 5065 -698 4367 2407 600 0 1960 0 0 1960 12.05% CLWL 39 0 0 0 39 0 376 0 376 0 0 0 376 13 320 69 100.00% EMDE 1207 0 8 0 0 1200 1474 0 1474 0 162 50 1424 50 0 1474 18.60% GRRD 787 0 0 0 0 787 2085 -198 1887 108 473 0 1779 13 230 1562 49.62% INDN 208 0 0 0 0 208 288 0 288 0 0 0 288 105 0 393 47.07% KACP 2910 0 0 0 0 2910 5234 -327 4907 85 465 0 4822 0 0 4822 39.66% KACY 387 0 0 0 0 387 828 0 828 140 75 0 688 47 58 677 42.84% KAGE 2022 0 88 0 0 1934 2752 243 2995 336 0 0 2659 107 0 2766 30.08% KAPL 2245 0 21 0 0 2224 4624 177 4801 116 760 0 4685 479 510 4654 52.21% LAFA 367 0 0 0 0 367 511 262 773 0 0 0 773 19 0 792 53.66% LEPA 160 0 0 0 0 160 188 105 293 0 0 0 293 13 58 248 35.48% MIDW 228 0 0 0 0 228 149 0 149 44 0 0 105 283 0 388 41.16% MIPU 1703 0 0 0 0 1703 2083 293 2376 469 153 0 1907 77 0 1984 14.18% OKGE 4491 0 123 0 0 4368 8500 -694 7806 1214 0 0 6592 31 0 6623 34.05% OMPA 647 0 0 0 0 647 634 405 1039 43 41 0 996 319 9 1306 50.47% PSOK 2754 0 13 35 0 2706 8780 101 8881 3584 280 890 4407 90 0 4497 39.83% SOEP 4377 0 0 0 0 4377 7006 -2 7004 1198 1031 0 5806 561 64 6303 30.56% SPRM 559 0 0 0 0 559 1063 0 1063 0 275 0 1063 50 34 1079 48.19% SUNC 782 0 0 0 0 782 985 0 985 0 0 0 985 174 0 1159 32.50% SWPA 744 0 0 0 0 744 2409 0 2409 0 0 0 2409 388 1662 1135 34.45% SWPS 4251 14 15 0 0 4222 7913 0 7913 645 526 880 6388 0 0 6388 33.90% WEFA 1415 0 0 0 0 1415 1769 0 1769 95 510 0 1674 279 0 1953 27.55% YAZO 16 0 0 0 0 16 35 0 35 0 0 0 35 5 0 40 60.00%
Total: 35211 14 418 35 39 34705 65152 -4 65148 10483 5351 1820 52845 3519 2945 53419 35.03%
Note:AEPW=PSOK & SOEPWestar Energy = KAGE & KAPLOMPA = OMPA+KPP
Uncertain Capacity
Planned Capacity Additions
Deliverable Internal
Capacity
Projected Capacity and Demand for Ten YearsWinter 2013
Item 3.2
Control Area Capacity Margins
Page 45 of 60 Redacted Version 2008 EIA-411
cjh1006
Stamp

02 2a 2b 2c 2d 03 05 5a 5a1 6b 7a 7b 9 10 11 12Direct Critical Load as a Total Jointly Total Proposed Firm and Firm and Net
Total Internal Control Load Interruptible Peak-Pricing Capacity Net Internal Internal Owned Control Area Capacity Expected Expected CapacitySystem Demand Management Demand with Control Resource Demand Capacity Units Capacity Additions Purchases Sales Resources
AREC 1096 0 17 0 0 1079 401 329 730 0 0 0 730 380 0 1110 2.79% CELE 1912 0 136 0 0 1776 5065 -698 4367 2407 600 0 1960 0 0 1960 9.39% CLWL 39 0 0 0 39 0 376 0 376 0 0 0 376 13 320 69 100.00% EMDE 1242 0 8 0 0 1235 1574 0 1574 0 162 150 1424 50 0 1474 16.24% GRRD 803 0 0 0 0 803 2085 -198 1887 108 473 0 1779 13 230 1562 48.59% INDN 212 0 0 0 0 212 288 0 288 0 0 0 288 105 0 393 46.06% KACP 2975 0 0 0 0 2975 5234 -327 4907 85 465 0 4822 0 0 4822 38.31% KACY 391 0 0 0 0 391 828 0 828 140 75 0 688 47 58 677 42.25% KAGE 2045 0 88 0 0 1957 2752 243 2995 336 0 0 2659 107 0 2766 29.25% KAPL 2344 0 21 0 0 2323 4774 177 4951 116 760 150 4685 478 450 4713 50.71% LAFA 373 0 0 0 0 373 511 262 773 0 0 0 773 19 0 792 52.90% LEPA 161 0 0 0 0 161 188 105 293 0 0 0 293 13 58 248 35.08% MIDW 230 0 0 0 0 230 149 0 149 44 0 0 105 283 0 388 40.65% MIPU 1748 0 0 0 0 1748 2083 293 2376 469 153 0 1907 2 0 1909 8.45% OKGE 4571 0 125 0 0 4446 8500 -694 7806 1214 0 0 6592 31 0 6623 32.87% OMPA 657 0 0 0 0 657 634 405 1039 43 41 0 996 292 0 1288 49.02% PSOK 2795 0 13 35 0 2747 8780 101 8881 3584 280 890 4407 90 0 4497 38.91% SOEP 4442 0 0 0 0 4442 6989 -2 6987 1198 1031 0 5789 561 64 6286 29.34% SPRM 573 0 0 0 0 573 1063 0 1063 0 275 0 1063 50 36 1077 46.80% SUNC 789 0 0 0 0 789 985 0 985 0 0 0 985 174 0 1159 31.90% SWPA 752 0 0 0 0 752 2409 0 2409 0 0 0 2409 388 1662 1135 33.74% SWPS 4346 14 15 0 0 4317 7913 0 7913 645 526 880 6388 0 0 6388 32.42% WEFA 1433 0 0 0 0 1433 1769 0 1769 95 510 0 1674 279 0 1953 26.63% YAZO 16 0 0 0 0 16 35 0 35 0 0 0 35 5 0 40 60.00%
Total: 35945 14 422 35 39 35435 65385 -4 65381 10483 5351 2070 52828 3379 2878 53329 33.55%
Note:AEPW=PSOK & SOEPWestar Energy = KAGE & KAPLOMPA = OMPA+KPP
Uncertain Capacity
Planned Capacity Additions
Deliverable Internal
Capacity
Projected Capacity and Demand for Ten YearsWinter 2014
Item 3.2
Control Area Capacity Margins
Page 46 of 60 Redacted Version 2008 EIA-411
cjh1006
Stamp

02 2a 2b 2c 2d 03 05 5a 5a1 6b 7a 7b 9 10 11 12Direct Critical Load as a Total Jointly Total Proposed Firm and Firm and Net
Total Internal Control Load Interruptible Peak-Pricing Capacity Net Internal Internal Owned Control Area Capacity Expected Expected CapacitySystem Demand Management Demand with Control Resource Demand Capacity Units Capacity Additions Purchases Sales Resources
AREC 1133 0 17 0 0 1116 901 329 1230 0 500 0 1230 231 0 1461 23.61% CELE 1917 0 136 0 0 1781 5065 -698 4367 2407 600 0 1960 0 0 1960 9.14% CLWL 39 0 0 0 39 0 376 0 376 0 0 0 376 13 320 69 100.00% EMDE 1278 0 8 0 0 1270 1624 0 1624 0 212 150 1474 0 0 1474 13.84% GRRD 819 0 0 0 0 819 2085 -198 1887 108 473 0 1779 13 230 1562 47.57% INDN 216 0 0 0 0 216 288 0 288 0 0 0 288 105 0 393 45.04% KACP 3032 0 0 0 0 3032 5234 -327 4907 85 465 0 4822 0 0 4822 37.12% KACY 395 0 0 0 0 395 828 0 828 140 75 0 688 47 58 677 41.65% KAGE 2069 0 88 0 0 1981 2642 243 2885 336 0 0 2549 107 0 2656 25.41% KAPL 2457 0 21 0 0 2436 4774 177 4951 116 760 150 4685 477 275 4887 50.15% LAFA 378 0 0 0 0 378 511 262 773 0 0 0 773 19 0 792 52.27% LEPA 162 0 0 0 0 162 188 105 293 0 0 0 293 13 58 248 34.68% MIDW 232 0 0 0 0 232 149 0 149 44 0 0 105 283 0 388 40.13% MIPU 1793 0 0 0 0 1793 2083 293 2376 469 153 0 1907 2 0 1909 6.10% OKGE 4645 0 127 0 0 4518 8500 -694 7806 1214 0 0 6592 31 0 6623 31.78% OMPA 667 0 0 0 0 667 634 405 1039 43 41 0 996 304 0 1300 48.71% PSOK 2833 0 13 35 0 2785 8780 101 8881 3584 280 890 4407 90 0 4497 38.07% SOEP 4515 0 0 0 0 4515 6989 -2 6987 1198 1031 0 5789 569 64 6294 28.26% SPRM 588 0 0 0 0 588 1063 0 1063 0 275 0 1063 50 38 1075 45.30% SUNC 795 0 0 0 0 795 985 0 985 0 0 0 985 174 0 1159 31.38% SWPA 759 0 0 0 0 759 2409 0 2409 0 0 0 2409 388 1662 1135 33.13% SWPS 4445 14 15 0 0 4416 7913 0 7913 645 526 880 6388 0 0 6388 30.87% WEFA 1452 0 0 0 0 1452 1769 0 1769 95 510 0 1674 279 0 1953 25.65% YAZO 16 0 0 0 0 16 35 0 35 0 0 0 35 5 0 40 60.00%
Total: 36634 14 424 35 39 36122 65825 -4 65821 10483 5901 2070 53268 3199 2705 53762 32.81%
Note:AEPW=PSOK & SOEPWestar Energy = KAGE & KAPLOMPA = OMPA+KPP
Uncertain Capacity
Planned Capacity Additions
Deliverable Internal
Capacity
Projected Capacity and Demand for Ten YearsWinter 2015
Item 3.2
Control Area Capacity Margins
Page 47 of 60 Redacted Version 2008 EIA-411
cjh1006
Stamp

02 2a 2b 2c 2d 03 05 5a 5a1 6b 7a 7b 9 10 11 12Direct Critical Load as a Total Jointly Total Proposed Firm and Firm and Net
Total Internal Control Load Interruptible Peak-Pricing Capacity Net Internal Internal Owned Control Area Capacity Expected Expected CapacitySystem Demand Management Demand with Control Resource Demand Capacity Units Capacity Additions Purchases Sales Resources
AREC 1173 0 17 0 0 1156 901 329 1230 0 500 0 1230 259 0 1489 22.36% CELE 1945 0 137 0 0 1809 5065 -698 4367 2407 600 0 1960 0 0 1960 7.73% CLWL 39 0 0 0 39 0 376 0 376 0 0 0 376 13 320 69 100.00% EMDE 1314 0 8 0 0 1306 1624 0 1624 0 212 150 1474 0 0 1474 11.38% GRRD 835 0 0 0 0 835 2085 -198 1887 108 473 0 1779 13 230 1562 46.54% INDN 220 0 0 0 0 220 288 0 288 0 0 0 288 105 0 393 44.02% KACP 3093 0 0 0 0 3093 5199 -327 4872 85 465 0 4787 0 0 4787 35.40% KACY 396 0 0 0 0 396 828 0 828 140 75 0 688 47 58 677 41.51% KAGE 2093 0 88 0 0 2005 2658 238 2896 336 0 0 2560 107 0 2667 24.82% KAPL 2589 0 21 0 0 2568 5124 178 5302 116 760 500 4686 476 200 4962 48.25% LAFA 383 0 0 0 0 383 511 262 773 0 0 0 773 19 0 792 51.64% LEPA 163 0 0 0 0 163 188 105 293 0 0 0 293 13 58 248 34.27% MIDW 234 0 0 0 0 234 149 0 149 44 0 0 105 283 0 388 39.61% MIPU 1839 0 0 0 0 1839 2083 293 2376 469 153 0 1907 2 0 1909 3.69% OKGE 4749 0 129 0 0 4620 8493 -694 7799 1214 0 0 6585 31 0 6616 30.17% OMPA 677 0 0 0 0 677 634 405 1039 43 41 0 996 316 0 1312 48.40% PSOK 2850 0 13 35 0 2802 8780 101 8881 3584 280 890 4407 90 0 4497 37.69% SOEP 4578 0 0 0 0 4578 7397 -2 7395 1198 1031 408 5789 569 64 6294 27.27% SPRM 603 0 0 0 0 603 1063 0 1063 0 275 0 1063 50 40 1073 43.80% SUNC 802 0 0 0 0 802 985 0 985 0 0 0 985 174 0 1159 30.78% SWPA 767 0 0 0 0 767 2409 0 2409 0 0 0 2409 388 1662 1135 32.42% SWPS 4549 14 15 0 0 4520 7913 0 7913 645 526 880 6388 0 0 6388 29.25% WEFA 1469 0 0 0 0 1469 1769 0 1769 95 510 0 1674 279 0 1953 24.78% YAZO 17 0 0 0 0 17 35 0 35 0 0 0 35 5 0 40 57.50%
Total: 37376 14 427 35 39 36861 66557 -8 66549 10483 5901 2828 53238 3239 2632 53844 31.54%
Note:AEPW=PSOK & SOEPWestar Energy = KAGE & KAPLOMPA = OMPA+KPP
Uncertain Capacity
Planned Capacity Additions
Deliverable Internal
Capacity
Projected Capacity and Demand for Ten YearsWinter 2016
Item 3.2
Control Area Capacity Margins
Page 48 of 60 Redacted Version 2008 EIA-411
cjh1006
Stamp
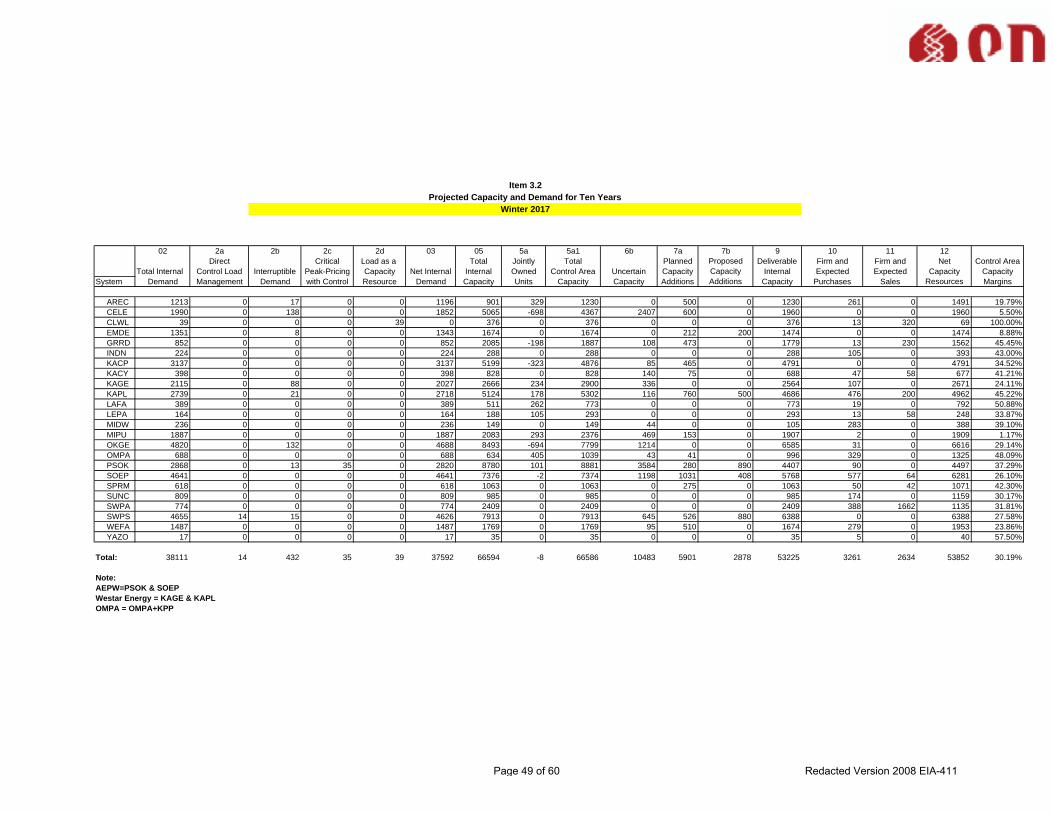
02 2a 2b 2c 2d 03 05 5a 5a1 6b 7a 7b 9 10 11 12Direct Critical Load as a Total Jointly Total Proposed Firm and Firm and Net
Total Internal Control Load Interruptible Peak-Pricing Capacity Net Internal Internal Owned Control Area Capacity Expected Expected CapacitySystem Demand Management Demand with Control Resource Demand Capacity Units Capacity Additions Purchases Sales Resources
AREC 1213 0 17 0 0 1196 901 329 1230 0 500 0 1230 261 0 1491 19.79% CELE 1990 0 138 0 0 1852 5065 -698 4367 2407 600 0 1960 0 0 1960 5.50% CLWL 39 0 0 0 39 0 376 0 376 0 0 0 376 13 320 69 100.00% EMDE 1351 0 8 0 0 1343 1674 0 1674 0 212 200 1474 0 0 1474 8.88% GRRD 852 0 0 0 0 852 2085 -198 1887 108 473 0 1779 13 230 1562 45.45% INDN 224 0 0 0 0 224 288 0 288 0 0 0 288 105 0 393 43.00% KACP 3137 0 0 0 0 3137 5199 -323 4876 85 465 0 4791 0 0 4791 34.52% KACY 398 0 0 0 0 398 828 0 828 140 75 0 688 47 58 677 41.21% KAGE 2115 0 88 0 0 2027 2666 234 2900 336 0 0 2564 107 0 2671 24.11% KAPL 2739 0 21 0 0 2718 5124 178 5302 116 760 500 4686 476 200 4962 45.22% LAFA 389 0 0 0 0 389 511 262 773 0 0 0 773 19 0 792 50.88% LEPA 164 0 0 0 0 164 188 105 293 0 0 0 293 13 58 248 33.87% MIDW 236 0 0 0 0 236 149 0 149 44 0 0 105 283 0 388 39.10% MIPU 1887 0 0 0 0 1887 2083 293 2376 469 153 0 1907 2 0 1909 1.17% OKGE 4820 0 132 0 0 4688 8493 -694 7799 1214 0 0 6585 31 0 6616 29.14% OMPA 688 0 0 0 0 688 634 405 1039 43 41 0 996 329 0 1325 48.09% PSOK 2868 0 13 35 0 2820 8780 101 8881 3584 280 890 4407 90 0 4497 37.29% SOEP 4641 0 0 0 0 4641 7376 -2 7374 1198 1031 408 5768 577 64 6281 26.10% SPRM 618 0 0 0 0 618 1063 0 1063 0 275 0 1063 50 42 1071 42.30% SUNC 809 0 0 0 0 809 985 0 985 0 0 0 985 174 0 1159 30.17% SWPA 774 0 0 0 0 774 2409 0 2409 0 0 0 2409 388 1662 1135 31.81% SWPS 4655 14 15 0 0 4626 7913 0 7913 645 526 880 6388 0 0 6388 27.58% WEFA 1487 0 0 0 0 1487 1769 0 1769 95 510 0 1674 279 0 1953 23.86% YAZO 17 0 0 0 0 17 35 0 35 0 0 0 35 5 0 40 57.50%
Total: 38111 14 432 35 39 37592 66594 -8 66586 10483 5901 2878 53225 3261 2634 53852 30.19%
Note:AEPW=PSOK & SOEPWestar Energy = KAGE & KAPLOMPA = OMPA+KPP
Uncertain Capacity
Planned Capacity Additions
Deliverable Internal
Capacity
Projected Capacity and Demand for Ten YearsWinter 2017
Item 3.2
Control Area Capacity Margins
Page 49 of 60 Redacted Version 2008 EIA-411
cjh1006
Stamp

ITEM 4
PROJECTED CAPACITY PURCHASES AND SALES
Page 50 of 60 Redacted Version 2008 EIA-411

ITEM 4
Projected Capacity Purchases and Sales
This item reports individually all projected capacity purchases and sales, to parties outside of SPP’s region, for the 10 year period after January 1, 2007. Some data may be noncoincident due to differences in the month of the seasonal peaks for the purchaser and seller. An example would be a transfer that changes magnitude from July to August. The transfer would be reported in July by the selling party whose peak occurs in July and reported in August by the purchasing party whose peak occurs in August. Purchases from jointly owned shares of utility or IPP generators physically located outside the Region or Reporting party, reported as capacity transfers in Item 4, should be included in Item 3, Line 10 (Capacity Purchases) and in Line 11 (Capacity Sales). Purchases from IPP generators physically located outside the Region or Reporting Party reported as capacity transfers in Item 4, should be included in Item 3, Line 5 (Total Capacity). Definitions:
1. Capacity Purchase is a total of all capacity purchased from entities outside the interconnection boundaries of the Region or Reporting Party during the month of the seasonal peak of the purchasing Region or Reporting Party.
2. Capacity Sale is a total of all capacity sales to entities outside the interconnection
boundaries of the Region or Reporting Party during the month of the seasonal peak of the selling Region or Reporting Party.
Page 51 of 60 Redacted Version 2008 EIA-411
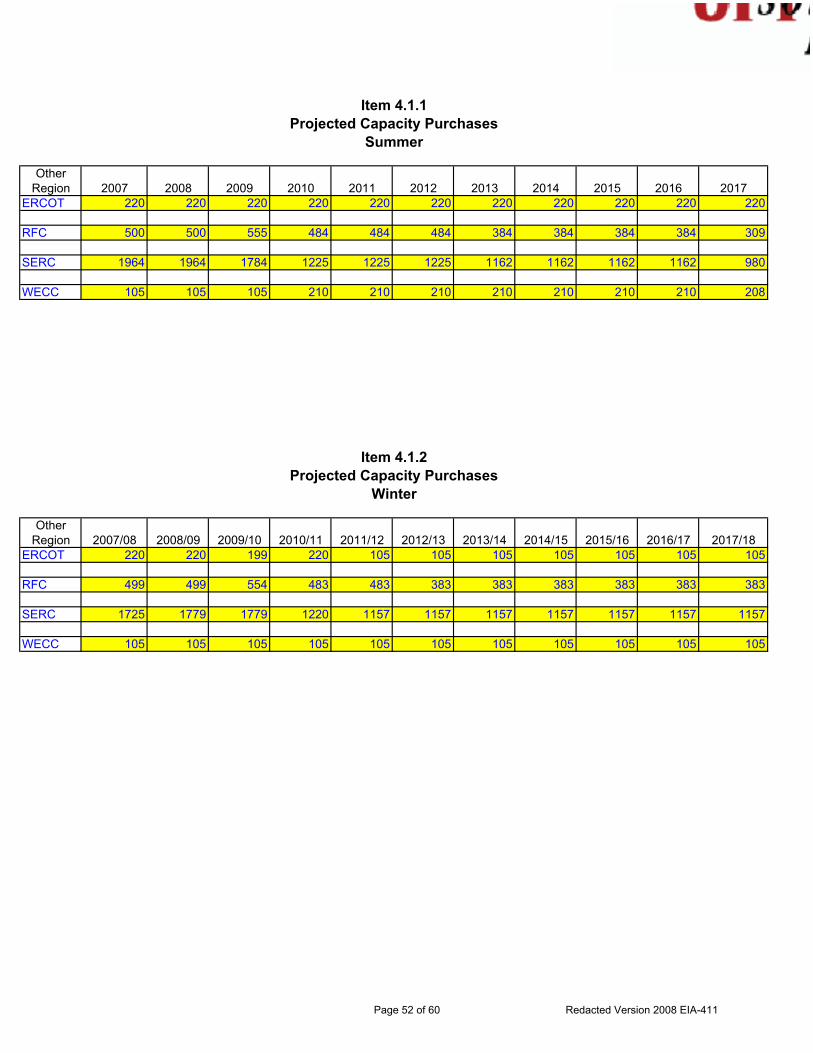
Item 4.1.1Projected Capacity Purchases
Summer
OtherRegion 2007 2008 2009 2010 2011 2012 2013 2014 2015 2016 2017
ERCOT 220 220 220 220 220 220 220 220 220 220 220
RFC 500 500 555 484 484 484 384 384 384 384 309
SERC 1964 1964 1784 1225 1225 1225 1162 1162 1162 1162 980
WECC 105 105 105 210 210 210 210 210 210 210 208
Item 4.1.2Projected Capacity Purchases
Winter
OtherRegion 2007/08 2008/09 2009/10 2010/11 2011/12 2012/13 2013/14 2014/15 2015/16 2016/17 2017/18
ERCOT 220 220 199 220 105 105 105 105 105 105 105
RFC 499 499 554 483 483 383 383 383 383 383 383
SERC 1725 1779 1779 1220 1157 1157 1157 1157 1157 1157 1157
WECC 105 105 105 105 105 105 105 105 105 105 105
Page 52 of 60 Redacted Version 2008 EIA-411
cjh1006
Stamp

Item 4.2.1Projected Capacity Sales
Summer
OtherRegion 2007 2008 2009 2010 2011 2012 2013 2014 2015 2016 2017
ERCOT 58 58 58 58 58 58 61 61 61 61 61
RFC 0 0 0 0 0 0 0 0 0 0 0
SERC 1090 1090 1040 1040 1040 1040 1040 1040 1040 1040 1040
WECC 402 402 402 402 402 402 402 402 402 402 402
Item 4.2.2Projected Capacity Sales
Winter
OtherRegion 2007/08 2008/09 2009/10 2010/11 2011/12 2012/13 2013/14 2014/15 2015/16 2016/17 2017/18
ERCOT 58 58 58 58 58 61 61 61 61 61 61
RFC 0 0 0 0 0 0 0 0 0 0 0
SERC 1089 1089 1039 1039 1039 1039 1039 1039 1039 1039 1039
WECC 402 402 402 402 402 402 402 402 402 402 402
Page 53 of 60 Redacted Version 2008 EIA-411
cjh1006
Stamp
ITEM 5
BULK ELECTRIC TRANSMISSION SYSTEM MAP
Page 54 of 60 Redacted Version 2008 EIA-411

ITEM 5
Bulk Electric Transmission System Maps Bulk power transmission system maps are available. A request for a Southwest Power Pool map must go through the FERC CEII Request Procedure. Once FERC approval has been granted an SPP NDA must be signed by the requestor and approved by SPP. The link for CEII data request is http://www.ferc.gov/help/how-to/file-ceii.asp SPP Members are only required to sign the SPP NDA in order to gain access to the power transmission system maps.
Page 55 of 60 Redacted Version 2008 EIA-411
ITEM 6
PROPOSED BULK ELECTRIC TRANSMISSION
LINE ADDITIONS
Page 56 of 60 Redacted Version 2008 EIA-411
ITEM 6
Proposed Bulk Electric Transmission Line Additions
This item lists the bulk power transmission lines for proposed interconnected operation to be installed during the 2008-2017 period.
Column Number: 01: Identifies the line owners, using the five-character
letter codes referred to in Item 2.1 of this report.
02: Identifies the utility name. Thirty characters maximum. 03: Identifies each terminal of the facility. Sixty characters left justified. 04: Shows the line length in miles. Eight characters, zero-filled numeric. 05: The year that the facility is expected to be in service. 06: The month that the facility is expected to be in service. 07: Identifies the nominal operating voltage in kilovolts (kV). 08: Identifies the nominal design voltage in kilovolts (kV). 09: Notes as needed for clarification.
Page 57 of 60 Redacted Version 2008 EIA-411

Item 6Proposed Bulk Electric Transmission Line Additions
System: SPPLine
Entity Length in Voltage ExpectedFrom Location To Location Entity Name EIA Code Circuit Miles Type Operating Design Service Date
Flint Creek Centerton SOEP 17698 22 345 345 345 June-14Centerton Osage Creek SOEP 17698 41 345 345 345 June-16
Turk NW Texarkana SOEP 17698 34 345 345 345 June-11Sooner Rose-Hill OKGE 14036 53 345 345 345 December-10
Seven Rivers Pecos Intg SWPS 17718 17.5 230 230 230 June-09Pecos Intg Potash Jct SWPS 17719 16 230 230 230 June-09Hitchland Moore County SWPS 17720 50 230 230 230 June-10Hitchland Perryton SWPS 17718 35 230 230 230 June-10Hitchland Pringle SWPS 17718 34 230 230 230 June-10Mustang Seminole SWPS 17721 20.7 230 230 230 June-09Seminole Hobbs Plt SWPS 17722 45 230 230 230 June-10
Hugo Valliant WEFA 20447 19 345 345 345 May-10Wichita Reno County KAGE 10005 40 345 345 345 December-08
Rose Hill Sooner KAGE 10005 53 345 345 345 December-10Reno County Summit WERE 22500 51 345 345 345 December-09
Axtell Knoll TBD TBD 95 345 345 345 June-12Knoll Spearville TBD TBD 90 345 345 345 June-12
Spearville Comanche Co. TBD TBD 60 345 345 345 June-12Comanche Co. Wichita TBD TBD 120 345 345 765 June-12
Terminals Nominal Voltage in kV
Page 58 of 60 Redacted Version 2008 EIA-411
cjh1006
Stamp

ITEM 7
ANNUAL DATA ON TRANSMISSION LINE OUTAGES FOR EHV LINES
Page 59 of 60 Redacted Version 2008 EIA-411
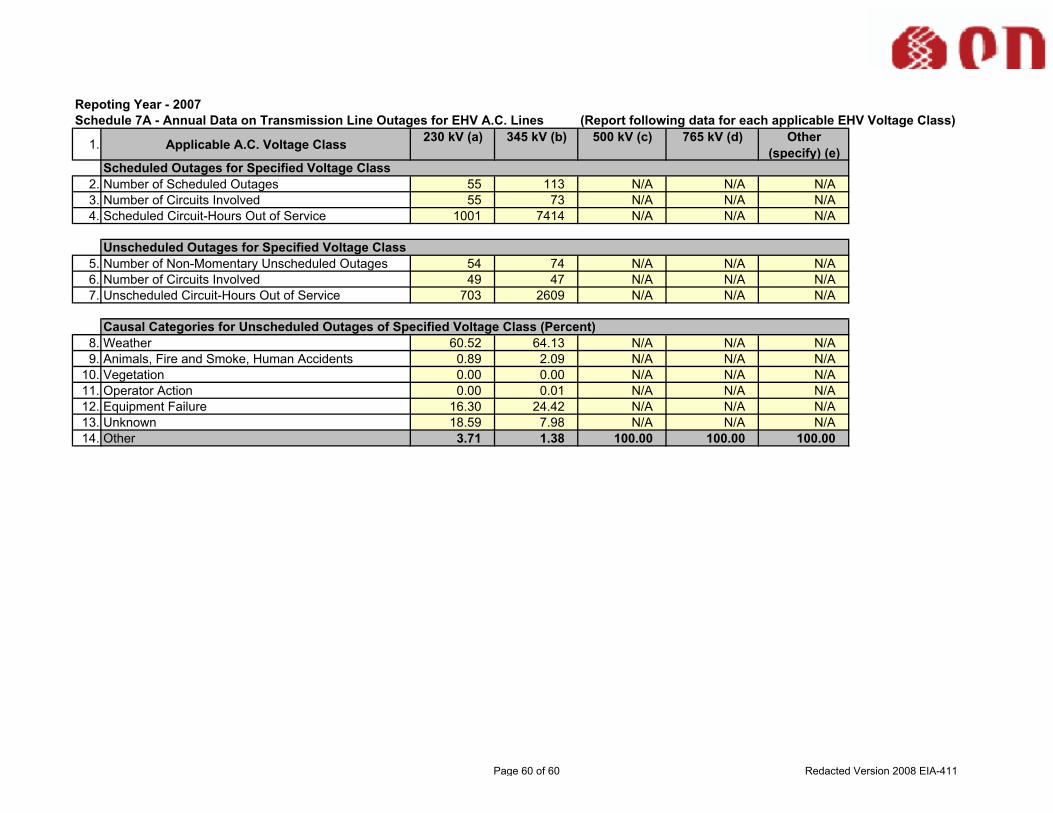
Repoting Year - 2007Schedule 7A - Annual Data on Transmission Line Outages for EHV A.C. Lines (Report following data for each applicable EHV Voltage Class)
1. Applicable A.C. Voltage Class 230 kV (a) 345 kV (b) 500 kV (c) 765 kV (d) Other (specify) (e)
Scheduled Outages for Specified Voltage Class 2. Number of Scheduled Outages 55 113 N/A N/A N/A3. Number of Circuits Involved 55 73 N/A N/A N/A4. Scheduled Circuit-Hours Out of Service 1001 7414 N/A N/A N/A
Unscheduled Outages for Specified Voltage Class 5. Number of Non-Momentary Unscheduled Outages 54 74 N/A N/A N/A6. Number of Circuits Involved 49 47 N/A N/A N/A7. Unscheduled Circuit-Hours Out of Service 703 2609 N/A N/A N/A
Causal Categories for Unscheduled Outages of Specified Voltage Class (Percent) 8. Weather 60.52 64.13 N/A N/A N/A9. Animals, Fire and Smoke, Human Accidents 0.89 2.09 N/A N/A N/A
10. Vegetation 0.00 0.00 N/A N/A N/A11. Operator Action 0.00 0.01 N/A N/A N/A12. Equipment Failure 16.30 24.42 N/A N/A N/A13. Unknown 18.59 7.98 N/A N/A N/A14. Other 3.71 1.38 100.00 100.00 100.00
Page 60 of 60 Redacted Version 2008 EIA-411
cjh1006
Stamp