Ehv substation
111
Electrical EHV Substations
-
Upload
suresh-gopal -
Category
Engineering
-
view
1.470 -
download
14
Transcript of Ehv substation

Electrical
EHV
Substations

Introduction
Sub Stations are important link between
Generating stations and Distribution networks.
They step down the EHV to HV as per the
requirement of the customers.
Stability of the system, reliability of power
depends on the type of layout chosen and
components used in the sub stations.
Hence great care has to be taken to select the
layout and critical equipment for the SS.

~
Transmission line Yard in Receiving
Station Out door yard in Generating Station
Out door yard in Generating station

Basic Requirements
Total land area & Ease of extension
Soil condition & Soil resistivity
Right of way for incoming and outgoing lines
Facility to move heavy Equipments
Load Centre
System Security
Operational Flexibility
Simplicity of protection arrangement
Ability to limit short circuit levels
Maintenance
Cost

Types of layouts
Single Busbar System
Single Busbar System sectionalising arrangement
Double Busbar system
Single Busbar with ring Bus
Double Busbar with Transfer Bus
One and Half Breaker arrangement
Mesh type arrangement
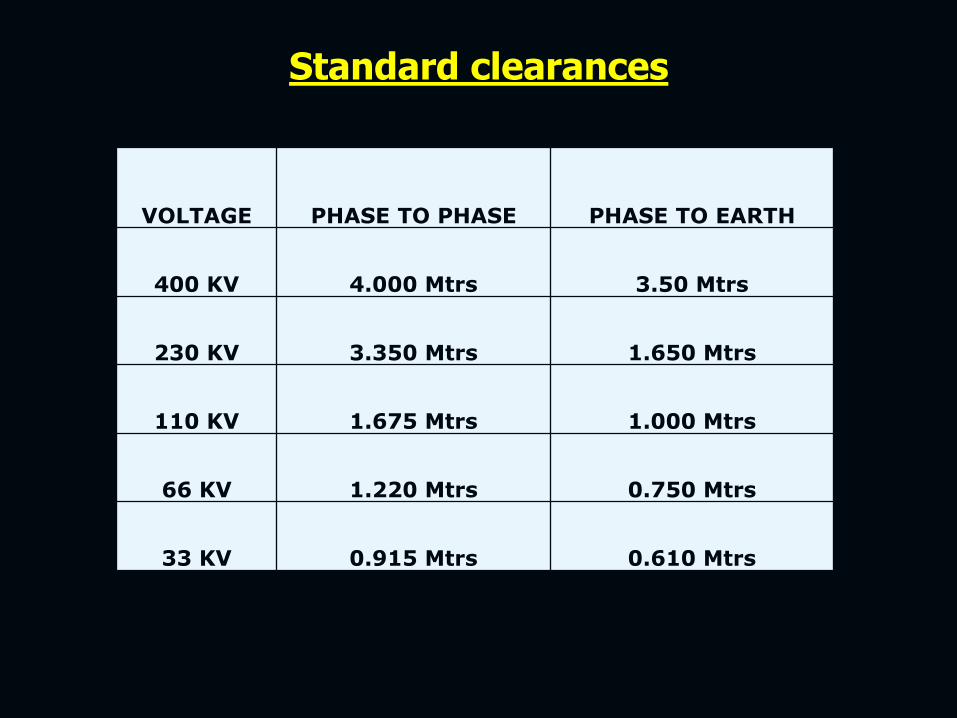
Standard clearances
VOLTAGE PHASE TO PHASE PHASE TO EARTH
400 KV 4.000 Mtrs 3.50 Mtrs
230 KV 3.350 Mtrs 1.650 Mtrs
110 KV 1.675 Mtrs 1.000 Mtrs
66 KV 1.220 Mtrs 0.750 Mtrs
33 KV 0.915 Mtrs 0.610 Mtrs

Standard clearances
VOLTAGE CLEARANCE
GROUND CLEARANCE
SECTIONAL CLEARANCE
400 KV 8.000 Mtrs 10.000 Mtrs
230 KV 5.500 Mtrs 4.270 Mtrs
110 KV 4.600 Mtrs 3.350 Mtrs
66 KV 4.600 Mtrs 3.050 Mtrs
33 KV 3.650 Mtrs 2.750 Mtrs
22 KV 3.650 Mtrs 2.750 Mtrs
11 KV 3.650 Mtrs 2.600 Mtrs

Standard Bay Width
VOLTAGE BAY WIDTH
400 KV 27.000 Mtrs
230 KV 15.900 Mtrs
110 KV 9.500 Mtrs
66 KV 7.000 Mtrs
33 KV 4.600 Mtrs
22 KV 3.800 Mtrs
11 KV 3.500 Mtrs

Single Busbar System
Single busbar with a sectionalizing
arrangement can be erected to give more
flexibility for operation and maintenance.
Single busbar with ring shaped bus can be
Constructed for connecting many feeders
from the substations.

Single Bus Scheme 1

Single Busbar System
This system consists of a single bus to which
various feeders are connected.
In case of a fault in bus / maintenance entire
bus bar has to be shut down.
Provides least flexibility.
Simple and most economical.
This type of layout is adopted for Small and
Medium size Substations and Power stations.

Double Bus Scheme 1

Double Busbar System
Double Busbar system consists of two buses to which all the
feeders emanating from a substations, are connected by
suitable switching arrangement.
Provides more flexibility, continuity of supply and periodical
maintenance on the bus is also possible without Total
shutdown.
In this arrangement the busbars are called Main and Reserve
Busbars.
A Breaker can be introduced between the buses to have
more operational flexibility.
A double busbar system with a Transfer bus are constructed
to have more reliability and easy maintenance of Equipment.
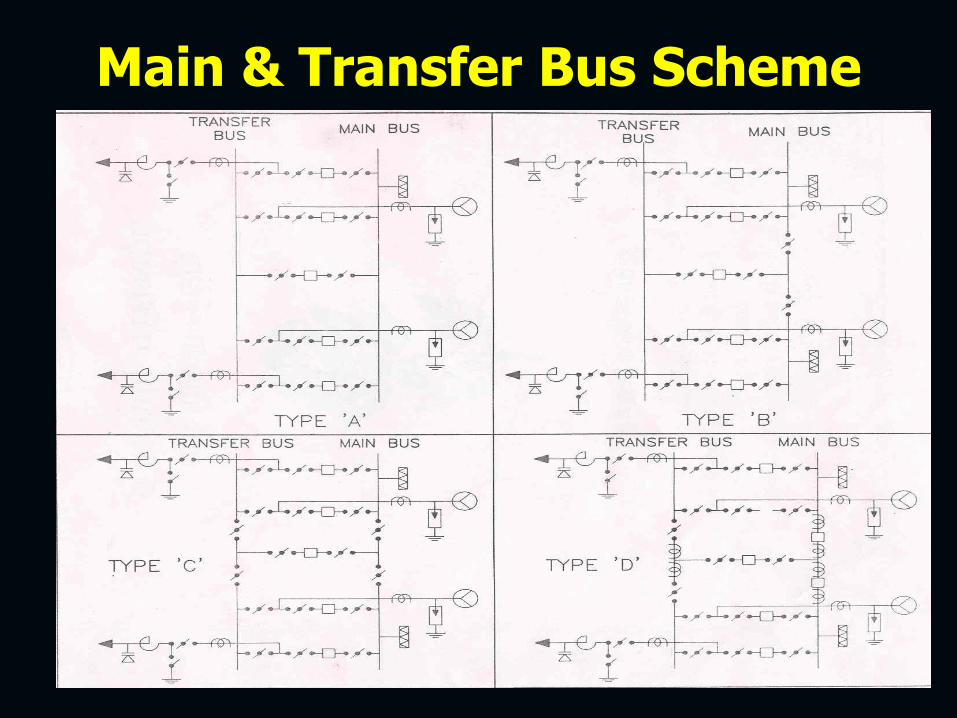
Main & Transfer Bus Scheme 1

Double Bus & Transfer Bus Scheme 1

One and a Half Breaker System 1

Double Busbar System
In this arrangement three circuit breakers are used to
control two feeders
Any circuit breaker can be switched off without difficulty for
maintenance works.
This system has high security against loss of supply.
Suitable for switch yards of large Generating stations
handling large quantity of Power in individual
circuits/feeders.
High cost but system security is very high.
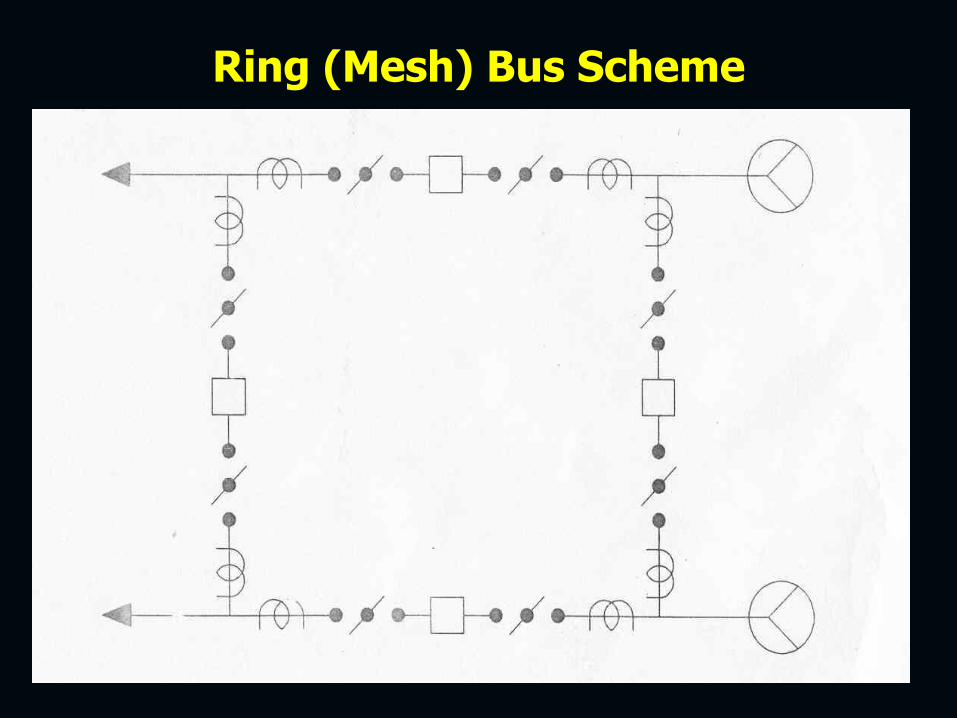
Ring (Mesh) Bus Scheme 1

Ring (Mesh) Bus Scheme
In this arrangement three circuit breakers are used to
control two feeders
This type of layout is used to minimize the no of Breakers
used in a Substation.
The breakers are connected in the mesh formed by the
buses.The circuits are tapped from the node points of the
Mesh.
Four breakers are utilized to control eight circuits.
This arrangement is widely used in United Kingdom.

33/11 KV Substation (Regular) - SLD
1

33/11 KV Substation (Regular) - Plan
1

110/22 KV or 110/11 KV Substation - SLD
1
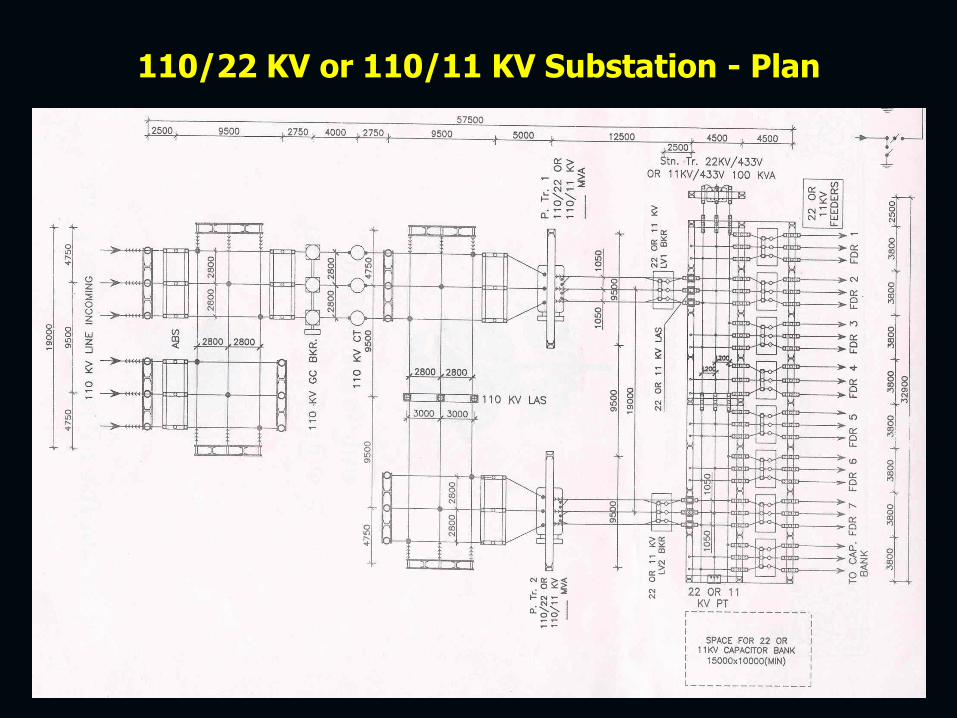
110/22 KV or 110/11 KV Substation - Plan
1

230/ 110 KV Substation – SLD (Single Bus)
1
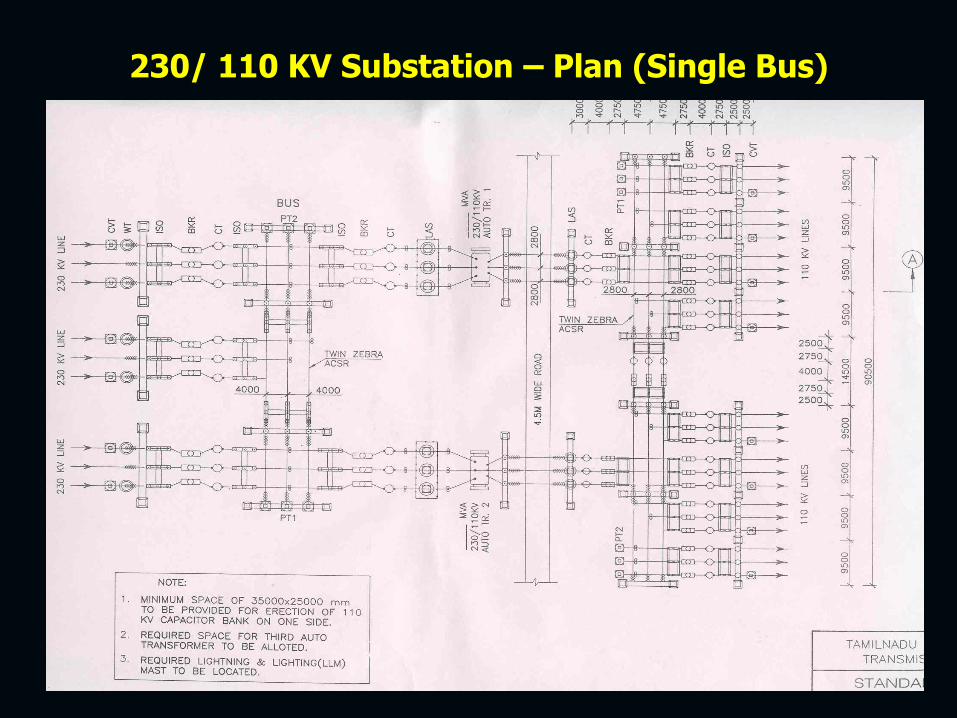
230/ 110 KV Substation – Plan (Single Bus)
1
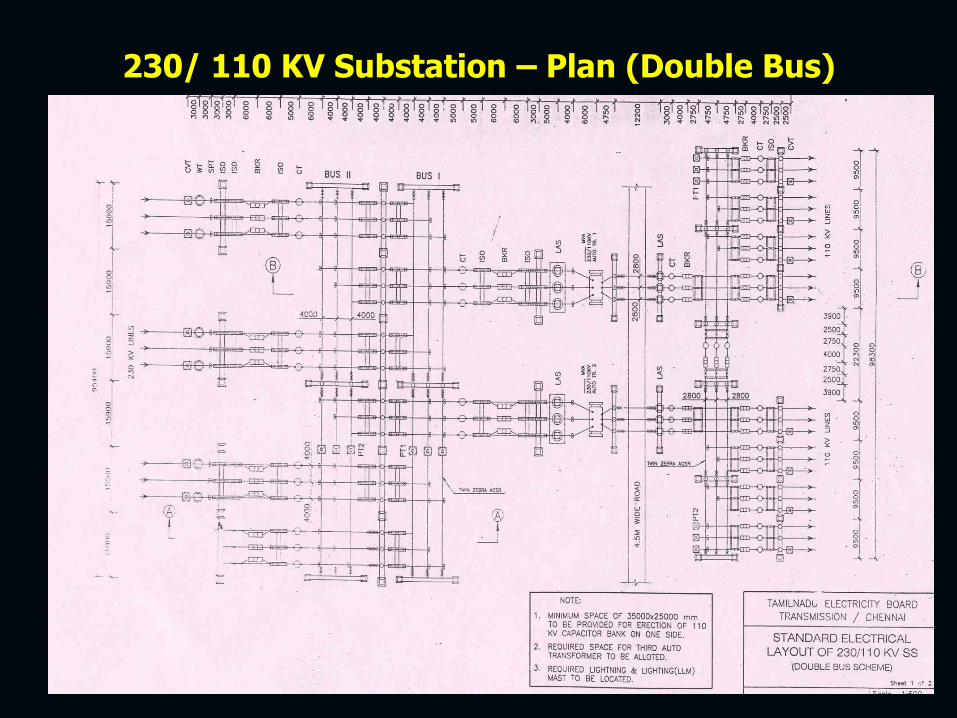
230/ 110 KV Substation – Plan (Double Bus)
1
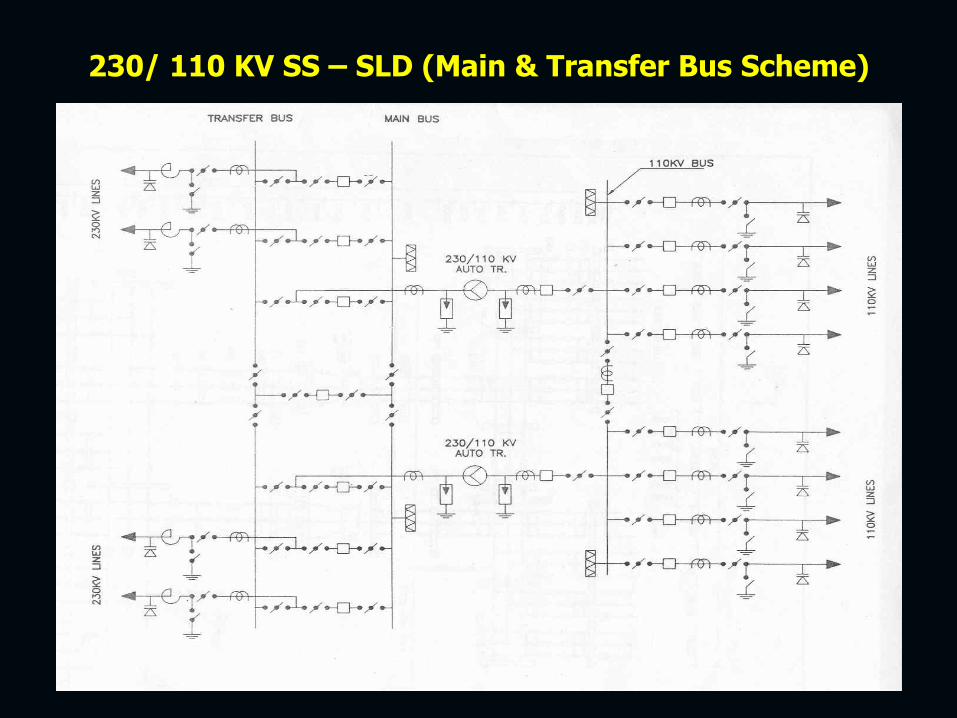
230/ 110 KV SS – SLD (Main & Transfer Bus Scheme)
1

230/ 110 KV SS – Plan (Main & Transfer Bus Scheme)
1

230/ 110 KV SS – SLD (Double Bus Scheme)
1

230/ 110 KV SS – Elevation (Double Bus Scheme)
1

400/230 KV SS – SLD (One and a Half Breaker System)
1
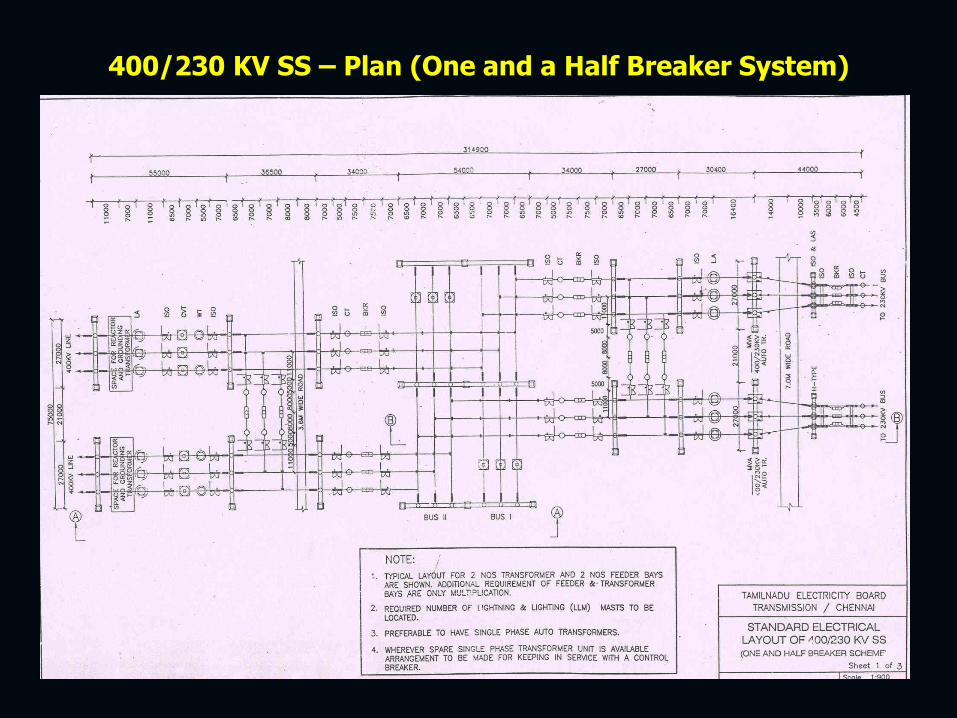
400/230 KV SS – Plan (One and a Half Breaker System)
1

Standard clearances in outdoor sub-stations
1
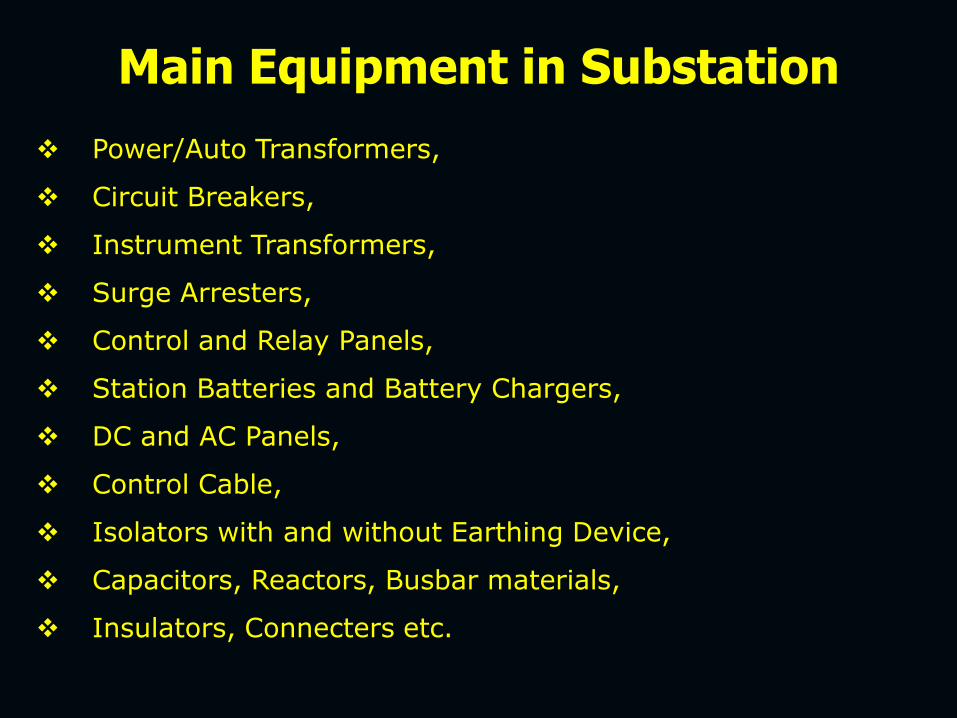
Main Equipment in Substation
Power/Auto Transformers,
Circuit Breakers,
Instrument Transformers,
Surge Arresters,
Control and Relay Panels,
Station Batteries and Battery Chargers,
DC and AC Panels,
Control Cable,
Isolators with and without Earthing Device,
Capacitors, Reactors, Busbar materials,
Insulators, Connecters etc.

Main Equipment in Substation
Selection of right type of LAYOUT,
EQUIPMENTS of adequate ratings and
correct PROTECTION system will make the
Power system Safe, Secure and also give
operational Flexibility.

Best Maintenance
Practices/ Condition
Monitoring for Reliability
of EHV Substation
Equipments

Maintenance Practices
Preventive Maintenance
Breakdown Maintenance
Total Productive Maintenance (TPM)
Condition Based Maintenance (CBM)
Pro-Active Maintenance
Reliability Centered Maintenance (RCM)
Maintenance Prevention
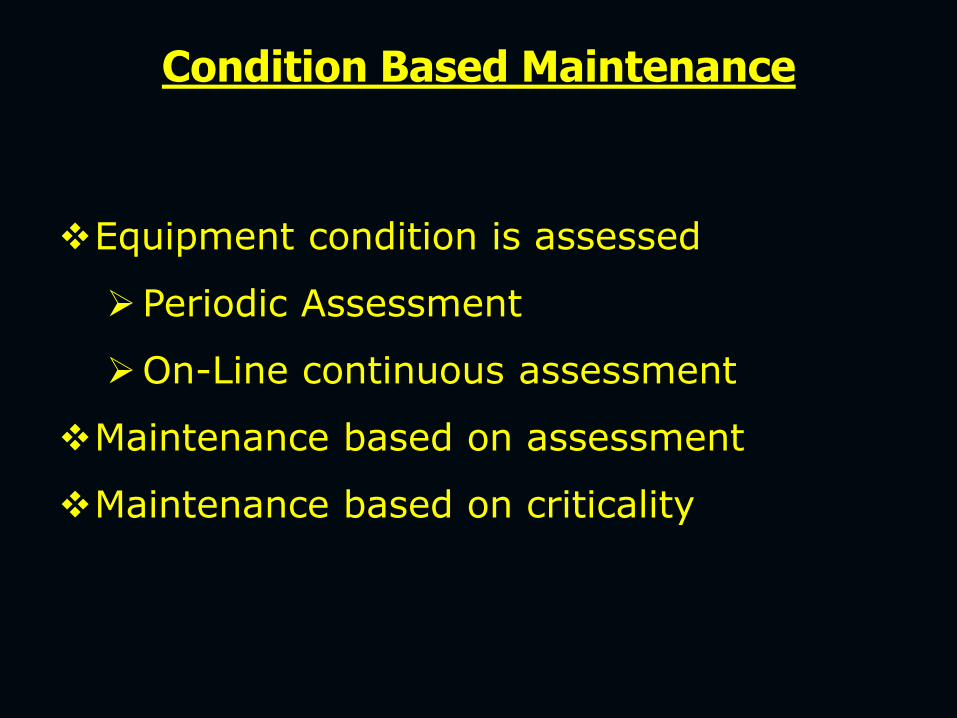
Condition Based Maintenance
Equipment condition is assessed
Periodic Assessment
On-Line continuous assessment
Maintenance based on assessment
Maintenance based on criticality

Switchyard Equipment
Transformers/ Reactors
Circuit Breakers
Current Transformers
Capacitive Voltage Transformers
Surge Arresters
Dis-Connectors

Transformers
Core
Coil
Solid Insulation
Liquid Insulation
Cooling System
Bushings

Expected Problems in Transformers
Core/ Winding Movement
Bad joints
Wet Insulation
Winding Insulation Deterioration
Bushing Insulation Deterioration
Deterioration of oil quality
Blocked cooling system
Partial Discharge and Over Heating

Transformer Failure Statistics- PGCL
1
Winding 19%
Shields and Leads
6%
Bushing 69%
Tap Changer 6%

Core/ Winding Movement
Magnetic Balance Test
Excitation Current Measurement
Short Circuit Impedance
Measurement
Frequency Response Analysis
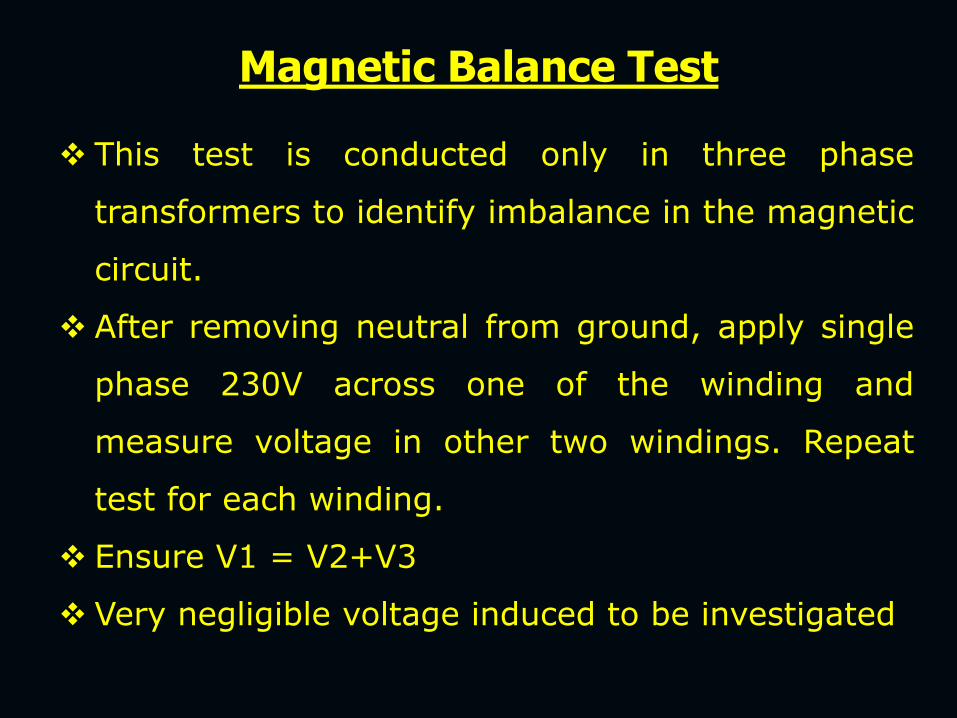
Magnetic Balance Test
This test is conducted only in three phase
transformers to identify imbalance in the magnetic
circuit.
After removing neutral from ground, apply single
phase 230V across one of the winding and
measure voltage in other two windings. Repeat
test for each winding.
Ensure V1 = V2+V3
Very negligible voltage induced to be investigated
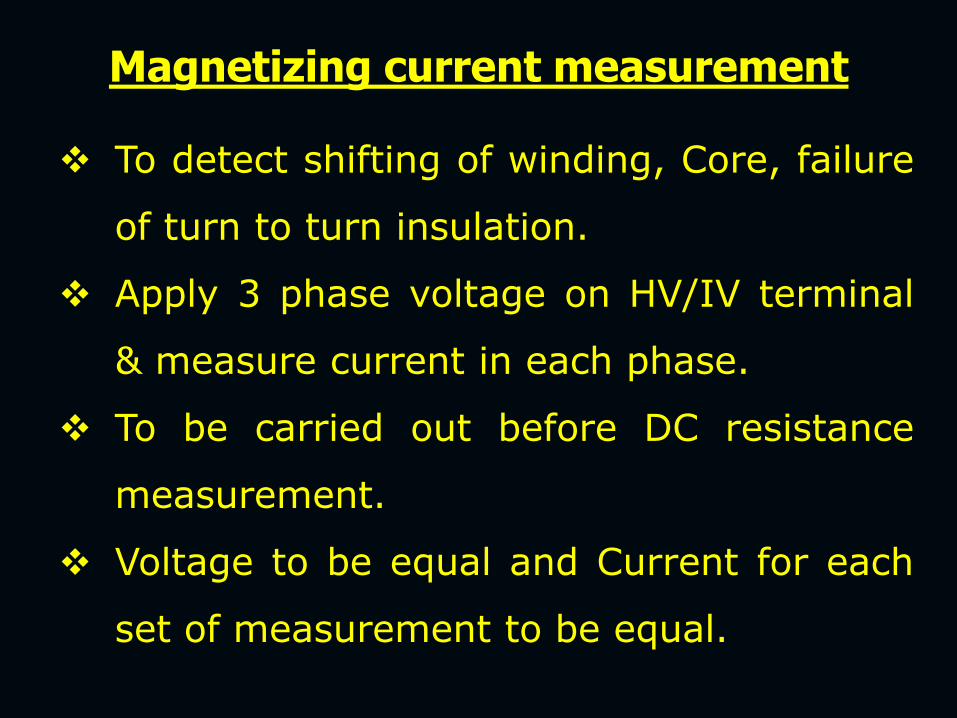
Magnetizing current measurement
To detect shifting of winding, Core, failure
of turn to turn insulation.
Apply 3 phase voltage on HV/IV terminal
& measure current in each phase.
To be carried out before DC resistance
measurement.
Voltage to be equal and Current for each
set of measurement to be equal.

Interpretation
Test results on the outside legs should be
within 15% of each other.
Value for center leg should not be more
than either outside.
For 1Phase transformer value should not
be more than 10% variation.
Not more than 5% on the previous
reading.

Frequency Response Analysis (FRA)
Mechanical movement of winding may occur during
transportation shocks or Short Circuit forces or due
to ageing and may result in dielectric failure of
transformer.
Such winding displacement may not be detected by
DGA, winding resistance or C &Tan measurement.
Techniques available to detect such changes are FRA
or Vibration Measurement.

Principle OF FRA
Applied impulse signal and the corresponding winding
responses are recorded using a high performance digitizer.
Results transformed into frequency domain by Fast Fourier
Transform calculation.
A response function is obtained which is dependent almost
entirely on the test object and is independent of applied
signal and test circuit.
The changes in the test object can be more clearly and
consistently identified.
The technique used for FRA analysis is a sweep frequency
technique which is suitable for site use and has a superior
signal to noise performance at high frequencies.

FRA TEST SET-UP 1
Sinusoidal signal output of
approximately 2 V rms from
the Frequency Response
Analyser is applied.
One measuring input (R1) is
connected to the end of a
winding and the other
measuring input (T1) is
connected to the other end of
the winding. (Tank earthed)
The voltage transfer function
T1/R1 is measured for each
winding for five standard
frequency scans from 5 Hz to
10 MHz.

SFRA Variation with Tap position
Main winding
responses
unchanged
Tap winding responses show stepwise variation

FRA Interpretation
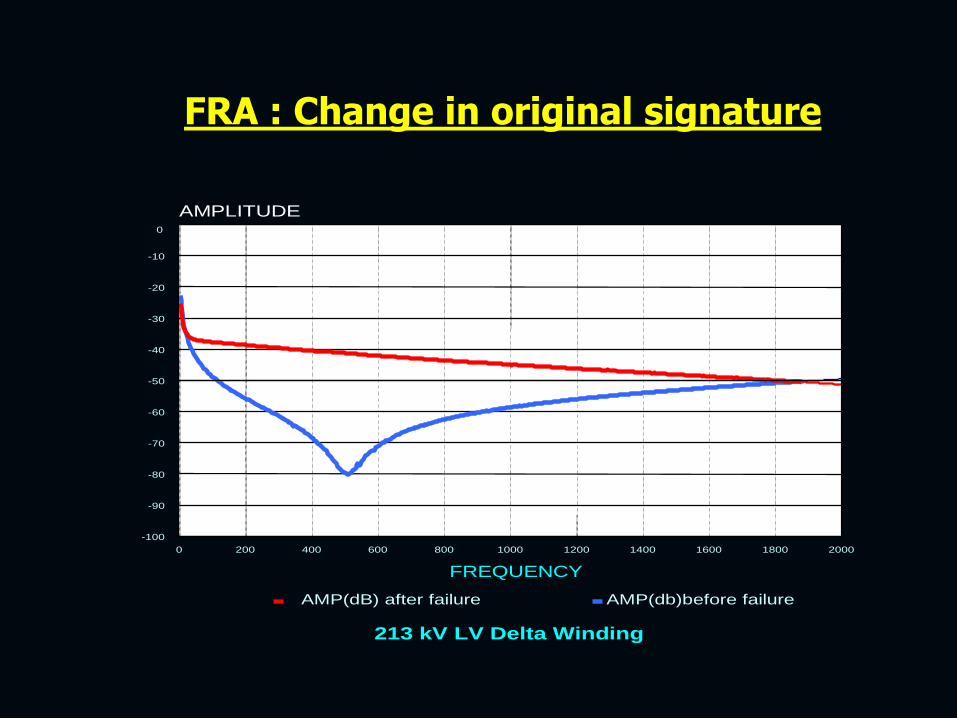
FRA : Change in original signature
213 kV LV Delta Winding
0 200 400 600 800 1000 1200 1400 1600 1800 2000
FREQUENCY
0
-10
-20
-30
-40
-50
-60
-70
-80
-90
-100
AMPLITUDE
AMP(dB) after failure AMP(db)before failure

FRA : Change in original signature

Advantages of FRA
FRA detects winding movement, which cannot be
ascertained by any other commonly known test
FRA test is sensitive and very repeatable
FRA is very powerful and effective tool and capable
of detecting a range of transformer faults, it is
nevertheless primarily a mechanical condition
assessment test and must be used in conjunction
with other diagnostic tests if a complete picture of
the condition of the transformer is to be obtained.

Winding Resistance Measurement to detect bad joints
Measured in the field in order to check for
abnormalities due to loose connections.
Interpretation of results is based on comparison with
previous results.
Within 5% deviation in result is accepted.
Measured values to be converted to the reference
temperature.

Winding Resistance
Winding Resistance is very sensitive to
temperature.
Hence temperature to be noted at the
time of measurement.
Resistance is converted to base
temperature for comparison.
R75 = Rm (75 + 235)
( Tm + 235)

Wet Insulation
Oil ppm
Recovery Voltage Measurement
Measurement of Relative Saturation
Winding Capacitance tanδ measurement


Typical Values of Water Content in Oil & Paper
Water Content at the Time of Commissioning
In Paper 0.5% 30 Liters
In oil 5 ppm 0.4 Liters
After 25 years of service
In Paper 2.5% 150 Liters
In Oil 20 ppm 1.6 Liters

Dependency between the water content in mineral oil and cellulose paper

Recovery Voltage
Measurement
(RVM)
Applying DC Voltage to the insulation, molecules are
polarized and turn in the direction of the Electric Field.
A short circuit is subsequently applied for a short
period of time and molecules are partially depolarized.
Opening the short circuit, a voltage due to remaining
charge will build up between the terminals of the
insulation. This is called Recovery Voltage.
The equivalent circuit which best describes the
phenomenon of the polarization is serial R-C circuit.
Physics behind RVM
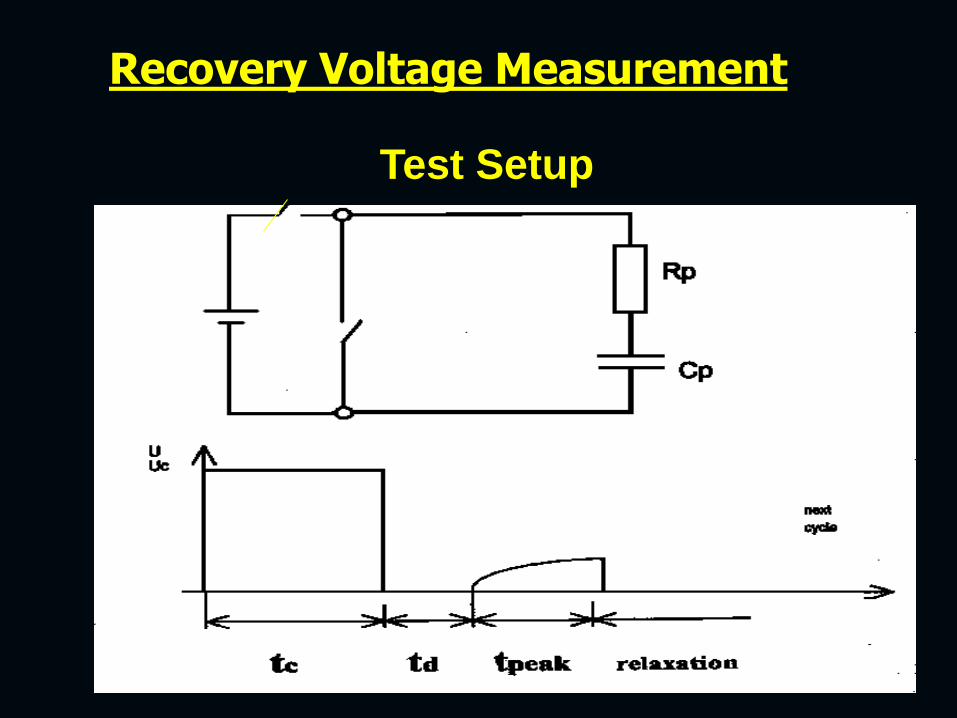
Recovery Voltage Measurement
Test Setup

Recovery Voltage Measurement

2 kV DC is applied across the insulation for
a particular time
Insulation is shorted for half the time
Then recovery voltage is measured till the
maximum recovery voltage is reached
Maximum recovery voltage against time is
plotted
Method of Measurement
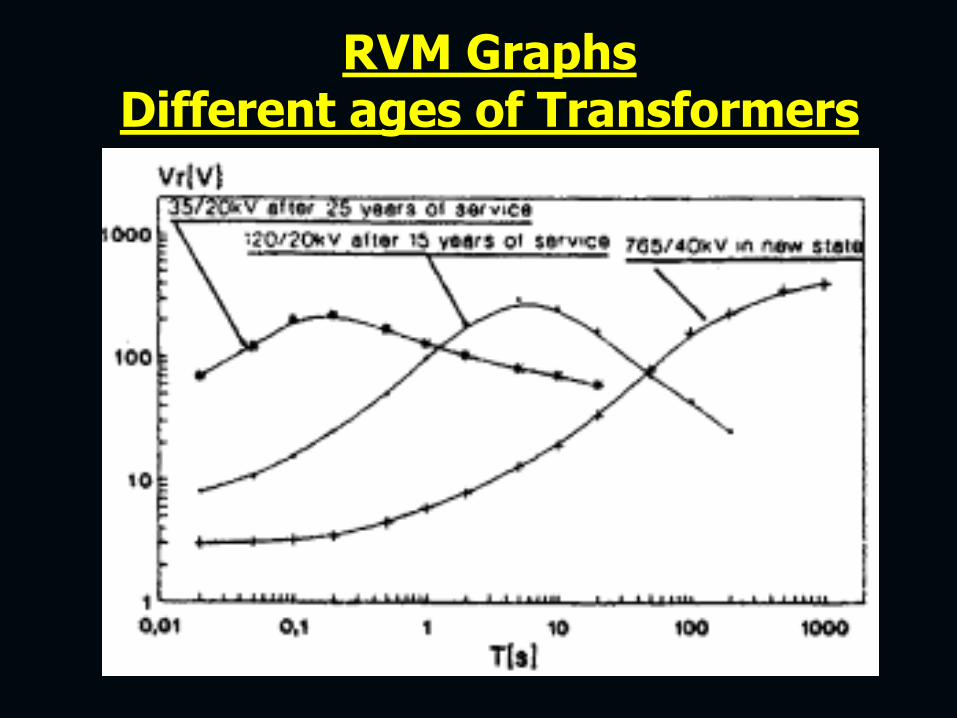
RVM Graphs Different ages of Transformers

Multiple peaks indicate non-
homogeneous dryness of winding.
More time constant indicates
healthiness of insulation.
Less time constant indicates wetness of
winding.
Method of Measurement

Before and after dry out
On-line
Moisture
Measurement

DOMINO test is used to determine the moisture
content of oil in Transformers and Reactors.
The sensor made of Thin Polymer film -
measures Capacitance.
The Capacitance changes proportional to the
change in relative saturation of water in oil.
On-line Moisture Measurement through Domino

Domino Principle
Relative Saturation (RS) is
RS = Wc * 100/S (%)
Where
Wc is concentration of water in oil &
S is Solubility of water in oil that can be held at a
given temperature
Solubility of water in oil (S) at a given temperature
is computed from,
logS = -1567/K + 7.0895
Where K is temperature in ºK

Relative Saturation

The instrument measures RS and ppm of
water
The output is locally displayed as well
downloaded to PC through RS-232 port.
Domino
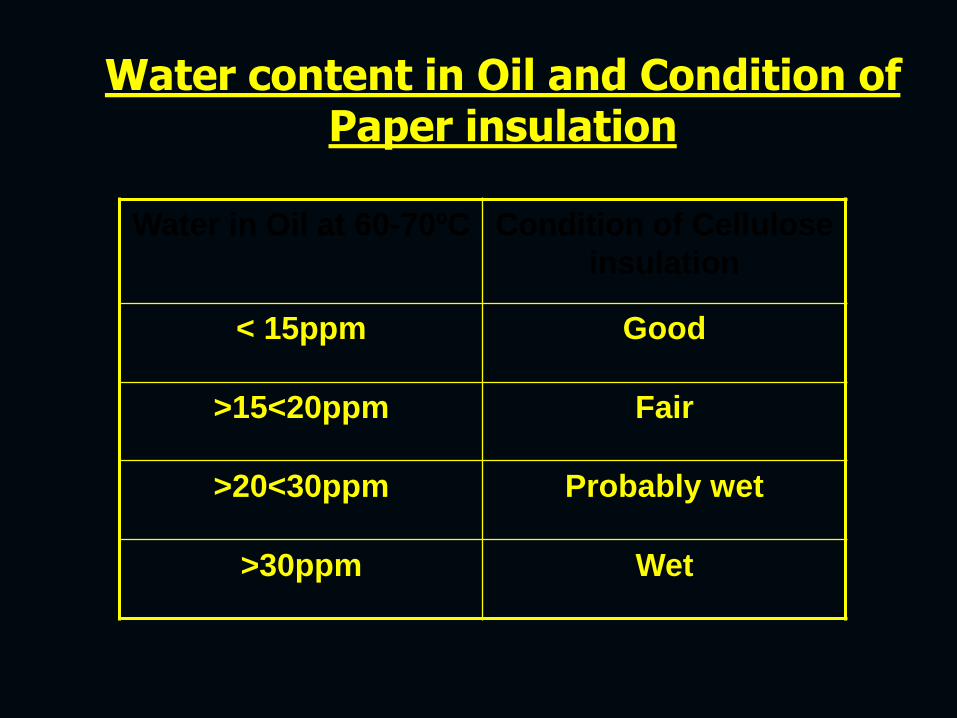
Water in Oil at 60-70ºC Condition of Cellulose
insulation
< 15ppm Good
>15<20ppm Fair
>20<30ppm Probably wet
>30ppm Wet
Water content in Oil and Condition of Paper insulation
Deterioration of Winding Insulation
Capacitance and tanδ Measurement

Results are affected by external
interference
Interference suppression methods
Non-Repeatability of test results
Proper knowledge on connection and
measurement
Trend Analysis
Problems with the measurement
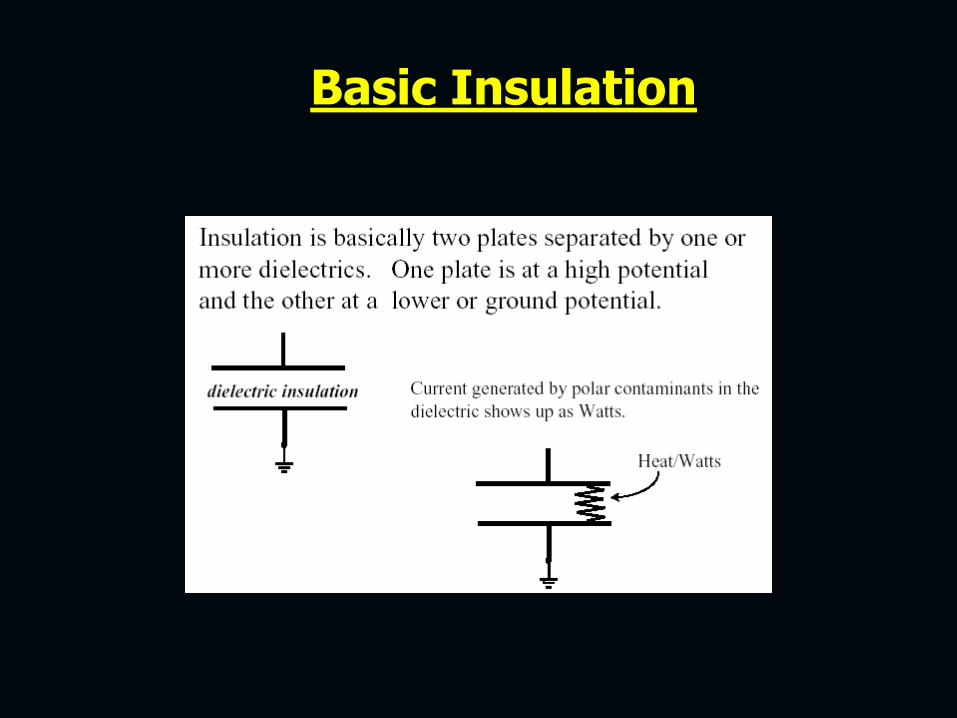
Basic Insulation
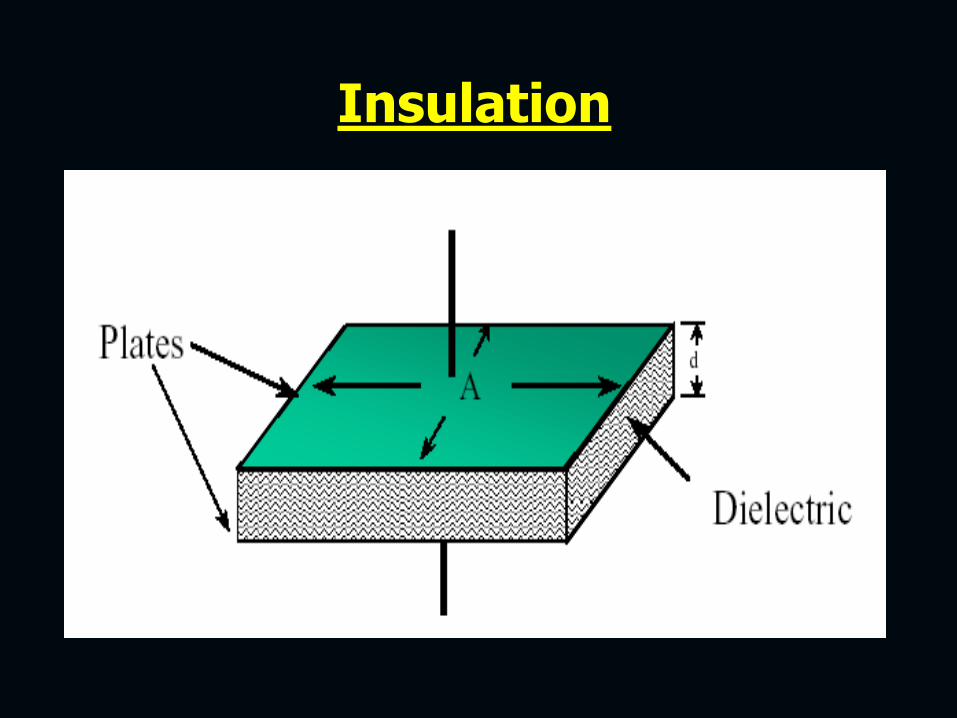
Insulation

Capacitance of Insulation

Effect of Medium
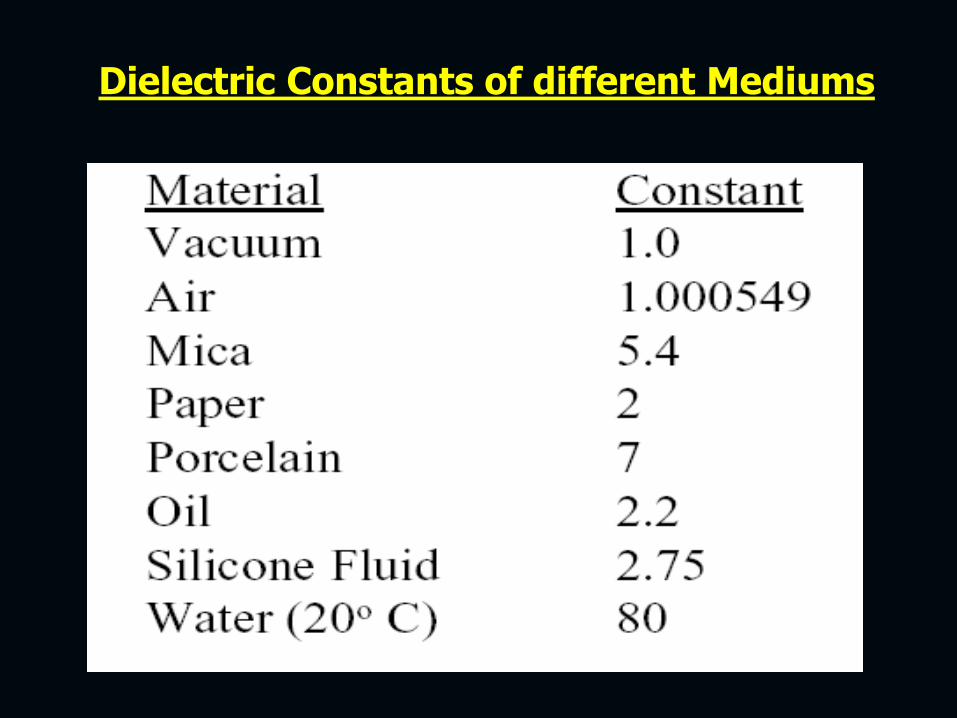
Dielectric Constants of different Mediums

Equivalent Circuit
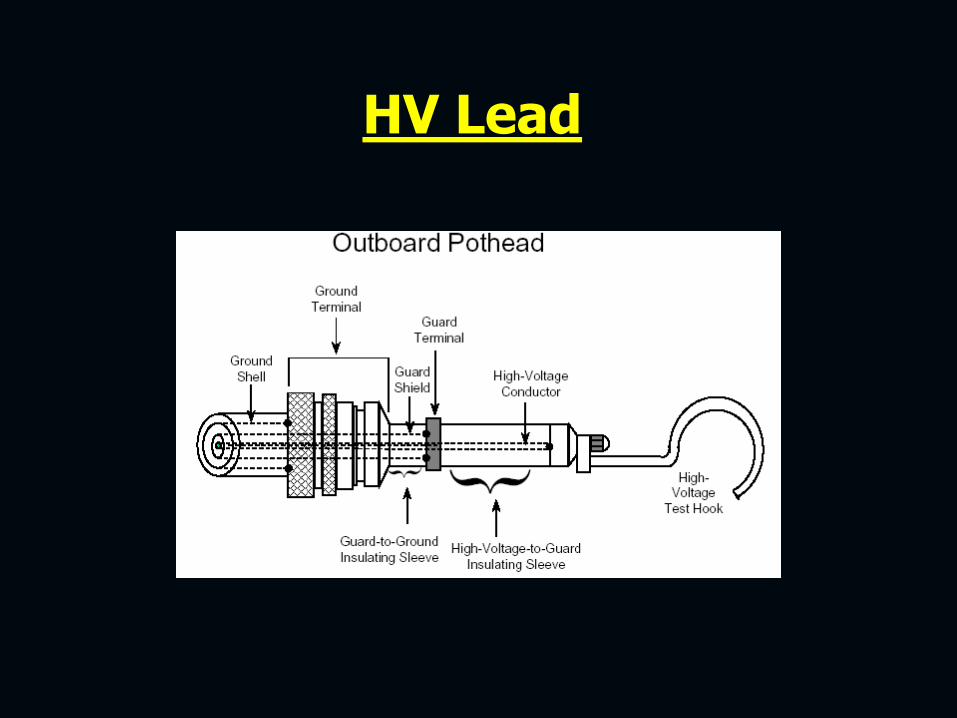
HV Lead

Interference
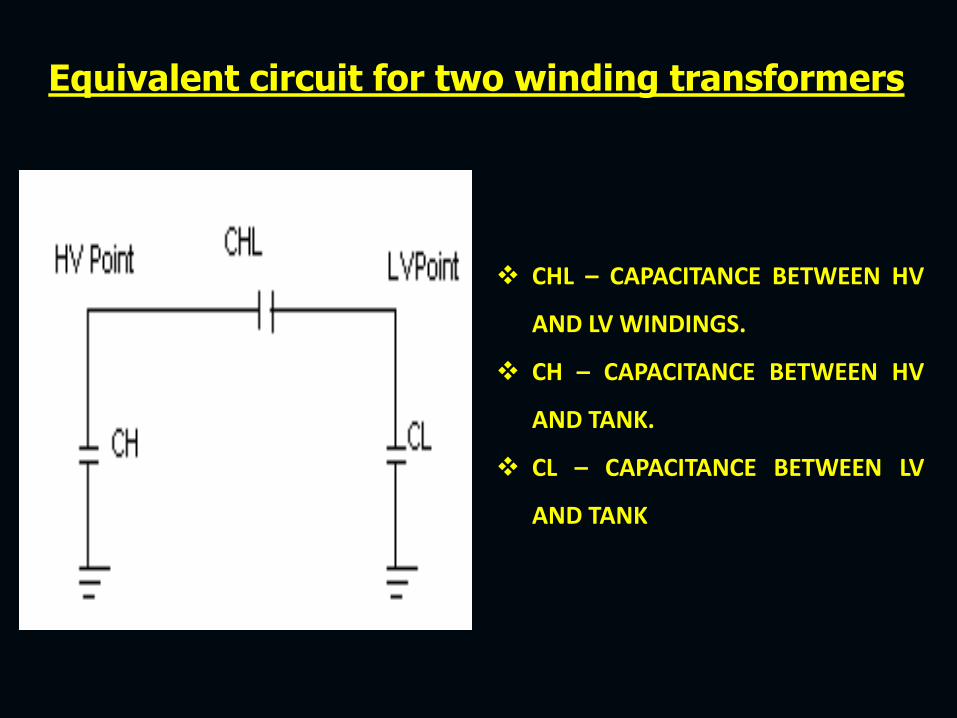
Equivalent circuit for two winding transformers
CHL – CAPACITANCE BETWEEN HV
AND LV WINDINGS.
CH – CAPACITANCE BETWEEN HV
AND TANK.
CL – CAPACITANCE BETWEEN LV
AND TANK

Reliable instrument.
Jumpers to be disconnected for
Transformer/ Reactor winding capacitance
and Tan Delta measurement.
It should not be a rainy day.
Porcelain surface needs to be cleaned
thoroughly.
Precautions for Cap and Tan Delta Measurement

Transformer Windings

Shorting of Jumpers
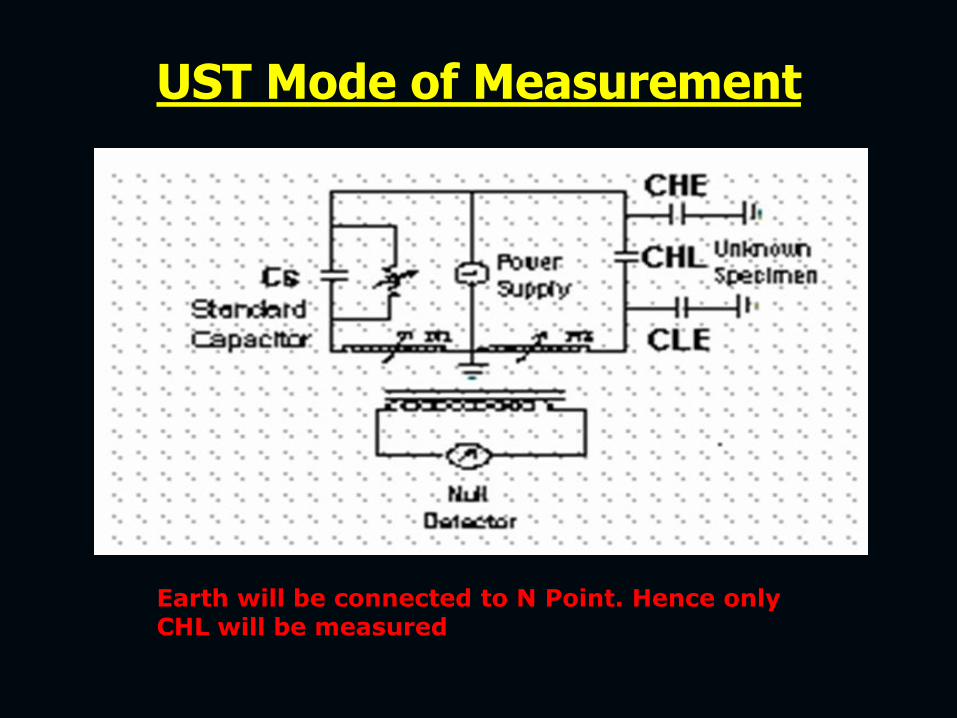
UST Mode of Measurement
Earth will be connected to N Point. Hence only CHL will be measured

GST Mode of Measurement
Here measurement is made for the Parallel combination of CH and CHL.
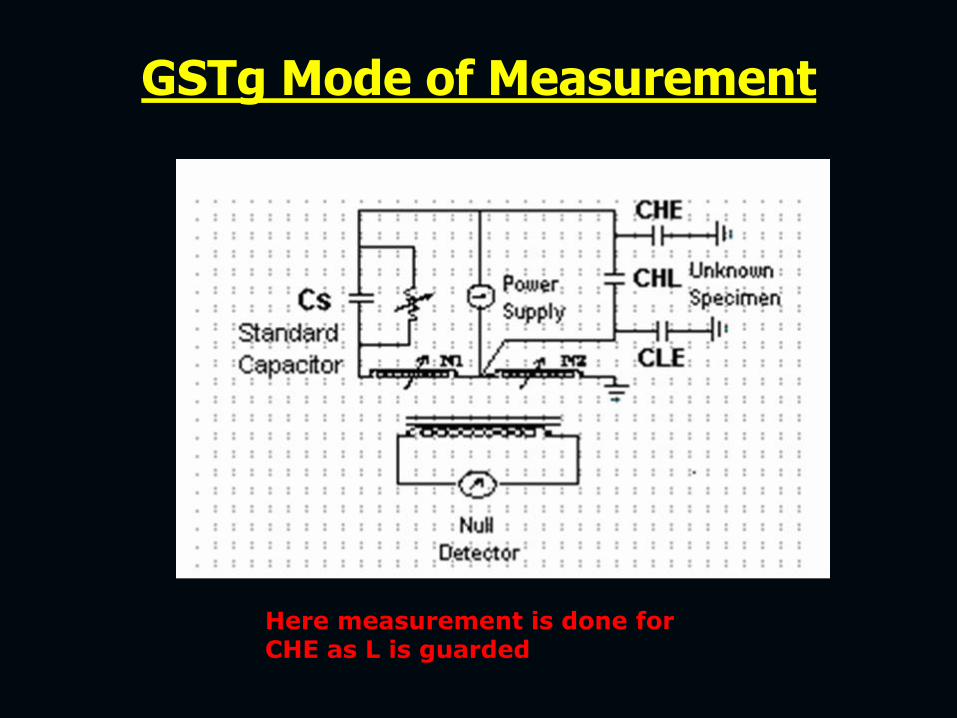
GSTg Mode of Measurement
Here measurement is done for CHE as L is guarded

Construction of Bushings
Grading of insulation
C1 and C2 Tan delta measurement
Condition Monitoring of Bushings

CT Insulation

C1 and C2 Tan delta measurement
For C1: Apply 10kV between HV and test tap on UST mode. For C2: Apply 500 V between Test tap and Ground with HV Guarded on GSTg mode

? ? ? ? ? ?
1

? ? ? ? ? ?
1

Dissolved
Gas
Analysis

Summary of various interpretation technique for DGA data
Individual Fault Gases Acceptable Norms
Total Dissolved Combustible Gas (TDCG) limits
IEC 60599 Method
IEEE Standard C: 57.104/1995
Key Gas Method
Ratio Methods
Doernenberg Ratio Method
Rogers Ratio Method
Trend Analysis

Key to successful DGA interpretation
Well documented sampling procedure based on
IEC 60567.
Efficient gas extraction system (with more than
98% of gas extraction).
Accurate and precise gas chromatograph.
Well trained manpower to conduct the tests.
Documentation of DGA data and its
interpretation.

Sampling frequencies
Before commissioning
24 hours after 1st charging
15 days after 1st charging
One month after 1st charging
3 months after 1st charging
Thereafter every six months
Powergrid practice

Origin of fault gases
1. Corona or partial discharge
2. Pyrolysis or thermal heating
3. Arcing
These three causes differ mainly in the intensity of
energy dissipation per unit time per unit volume by
fault.
Most severe intensity of energy dissipation occurs
with arcing less with heating and least with corona.
Basics of DGA

Temperatures at which Gases evolve
METHANE (CH4) 1200 C
ETHANE (C2H6) 1200 C
ETHYLENE (C2H4) 1500 C
ACETYLENE (C2H2) 7000 C
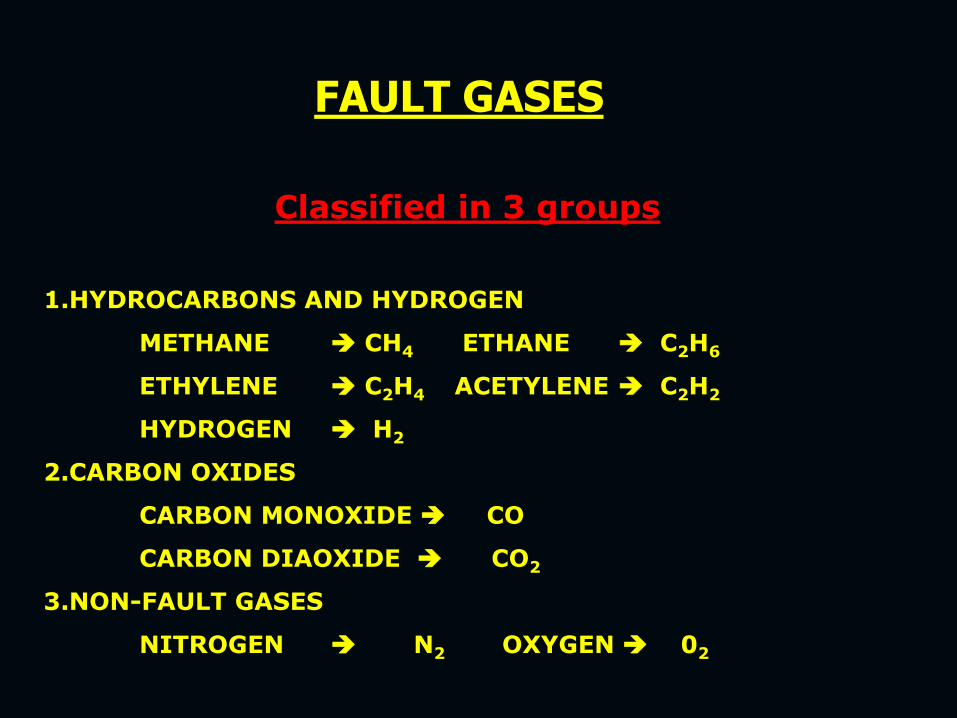
Classified in 3 groups
1.HYDROCARBONS AND HYDROGEN
METHANE CH4 ETHANE C2H6
ETHYLENE C2H4 ACETYLENE C2H2
HYDROGEN H2
2.CARBON OXIDES
CARBON MONOXIDE CO
CARBON DIAOXIDE CO2
3.NON-FAULT GASES
NITROGEN N2 OXYGEN 02
FAULT GASES

1. CORONA
A) OIL H2
B) CELLULOSE H2, CO, CO2
2. PYROLYSIS LOW TEMP. HIGH TEMP.
A) OIL CH4, C2H6 ; C2H4,H2(CH4,C2H2)
B) CELLULOSE CO2 (CO) ; CO (CO2)
3. ARCING H2, C2H2 (CH4, C2H6, C2H4)
Fault gases vs Type of material involved and type of fault

Hydrogen 7.0% (least soluble)
Nitrogen 8.6%
Carbon monoxide 9.0%
Oxygen 16.0%
Methane 30.0%
Carbon dioxide 120.0%
Ethane 280.0%
Ethylene 280.0%
Acetylene 400.0% (most soluble)
Solubility of gases in transformer oil by volume

FURAN
ANALYSIS

Monitoring of Cellulose (paper) insulation is important for in-
service transformers to know the condition of paper.
Taking paper samples from charged transformer not practicable
or rather impossible.
Furans are soluble by product which is produced due to ageing
or cellulose decomposition/ overheating.
Experimental tests have shown that DP of paper insulation is
inversely proportional to FFA level and FFA level of 5 ppm.
corresponds to a DP of 250 which is reckoned to be the lower
limit for insulation strength.
Furan analysis in oil

The Furfuraldehyde in oil analysis is recognized as a very
significant diagnostic test for paper condition assessment
The FFA content of the oil from an aged equipment can be
measured using a High Performance Liquid Chromatograph
(HPLC).
Another method is using Spectrophotometer
The concentration of Furfuraldehyde in the oil and rate of
generation of furfural can be used for assessing the condition
and remaining life of the paper insulation in the transformer
Furan analysis in oil

Blocked Cooling System
Thermo scanning of Radiators
Differential Temperature
High oil and Winding Temperature