EHealth Planning and Management Symposium 3 November 2008, Kopenhagen Assessing socio-economic and...
46
eHealth Planning and Management Symposium 3 November 2008, Kopenhagen Assessing socio-economic and clinical benefits from eHealth solutions - approach and evidence __________________________________________ Karl A. Stroetmann PhD MBA FRSM with Alexander Dobrev and Tom Jones empirica Communication & Technology Research Bonn, Germany
-
Upload
jared-warner -
Category
Documents
-
view
214 -
download
0
Transcript of EHealth Planning and Management Symposium 3 November 2008, Kopenhagen Assessing socio-economic and...

eHealth Planning and Management Symposium 3 November 2008,
Kopenhagen
Assessing socio-economic and clinical benefits from eHealth
solutions - approach and evidence__________________________________________
Karl A. Stroetmann PhD MBA FRSMwith Alexander Dobrev and Tom Jones
empirica Communication & Technology ResearchBonn, Germany
2eHealth Planning and Management Symposium 3 November 2008,
Kopenhagen
BONN - BRUSSELS

3eHealth Planning and Management Symposium 3 November 2008,
Kopenhagen
Contents
1. eHealth: an enabler for better health?2. The eHealth IMPACT methodology
– Study approach and process– Estimating benefits– Estimating costs– Outlook: guiding longer-term research
3. Summary empirical evidence4. Example : The Computerised Patient
Record (CPR) system at the University Hospitals of the Canton Geneva (HUG)
5. Success factors6. Conclusions and lessons learned
4eHealth Planning and Management Symposium 3 November 2008,
Kopenhagen
eHealth: an enabler for better health?

5eHealth Planning and Management Symposium 3 November 2008,
Kopenhagen
eHealth: an enabler for better health?
“For over thirty years, there have been predictions that the widespread clinical use of computers was imminent. Yet the ‘wave’ has never broken.”
eHealth has a history of more than 40 years of high-flying expectations and billions of euros invested in unsuccessful or only marginally ‘profitable’ ventures worldwide
“To date, HIT [health information technology] has been mostly the realm of enthusiasts. Practitioners have generally regarded EHRs as costly, cumbersome, and offering little help for tasks at hand.”
6eHealth Planning and Management Symposium 3 November 2008,
Kopenhagen
eHealth: an enabler for better health?
The scope for increase in demand for health services seems unlimited
The scope for increase in supply is restricted
Evidence suggests that eHealth has the potential to support healthcare providers in meeting growing demand
However, what may be technologically feasible, or even desirable, will not necessarily be economically viable or organisationally realised
7eHealth Planning and Management Symposium 3 November 2008,
Kopenhagen
Key elements of the “ new“ model of healthcare
Focus on health, not on sick care Focusing on the idiosyncrasies of the individual
citizen (personalised) Support & help at the point of need (home,
mobility, community, abroad, ...) Meeting new challenges (chronic diseases, medico-
technical progress causing an ageing population, ...)
If in need of healthcare, supply of collaborative, integrated, seamless services across all health value system actors (including LT and social care)
Support for optimal communication, sharing of data (from disclosure to access paradigm)
From reactive to preventive to predictive medicineeHealth tools and systems have the potential to
help us to finally realise this vision

8eHealth Planning and Management Symposium 3 November 2008,
Kopenhagen
The EHR Impact Methodology

9eHealth Planning and Management Symposium 3 November 2008,
Kopenhagen
EC-commissioned study on the
Socio-economic impact of interoperable electronic health record
and ePrescription systems in Europe Identification, analysis and evidence on 10 good
practice cases Policy recommendations to foster their diffusion in
Europe Follow-up to eHealth IMPACT study (www.ehealth-
impact.org) analysing also 10 good practice cases
9
Context
www.ehr-impact.eu

10eHealth Planning and Management Symposium 3 November 2008,
Kopenhagen
The eHealth IMPACT development process
Development of a generic methodology, methods and tools for the economic evaluation of today’s eHealth applications
Detailed evaluation of 2 (to validate the methodology) plus further 8 routine eHealth applications
Synthesis, vision, and policy recommendations to encourage appropriate future eHealth investments
Further case studies applying and developing the methodology
Development towards an investment analysis method for realistically assessing the business perspective of investments in tomorrow’s eHealth services (Financing eHealth study)
11eHealth Planning and Management Symposium 3 November 2008,
Kopenhagen
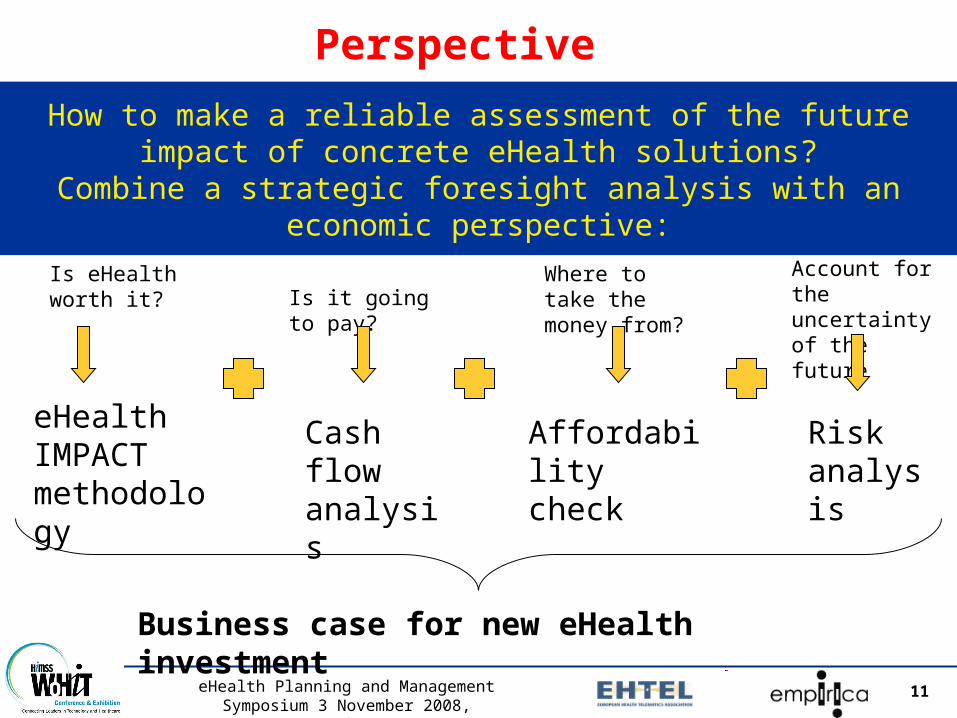
How to make a reliable assessment of the future impact of concrete eHealth solutions?
Combine a strategic foresight analysis with an economic perspective:
eHealth IMPACT methodology
Cash flow analysis
Affordability check
Risk analysis
Business case for new eHealth investment
Is eHealth worth it? Is it going to
pay?
Where to take the money from?
Account for the uncertainty of the future
Perspective

12eHealth Planning and Management Symposium 3 November 2008,
Kopenhagen
Measuring the impact of eHealth – the approach
1. Identify scope and borders of an eHealth-supported routine service
2. Describe eHealth solution, measure its utilisation
3. Identify timeline4. Estimate known and expected costs 5. Estimate benefits6. Analyse data, adjust for optimism bias and
contingency, perform sensitivity analysis7. Review with research team and sites8. Report on past and expected performance
13eHealth Planning and Management Symposium 3 November 2008,
Kopenhagen
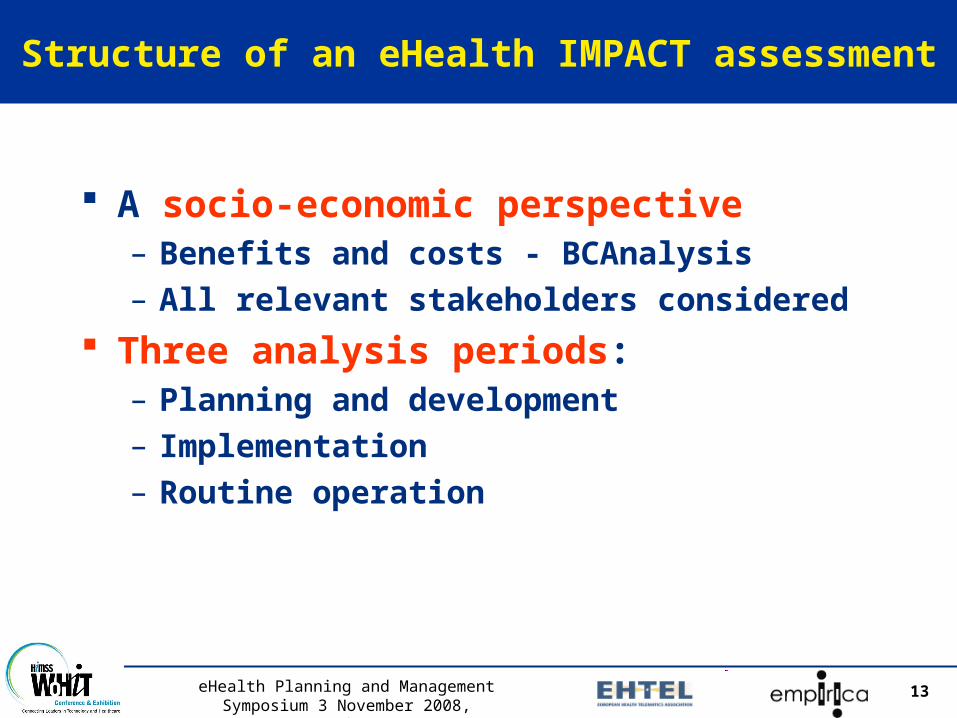
Structure of an eHealth IMPACT assessment
A socio-economic perspective– Benefits and costs - BCAnalysis– All relevant stakeholders considered
Three analysis periods:– Planning and development– Implementation– Routine operation

14eHealth Planning and Management Symposium 3 November 2008,
Kopenhagen
Stakeholder analysis
Patients, carers, and other citizens Healthcare staff – professionals,
teams Health service provider
organisations Third parties
– Insurance companies– Other payers– Governments– Public authorities
Not: secondary/tertiary impacts
15eHealth Planning and Management Symposium 3 November 2008,
Kopenhagen
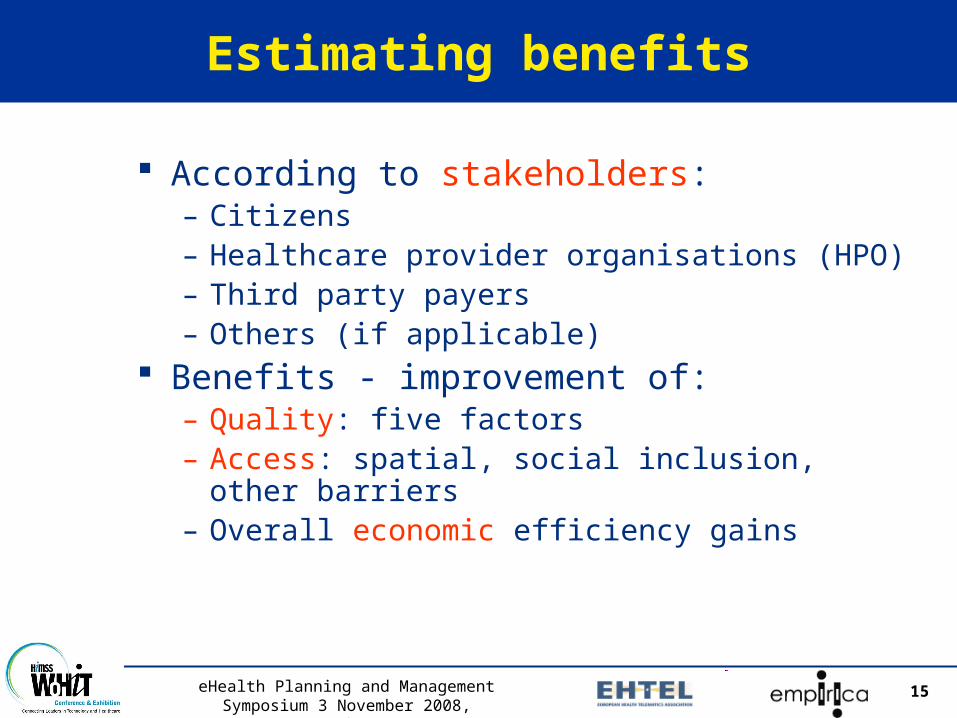
Estimating benefits
According to stakeholders:– Citizens– Healthcare provider organisations (HPO)– Third party payers– Others (if applicable)
Benefits - improvement of:– Quality: five factors– Access: spatial, social inclusion, other
barriers– Overall economic efficiency gains

16eHealth Planning and Management Symposium 3 November 2008,
Kopenhagen
Estimating benefits – quality of healthcare
Better informed citizens and carers Information designed to streamline
healthcare processes Improved timeliness of care Patient safety / risk management Improved effectiveness of care
service
17eHealth Planning and Management Symposium 3 November 2008,
Kopenhagen
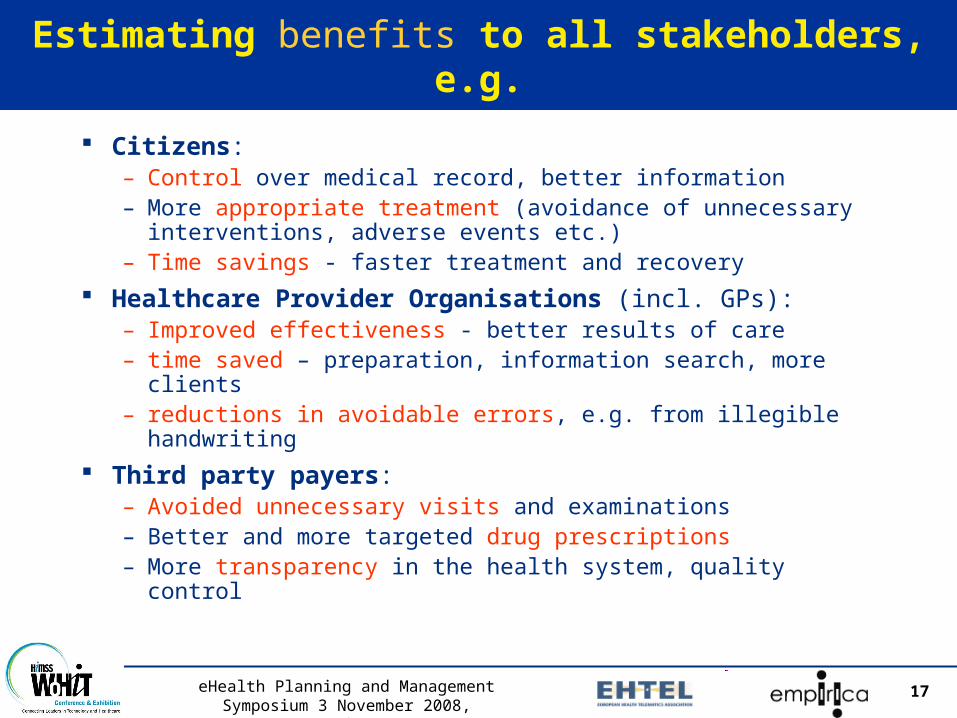
Estimating benefits to all stakeholders, e.g.
Citizens:– Control over medical record, better information– More appropriate treatment (avoidance of unnecessary
interventions, adverse events etc.)– Time savings - faster treatment and recovery
Healthcare Provider Organisations (incl. GPs):– Improved effectiveness - better results of care– time saved – preparation, information search, more
clients– reductions in avoidable errors, e.g. from illegible
handwriting
Third party payers:– Avoided unnecessary visits and examinations– Better and more targeted drug prescriptions– More transparency in the health system, quality control
18eHealth Planning and Management Symposium 3 November 2008,
Kopenhagen
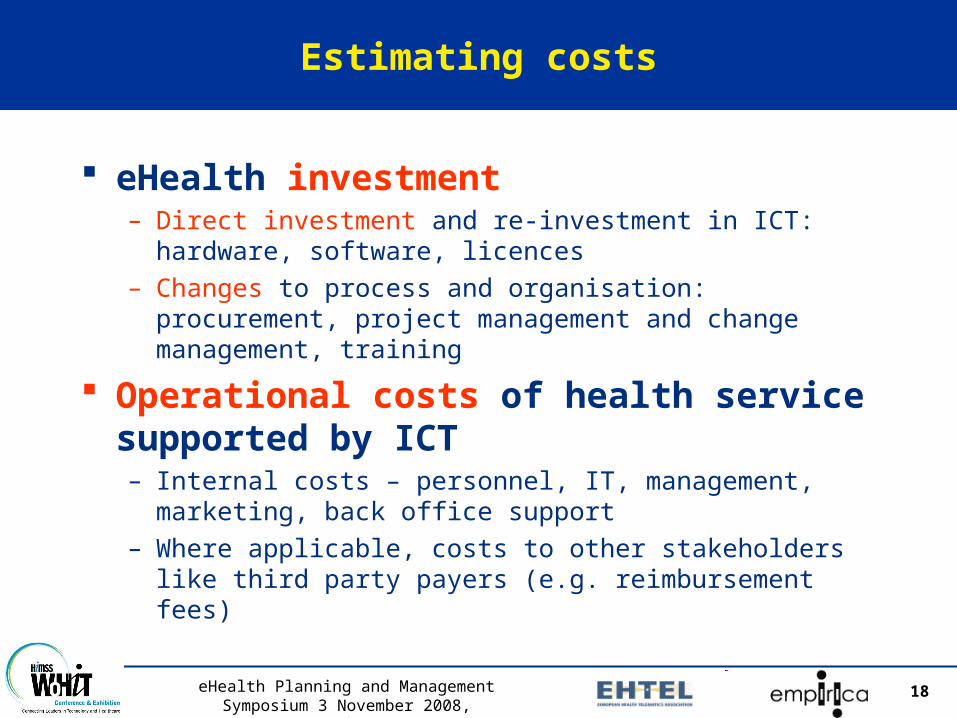
Estimating costs
eHealth investment– Direct investment and re-investment in ICT: hardware,
software, licences– Changes to process and organisation: procurement, project
management and change management, training
Operational costs of health service supported by ICT– Internal costs – personnel, IT, management, marketing, back
office support– Where applicable, costs to other stakeholders like third party
payers (e.g. reimbursement fees)
19eHealth Planning and Management Symposium 3 November 2008,
Kopenhagen
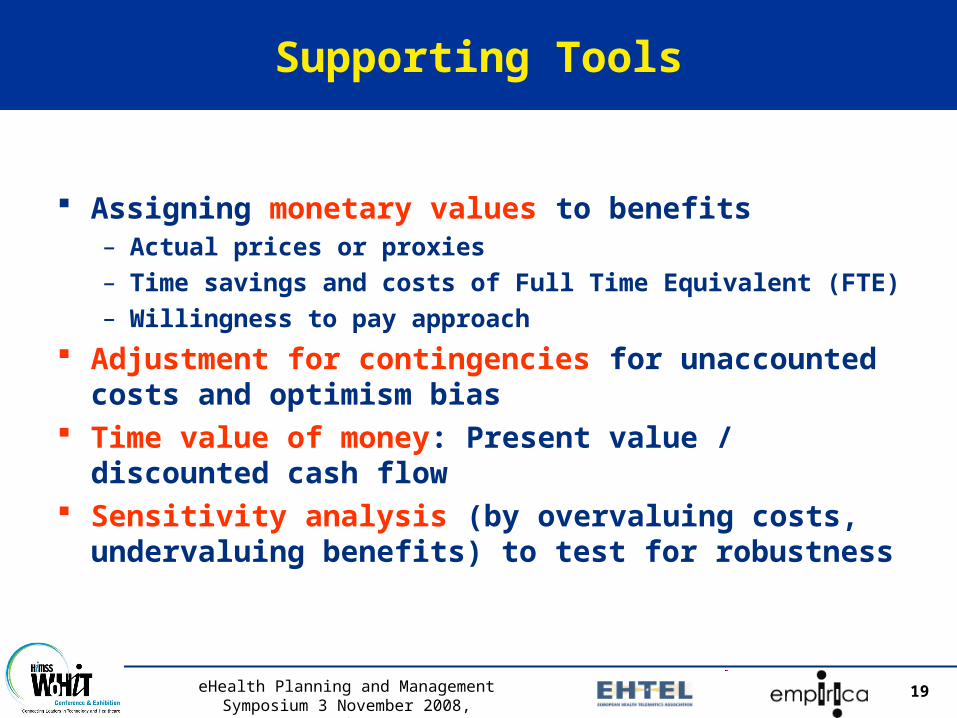
Supporting Tools
Assigning monetary values to benefits– Actual prices or proxies– Time savings and costs of Full Time Equivalent (FTE)– Willingness to pay approach
Adjustment for contingencies for unaccounted costs and optimism bias
Time value of money: Present value / discounted cash flow
Sensitivity analysis (by overvaluing costs, undervaluing benefits) to test for robustness
20eHealth Planning and Management Symposium 3 November 2008,
Kopenhagen
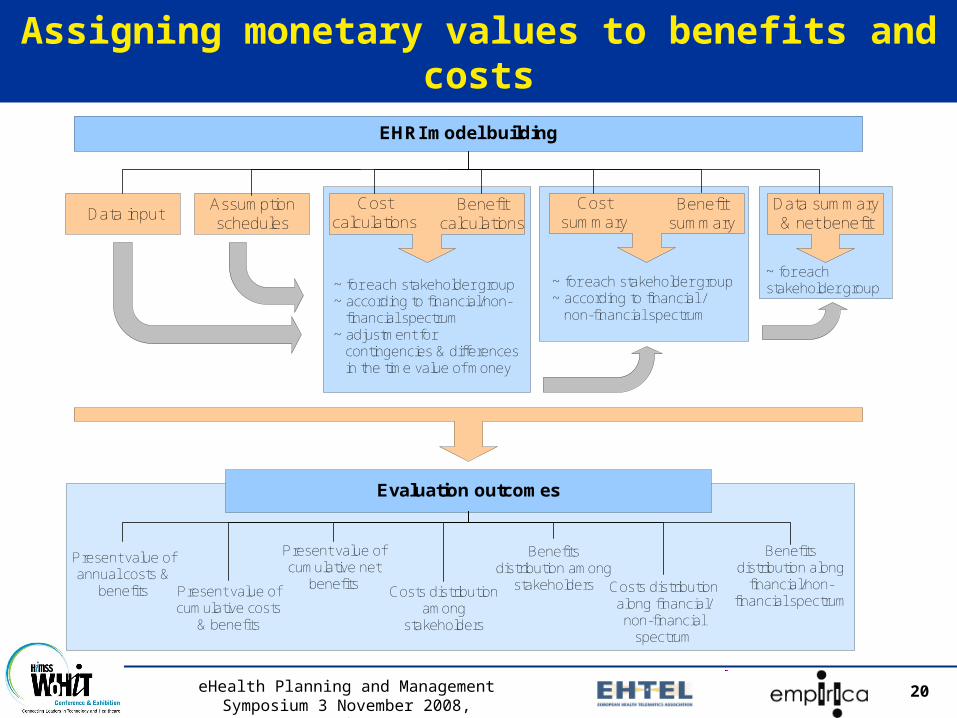
Assigning monetary values to benefits and costs
EHRI model building
Data inputAssumptionschedules
~ for each stakeholder group~ according to financial/non- financial spectrum~ adjustment for contingencies & differences in the time value of money
~ for each stakeholder group~ according to financial / non-financial spectrum
Data summary& net benefit
~ for eachstakeholder group
Evaluation outcomes
Present value ofannual costs &
benefits Present value ofcumulative costs
& benefits
Present value ofcumulative net
benefitsCosts distribution
amongstakeholders
Benefitsdistribution among
stakeholders Costs distributionalong financial/non-financial
spectrum
Benefitsdistribution along
financial/non-financial spectrum
Costcalculations
Benefitcalculations
Costsummary
Benefitsummary

21eHealth Planning and Management Symposium 3 November 2008,
Kopenhagen
Data summary sheet
EHRI generic data summary 2002 2003 2004 2005 2006 2007 2008 2009 2010 total₤ ₤ ₤ ₤ ₤ ₤ ₤ ₤ ₤ ₤
Estimated COSTSCitizens 0 0 0 0 0 0 0 0 0HPOsDoctors, nurses, other staff 327.228 1.580.810 3.054.706 2.508.696 2.138.701 1.377.585 665.500 257.198 248.501Organisation 0 287.420 1.278.054 1.456.266 1.647.159 1.168.186 1.573.382 1.491.935 1.124.7503rd parties 0 0 0 0 0 0 0 0 0Present value of total annual costs 327.228 1.868.231 5.001.766 4.574.757 4.846.373 2.944.246 2.480.882 2.011.114 1.624.832 25.679.427Present value of cumulative costs 327.228 2.195.458 7.197.224 11.771.981 16.618.354 19.562.600 22.043.482 24.054.596 25.679.427
Estimated BENEFITS Citizens 0 0 49.522 139.721 235.032 954.462 1.881.438 2.253.439 2.403.204HPOsDoctors, nurses, other staff 0 0 22.610 693.547 786.336 978.257 989.644 963.139 935.856Organisation 0 0 50.246 146.426 248.257 1.016.342 2.003.123 2.374.555 2.513.9623rd parties 0 0 0 0 0 0 0 0 0Present value of annual benefits 0 0 122.378 979.694 1.269.625 2.949.061 4.874.205 5.591.132 5.853.022 21.639.117Present value of cumulative benefits 0 0 122.378 1.102.072 2.371.697 5.320.758 10.194.963 15.786.095 21.639.117
Net benefitsPresent value of annual net benefits -327.228 -1.868.231 -4.879.388 -3.595.063 -3.576.747 4.814 2.393.323 3.580.018 4.228.191 -4.040.310Present value of cumulative net benefits -327.228 -2.195.458 -7.074.846 -10.669.909 -14.246.657 -14.241.842 -11.848.519 -8.268.501 -4.040.310
Net benefits over cost ratio - annual -1,00 -1,00 -0,98 -0,79 -0,74 0,00 0,96 1,78 2,60 -0,16Net benefits over cost ratio - cumulative -1,00 -1,00 -0,98 -0,91 -0,86 -0,73 -0,54 -0,34 -0,16
Number of records 4.800.000 4.900.000 5.000.000 5.100.000 5.200.000 5.450.914 5.450.914 5.450.914 5.450.914Number of times records are accessed 0 0 12.600 37.260 72.720 792.120 1.455.996 1.740.240 1.920.240
Distribution of benefitsCitizens 40,47% 14,26% 18,51% 32,36% 38,60% 40,30% 41,06% 36,59%HPOsDoctors, nurses, other staff 16,10% 63,85% 57,82% 32,05% 20,30% 17,83% 17,13% 24,81%Health provider organisation 35,78% 13,48% 18,25% 33,30% 41,10% 43,96% 46,01% 38,60%3rd parties 0,00% 0,00% 0,00% 0,00% 0,00% 0,00% 0,00% 0,00%
Base year: 2008; Discount rate:3,5%
22eHealth Planning and Management Symposium 3 November 2008,
Kopenhagen
Outlook: guiding longer-term research

••• 23K. Stroetmann: Forum Grid Meeting, 02 July 2008, Berlin
Based on the ideas of the International Physiome project
The VPH research roadmap (2007)
www.europhysiome.orgdeveloped by the EC project
STEP
VPH constitutes effort towards
multi-scale patient-specific models for• Personalised healthcare solution
• Early diagnostics & Predictive medicine
• Understanding diseases for the first time and across several biological levels
Virtual Physiological Human (VPH)The aim
Copyright © 2008-2012 VPHOP Consortium - All right reserved 24Copyright © 2008-2012 VPHOP Consortium - All right reserved 24
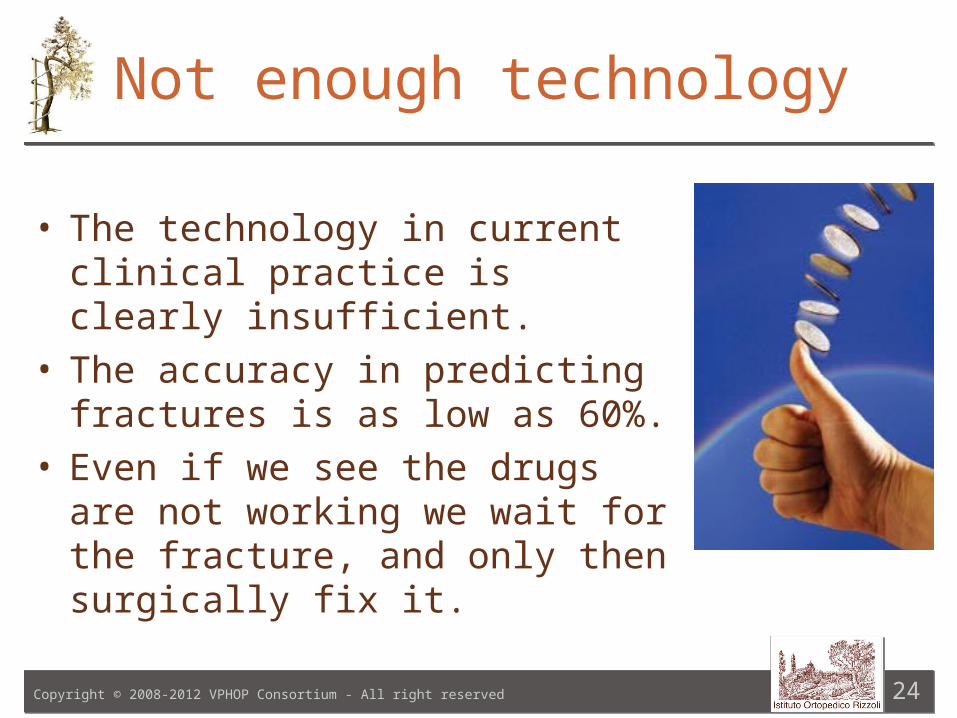
Not enough technology
• The technology in current clinical practice is clearly insufficient.
• The accuracy in predicting fractures is as low as 60%.
• Even if we see the drugs are not working we wait for the fracture, and only then surgically fix it.

25eHealth Planning and Management Symposium 3 November 2008,
Kopenhagen
Outlook: guiding longer-term research
Moving from guidance to guidelines to pathways (within & across HCPs)
Preparing detailed workflow plans Identifying clinical entry and end points Analysing impacts on all actors & stakeholders Development of an economic simulation model
(Markov Chain approach) Comparison with options for new workflows and
expected clinical outcomes from new eHealth solutions
Undertake initial small trials Clinical trials
26eHealth Planning and Management Symposium 3 November 2008,
Kopenhagen
Summary empirical evidence
27eHealth Planning and Management Symposium 3 November 2008,
Kopenhagen
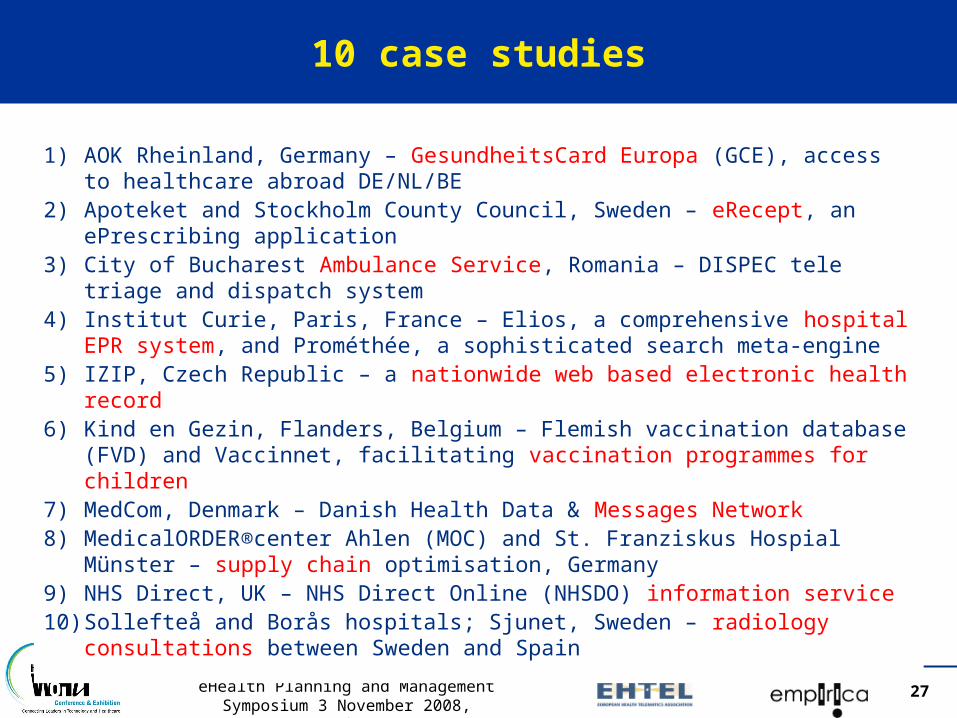
10 case studies
1) AOK Rheinland, Germany – GesundheitsCard Europa (GCE), access to healthcare abroad DE/NL/BE
2) Apoteket and Stockholm County Council, Sweden – eRecept, an ePrescribing application
3) City of Bucharest Ambulance Service, Romania – DISPEC tele triage and dispatch system
4) Institut Curie, Paris, France – Elios, a comprehensive hospital EPR system, and Prométhée, a sophisticated search meta-engine
5) IZIP, Czech Republic – a nationwide web based electronic health record
6) Kind en Gezin, Flanders, Belgium – Flemish vaccination database (FVD) and Vaccinnet, facilitating vaccination programmes for children
7) MedCom, Denmark – Danish Health Data & Messages Network8) MedicalORDER®center Ahlen (MOC) and St. Franziskus Hospial
Münster – supply chain optimisation, Germany9) NHS Direct, UK – NHS Direct Online (NHSDO) information service10) Sollefteå and Borås hospitals; Sjunet, Sweden – radiology
consultations between Sweden and Spain

28eHealth Planning and Management Symposium 3 November 2008,
Kopenhagen
eHealth needs a medium-term perspective(average values form 10 sites)
Year 4 – first year that annual benefits exceed costs, on average
Year 5 – first year that cumulative benefits exceed cumulative costs
Key health policy message: eHealth can support more, better, and safer
healthcare, within available resources
Summary results
29eHealth Planning and Management Symposium 3 November 2008,
Kopenhagen
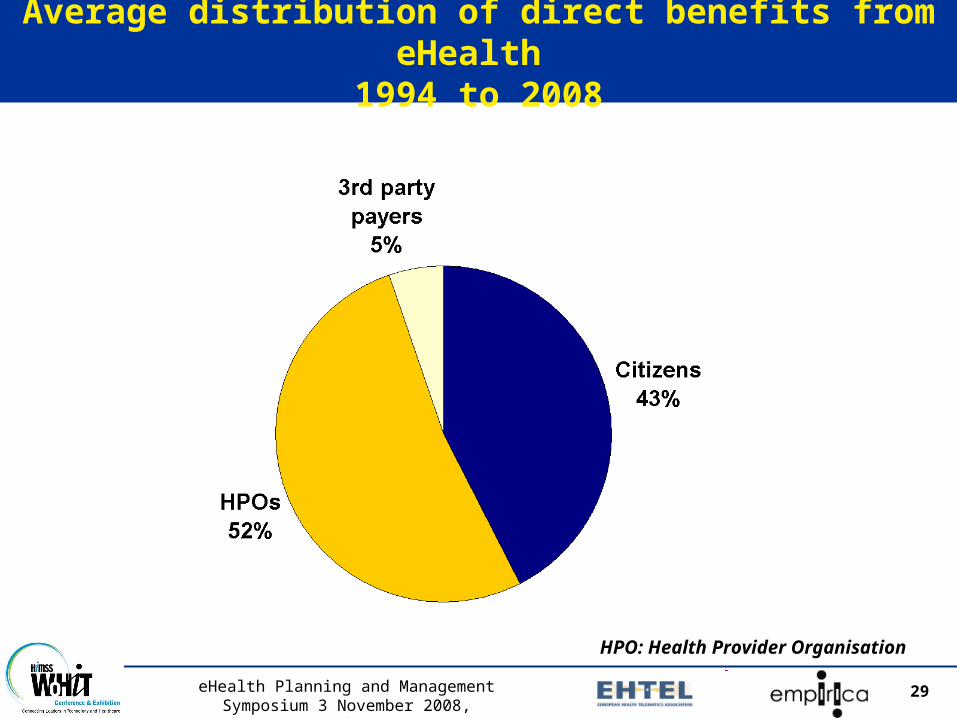
Average distribution of direct benefits from eHealth
1994 to 2008
HPO: Health Provider Organisation
30eHealth Planning and Management Symposium 3 November 2008,
Kopenhagen
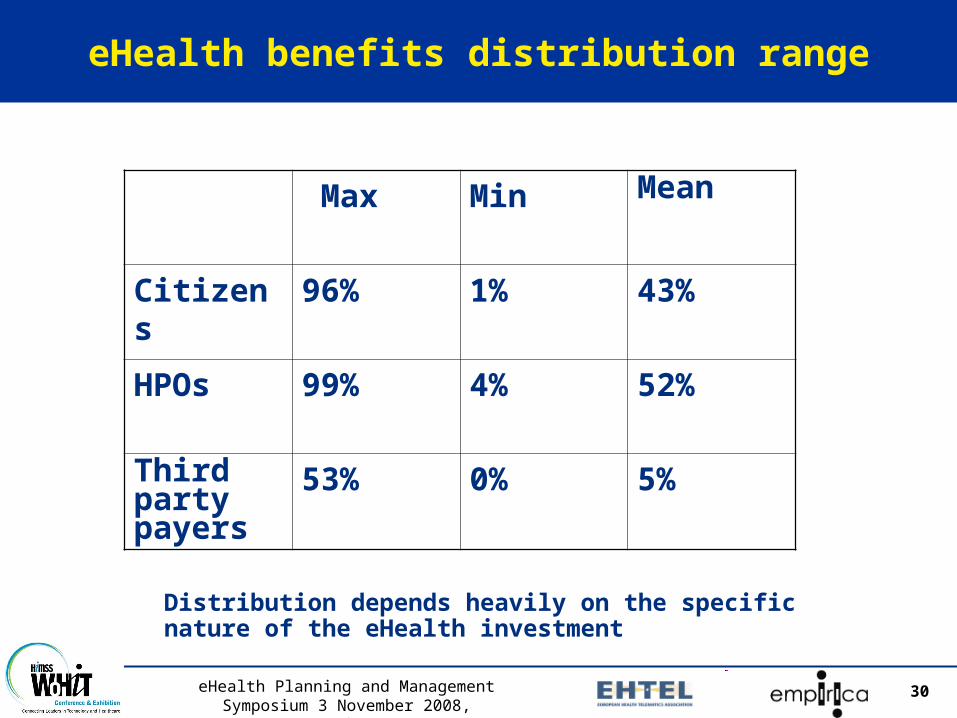
eHealth benefits distribution range
Max Min Mean
Citizens 96% 1% 43%
HPOs 99% 4% 52%
Third partypayers
53% 0% 5%
Distribution depends heavily on the specific nature of the eHealth investment
31eHealth Planning and Management Symposium 3 November 2008,
Kopenhagen
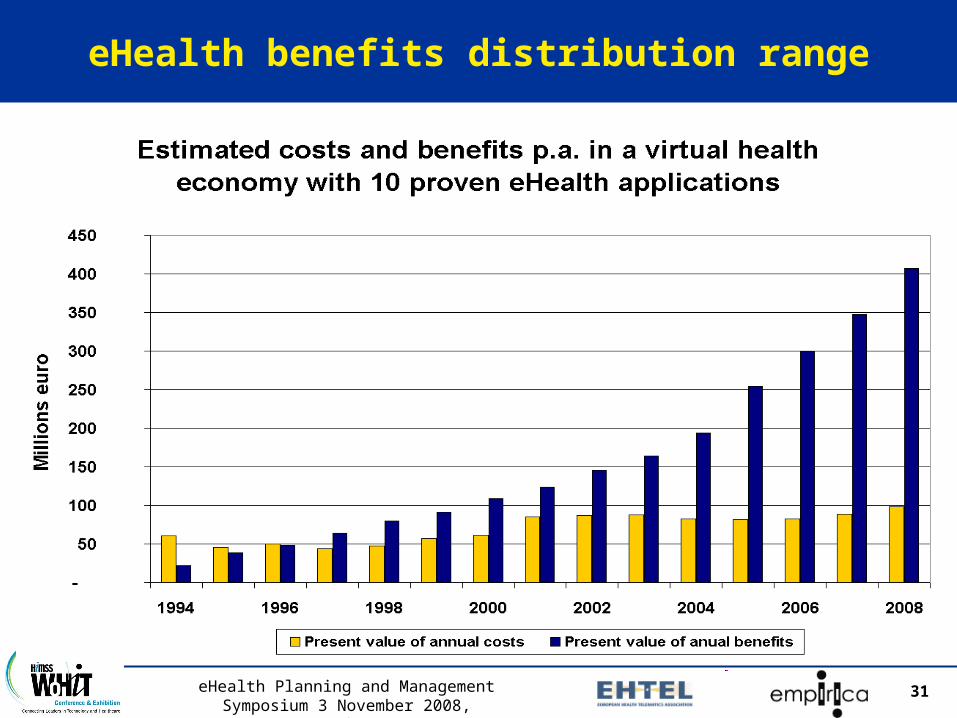
eHealth benefits distribution range
32eHealth Planning and Management Symposium 3 November 2008,
Kopenhagen
The Computerised Patient Record (CPR) at the University Hospitals of Geneva (HUG)
With support from
Prof. Dr. Christian Lovis
Head, Unit of Clinical Informatics,
University Hospitals of Geneva

33eHealth Planning and Management Symposium 3 November 2008,
Kopenhagen
33
About the University Hospitals of Geneva (HUG)
Consortium of public and teaching state hospitals
9 major facilities at four campuses
> 30 ambulatory facilities
Community, primary, secondary and tertiary care
> 48’000 inpatients and > 800’000 outpatients yearly
> 2’000 beds
> 5’000 care professionals,
Annual budget of nearly 1.4bn CHF
34eHealth Planning and Management Symposium 3 November 2008,
Kopenhagen
34
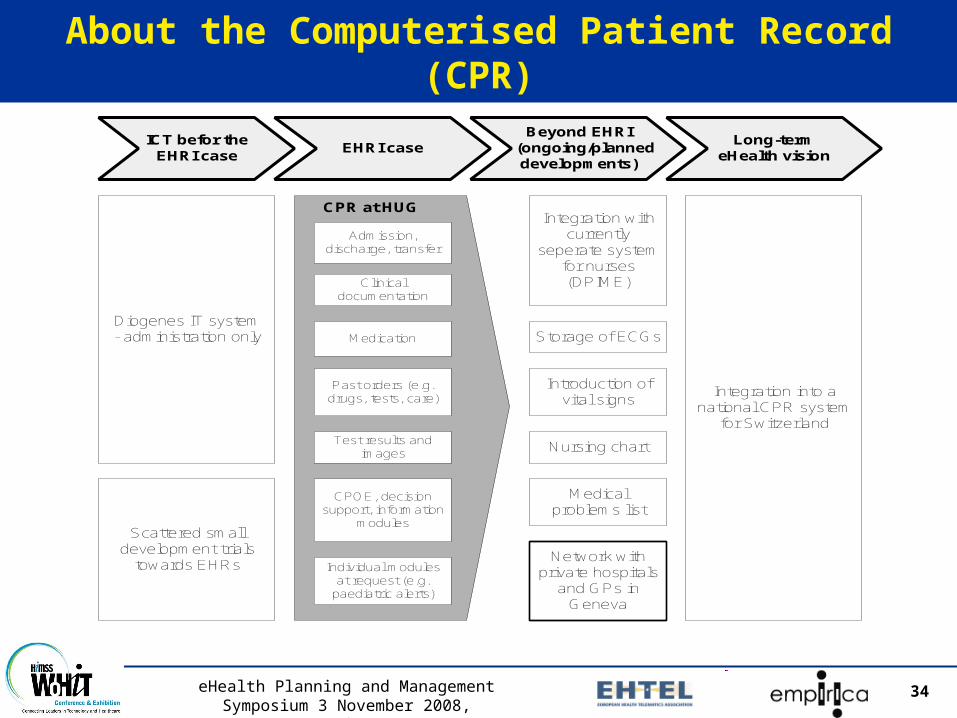
About the Computerised Patient Record (CPR)
CPR at HUG
Individual modulesat request (e.g.
paediatric alerts)
Diogenes IT system- administration only
Scattered smalldevelopment trials
towards EHRs
Integration withcurrently
seperate systemfor nurses(DPIME)
Storage of ECGs
Introduction ofvital signs
Nursing chart
Medicalproblems list
Network withprivate hospitals
and GPs inGeneva
Integration into anational CPR system
for Switzerland
Admission,discharge, transfer
Clinicaldocumentation
Medication
ICT befor theEHRI case
EHRI caseBeyond EHRI
(ongoing/planneddevelopments)
Long-termeHealth vision
Test results andimages
CPOE, decisionsupport, information
modules
Past orders (e.g.drugs, tests, care)

35eHealth Planning and Management Symposium 3 November 2008,
Kopenhagen
35
Benefits from the CPR system at HUG
Citizens– Patient safety– Time saving and avoided admissions– Better care because of better informed carers
Doctors & nurses– Do not have to waste time looking for records– Lower exposure to risk – carers feel safer, less
vulnerable– Nurses do not have to chase doctors– Doctors do not have to guess while waiting for
data– Life made easier through integrated presentation of
different reports

36eHealth Planning and Management Symposium 3 November 2008,
Kopenhagen
36
Benefits from the CPR system at HUG
Benefits to HUG– Time savings – redeployment of resources:
• Looking for records• Looking for colleagues• Ward rounds• Discharge letters
– Reduction in exposure to risk due to better clinical governance
• Critical information is always available where needed• Lower risk of errors when transferring patients across HUG
sites
– Avoided admissions – also for insurances– Reductions in number of tests– Extra income from better billing processes

37eHealth Planning and Management Symposium 3 November 2008,
Kopenhagen
37
HUG – cumulative economic performance (preliminary)
Preliminary data
0
20.000.000
40.000.000
60.000.000
80.000.000
100.000.000
120.000.000
140.000.000
1998 1999 2000 2001 2002 2003 2004 2005 2006 2007 2008 2009 2010
CHF
Present value of cumulative costs Present value of cumulative benefits

38
EU Publication 2006

39
World Summit Tunis 2005
40eHealth Planning and Management Symposium 3 November 2008,
Kopenhagen
Success factors

41eHealth Planning and Management Symposium 3 November 2008,
Kopenhagen
A vision, combined with a (highly) flexible (i.e. pragmatic, not a fixed) longer-term strategy
Effective clinical leadership
A step-by-step process approach that enables risk to be managed (solution tweaking)
Effective ventures are a series of investments with an underlying eHealth dynamic (there is never the solution)
Success factors

42eHealth Planning and Management Symposium 3 November 2008,
Kopenhagen
Success factors
Effective applications meet concrete health(care) needs (i.e. not technology-driven)
Successful applications are driven by multidisciplinary teams, with multidisciplinary people (usually guided by medical professionals)
Strong focus on change management needs and resources
Clinical research can offer firm foundations for benefits realisation (outcomes)
43eHealth Planning and Management Symposium 3 November 2008,
Kopenhagen
Conclusions and lessons learnt

44eHealth Planning and Management Symposium 3 November 2008,
Kopenhagen
Conclusions and lessons learnt I
Challenges of socio-economic evaluation of eHealth: it is not an exact science (and not a detailed sociological or organisational behaviour / change study) – multitude of interrelated impact factors
Comparability and representativeness of results– Different settings across many countries– Proven (not "average" performing) eHealth applications– No analysis of failures
The health policy value of eHI findings:They demonstrate both the socio-economic viability and the potential of eHealth (but not RoI)
45eHealth Planning and Management Symposium 3 November 2008,
Kopenhagen
45
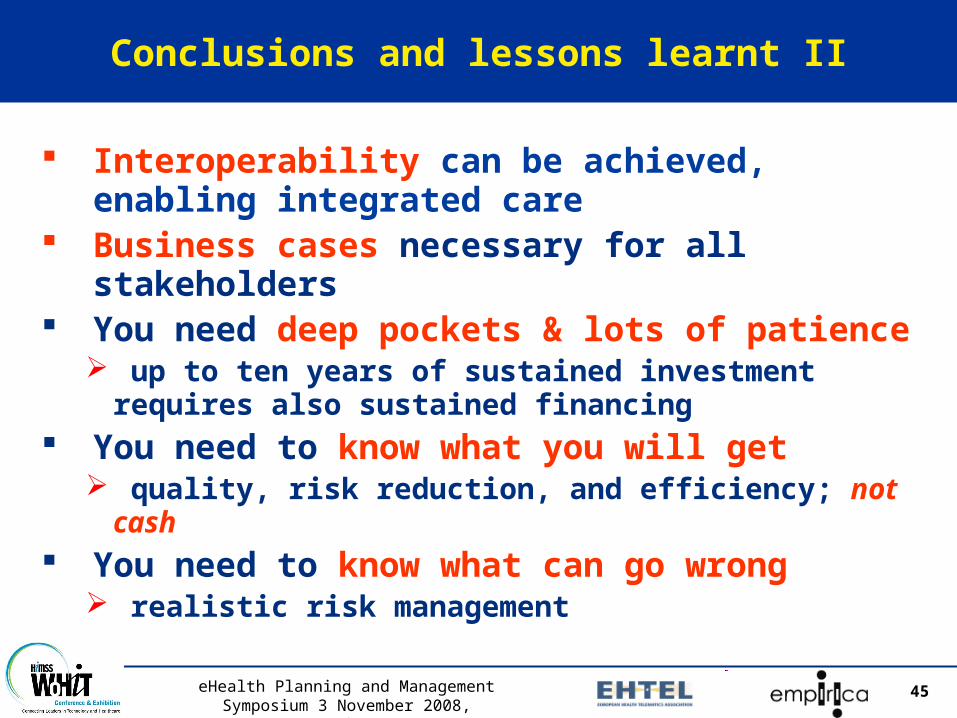
Conclusions and lessons learnt II
Interoperability can be achieved, enabling integrated care
Business cases necessary for all stakeholders
You need deep pockets & lots of patience up to ten years of sustained investment requires
also sustained financing You need to know what you will get
quality, risk reduction, and efficiency; not cash You need to know what can go wrong
realistic risk management
eHealth Planning and Management Symposium 3 November 2008,
Kopenhagen
AcknowledgementsWe thank the European Commission for their financial and non-
financial support!
This presentation is part of research supported by the European Commission, Directorate General Information Society and Media,
Brussels. It reflects solely the views of its presenters. The European Community is not liable for any use that may be made
of the information contained therein.
Further information:European Commissionhttp://europa.eu.int/information_society/activities/health/index_en.htm empiricahttp://www.empirica.biz/themen/telemedizin/projekte_en.php