
Egg Past. Manual PS (8-23) - aeb.org · To review the impact of modern egg production and egg...
61
Transcript of Egg Past. Manual PS (8-23) - aeb.org · To review the impact of modern egg production and egg...
by
Glenn W. Froning,1 Dianne Peters,1 Peter Muriana,2
Kent Eskridge,3 Daryl Travnicek3 and Susan S. Sumner4
1Department of Food Science and Technology
University of Nebraska, Lincoln, NE 68583-0919
2Oklahoma Food and Agricultural Products Research and Technology Center
Oklahoma State University, Stillwater, OK 74078-6055
3Department of Biometry
University of Nebraska, Lincoln, NE 68583-0630
4Department of Food Science and Technology
Virginia Tech University, Blacksburg, VA 24061
INTERNATIONAL EGG PASTEURIZATION MANUAL

ACKNOWLEDGEMENTS
We wish to express appreciation to the United Egg Association, American Egg Board, the US Poultry and Egg Association,Australian Egg Board and the International Egg Commission for their financial support. Various members of the UnitedEgg Association technical committee have also provided excellent scientific and technical input, which has been valuable tosuccessful completion of this project. Special thanks should be extended to Dr. Jay Schuman, formerly of Michael Foods, forhis scientific contribution to the project.
The authors wish to extend thanks to Dr. Harry Marks, statistician with the USDA, for his assistance in developing themathematical model for salted egg products. His willingness to work with Dr. Eskridge to predict the lethality of Salmonellain salted egg products was valuable. Prior to her leaving the University of Nebraska, Dr. Mindy Brashears also gave valuableinput to various aspects of the project. Our thanks to her.
Peer reviewers, as follows, provided excellent comments and suggestions for improving the new Egg Pasteurization Manual:
Dr. Charles Beard – US Poultry and Egg AssociationRoger Glasshoff – US Department of Agriculture
Mike Holbrook – US Department of Agriculture (retired)Howard Magwire – US Department of AgricultureDr. Hilary Shallo-Thesmar – Egg Nutrition Center
Bill Sutherland – US Department of Agriculture (retired)

I N T E R N A T I O N A L E G G P A S T E U R I Z A T I O N M A N U A L v
“The Office of Food Safety believes in science as basis for enhancing food safety and encourages collaborativeefforts by industry and the scientific community to achieve this. The Egg Pasteurization Guidelines developedby scientists at the University of Nebraska and Oklahoma State University, through work supported by the eggproducts industry, are a good example of how such cooperation can work to the benefit of consumers.”
— Dr. Elisa A. MuranoUnder Secretary, Food SafetyUS Department of Agriculture
“FSIS believes the data from the University of Nebraska study provide a reliable source of information for use indeveloping models for predicting the lethality of Salmonella spp. for pasteurization treatments, and thus can beconsidered in developing guidelines.”
— William J. HudnallActing AdministratorUS Department of Agriculture
“FSIS believes that this study is the most extensive of its kind on liquid egg products with respect to the numberof types of products covered, and thus, the results will be an important contribution to the scientific literature.The contribution is further enhanced because of the good repeatability of the results that were obtained fromthree independent replications performed for each product type studied. Thus, FSIS believes that these datacould and should be used in considering time-temperature guidelines for pasteurization of liquid egg products.”
— Judith W. RigginsAssociate Deputy AdministratorOffice of Policy, Program Development and EvaluationUS Department of Agriculture
“The pasteurization manual will provide the stakeholders a valuable resource in their current and future researchand marketing activities.”
— Elliot GibberChairman, United Egg Association
— Al PopePresident, United Egg Association
“This important work has updated our knowledge of effective pasteurization and will be of great value to theegg products industry worldwide as we all seek to achieve the highest standards of food safety.”
— Clive FramptonChairman, International Egg Commission
TRIBUTES(see complete letters in Appendix B)

I N T E R N A T I O N A L E G G P A S T E U R I Z A T I O N M A N U A L vii
INTRODUCTION . . . . . . . . . . . . . . . . . . . . . . . . . . . . . . . . . . . . . . . . . . . . . . . . . . . . . . . . . . . . . . . . . . . . . . . . . . . . . .1
UPDATED CHARACTERISTICS AND COMPOSITION OF LIQUID EGGS WHICH MAY AFFECT PASTEURIZATION GUIDELINES . . . . . . . . . . . . . . . . . . . . .3
EGG PASTEURIZATION METHODS . . . . . . . . . . . . . . . . . . . . . . . . . . . . . . . . . . . . . . . . . . . . . . . . . . . . . . . . . . . . . . . . . . . .9
RE-EVALUATION OF LIQUID EGG PASTEURIZATION GUIDELINES . . . . . . . . . . . . . . . . . . . . . . . . . . . . . . . . . . . . . . . . . . . . . . . . . . .13
CONCLUSIONS . . . . . . . . . . . . . . . . . . . . . . . . . . . . . . . . . . . . . . . . . . . . . . . . . . . . . . . . . . . . . . . . . . . . . . . . . . . . . .25
REFERENCES . . . . . . . . . . . . . . . . . . . . . . . . . . . . . . . . . . . . . . . . . . . . . . . . . . . . . . . . . . . . . . . . . . . . . . . . . . . . . . .27
APPENDIX A: FIGURES . . . . . . . . . . . . . . . . . . . . . . . . . . . . . . . . . . . . . . . . . . . . . . . . . . . . . . . . . . . . . . . . . . . . . . . . .31
APPENDIX B: LETTERS . . . . . . . . . . . . . . . . . . . . . . . . . . . . . . . . . . . . . . . . . . . . . . . . . . . . . . . . . . . . . . . . . . . . . . . . .57
TABLE OF CONTENTS
I N T E R N A T I O N A L E G G P A S T E U R I Z A T I O N M A N U A L 1
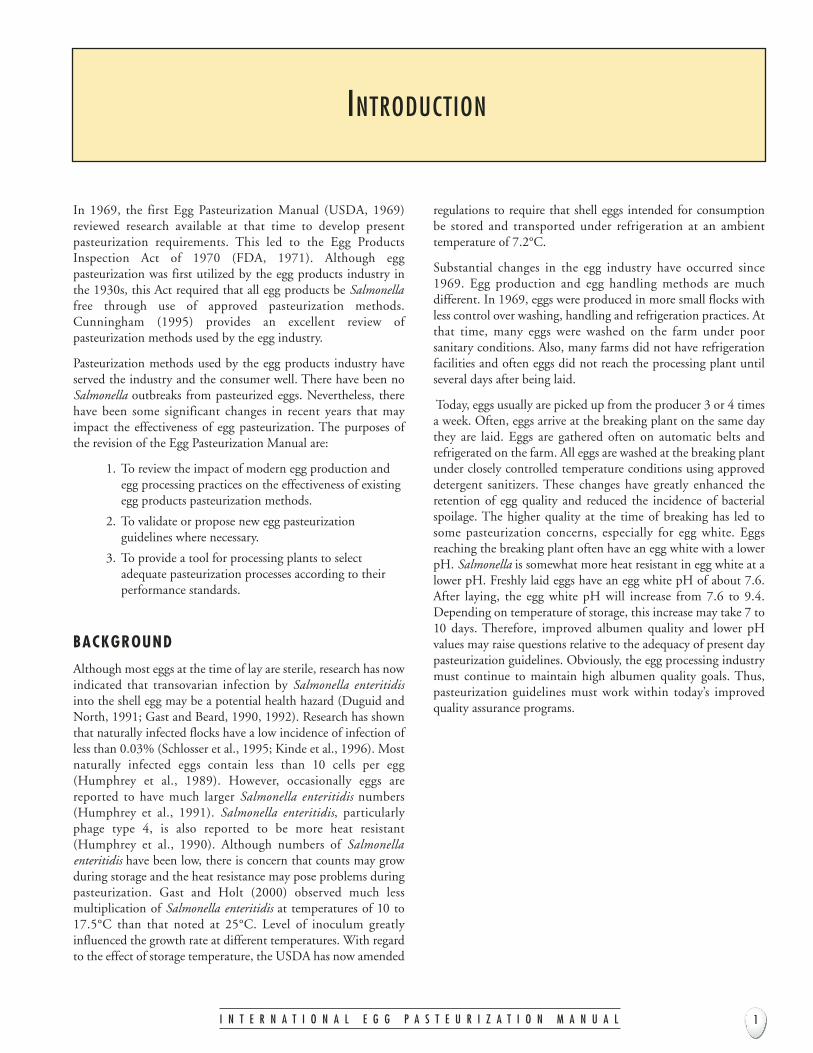
In 1969, the first Egg Pasteurization Manual (USDA, 1969)reviewed research available at that time to develop presentpasteurization requirements. This led to the Egg ProductsInspection Act of 1970 (FDA, 1971). Although eggpasteurization was first utilized by the egg products industry inthe 1930s, this Act required that all egg products be Salmonellafree through use of approved pasteurization methods.Cunningham (1995) provides an excellent review ofpasteurization methods used by the egg industry.
Pasteurization methods used by the egg products industry haveserved the industry and the consumer well. There have been noSalmonella outbreaks from pasteurized eggs. Nevertheless, therehave been some significant changes in recent years that mayimpact the effectiveness of egg pasteurization. The purposes ofthe revision of the Egg Pasteurization Manual are:
1. To review the impact of modern egg production andegg processing practices on the effectiveness of existingegg products pasteurization methods.
2. To validate or propose new egg pasteurizationguidelines where necessary.
3. To provide a tool for processing plants to selectadequate pasteurization processes according to theirperformance standards.
BACKGROUND
Although most eggs at the time of lay are sterile, research has nowindicated that transovarian infection by Salmonella enteritidisinto the shell egg may be a potential health hazard (Duguid andNorth, 1991; Gast and Beard, 1990, 1992). Research has shownthat naturally infected flocks have a low incidence of infection ofless than 0.03% (Schlosser et al., 1995; Kinde et al., 1996). Mostnaturally infected eggs contain less than 10 cells per egg(Humphrey et al., 1989). However, occasionally eggs arereported to have much larger Salmonella enteritidis numbers(Humphrey et al., 1991). Salmonella enteritidis, particularlyphage type 4, is also reported to be more heat resistant(Humphrey et al., 1990). Although numbers of Salmonellaenteritidis have been low, there is concern that counts may growduring storage and the heat resistance may pose problems duringpasteurization. Gast and Holt (2000) observed much lessmultiplication of Salmonella enteritidis at temperatures of 10 to17.5°C than that noted at 25°C. Level of inoculum greatlyinfluenced the growth rate at different temperatures. With regardto the effect of storage temperature, the USDA has now amended
regulations to require that shell eggs intended for consumptionbe stored and transported under refrigeration at an ambienttemperature of 7.2°C.
Substantial changes in the egg industry have occurred since1969. Egg production and egg handling methods are muchdifferent. In 1969, eggs were produced in more small flocks withless control over washing, handling and refrigeration practices. Atthat time, many eggs were washed on the farm under poorsanitary conditions. Also, many farms did not have refrigerationfacilities and often eggs did not reach the processing plant untilseveral days after being laid.
Today, eggs usually are picked up from the producer 3 or 4 timesa week. Often, eggs arrive at the breaking plant on the same daythey are laid. Eggs are gathered often on automatic belts andrefrigerated on the farm. All eggs are washed at the breaking plantunder closely controlled temperature conditions using approveddetergent sanitizers. These changes have greatly enhanced theretention of egg quality and reduced the incidence of bacterialspoilage. The higher quality at the time of breaking has led tosome pasteurization concerns, especially for egg white. Eggsreaching the breaking plant often have an egg white with a lowerpH. Salmonella is somewhat more heat resistant in egg white at alower pH. Freshly laid eggs have an egg white pH of about 7.6.After laying, the egg white pH will increase from 7.6 to 9.4.Depending on temperature of storage, this increase may take 7 to10 days. Therefore, improved albumen quality and lower pHvalues may raise questions relative to the adequacy of present daypasteurization guidelines. Obviously, the egg processing industrymust continue to maintain high albumen quality goals. Thus,pasteurization guidelines must work within today’s improvedquality assurance programs.
INTRODUCTION
I N T E R N A T I O N A L E G G P A S T E U R I Z A T I O N M A N U A L 3
UPDATED CHARACTERISTICS AND COMPOSITION OF LIQUID EGGS
WHICH MAY AFFECT PASTEURIZATION GUIDELINES
NUTRITIVE COMPOSIT ION
Several production factors have been shown to affect the egg’scomposition. Breed, strain, age, diet of bird, environmentaltemperatures, storage conditions and processing have beenobserved to affect the composition of liquid egg products(Stadelman and Pratt, 1989).
Strain, breed and age of the bird affect the egg size andconsequently the relative amounts of yolk and white. Theproportion of yolk and white will have a large effect on the totalsolids of liquid egg. When hens first come into production, theywill produce small eggs with a higher proportion of yolk. As theage of the hen and egg size increases, the relative amount of yolkdecreases, thereby decreasing the solids content (Forsythe, 1963).Cotterill and Geiger (1977) monitored solids content of wholeeggs from 1966 through 1976 and observed a decrease in solidsfrom 24.7% to 24.2%. These differences probably were relatedlargely to strain and changes in handling methods. Perhaps, suchproduction changes as forced molting couldalso have been a factor in these trends.Cunningham et al. (1960) found that seasonhad a highly significant effect on sodium,calcium and chlorine content while havinglittle influence on potassium, phosphorousand protein content of eggs. The age of thehen also significantly influencedphosphorous, chlorine and protein contentof the eggs.
Diet of the hen greatly affects certainnutrients in the egg (Stadelman and Pratt,1989). Fatty acid composition, fat solublevitamins, certain water soluble vitamins andsome minerals (iodine, fluorine andmanganese) are affected by the diet of thehen. Watkins (1991) reported that dietarylinoleic acid may affect yolk size and weight.
“Specialty” eggs in which the omega 3 highlyunsaturated fatty acids are increased throughthe diet of the hen have become increasinglypopular. These eggs are generally modified byfeeding flaxseed or flaxseed oil to increaseomega 3 fatty acids (Cherian and Sim,1991). Flaxseed is high in α-linolenic acidwhich can be converted in humans to longerchain polyunsaturated fatty acids such aseicosapentaenoic (EPA) and docosahexaenoicacids (DHA). Feeding of flaxseed does not
affect layer performance or egg quality. Also, off-flavors areminimized when feeding flaxseed. Feeding of fish meal alsoeffectively increases omega 3 fatty acids in the eggs but fishy off-flavors are a problem (Hargis et al., 1991).
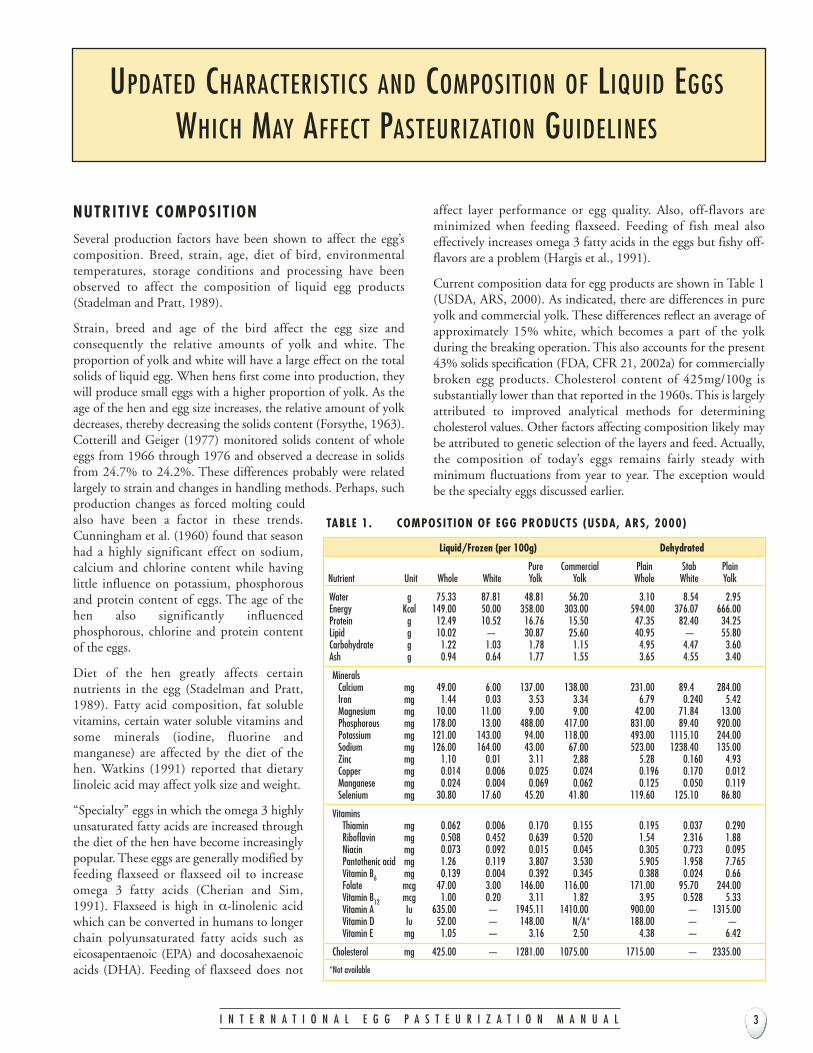
Current composition data for egg products are shown in Table 1(USDA, ARS, 2000). As indicated, there are differences in pureyolk and commercial yolk. These differences reflect an average ofapproximately 15% white, which becomes a part of the yolkduring the breaking operation. This also accounts for the present43% solids specification (FDA, CFR 21, 2002a) for commerciallybroken egg products. Cholesterol content of 425mg/100g issubstantially lower than that reported in the 1960s. This is largelyattributed to improved analytical methods for determiningcholesterol values. Other factors affecting composition likely maybe attributed to genetic selection of the layers and feed. Actually,the composition of today’s eggs remains fairly steady withminimum fluctuations from year to year. The exception wouldbe the specialty eggs discussed earlier.
Liquid/Frozen (per 100g) Dehydrated
Pure Commercial Plain Stab PlainNutrient Unit Whole White Yolk Yolk Whole White Yolk
Water g 75.33 87.81 48.81 56.20 3.10 8.54 2.95Energy Kcal 149.00 50.00 358.00 303.00 594.00 376.07 666.00Protein g 12.49 10.52 16.76 15.50 47.35 82.40 34.25Lipid g 10.02 — 30.87 25.60 40.95 — 55.80Carbohydrate g 1.22 1.03 1.78 1.15 4.95 4.47 3.60Ash g 0.94 0.64 1.77 1.55 3.65 4.55 3.40
MineralsCalcium mg 49.00 6.00 137.00 138.00 231.00 89.4 284.00Iron mg 1.44 0.03 3.53 3.34 6.79 0.240 5.42Magnesium mg 10.00 11.00 9.00 9.00 42.00 71.84 13.00Phosphorous mg 178.00 13.00 488.00 417.00 831.00 89.40 920.00Potassium mg 121.00 143.00 94.00 118.00 493.00 1115.10 244.00Sodium mg 126.00 164.00 43.00 67.00 523.00 1238.40 135.00Zinc mg 1.10 0.01 3.11 2.88 5.28 0.160 4.93Copper mg 0.014 0.006 0.025 0.024 0.196 0.170 0.012Manganese mg 0.024 0.004 0.069 0.062 0.125 0.050 0.119Selenium mg 30.80 17.60 45.20 41.80 119.60 125.10 86.80
VitaminsThiamin mg 0.062 0.006 0.170 0.155 0.195 0.037 0.290Riboflavin mg 0.508 0.452 0.639 0.520 1.54 2.316 1.88Niacin mg 0.073 0.092 0.015 0.045 0.305 0.723 0.095Pantothenic acid mg 1.26 0.119 3.807 3.530 5.905 1.958 7.765Vitamin B6 mg 0.139 0.004 0.392 0.345 0.388 0.024 0.66Folate mcg 47.00 3.00 146.00 116.00 171.00 95.70 244.00Vitamin B12 mcg 1.00 0.20 3.11 1.82 3.95 0.528 5.33Vitamin A Iu 635.00 — 1945.11 1410.00 900.00 — 1315.00Vitamin D Iu 52.00 — 148.00 N/A* 188.00 — —Vitamin E mg 1.05 — 3.16 2.50 4.38 — 6.42
Cholesterol mg 425.00 — 1281.00 1075.00 1715.00 — 2335.00
*Not available
TABLE 1. COMPOSIT ION OF EGG PRODUCTS (USDA, ARS, 2000)
I N T E R N A T I O N A L E G G P A S T E U R I Z A T I O N M A N U A L4
CHEMICAL AND PHYSICAL PROPERTIES
The egg has several heat-sensitive proteins that become animportant factor when establishing pasteurization guidelines. Thisis particularly true in egg white. Egg white proteins and theirdenaturation temperature are presented in Table 2. As indicated,ovotransferrin is one of the most heat-sensitive egg white proteins.Its heat stability has been observed to be improved by addingmultivalent metal ions, such as aluminum and adjusting the pH to7.5 (Cunningham and Lineweaver, 1965). At pH 9.0, egg whiteincreases in viscosity when heated from 56.7°C to 57.2°C andcoagulates at 60°C (Cunningham, 1995). Whole egg increases inviscosity at temperatures from 56°C to 66°C and coagulates at73°C. Egg yolk shows an increase in viscosity beginning at 65°C anda progressive increase in rigidity to 85°C (Nakamura et al., 1982).
Other scientists have investigated the effect of heat on egg proteins.Woodward and Cotterill (1983) utilized polyacrylamideelectrophoresis to evaluate stability of proteins in heated eggmixtures containing yolk and albumen. Livetins, lysozyme,ovomacroglobulin and ovoglobulin G3 were observed to be theleast heat stable while ovotransferrin, ovoinhibitor and ovoglobulinG2 were found to be the most heat stable. Both salt and sugarincreased the heat stability of heat-sensitive proteins. Dixon andCotterill (1981) further noted that 10% salted yolk could bepasteurized at 63.3°C to 68.0°C without substantial damage toprotein fractions.
Cunningham (1995) further indicated that several carbohydratesincluding sucrose, glucose, fructose, arabinose, mannitol andxylose will protect proteins from denaturation duringpasteurization. He further noted that sugars have a markedstabilizing effect on egg white proteins during pasteurization.
These studies show that heat does affect the properties of eggproteins. Some scientists investigated the effect of heat on isolatedproteins while others reported denaturation values of proteins in the
intact egg system. These differences likely account for some of thevarying denaturation rates of egg proteins reported by variousresearch scientists.
Physical properties of egg products become important inascertaining optimum conditions for egg pasteurization. Densityof whole egg, white and yolk is 1.035 at room temperature(Romanoff and Romanoff, 1949). Density of 10% salted yolk andwhole egg has been reported to be 1.10 while 10% sugared yolksand whole eggs were reported as 1.07 (USDA, 1969). Blended eggproducts with 32 to 35% solids were indicated to have a density1.05. Density has been shown to slightly decrease about 1.5%when blended egg products were heated from 21°C to 60°C.Mixing, pumping, dissolved gas evolution and gas generated bychemical reactions may create gas bubbles which may reducedensity 10% or more.
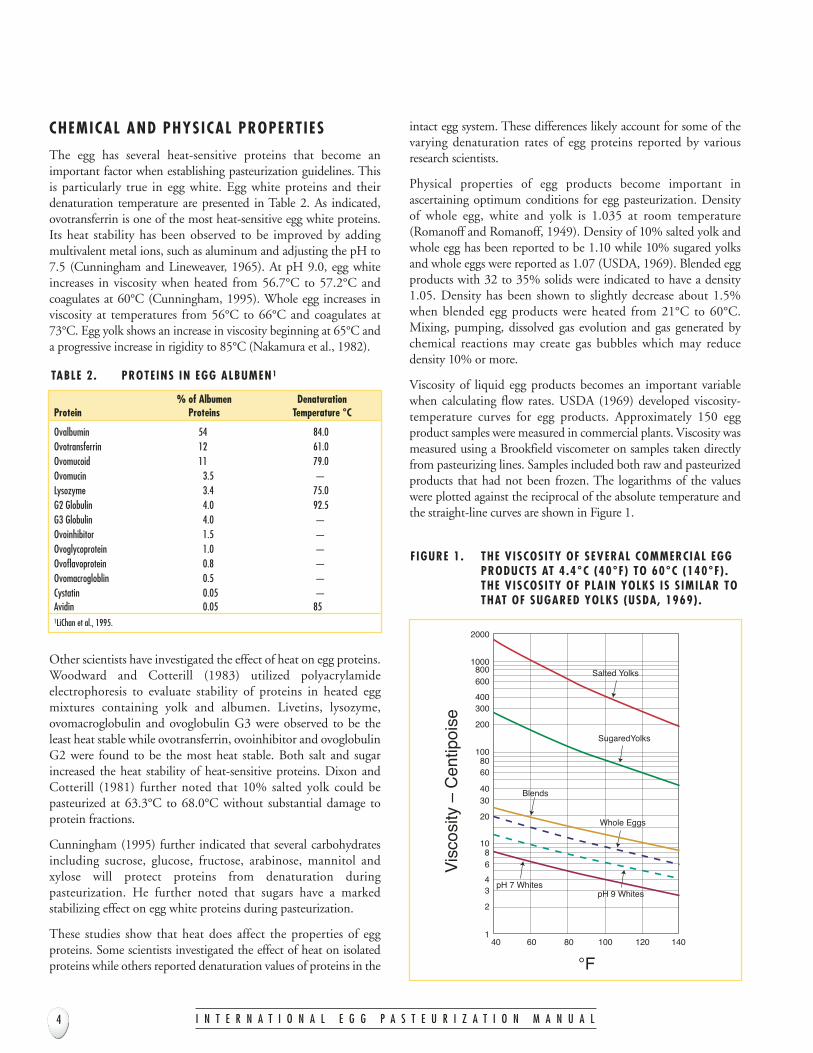
Viscosity of liquid egg products becomes an important variablewhen calculating flow rates. USDA (1969) developed viscosity-temperature curves for egg products. Approximately 150 eggproduct samples were measured in commercial plants. Viscosity wasmeasured using a Brookfield viscometer on samples taken directlyfrom pasteurizing lines. Samples included both raw and pasteurizedproducts that had not been frozen. The logarithms of the valueswere plotted against the reciprocal of the absolute temperature andthe straight-line curves are shown in Figure 1.
% of Albumen DenaturationProtein Proteins Temperature °C
Ovalbumin 54 84.0Ovotransferrin 12 61.0Ovomucoid 11 79.0Ovomucin 3.5 —Lysozyme 3.4 75.0G2 Globulin 4.0 92.5G3 Globulin 4.0 —Ovoinhibitor 1.5 —Ovoglycoprotein 1.0 —Ovoflavoprotein 0.8 —Ovomacrogloblin 0.5 —Cystatin 0.05 —Avidin 0.05 851LiChan et al., 1995.
TABLE 2. PROTEINS IN EGG ALBUMEN1
Vis
cosi
ty –
Cen
tipoi
se
°F
140 60 80 100 120 140
2
34
68
10
20
3040
6080
100
200
300400
600800
1000
2000
Salted Yolks
SugaredYolks
Blends
Whole Eggs
pH 9 WhitespH 7 Whites
F IGURE 1. THE VISCOSITY OF SEVERAL COMMERCIAL EGGPRODUCTS AT 4.4°C (40°F) TO 60°C (140°F) .THE VISCOSITY OF PLAIN YOLKS IS S IMILAR TOTHAT OF SUGARED YOLKS (USDA, 1969) .
I N T E R N A T I O N A L E G G P A S T E U R I Z A T I O N M A N U A L 5
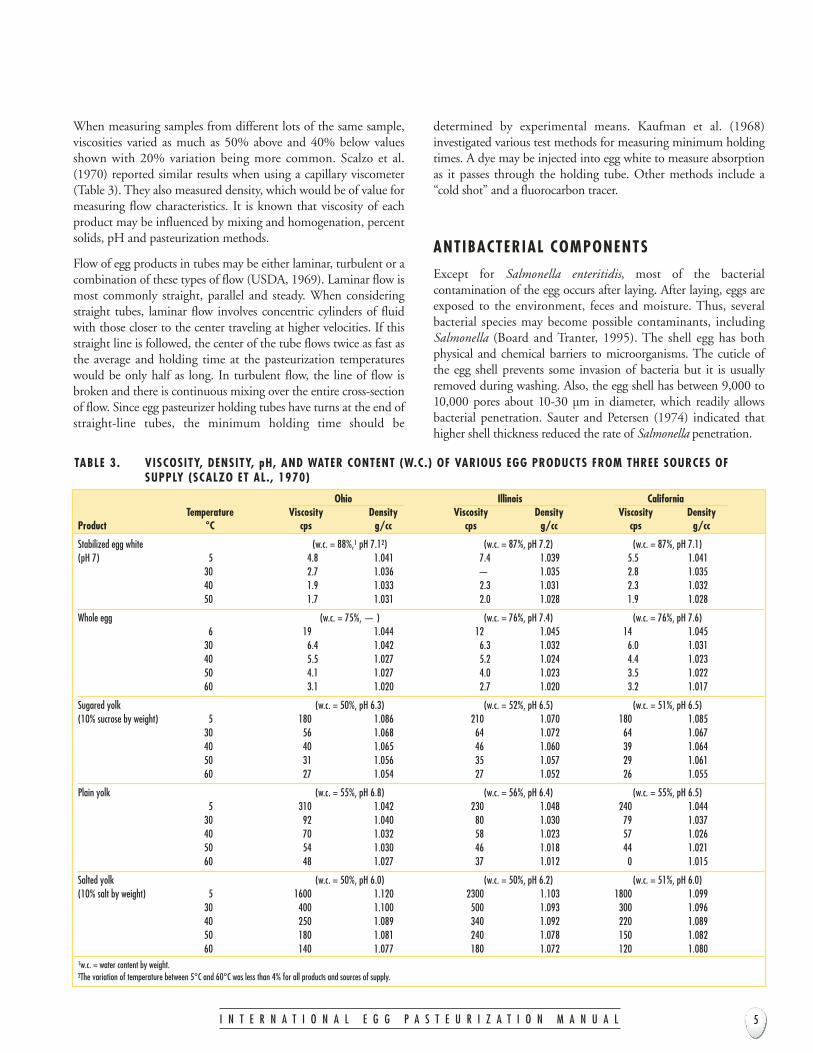
When measuring samples from different lots of the same sample,viscosities varied as much as 50% above and 40% below valuesshown with 20% variation being more common. Scalzo et al.(1970) reported similar results when using a capillary viscometer(Table 3). They also measured density, which would be of value formeasuring flow characteristics. It is known that viscosity of eachproduct may be influenced by mixing and homogenation, percentsolids, pH and pasteurization methods.
Flow of egg products in tubes may be either laminar, turbulent or acombination of these types of flow (USDA, 1969). Laminar flow ismost commonly straight, parallel and steady. When consideringstraight tubes, laminar flow involves concentric cylinders of fluidwith those closer to the center traveling at higher velocities. If thisstraight line is followed, the center of the tube flows twice as fast asthe average and holding time at the pasteurization temperatureswould be only half as long. In turbulent flow, the line of flow isbroken and there is continuous mixing over the entire cross-sectionof flow. Since egg pasteurizer holding tubes have turns at the end ofstraight-line tubes, the minimum holding time should be
determined by experimental means. Kaufman et al. (1968)investigated various test methods for measuring minimum holdingtimes. A dye may be injected into egg white to measure absorptionas it passes through the holding tube. Other methods include a“cold shot” and a fluorocarbon tracer.
ANTIBACTERIAL COMPONENTS
Except for Salmonella enteritidis, most of the bacterialcontamination of the egg occurs after laying. After laying, eggs areexposed to the environment, feces and moisture. Thus, severalbacterial species may become possible contaminants, includingSalmonella (Board and Tranter, 1995). The shell egg has bothphysical and chemical barriers to microorganisms. The cuticle ofthe egg shell prevents some invasion of bacteria but it is usuallyremoved during washing. Also, the egg shell has between 9,000 to10,000 pores about 10-30 µm in diameter, which readily allowsbacterial penetration. Sauter and Petersen (1974) indicated thathigher shell thickness reduced the rate of Salmonella penetration.
Ohio Illinois CaliforniaTemperature Viscosity Density Viscosity Density Viscosity Density
Product °C cps g/cc cps g/cc cps g/cc
Stabilized egg white (w.c. = 88%,1 pH 7.12) (w.c. = 87%, pH 7.2) (w.c. = 87%, pH 7.1)(pH 7) 5 4.8 1.041 7.4 1.039 5.5 1.041
30 2.7 1.036 — 1.035 2.8 1.035 40 1.9 1.033 2.3 1.031 2.3 1.03250 1.7 1.031 2.0 1.028 1.9 1.028
Whole egg (w.c. = 75%, — ) (w.c. = 76%, pH 7.4) (w.c. = 76%, pH 7.6)6 19 1.044 12 1.045 14 1.045
30 6.4 1.042 6.3 1.032 6.0 1.03140 5.5 1.027 5.2 1.024 4.4 1.02350 4.1 1.027 4.0 1.023 3.5 1.02260 3.1 1.020 2.7 1.020 3.2 1.017
Sugared yolk (w.c. = 50%, pH 6.3) (w.c. = 52%, pH 6.5) (w.c. = 51%, pH 6.5)(10% sucrose by weight) 5 180 1.086 210 1.070 180 1.085
30 56 1.068 64 1.072 64 1.06740 40 1.065 46 1.060 39 1.06450 31 1.056 35 1.057 29 1.06160 27 1.054 27 1.052 26 1.055
Plain yolk (w.c. = 55%, pH 6.8) (w.c. = 56%, pH 6.4) (w.c. = 55%, pH 6.5)5 310 1.042 230 1.048 240 1.044
30 92 1.040 80 1.030 79 1.03740 70 1.032 58 1.023 57 1.02650 54 1.030 46 1.018 44 1.02160 48 1.027 37 1.012 0 1.015
Salted yolk (w.c. = 50%, pH 6.0) (w.c. = 50%, pH 6.2) (w.c. = 51%, pH 6.0)(10% salt by weight) 5 1600 1.120 2300 1.103 1800 1.099
30 400 1.100 500 1.093 300 1.09640 250 1.089 340 1.092 220 1.08950 180 1.081 240 1.078 150 1.08260 140 1.077 180 1.072 120 1.080
1w.c. = water content by weight.2The variation of temperature between 5°C and 60°C was less than 4% for all products and sources of supply.
TABLE 3. VISCOSITY, DENSITY, pH, AND WATER CONTENT (W.C.) OF VARIOUS EGG PRODUCTS FROM THREE SOURCES OFSUPPLY (SCALZO ET AL. , 1970)

I N T E R N A T I O N A L E G G P A S T E U R I Z A T I O N M A N U A L6
The two shell membranes are the most important single physicalbarriers to penetration of microorganisms into the egg. Hainesand Moran (1940) indicated that the shell membranes act asbacterial filters. Several investigators have observed that the innershell membrane is more effective in preventing bacterialpenetration than the outer shell membrane (Garibaldi andStokes, 1958; Florian and Trussell, 1957; Liftshitz et al., 1964,1965). It is possible that albumen proteins, such as lysozyme,may contribute to the shell membranes resistance of microbes(Brooks and Taylor, 1955). Some have reported that enzymaticbreakdown of membranes may enhance bacterial penetration,but Wedral et al. (1971) indicated that enzymes did not changepermeability of Salmonella.
The albumen has both mechanical and chemical defensesagainst microbial growth (Board and Tranter, 1995). Viscosityof the thick albumen, which results from the ovomucin fibers,impedes movement of bacteria from the albumen to the yolk.Also, the thick albuminous sac centers the yolk, providing agreater distance for bacteria to move after they migrate throughthe shell membrane.
With reference to chemical defenses, the albumen has severalproteins which have antimicrobial properties (Table 4).Lysozyme lyses the bacterial cell wall of gram-positive bacteria.Wang and Shelef (1991) observed that lysozyme was aneffective inhibitor of Listeria monocytogenes. They furtherindicated that this antilisterial activity of lysozyme wasenhanced by ovomucoid, conalbumin and alkaline pH. Gastand Holt (2000) inoculated egg white with Salmonellaenteritidis and noted little growth at any temperature (10°C,17.5°C or 25°C) for 3 days. Although lysozyme is largelyineffective against gram negative bacteria, such as Salmonella, acombination of other proteins, such as ovotransferrin(conalbumin), which chelates metal cations, may delay growth.Also, an alkaline pH (9.3 to 9.5) will enhance the chelationpotential of ovotransferrin (Board and Tranter, 1995).
Several other egg white proteins may inhibit bacterial growthby enzyme or vitamin inhibition (Table 4). The effect of theseproteins depends on the nutrient requirements of the bacteriain question.
Although the shell, shell membranes and albumen offer barriersto microbial growth, the yolk is a good nutrient medium forgrowth of Salmonella enteritidis (Bradshaw et al., 1990;Humphrey, 1990). Gast and Holt (2000) observed thatSalmonella enteritidis grew rapidly in egg yolk at temperatures of17.5°C and 25°C but growth was much slower at 10°C. Thisgives further support for the new USDA requirement that shelleggs be stored and transported at an ambient temperature of nomore than 7°C (USDA, 1998).
MAINTAINING QUALITY OF SHELL EGGS FOR L IQUID EGG PROCESSING
In order to minimize bacterial contamination and maintain highegg quality, it is important to have a quality assurance programstarting at the production unit. Today, many commercial eggproduction units have inline collection systems which move theeggs to a central area where eggs are placed on filler flats andpalletized for cooling at the farm. Three or four times a week, eggsare delivered to the breaking plant. The eggs are washed and flashcandled at the breaking plant. In other cases, more processing stepsmay be accomplished at the production unit, including gathering,washing, candling, sizing, packaging and cooling. Someproduction units are dedicated totally to egg products.
Several factors affect the quality of the newly laid egg. After laying,the eggs should be moved from the production unit several timesduring the day to the cooler. It is well known that rapid cooling ofthe egg controls growth of Salmonella enteritidis and reduces eggquality deterioration. As indicated earlier, keeping shell eggs at anambient temperature of 7°C in market channels is required forshell eggs destined for the ultimate consumer (FDA, CFR, 21,2002; USDA, 1998). Recently, new rapid methods of cooling eggsare receiving emphasis. Curtis et al. (1995) have developed apatented procedure for cooling shell eggs with cryogenic gases(N2 gas, CO2 gas). Their cooling method improved shell qualityand reduced aerobic plate counts. Refrigeration retards egg whitethinning and yolk membrane strength deterioration. A strong yolkmembrane is important in the egg breaking operation, especiallywhen separating egg white on today’s new high-speed breakingmachines. If excessive yolk breakage occurs, yolk contamination ofthe whites becomes a problem.
Protein Mode of Action Significance
TABLE 4. ANTIMICROBIAL PROTEINS IN EGG ALBUMEN
Lysozyme
Ovotransferrin
Avidin
Ovomucoid
Ovoinhibitor
Ovomacroglobulin
Cystatin
Flavoprotein
Hydrolysis of β (1-4) glycosidicbonds in bacterial cell wall
Chelates metal cations (Fe, Cu, Mn,Zn) making them unavailable tomicroorganisms
Binds biotin making it unavailableto bacteria
Inhibits trypsin
Inhibits trypsin, chymotrypsin,subtilisin, elastin
Inhibits trypsin, papain
Inhibits papain, bromelain, ficin
Binds riboflavin making itunavailable to bacteria
Effective against gram positiveorganisms but not Salmonella
Particularly effective againstspoilage bacteria
Depends on bacterial requirementfor this vitamin
Role unknown
Role unknown
Role unknown
Role unknown
Depends on bacterial requirement

I N T E R N A T I O N A L E G G P A S T E U R I Z A T I O N M A N U A L 7
A good indicator of egg quality is pH. As the egg ages, it loses CO2through the shell and the pH of egg albumen increases from 7.6 to9.3. Ovomucin provides the egg white structure. Thinning appearsto be related to changes in the ovomucin-lysozyme complex(Li-Chan et al., 1995). When the pH reaches greater than 8.8, eggwhite thinning and decreased yolk membrane strength becomegreatly accelerated. Higher storage temperatures contribute to therate of pH increase (Table 5). Eggs stored at 7.2 °C to 12.7°C willreach a pH of 9.0 in about 7 days. If eggs are oiled to seal the pores,the rate of pH elevation will be greatly decreased and albumenthinning will also be delayed (Froning and Swanson, 1962;Schwall et al., 1961).
Prior to breaking, all eggs are washed in the United States. Eggwash water must be at least 11°C higher than the egg temperature,and the water temperature should be at least 35°C for adequatecleaning (Wesley and Beane, 1967). Today’s egg washers are muchmore efficient than the immersion washers formerly used(Stadelman, 1995). Eggs are sprayed with water rather thanimmersing them. Egg washers have separate sections for detergentand sanitizer (most processors use chlorine compounds as asanitizer). Washers rotate eggs during washing and use low pressuresprays and oscillating brushes. The rinse water is warmer than thewash water. After washing, eggs are flash candled prior to breakingto remove any eggs with defects (e.g. dirts, blood spots or otherloss-type eggs, such as cracks, rots, etc.).
EFFECT OF PASTEURIZATION ON FUNCTIONALPROPERTIES
Eggs are multi-functional and are used widely as an ingredientin many food applications (Yang and Baldwin, 1995).Functional attributes provided by eggs include the properties ofcoagulation and binding, flavor, color, foaming, emulsifyingand prevention of crystallization in confectionary products.
Coagulation and binding are important in such foods as surimi,cooked meat products and custards. Major proteins contributingto coagulative attributes include conalbumin, globulins,ovalbumin and lysozyme.
The superior foaming properties of eggs are difficult to duplicatewith other ingredients. Eggs produce foams with excellent volumeand stability that coagulate with heat for such foods as angel foodcakes, sponge cakes, meringues, souffles and omelets. Several eggproteins contribute to the foaming properties. Globulins increasethe viscosity and lower surface tension. Ovalbumin andconalbumin provide heat-setting properties. Ovomucin forms aninsoluble film which stabilizes the foam.
Eggs provide emulsification properties to mayonnaise, saladdressings and cream puffs. A combination of components,including lipoproteins, phospholipids and cholesterol, allcontribute to the optimum emulsifying ability of eggs. Egg yolkproteins such as lipovitellin, livetin and lipovitellenin function assurface active agents to stabilize film around the oil globule to forman emulsion.
Cotterill et al. (1963) observed that egg white inhibited the growthof sugar crystals in candy. They further found that egg whiteprevented syneresis, excessive evaporation and fluidity due to theinversion of sucrose.
Pasteurization can adversely affect the functional properties of eggproducts depending on the time and temperature used. Egg whiteproteins are particularly susceptible to heat damage. It has beenshown that pasteurization temperatures between 54°C to 60°Cwill damage the foaming properties of egg white (Cunningham,1995). Heating above 57°C will damage egg white and increasewhipping time, but heating yolk-contaminated egg white willimprove foaming properties. Whipping agents, such as triethylcitrate and sodium lauryl sulfate, may help restore some foamingproperties of heat-damaged egg white.
Studies have indicated that pasteurization of whole egg at 61°C for3 minutes did not affect performance in custards but slightlyimpaired the quality of sponge cakes (Cunningham, 1995).Commercially pasteurizing whole egg at 60°C has been shown notto adversely affect baking properties. Pasteurization temperaturesfor whole egg in excess of 60°C may adversely affect sponge cakevolume. Herald and Smith (1989) observed that pasteurization ofwhole egg between 60°C to 68°C decreased pie filling expansion.
Pasteurization of egg yolk products appears to have minimal effectson emulsifying properties (Cunningham, 1995). Pasteurization ofsalted yolk at 62°C to 64°C also did not adversely affectperformance of mayonnaise and cream puffs. Other studies haveindicated that sugared yolks pasteurized from 60°C to 64°Cperform well in sponge cakes, chiffon cakes and yellow layer cakes.
Hr Schwall et al., 19611 Froning and Swanson, 19612 Heath, 19773
0 7.90 7.80 8.00
4 8.04
8 8.04
24 8.5 8.5 8.65
48 8.75
72 8.80 9.10
96
168 9.00 9.3017.2°C - 12.7°C212.7°C322°C
TABLE 5. CHANGES IN pH DURING STORAGE

I N T E R N A T I O N A L E G G P A S T E U R I Z A T I O N M A N U A L 9
Pasteurization requirements for various liquid egg products areshown in Table 6. These USDA requirements provide minimumtemperatures and holding times (FDA, CFR 9, 2002; USDA,1980). Whole egg pasteurization requirements for othercountries are 66°C to 68°C for Poland; 63.3°C for 2.5 minutesfor China; 62°C for 2.5 minutes for Australia; and 65°C for 90to 180 seconds in Denmark (Cunningham, 1995). Great Britainrequires 64.4°C for 2.5 minutes (Statutory Instruments, 1963).There are other equivalent methods that have also beenapproved. Detailed present-day pasteurization methods for liquidegg products are provided in the following discussion.
EGG WHITE PASTEURIZATION
Heat Without Chemicals
The approved methods using heat alone are 56.7°C for 3.5minutes or 55.6°C for 6.2 minutes. As mentioned earlier, eggwhite proteins are particularly heat sensitive, requiring theselower temperatures. The effectiveness of eliminating Salmonellaat these temperatures has been shown to be improved at higherpH values (Cotterill, 1968). The research generally indicated amuch better Salmonella kill using the approved methods whenthe albumen pH was greater than 8.9.
Recently, there have been other studies to re-evaluate present eggwhite pasteurization guidelines. Palumbo et al. (1996) determinedsurvival of a six-strain mixture of Salmonella enteritidis, Salmonellatyphimurium and Salmonella senftenberg (not 775 W) in egg whiteusing a submerged vial technique. As reported by previous workers,these scientists also reported that Salmonella is much more heatresistant at low albumen pH. Log reductions using a 3.5-minuteholding time at 56.6°C were 0.97 at pH 7.8, 1.64 at pH 8.2, 2.20at pH 8.8 and 3.24 at pH. 9.3. Michalski et al. (1999) determinedD values for a five-strain cocktail of Salmonella enteritidis in eggwhite at pH 9.0 using 100µl capillary tubes. They reported a 7.5 Dreduction which was considerably higher than that reported byPalumbo et al. (1996). Schuman et al. (1997) observed thatcapillary tubes gave more accurate D values as compared to testtubes which may account for some of the differences in Palumbo’sand Michalski’s data.
Michalski et al. (1999) observed a reduction of greater than 9 D at56.7°C for 3.5 minutes when using a plate pasteurizer, which wassomewhat higher than the reduction found using the capillarytubes. Palumbo et al. (1996) also reported a better kill when using aplate pasteurizer, which they attributed to better mixing due toturbulent flow in the right-angle turns in the holding tube of theplate pasteurizer.
Lactic Acid-Aluminum Sulfate
Lineweaver and Cunningham (1966) patented a process whichstabilized liquid egg whites prior to pasteurizing at 60°C to61.7°C for 3.5 to 4.0 minutes. When egg white is adjusted to aneutral pH (6.8 to 7.3) using lactic acid, the ovalbumin,lysozyme, ovomucoid and ovomucin are more heat stable. Also,metallic ions (aluminum salts) are added to form a heat-stablecomplex with conalbumin (ovotransferrin). Stabilization of theegg white prior to pasteurization is accomplished by addingaluminum sulfate and lactic acid. A whipping aid may also beadded to the stabilizing solution.
Heat Plus Hydrogen Peroxide
Hydrogen peroxide has been shown to eliminate Salmonella inegg white at room temperature (Ayres and Slosberg, 1949). Aftertreatment, catalase is added to decompose hydrogen peroxide towater and oxygen. Armour developed a patent which utilized thistechnology (Lloyd and Harriman, 1957).
The Armour method involves heating to 51.7°C and holding for 1.5minutes to inactivate the natural catalase in the egg white. Hydrogenperoxide (10% solution) is then metered into the holding tube at alevel of 0.5 lb per 100 lb of egg white. The mixture is held at 51.7°Cfor 2 minutes, after which the pasteurized product is cooled to 7°Cand catalase added to remove residual hydrogen peroxide.
EGG PASTEURIZATION METHODS
Minimum Minimum Holding Time Temperature Requirement
Liquid Egg Product °C Minutes
Albumen (without use of chemicals) 56.7 3.5
55.6 6.2
Whole egg 60.0 3.5
Whole egg blends 61.1 3.5(less than 2% added non-egg ingredients) 60.0 6.2
Fortified whole egg and blends (24-38% 62.2 3.5solids, 2-12% added non-egg ingredients) 61.1 6.2
Salted whole egg 63.3 3.5(with 2% or more salt added) 62.2 6.2
Sugared whole egg 61.1 3.5(with 2% or more sugar added) 60.0 6.2
Plain yolk 61.1 3.560.0 6.2
Sugared yolk (2% or more sugar added) 63.3 3.562.2 6.2
Salted yolk (2-12% salt added) 63.3 3.562.2 6.2
TABLE 6. USDA PASTEURIZATION REQUIREMENTS (FDA CFR 9:590,570; USDA, 1980)
I N T E R N A T I O N A L E G G P A S T E U R I Z A T I O N M A N U A L10
Standard Brands (USDA, 1969) later modified the hydrogenperoxide method. After leaving the regenerator section andbefore entering the heating section, a 10% solution of hydrogenperoxide is injected at a level of 0.875 lb per 100 lb of egg white.The mixture is then heated to 51.7°C for 3.5 minutes. Aftercooling, catalase is added to remove residual hydrogen peroxide.
The hydrogen peroxide method is extensively utilized by theindustry today. It allows for the pasteurization of egg white at alower temperature to minimize damage to heat-sensitive proteins.
Heat Plus Vacuum
The Ballas Egg Products Corp. developed a method forpasteurizing egg whites at 56.7°C with a 3.5-minute holdingtime (USDA, 1969). A vacuum chamber with 17 to 20 inches ofvacuum is placed in the line after the egg white has passedthrough the regenerator. Ballas Egg Products indicated that thevacuum chamber reduces “cooking” of egg white on plates.
Hot Room Treatment of Dried Egg White
Heat treatment of dried egg white was proposed and furtherinvestigated as a method for destroying Salmonella (Ayres andSlosberg, 1949; Banwart and Ayres, 1956). Moisture contentshould be 6% for the adequate destruction of Salmonella. Thebulk-packaged egg white solids should be heated to at least54.4°C and be held at that temperature for 7 to 10 days untilSalmonella negative. This pasteurization method has also beenshown to improve whipping properties of egg solids.
Bergquist (1961) patented a combined liquid egg whitepasteurization and hot room treatment of egg white solids. Thisprocess produced egg white solids with a low bacterial count.
WHOLE EGG PASTEURIZATION
USDA pasteurization requirements for yolk, whole eggs, wholeegg blends, fortified whole eggs and blends, salted yolk, saltedwhole egg, sugared yolk and sugared whole egg are shown inTable 6. Minimum temperatures and holding times are shown.Recently, Michalski et al. (1999), using a plate pasteurizer,reported a greater than 9 D reduction of Salmonella enteritidis inwhole egg at 60.0°C for 3.5 minutes.
Ball et al. (1987) developed an ultrapasteurized and asepticallypackaged process to extend shelf life. Whole egg was heated totemperatures ranging from 63.7°C to 72.2°C for 2.7 to 192.2seconds. This process gave a shelf life of 4 to 24 weeks at 4°C andwas later patented (Swartzel et al., 1989).
YOLK PASTEURIZATION
USDA minimum pasteurization requirements for plain yolk,salted yolk and sugared yolk are presented in Table 6. Salmonellais more resistant in yolk, but yolk is less sensitive to highertemperatures as it affects functional properties. Thus, higherpasteurization temperatures are practical for yolk products.Addition of salt or sugar further increases the heat resistance(Garibaldi et al., 1969; Cotterill and Glauert, 1971) of yolkproducts. Thermal resistance of Salmonella in salted yolkproducts has been of special concern.
Recently, Palumbo et al. (1995) determined effectiveness ofpresent pasteurization procedures used for egg yolk and egg yolkproducts by heating in a closed vial. The D value for plain yolk at61.1°C was 0.57. The D values for 10% sugared yolk at 63.3°Cwas 0.72 while 10% salted yolk had an observed D value of 11.50at 63.3°C. They indicated that present pasteurization methods foryolk and 10% sugared yolk were adequate, but suggested thatcurrent minimum pasteurization processes for 10% to 20% saltedyolk would allow survival of Salmonella if initial levels were high.However, Michalski et al. (1999) observed an 8 D reduction in10% salted yolk at 63.3°C and a 1 D reduction in egg yolkcontaining both 5% salt and 5% sugar using capillary tubes. Hereagain, these different results may be partially explained by the useof capillary tubes which largely eliminate the come-up time andthe effect of viscosity (Schuman et al., 1997).
OTHER METHODS OF PASTEURIZATION
Irradiation
Radiation pasteurization has been studied extensively. Many ofthe earlier research efforts in the 1950s and 1960s have beenreviewed in the 1968 Egg Pasteurization Manual (USDA,1968). Gamma irradiation was emphasized at that time.Gamma radiation has excellent penetration, particularly infrozen egg products. Yolk-containing egg products were notedto have off-flavors which were largely volatized during spraydrying. Egg white was less prone to off-flavor developmentduring gamma irradiation. Kijowski et al. (1994) recentlyobserved that gamma irradiation of frozen whole egg at 2.5KGy did not adversely affect functional or sensory properties.They obtained a D value of 0.39 KGy.
Other research on use of electron beam irradiation has stimulatednew interest in this technology (Wong et al., 1996; Huang et al.,1997; Serrano et al., 1997). Electron beam irradiation generates noradioactivity when the accelerator is switched off. Also, there is noradioactive waste which is a problem when using Co-60 as agamma source. However, electron beam radiation has a lowpenetration and is limited to use in foods of limited thickness (3cm at a beam power of 8.1 KW).

I N T E R N A T I O N A L E G G P A S T E U R I Z A T I O N M A N U A L 11
Serrano et al. (1997) inoculated shell eggs and whole liquid eggwith five strains of Salmonella enteritidis and irradiated using anelectron beam accelerator. They found that a 0.5 KGy dose wassufficient to eliminate all isolates on the shell surface. On thebasis of D values obtained, an irradiation dose of 1.5 KGy wassufficient to reduce Salmonella counts by 4 logs in both shelleggs and liquid eggs.
Wong et al. (1996) found that electron beam irradiation ofliquid egg white at 2.5 to 3.3 KGy destroyed an inoculum of107 cells per milliliter of the nalidixic acid-resistant strain ofSalmonella typhimurium. Irradiated egg white samples had 47%lower foam drainage and more stable viscosity than thermallypasteurized egg white. Also, volume of angel food cakes fromirradiated samples was significantly higher than that fromthermally pasteurized liquid egg white.
Huang et al. (1997) utilized electron beam irradiation at 2.5KGy to pasteurized liquid egg yolk. Irradiation did not causeany significant effect on physical, chemical and functionalproperties of egg yolk. Percent soluble protein was notsignificantly affected, indicating minimal protein denaturation.
The FDA (2000) approved the use of ionizing irradiation forthe reduction of Salmonella in fresh shell eggs. It was claimedthat the absorbed dose of 3 KGy would result in some changesin viscosity and color. However, they indicated no affect onchemical composition. It was emphasized that this dosagewould reduce, but not eliminate, Salmonella.
Irradiation may have potential for pasteurization of liquid eggs.Electron beam irradiation probably may be worth pursuing foreliminating Salmonella in egg white which is quite heatsensitive. However, acceptance of irradiation by consumers ispresently a concern.
Alternative Methods
The Institute of Food Technologists (2000) has published aspecial supplement reviewing several alternative methods forpasteurizing food products. These include microwave andradio-frequency processing, ohmic heating, high-pressureprocessing, pulsed electric field, high-voltage arc discharge,pulsed-light technology, oscillating magnetic fields, ultrasoundand pulsed x-rays. Some of these may have future commercialapplication, but presently they are largely experimental.

I N T E R N A T I O N A L E G G P A S T E U R I Z A T I O N M A N U A L 13
EGG WHITE , SALTED OR SUGARED YOLK,SALTED OR SUGARED WHOLE EGG ANDBLENDED EGG PRODUCTS
Objective
The objective of this project was to determine the heat resistance ofSalmonella spp. in a variety of liquid egg products. The data wereused to evaluate the effectiveness of pasteurization time/temperature requirements in destroying Salmonella spp. Fiveorganisms were used in a cocktail to determine the survival curvesof Salmonella spp. in the various liquid egg products at 4predetermined temperatures for each product (Table 7). This studyutilized a wider temperature range than reported previously in theliterature. These treatments should provide the information fornewly recommended temperatures and holding times forpasteurization of liquid egg products.
Methods
Fresh shell eggs were obtained from the University of Nebraskapoultry farm. Prior to separation of the white from the yolk, theshells were disinfected with 200 ppm hypochlorite solution.Preparation varied as to product type. Separation of yolk from whitewas done aseptically. Products were blended for 2 minutes using asmall sterile stainless steel container on a Waring blender attached toa variable speed rheostat set at 20 rpm and 120 v to preventfoaming. The various liquid egg products were inoculated, mixedthoroughly and filtered through sterile gauze to assure an evendistribution of inoculum with no lumps from the liquid egg productor the inoculum. With each new batch of eggs and prior to eachexperiment, total plate counts were done on the liquid egg productbefore inoculation, to give some indication of competitive organisms.
The pH and Aw were determined in triplicate on each heatingmenstrum, prior to the heat treatment. The pH was measuredwith a Ross pH electrode on an Orion SA 720 pH meter. TheAw was measured with a Decagon CX-1 water activity meter at22 ± 0.5°C. Percent solids, Aw and pH of all egg products arepresented in Table 8.
Egg White Products. To obtain egg whites with pH values of 7.8and 8.2, fresh eggs were used. For pH values of 8.8 and 9.3, theshell eggs were held at 5°C for one and 2 weeks respectively.Adjustments for the pH treatments were accomplished with theaddition of 1N hydrochloric acid (HCL) or 1N sodium hydroxide(NaOH) after the white was collected. Some adjustment of the pHwas needed immediately after inoculation and filtration.Enumeration was done on inoculated filtered liquid egg just priorto thermal treatments to determine the initial populations, asexplained later in the methods section.
RE-EVALUATION OF LIQUID EGG PASTEURIZATION GUIDELINES
Egg Product Temperatures °F (°C)
Egg white, pH 7.8 130(54.4), 132(55.5), 134(56.7), 135(57.7)
Egg white, pH 8.2 130(54.4), 132(55.5), 134(56.7), 135(57.7)
Egg white, pH 8.8 130(54.4), 132(55.5), 134(56.7), 135(57.7)
Egg white, pH 9.3 130(54.4), 132(55.5), 134(56.7), 135(57.7)
Salted egg yolk, 10%, Initial time (0 h) 146(63.3), 150(65.6), 154(67.8), 158(70.0)
Salted egg yolk, 10%, Hold time (96 h) 146(63.3), 150(65.6), 154(67.8), 158(70.0)
Salted whole egg, 10%, Initial time (0h) 142(61.1), 146(63.3), 150(65.6), 154(67.8)
Salted whole egg, 10%, Hold time (96 h) 142(61.1), 146(63.3), 150(65.6), 154(67.8)
Sugared egg yolk, 10%, Initial time (0 h) 142(61.1), 146(63.3), 150(65.6), 154(67.8)
Sugared egg yolk, 10%, Hold time (96 h) 2 runs 142(61.1), 146(63.3), 150(65.6), 154(67.8)
Sugared egg yolk, 10% Hold time (96 h) 2 runs 138(58.9), 142(61.1), 146(63.3), 150(65.6)
Sugared whole egg, 10%, Initial time (0 h) 140(60.0), 144(62.2), 148(64.4), 152(66.7)
Sugared whole egg, 10%, Hold time (96 h) 136(57.8), 140(60.0), 144(62.2), 148(64.4)
USDA scrambled egg mix (#1) 140(60.0), 144(62.2), 148(64.4), 152(66.7)
Scrambled egg high solids (#2) 136(57.8), 140(60.0), 144(62.2), 148(64.4)
Fortified whole egg “Tex” (#4) 140(60.0), 144(62.2), 148(64.4), 152(66.7)
Fortified egg yolk “Tex” (#6) 142(61.1), 146(63.3), 150(65.6), 154(67.8)
Imitation egg product 130(54.4), 134(56.7), 138(58.9), 142(61.1)
TABLE 7. INDIVIDUAL EGG PRODUCTS ANDTEMPERATURES USED TO DETERMINE D VALUESFOR EACH PRODUCT WITH A COCKTAIL MIXTUREOF (5) SALMONELLA STRAINS
Egg Product Aw Solids % pH
Egg white, pH 7.8 0.997 11.59 7.8
Egg white, pH 8.2 1.000 12.34 8.2
Egg white, pH 8.8 0.993 12.31 8.8
Egg white, pH 9.3 0.997 12.62 9.3
Salted egg yolk 0.866 50.42 5.89
Salted whole egg 0.912 32.36 7.08
Sugared egg yolk 0.982 49.10 6.24
Sugared whole egg 0.985 32.17 7.35
USDA scrambled egg mix (#1) 0.992 29.68 6.93
Scrambled egg mix (#2) 0.996 22.54 6.84
Fortified whole egg “Tex” (#4) 0.987 22.73 7.06
Fortified egg yolk “Tex” (#6) 0.976 48.94 6.59
Imitation egg product 0.997 11.56 8.88
TABLE 8. WATER ACTIVITY (AW) , pH AND SOLIDS OF ALLEGG PRODUCTS
I N T E R N A T I O N A L E G G P A S T E U R I Z A T I O N M A N U A L14
Yolk and Whole Egg Products. For yolk products, egg white wasadded back to the separated yolk to acquire a solids content of43.3% (normal for industry breaking machines). Very finecommercial salt or sugar was added to the yolk or whole eggproducts on a 10% weight basis (i.e., 10 g salt or sugar/90 g liquidegg product). The salted and sugared yolk and whole egg productswere tested at 0 and 4 days. The product being held for 4 days washeld at 6°C. Thermal stability of Salmonella spp. in salted egg yolkor whole egg, after 4 days storage, needed further verification(Flowers et al., 1992).
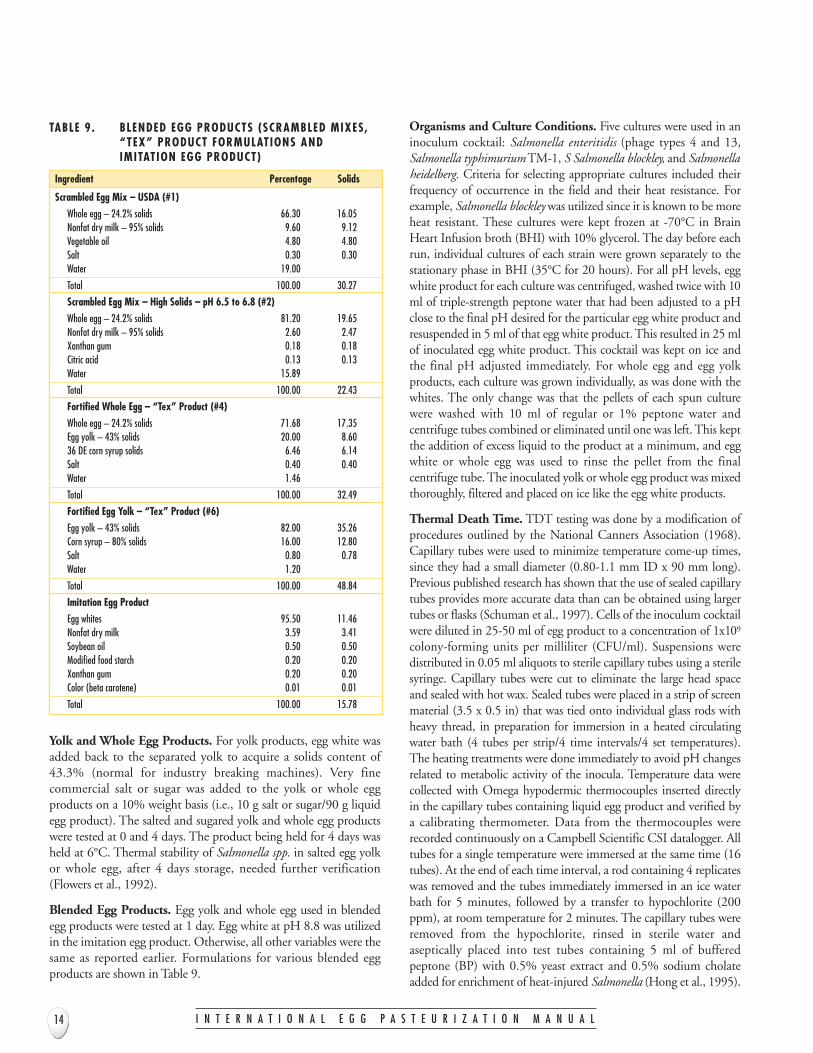
Blended Egg Products. Egg yolk and whole egg used in blendedegg products were tested at 1 day. Egg white at pH 8.8 was utilizedin the imitation egg product. Otherwise, all other variables were thesame as reported earlier. Formulations for various blended eggproducts are shown in Table 9.
Organisms and Culture Conditions. Five cultures were used in aninoculum cocktail: Salmonella enteritidis (phage types 4 and 13,Salmonella typhimurium TM-1, S Salmonella blockley, and Salmonellaheidelberg. Criteria for selecting appropriate cultures included theirfrequency of occurrence in the field and their heat resistance. Forexample, Salmonella blockley was utilized since it is known to be moreheat resistant. These cultures were kept frozen at -70°C in BrainHeart Infusion broth (BHI) with 10% glycerol. The day before eachrun, individual cultures of each strain were grown separately to thestationary phase in BHI (35°C for 20 hours). For all pH levels, eggwhite product for each culture was centrifuged, washed twice with 10ml of triple-strength peptone water that had been adjusted to a pHclose to the final pH desired for the particular egg white product andresuspended in 5 ml of that egg white product. This resulted in 25 mlof inoculated egg white product. This cocktail was kept on ice andthe final pH adjusted immediately. For whole egg and egg yolkproducts, each culture was grown individually, as was done with thewhites. The only change was that the pellets of each spun culturewere washed with 10 ml of regular or 1% peptone water andcentrifuge tubes combined or eliminated until one was left. This keptthe addition of excess liquid to the product at a minimum, and eggwhite or whole egg was used to rinse the pellet from the finalcentrifuge tube. The inoculated yolk or whole egg product was mixedthoroughly, filtered and placed on ice like the egg white products.
Thermal Death Time. TDT testing was done by a modification ofprocedures outlined by the National Canners Association (1968).Capillary tubes were used to minimize temperature come-up times,since they had a small diameter (0.80-1.1 mm ID x 90 mm long).Previous published research has shown that the use of sealed capillarytubes provides more accurate data than can be obtained using largertubes or flasks (Schuman et al., 1997). Cells of the inoculum cocktailwere diluted in 25-50 ml of egg product to a concentration of 1x10⁹
colony-forming units per milliliter (CFU/ml). Suspensions weredistributed in 0.05 ml aliquots to sterile capillary tubes using a sterilesyringe. Capillary tubes were cut to eliminate the large head spaceand sealed with hot wax. Sealed tubes were placed in a strip of screenmaterial (3.5 x 0.5 in) that was tied onto individual glass rods withheavy thread, in preparation for immersion in a heated circulatingwater bath (4 tubes per strip/4 time intervals/4 set temperatures).The heating treatments were done immediately to avoid pH changesrelated to metabolic activity of the inocula. Temperature data werecollected with Omega hypodermic thermocouples inserted directlyin the capillary tubes containing liquid egg product and verified bya calibrating thermometer. Data from the thermocouples wererecorded continuously on a Campbell Scientific CSI datalogger. Alltubes for a single temperature were immersed at the same time (16tubes). At the end of each time interval, a rod containing 4 replicateswas removed and the tubes immediately immersed in an ice waterbath for 5 minutes, followed by a transfer to hypochlorite (200ppm), at room temperature for 2 minutes. The capillary tubes wereremoved from the hypochlorite, rinsed in sterile water andaseptically placed into test tubes containing 5 ml of bufferedpeptone (BP) with 0.5% yeast extract and 0.5% sodium cholateadded for enrichment of heat-injured Salmonella (Hong et al., 1995).
Ingredient Percentage Solids
Scrambled Egg Mix – USDA (#1)Whole egg – 24.2% solids 66.30 16.05Nonfat dry milk – 95% solids 9.60 9.12Vegetable oil 4.80 4.80Salt 0.30 0.30Water 19.00
Total 100.00 30.27
Scrambled Egg Mix – High Solids – pH 6.5 to 6.8 (#2)Whole egg – 24.2% solids 81.20 19.65Nonfat dry milk – 95% solids 2.60 2.47Xanthan gum 0.18 0.18Citric acid 0.13 0.13Water 15.89
Total 100.00 22.43
Fortified Whole Egg – “Tex” Product (#4)Whole egg – 24.2% solids 71.68 17.35Egg yolk – 43% solids 20.00 8.6036 DE corn syrup solids 6.46 6.14Salt 0.40 0.40Water 1.46
Total 100.00 32.49
Fortified Egg Yolk – “Tex” Product (#6)Egg yolk – 43% solids 82.00 35.26Corn syrup – 80% solids 16.00 12.80Salt 0.80 0.78Water 1.20
Total 100.00 48.84
Imitation Egg ProductEgg whites 95.50 11.46Nonfat dry milk 3.59 3.41Soybean oil 0.50 0.50Modified food starch 0.20 0.20Xanthan gum 0.20 0.20Color (beta carotene) 0.01 0.01
Total 100.00 15.78
TABLE 9. BLENDED EGG PRODUCTS (SCRAMBLED MIXES,“TEX” PRODUCT FORMULATIONS ANDIMITATION EGG PRODUCT)
I N T E R N A T I O N A L E G G P A S T E U R I Z A T I O N M A N U A L 15
These were refrigerated until all heat treatments were finished. Thecapillary tubes were aseptically crushed in the BP enrichment tubesand serial dilutions were spread plated on Tryptic Soy Agar (TSA)and incubated at 35°C along with the enrichment tubes. After 48hours of incubation, the TSA plates were enumerated and allcountable plates were replicated on Xylose Lysine Tergitol agar(XLT4) using the method of Cassiday et al. (1990).
The colonies were transferred from a TSA plate to a sterile piece ofvelveteen that had been fastened to a stand that fits perfectly insidea petri dish, then the XLT4 plate was pressed onto the same piece ofvelveteen to pick up the colonies from the velveteen. The XLT4plates were incubated for another 48 hours at 35°C to verify thatthe colonies counted on the non-selective TSA agar wereSalmonella. The lowest dilution to be plated (i.e., the 10-2 consistingof 0.05 ml of liquid egg initially resuspended in 5.0 ml of sterile BP)was spread plated as follows: 1.0 ml of diluted egg evenly distributedon the surface of three TSA plates (i.e., 0.33 ml of diluted egg perplate). After incubation, the number of colonies on all three plateswere totaled, verified and reported as CFU/ml at the 10-2 dilution.Forty-eight hour BP enrichment tubes were streaked onto XLT4agar to check for injured cells that were not recovered by plating.
Initial populations in the capillary tubes were verified by recoveryand enumeration from sealed, unheated, control tubes of productsidentical to the heated menstrum with Salmonella.
Design of the Experiments. For each product, the experiment wasconducted as a split-split plot design with treatment as the wholeplot factor in a randomized complete block, temperature as thesplit-plot factor and time as the split-split plot factor which wasnested in temperature. Triplicate samples were averaged for each runx treatment x temperature x time combination. The means of thelog10 population levels were used as the response variable.
Statistical Models and Determination of TDT. Survival curves ofmicroorganisms are commonly assumed to follow exponentialdecay under high temperature conditions. When this assumptionholds, the log10 of the population levels, denoted logY(t) at time t, isa linear function of time, i.e., logY = a - bt. Log population levels ofall of the egg products, except salted yolk and salted whole eggs,were adequately approximated by a linear function of time. Forthese products we used a linear mixed model analysis to assess theeffects of time, temperature and treatment on logY, to develop afinal model and to obtain predictions for the various combinationsof the factors. For all products except the salted products, lethalitytime was used with Stumbo’s (1973) formula to calculate thedecimal reduction (D) value at each time interval, with survivingorganisms, where t = lethality in minutes:
D = t/ (logA - logB)
A = initial microorganism concentration, B = number of survivingmicroorganisms (assuming one viable organism per tube). The Dvalues were then averaged for the 3 trials at each temperature. Aphantom TDT curve (semi-logarithmic plot of D value vs
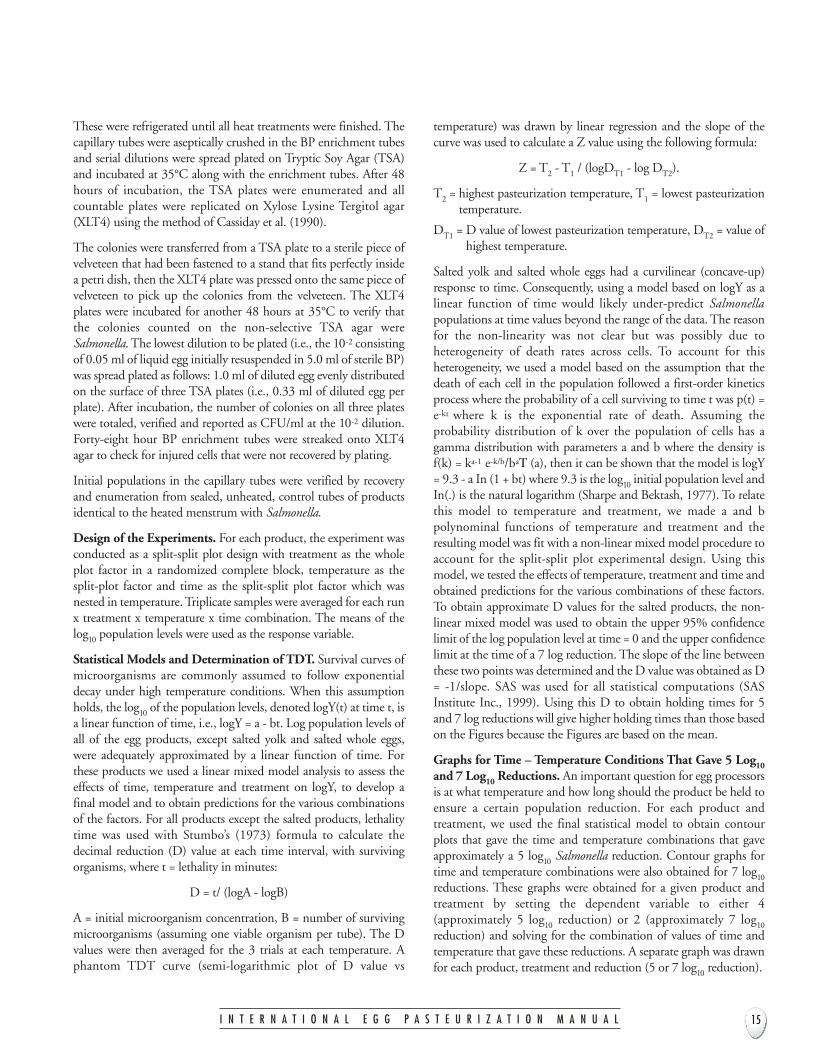
temperature) was drawn by linear regression and the slope of thecurve was used to calculate a Z value using the following formula:
Z = T2 - T1 / (logDT1 - log DT2).
T2 = highest pasteurization temperature, T1 = lowest pasteurizationtemperature.
DT1 = D value of lowest pasteurization temperature, DT2 = value ofhighest temperature.
Salted yolk and salted whole eggs had a curvilinear (concave-up)response to time. Consequently, using a model based on logY as alinear function of time would likely under-predict Salmonellapopulations at time values beyond the range of the data. The reasonfor the non-linearity was not clear but was possibly due toheterogeneity of death rates across cells. To account for thisheterogeneity, we used a model based on the assumption that thedeath of each cell in the population followed a first-order kineticsprocess where the probability of a cell surviving to time t was p(t) =e-kt where k is the exponential rate of death. Assuming theprobability distribution of k over the population of cells has agamma distribution with parameters a and b where the density isf(k) = ka-1 e-k/b/baΤ (a), then it can be shown that the model is logY= 9.3 - a In (1 + bt) where 9.3 is the log10 initial population level andIn(.) is the natural logarithm (Sharpe and Bektash, 1977). To relatethis model to temperature and treatment, we made a and bpolynominal functions of temperature and treatment and theresulting model was fit with a non-linear mixed model procedure toaccount for the split-split plot experimental design. Using thismodel, we tested the effects of temperature, treatment and time andobtained predictions for the various combinations of these factors.To obtain approximate D values for the salted products, the non-linear mixed model was used to obtain the upper 95% confidencelimit of the log population level at time = 0 and the upper confidencelimit at the time of a 7 log reduction. The slope of the line betweenthese two points was determined and the D value was obtained as D= -1/slope. SAS was used for all statistical computations (SASInstitute Inc., 1999). Using this D to obtain holding times for 5and 7 log reductions will give higher holding times than those basedon the Figures because the Figures are based on the mean.
Graphs for Time – Temperature Conditions That Gave 5 Log10and 7 Log10 Reductions. An important question for egg processorsis at what temperature and how long should the product be held toensure a certain population reduction. For each product andtreatment, we used the final statistical model to obtain contourplots that gave the time and temperature combinations that gaveapproximately a 5 log10 Salmonella reduction. Contour graphs fortime and temperature combinations were also obtained for 7 log10reductions. These graphs were obtained for a given product andtreatment by setting the dependent variable to either 4(approximately 5 log10 reduction) or 2 (approximately 7 log10reduction) and solving for the combination of values of time andtemperature that gave these reductions. A separate graph was drawnfor each product, treatment and reduction (5 or 7 log10 reduction).
I N T E R N A T I O N A L E G G P A S T E U R I Z A T I O N M A N U A L16
For all products, except salted yolk and whole egg, the contourgraph were of the form:
time = (red + a1)/b1
where red is the log10 reduction from the initial population level (5 or7 log10), a1 contains all the terms in the model that did not includetime and b1 contains all the model terms that did include time untiltime factored out. For the salted products, the graphs were of the form:
time = (10red/a -1)/b
where a and b are polynomial functions of temperature andtreatment in the gamma model as described above and red isdefined as before.
Results
Appendix Figures 1 to 16 (pages 31-46) present calculatedregression lines with 95% confidence limits for each egg product.Analyses of variance indicated that all products have a highlysignificant linear response. However, there was a concern withlinearity of salted yolk products which also had a significantquadratic response. Salted yolk data was transformed to correctlinearity as indicated earlier.
Times and temperatures to provide equivalent pasteurizationeffectiveness at 5 and 7 log reductions are presented in AppendixFigures 17 to 26 (pages 47-56). These graphic presentations shouldallow processors to estimate times and temperatures for a selectedprocess. In most cases, these graphic results closely agree withholding times. However, graphs seem to under-predict holdingtimes for salted products.
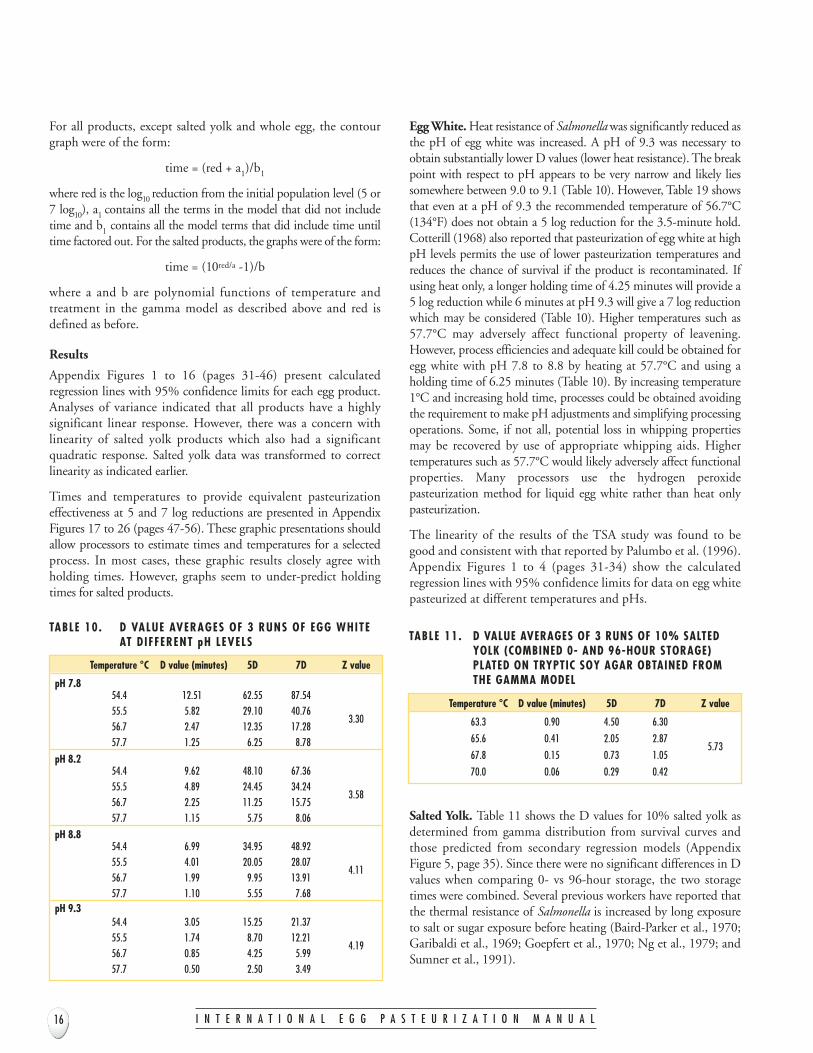
Egg White. Heat resistance of Salmonella was significantly reduced asthe pH of egg white was increased. A pH of 9.3 was necessary toobtain substantially lower D values (lower heat resistance). The breakpoint with respect to pH appears to be very narrow and likely liessomewhere between 9.0 to 9.1 (Table 10). However, Table 19 showsthat even at a pH of 9.3 the recommended temperature of 56.7°C(134°F) does not obtain a 5 log reduction for the 3.5-minute hold.Cotterill (1968) also reported that pasteurization of egg white at highpH levels permits the use of lower pasteurization temperatures andreduces the chance of survival if the product is recontaminated. Ifusing heat only, a longer holding time of 4.25 minutes will provide a5 log reduction while 6 minutes at pH 9.3 will give a 7 log reductionwhich may be considered (Table 10). Higher temperatures such as57.7°C may adversely affect functional property of leavening.However, process efficiencies and adequate kill could be obtained foregg white with pH 7.8 to 8.8 by heating at 57.7°C and using aholding time of 6.25 minutes (Table 10). By increasing temperature1°C and increasing hold time, processes could be obtained avoidingthe requirement to make pH adjustments and simplifying processingoperations. Some, if not all, potential loss in whipping propertiesmay be recovered by use of appropriate whipping aids. Highertemperatures such as 57.7°C would likely adversely affect functionalproperties. Many processors use the hydrogen peroxidepasteurization method for liquid egg white rather than heat onlypasteurization.
The linearity of the results of the TSA study was found to begood and consistent with that reported by Palumbo et al. (1996).Appendix Figures 1 to 4 (pages 31-34) show the calculatedregression lines with 95% confidence limits for data on egg whitepasteurized at different temperatures and pHs.
Salted Yolk. Table 11 shows the D values for 10% salted yolk asdetermined from gamma distribution from survival curves andthose predicted from secondary regression models (AppendixFigure 5, page 35). Since there were no significant differences in Dvalues when comparing 0- vs 96-hour storage, the two storagetimes were combined. Several previous workers have reported thatthe thermal resistance of Salmonella is increased by long exposureto salt or sugar exposure before heating (Baird-Parker et al., 1970;Garibaldi et al., 1969; Goepfert et al., 1970; Ng et al., 1979; andSumner et al., 1991).
Temperature °C D value (minutes) 5D 7D Z value
pH 7.854.4 12.51 62.55 87.5455.5 5.82 29.10 40.76
3.3056.7 2.47 12.35 17.2857.7 1.25 6.25 8.78
pH 8.254.4 9.62 48.10 67.3655.5 4.89 24.45 34.24
3.5856.7 2.25 11.25 15.7557.7 1.15 5.75 8.06
pH 8.854.4 6.99 34.95 48.9255.5 4.01 20.05 28.07
4.1156.7 1.99 9.95 13.9157.7 1.10 5.55 7.68
pH 9.354.4 3.05 15.25 21.3755.5 1.74 8.70 12.21
4.1956.7 0.85 4.25 5.9957.7 0.50 2.50 3.49
TABLE 10. D VALUE AVERAGES OF 3 RUNS OF EGG WHITE AT DIFFERENT pH LEVELS
Temperature °C D value (minutes) 5D 7D Z value
63.3 0.90 4.50 6.30
65.6 0.41 2.05 2.875.73
67.8 0.15 0.73 1.05
70.0 0.06 0.29 0.42
TABLE 11. D VALUE AVERAGES OF 3 RUNS OF 10% SALTEDYOLK (COMBINED 0- AND 96-HOUR STORAGE)PLATED ON TRYPTIC SOY AGAR OBTAINED FROMTHE GAMMA MODEL

I N T E R N A T I O N A L E G G P A S T E U R I Z A T I O N M A N U A L 17
Cotterill and Glauert (1971) also found that the heat resistanceof Salmonella is increased by long exposure in egg yolkcontaining 10% salt or sugar, with the maximum heat resistanceafter 4 days storage at 6°C. Palumbo et al. (1995) reported veryhigh D values for salted yolk which again are contrary to ourresearch findings.
The differing results may be partially explained by the use ofcapillary tubes in our studies. Previous studies have shown that useof capillary tubes provides more accurate results (Schuman et al.,1997; Michalski et al., 1999). Most of the past work has utilizedlarge tubes, which extend the temperature come-up time.Capillary tubes allow for instant come-up times, thereby possiblyeliminating or minimizing the effect of viscosity. Since salted yolkhas a high viscosity after storage, this may play a role in theincreased heat resistance reported by previous investigators usingstored salted yolk. Other likely factors influencing differences inlarger tubes and capillary tubes are probably related to headspaceand flux over the top of the liquid being heated. Table 20 (page 18)shows the log reduction for salted yolk at 63.3°C (146°F) for3.5 minutes to be 3.89. As shown in Table 11, a holding time of4.50 minutes is needed to achieve a 5 log reduction and a 6.30-minute holding time to attain a 7 log reduction. The 5 and 7 logtime/temperature graphs (Tables 19 and 20, page 18) gave somewhatdiffering results than that shown in Table 11 (page 16). The reasonfor this is the Ds for the salted products are based on the 95%confidence limit rather the mean values in Figures 19 and 20.
Sugared Yolk. Tables 12, 13 and 14 show the D values for 10%sugared yolk at 0 and 96 hours. Appendix Figures 8 and 9 (pages 38-39) present the calculated regression lines with 95% confidencelimits. Differences in D values between 0- and 96-hours storage wereobserved to be significant (P<.05). Table 20 (page 18) shows the logreduction at the recommended temperature of 63.3°C (146°F) forsugared yolk at the 0 hours to be 13.46 and 18.42 for the 96-hoursstorage for the 3.5-minute hold. These results would indicate thatholding the sugared yolk 96 hours made Salmonella less heat resistant.
Salted and Sugared Whole Egg. Salted whole egg (combined 0and 96 hours) data are reported in Tables 15 and 16 whilesugared whole egg data are shown in Tables 17 and 18 (page 18).Both salted whole egg and sugared whole egg exhibited asignificant (P<0.05) storage effect. Salted whole egg at 0-hoursstorage time required a 5.65-minute holding time to achieve a 5log reduction. On the other hand, holding salted whole egg 96hours prior to pasteurization reduced the holding time to 3.05minutes for a 5 log reduction. Table 21 (page 18) presents logreductions for salted whole egg (0- and 96-hours storage) whenusing a 3.5-minute holding time. Perhaps there is increasedinjury of Salmonella when holding the salted whole egg or pHchanges during storage may be a factor. Again, the 5 and 7 logreduction prediction graphs (Appendix Figures 19 and 20, pages49-50) gave differing holding times than those observed in Tables15 and 16. Although the graphic results were fairly accurate forother egg products, their use for predicting holding times forsalted whole eggs is not practical. Calculated regression logreductions are also shown in Appendix Figures 6, 7, 10, 11 (pages36, 37, 40, 41).
Temperature °C D value (minutes) 5D 7D Z value
61.1 2.13 10.65 14.91
63.3 1.13 5.65 7.915.19
65.6 0.29 1.45 2.03
67.8 0.11 0.55 0.77
TABLE 15. D VALUE AVERAGES OF 3 RUNS OF 10% SALTEDWHOLE EGG (0-HOURS STORAGE) PLATED ON TRYPTICSOY AGAR OBTAINED FROM THE GAMMA MODEL
Temperature °C D value (minutes) 5D 7D Z value
61.1 1.69 8.45 11.83
63.3 0.61 3.05 4.275.04
65.6 0.22 1.10 1.54
67.8 0.08 0.40 0.56
TABLE 16. D VALUE AVERAGES OF 3 RUNS OF 10% SALTEDWHOLE EGG (96-HOURS STORAGE) PLATED ON TRYPTICSOY AGAR OBTAINED FROM THE GAMMA MODEL
Temperature °C D value (minutes) 5D 7D Z value
61.1 0.84 4.19 5.87
63.3 0.26 1.27 1.785.33
65.6 0.11 0.54 0.75
67.8 0.05 0.23 0.33
TABLE 12. D VALUE AVERAGES OF 4 RUNS OF 10%SUGARED YOLK AT 0 HOUR PLATED ON TRYPTIC SOY AGAR
Temperature °C D value (minutes) 5D 7D Z value
61.1 0.60 2.98 4.17
63.3 0.19 0.96 1.335.80
65.6 0.09 0.43 0.60
67.8 0.04 0.21 0.30
TABLE 13. D VALUE AVERAGES OF 2 RUNS OF 10% SUGAREDYOLK AT 96 HOURS PLATED ON TRYPTIC SOY AGAR
Temperature °C D value (minutes) 5D 7D Z value
58.9 1.33 6.65 9.32
61.1 0.51 2.53 3.534.77
63.3 0.18 0.88 1.24
65.6 0.06 0.26 0.37
TABLE 14. D VALUE AVERAGES OF 2 RUNS OF 10% SUGAREDYOLK AT 96 HOURS PLATED ON TRYPTIC SOY AGAR

Since the USDA required pasteurization temperature of 61.1°C(142°F) was not a temperature used in the pasteurization study onthe sugared whole egg, the D values and log reductions in Table 21for the 3.5-minute hold were determined from the D-value dataattained from the temperature actually used (57.8°C to 66.7°C). Thesugared whole egg had approximately an 8 log reduction for the 0hours while the 96 hours had 11.5 log reduction. This indicates thatholding the sugared whole egg made the Salmonella less heatresistant, which is similar to that observed with the sugared yolk.
Temperature °C D value (minutes) 5D 7D Z value
60.0 0.85 4.27 5.97
62.2 0.25 1.23 1.734.88
64.4 0.08 0.40 0.56
66.7 0.04 0.18 0.26
TABLE 17. D VALUE AVERAGES OF 3 RUNS OF 10% SUGAREDWHOLE EGG AT 0 HOURS PLATED ON TRYPTIC SOY AGAR
Temperature °C D value (minutes) 5D 7D Z value
60.0 0.85 4.27 5.97
62.2 0.25 1.23 1.734.88
64.4 0.08 0.40 0.56
66.7 0.04 0.18 0.26
TABLE 18. D VALUE AVERAGES OF 3 RUNS OF 10% SUGAREDWHOLE EGG AT 96 HOURS PLATED ON TRYPTICSOY AGAR
D value ± SDa 3.5 minutes reductionpH (minutes) (log CFU/g egg white)
7.8 2.47 ± 0.10 1.42
8.2 2.25 ± 0.21 1.56
8.8 1.99 ± 0.12 1.76
9.3 0.85 ± 0.03 4.12aAverage of three trials ± standard deviation
TABLE 19. EFFECT OF pH ON THERMAL RESISTANCE OFSALMONELLA SPP. IN EGG WHITE AT 56.7°C,SHOWING D VALUES DETERMINED BY SUBMERGEDCAPILLARY TUBE TECHNIQUE AND CALCULATEDLOG-UNIT REDUCTION IN 3.5 MINUTES
D value ± SDa 3.5 minutes reductionEgg Product/Time (minutes) (log CFU/g egg white)
Salted yolk (combined 0- and 96-hours) 0.90 3.89
Sugared yolk 0 hours 0.26 ± 0.04 13.46
Sugared yolk 96 hours 0.19 ± 0.02 18.42aAverage of three trials ± standard deviation (sugared yolk was an average of four trails).
TABLE 20. EFFECT OF 10% SALT OR SUGAR ON THERMALRESISTANCE OF SALMONELLA SPP. IN EGG YOLK AT 63.3°C, SHOWING D VALUES DETERMINED BYSUBMERGED CAPILLARY TUBE TECHNIQUE ANDCALCULATED LOG-UNIT REDUCTION IN 3.5 MINUTES
D value ± SDa 3.5 minutes reductionEgg Product/Time (minutes) (log CFU/g egg white)
63.3°C
Salted whole egg (0 hours) 1.13 3.10
Salted whole egg (96 hours) 0.61 5.73
61.1°Cb
Sugared Whole egg (0 hours) 0.45 7.78
Sugared Whole egg (96 hours) 0.30 11.51aAverage of three trials ± standard deviation.bExtrapolated from D-value data collected at 57.8°C to 66.7°C.
TABLE 21. EFFECT OF 10% SALT OR SUGAR ON THERMAL RESISTANCEOF SALMONELLA SPP. IN WHOLE EGG AT 63.3°C FORSALTED AND 61.1°C FOR SUGARED, SHOWING D VALUESDETERMINED BY SUBMERGED CAPILLARY TUBE TECHNIQUEAND CALCULATED LOG-UNIT REDUCTION IN 3.5 MINUTES
I N T E R N A T I O N A L E G G P A S T E U R I Z A T I O N M A N U A L18
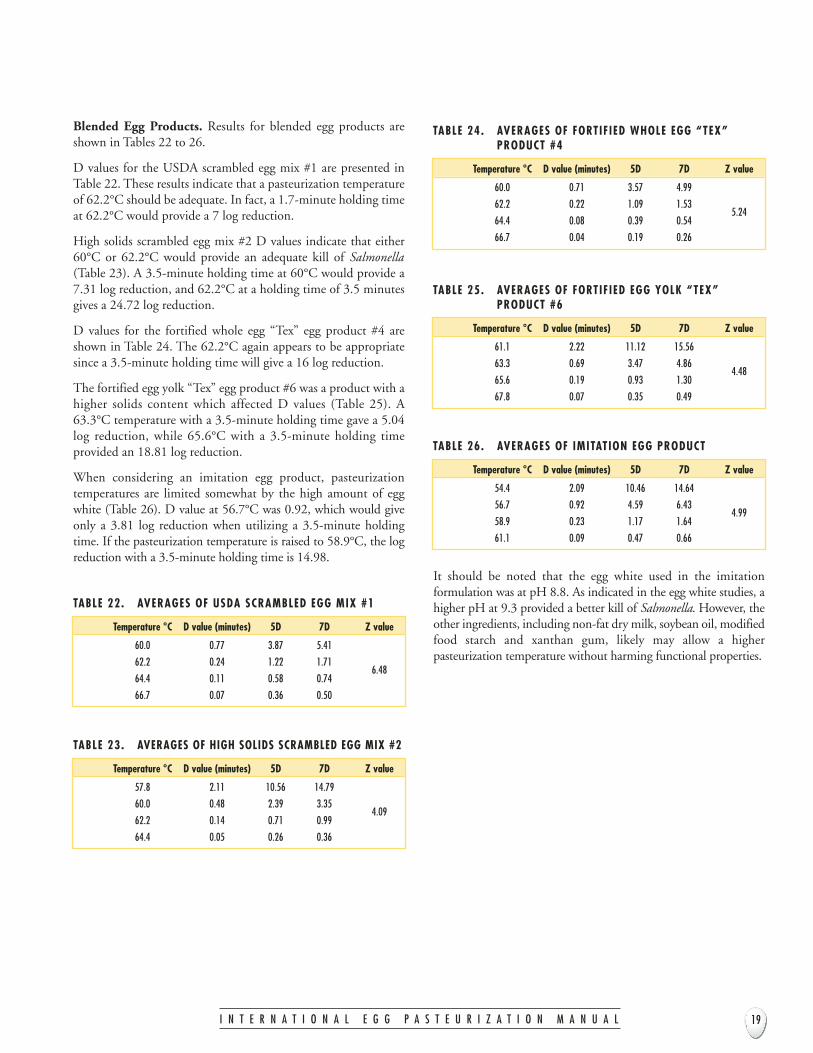
Blended Egg Products. Results for blended egg products areshown in Tables 22 to 26.
D values for the USDA scrambled egg mix #1 are presented inTable 22. These results indicate that a pasteurization temperatureof 62.2°C should be adequate. In fact, a 1.7-minute holding timeat 62.2°C would provide a 7 log reduction.
High solids scrambled egg mix #2 D values indicate that either60°C or 62.2°C would provide an adequate kill of Salmonella(Table 23). A 3.5-minute holding time at 60°C would provide a7.31 log reduction, and 62.2°C at a holding time of 3.5 minutesgives a 24.72 log reduction.
D values for the fortified whole egg “Tex” egg product #4 areshown in Table 24. The 62.2°C again appears to be appropriatesince a 3.5-minute holding time will give a 16 log reduction.
The fortified egg yolk “Tex” egg product #6 was a product with ahigher solids content which affected D values (Table 25). A63.3°C temperature with a 3.5-minute holding time gave a 5.04log reduction, while 65.6°C with a 3.5-minute holding timeprovided an 18.81 log reduction.
When considering an imitation egg product, pasteurizationtemperatures are limited somewhat by the high amount of eggwhite (Table 26). D value at 56.7°C was 0.92, which would giveonly a 3.81 log reduction when utilizing a 3.5-minute holdingtime. If the pasteurization temperature is raised to 58.9°C, the logreduction with a 3.5-minute holding time is 14.98.
It should be noted that the egg white used in the imitationformulation was at pH 8.8. As indicated in the egg white studies, ahigher pH at 9.3 provided a better kill of Salmonella. However, theother ingredients, including non-fat dry milk, soybean oil, modifiedfood starch and xanthan gum, likely may allow a higherpasteurization temperature without harming functional properties.
Temperature °C D value (minutes) 5D 7D Z value
60.0 0.77 3.87 5.41
62.2 0.24 1.22 1.716.48
64.4 0.11 0.58 0.74
66.7 0.07 0.36 0.50
TABLE 22. AVERAGES OF USDA SCRAMBLED EGG MIX #1
Temperature °C D value (minutes) 5D 7D Z value
57.8 2.11 10.56 14.79
60.0 0.48 2.39 3.354.09
62.2 0.14 0.71 0.99
64.4 0.05 0.26 0.36
TABLE 23. AVERAGES OF HIGH SOLIDS SCRAMBLED EGG MIX #2
Temperature °C D value (minutes) 5D 7D Z value
60.0 0.71 3.57 4.99
62.2 0.22 1.09 1.535.24
64.4 0.08 0.39 0.54
66.7 0.04 0.19 0.26
TABLE 24. AVERAGES OF FORTIF IED WHOLE EGG “TEX”PRODUCT #4
Temperature °C D value (minutes) 5D 7D Z value
61.1 2.22 11.12 15.56
63.3 0.69 3.47 4.864.48
65.6 0.19 0.93 1.30
67.8 0.07 0.35 0.49
TABLE 25. AVERAGES OF FORTIF IED EGG YOLK “TEX”PRODUCT #6
Temperature °C D value (minutes) 5D 7D Z value
54.4 2.09 10.46 14.64
56.7 0.92 4.59 6.434.99
58.9 0.23 1.17 1.64
61.1 0.09 0.47 0.66
TABLE 26. AVERAGES OF IMITATION EGG PRODUCT
I N T E R N A T I O N A L E G G P A S T E U R I Z A T I O N M A N U A L 19

PASTEURIZATION USING HEAT PLUSHYDROGEN PEROXIDE
Objective
To determine thermal death kinetics of Salmonella duringpasteurization of liquid egg white.
• Time-temperature combinations using bench-toppasteurizer with metered addition of H202 were utilized.
• Both the Standard Brands and the Armour processes were tested.
• Five Salmonella strains were used: S. enteritidis(phage types 4 and 13), S. heidelberg, S. typhimuriumand S. blockley.
• Tests were performed with egg white at pH 8.2, 8.8 and 9.0.
• Data were obtained by triplicate replications.
Background
During the time that data were collected for the first USDA EggPasteurization Manual (1969), a large proportion of eggpasteurization was done “offline” whereby eggs were collectedfrom a producer, stored and subsequently processed at an eggprocessing facility. Because of the delay in processing, the pH ofegg white increased from pH 7.8 at laying to pH 9.0 or higher at
the time of processing. Consequently, pH 9.0 was considered the“natural pH” of egg white. In recent times, a greater proportionof eggs are processed “inline” whereby they are laid by hens andcarried by conveyor to another building for processing. Theresult of using freshly processed egg whites is that the pH can bemuch lower than with offline eggs, as low as pH 7.8 to 8.2 at thetime of processing. Therefore, it is important for today’s eggwhite processors to have a pasteurization system that is aseffective at pH 8.2 as it is at 9.0. The Egg Pasteurization Manualhas evaluated various egg pasteurization systems, including acomparison of the Standard Brands and Armour pasteurizationmethods for egg white, two popular commercially-used processesthat utilize hydrogen peroxide.
In order to properly compare these methods using laboratoryconditions, a simulated continuous-flow bench-top pasteurizationprocess was devised that replicated the commercial process: a)separate pre-heat and main-heat water baths were used to mimicheat-exchange and holding-tube conditions, b) hydrogenperoxide was metered into the holding tube after the initial pre-heat but before the main-heating regimen and c) multipleresidence times were obtained with the same inoculated egg whitepreparation by devising multiple channels, each with a differentlength holding tube in the main-heating bath (i.e., differentresidence time [Figure 2]).
ice bath
H2 O2 entry valve
C sample collection&
temperature monitor
4 channel main heating bath
4 channelpre-heat
bath4 channels (egg white)
+ 4 channels (air)4 channels
(H2 O2)
irculatingtemperature controllers
F IGURE 2.
Bench-top pasteurization unit composed of 4- and 8-channel peristaltic pumps, pre-heat and primary-heat water baths, and ice bath. Four (4) lines ofdifferent residence time (i.e., length) were run simultaneously.
I N T E R N A T I O N A L E G G P A S T E U R I Z A T I O N M A N U A L20
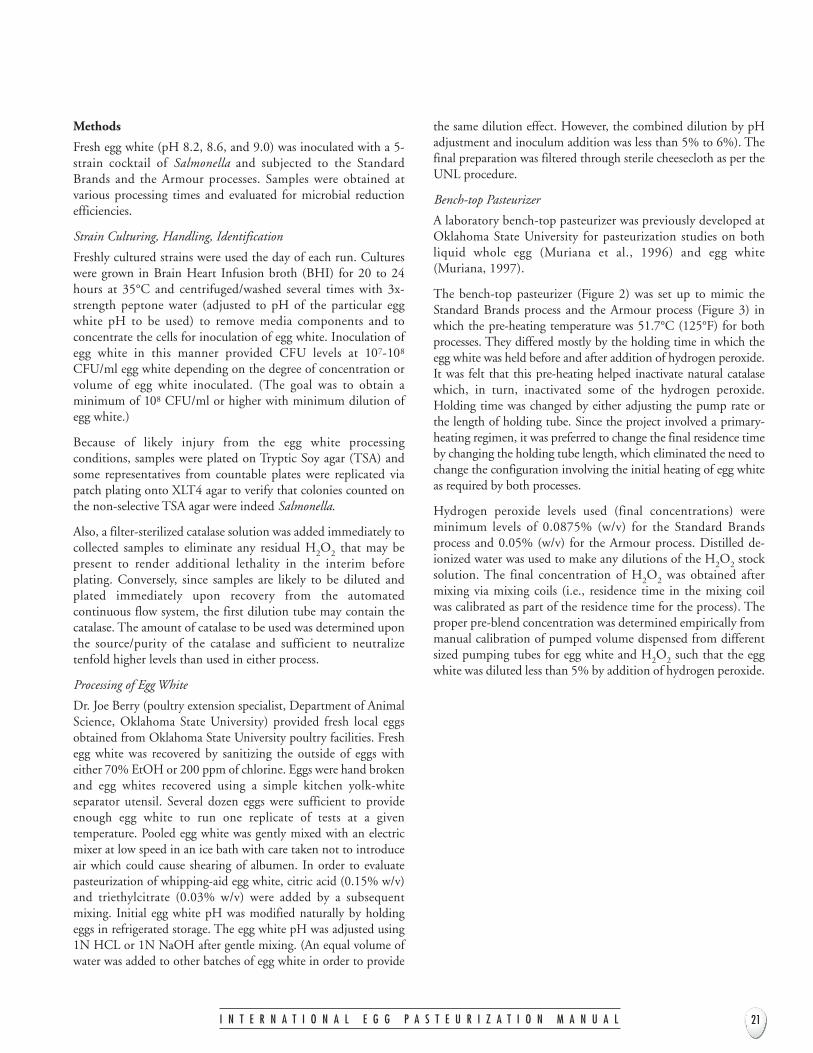
Methods
Fresh egg white (pH 8.2, 8.6, and 9.0) was inoculated with a 5-strain cocktail of Salmonella and subjected to the StandardBrands and the Armour processes. Samples were obtained atvarious processing times and evaluated for microbial reductionefficiencies.
Strain Culturing, Handling, Identification
Freshly cultured strains were used the day of each run. Cultureswere grown in Brain Heart Infusion broth (BHI) for 20 to 24hours at 35°C and centrifuged/washed several times with 3x-strength peptone water (adjusted to pH of the particular eggwhite pH to be used) to remove media components and toconcentrate the cells for inoculation of egg white. Inoculation ofegg white in this manner provided CFU levels at 107-108
CFU/ml egg white depending on the degree of concentration orvolume of egg white inoculated. (The goal was to obtain aminimum of 108 CFU/ml or higher with minimum dilution ofegg white.)
Because of likely injury from the egg white processingconditions, samples were plated on Tryptic Soy agar (TSA) andsome representatives from countable plates were replicated viapatch plating onto XLT4 agar to verify that colonies counted onthe non-selective TSA agar were indeed Salmonella.
Also, a filter-sterilized catalase solution was added immediately tocollected samples to eliminate any residual H2O2 that may bepresent to render additional lethality in the interim beforeplating. Conversely, since samples are likely to be diluted andplated immediately upon recovery from the automatedcontinuous flow system, the first dilution tube may contain thecatalase. The amount of catalase to be used was determined uponthe source/purity of the catalase and sufficient to neutralizetenfold higher levels than used in either process.
Processing of Egg White
Dr. Joe Berry (poultry extension specialist, Department of AnimalScience, Oklahoma State University) provided fresh local eggsobtained from Oklahoma State University poultry facilities. Freshegg white was recovered by sanitizing the outside of eggs witheither 70% EtOH or 200 ppm of chlorine. Eggs were hand brokenand egg whites recovered using a simple kitchen yolk-whiteseparator utensil. Several dozen eggs were sufficient to provideenough egg white to run one replicate of tests at a giventemperature. Pooled egg white was gently mixed with an electricmixer at low speed in an ice bath with care taken not to introduceair which could cause shearing of albumen. In order to evaluatepasteurization of whipping-aid egg white, citric acid (0.15% w/v)and triethylcitrate (0.03% w/v) were added by a subsequentmixing. Initial egg white pH was modified naturally by holdingeggs in refrigerated storage. The egg white pH was adjusted using1N HCL or 1N NaOH after gentle mixing. (An equal volume ofwater was added to other batches of egg white in order to provide
the same dilution effect. However, the combined dilution by pHadjustment and inoculum addition was less than 5% to 6%). Thefinal preparation was filtered through sterile cheesecloth as per theUNL procedure.
Bench-top Pasteurizer
A laboratory bench-top pasteurizer was previously developed atOklahoma State University for pasteurization studies on bothliquid whole egg (Muriana et al., 1996) and egg white(Muriana, 1997).
The bench-top pasteurizer (Figure 2) was set up to mimic theStandard Brands process and the Armour process (Figure 3) inwhich the pre-heating temperature was 51.7°C (125°F) for bothprocesses. They differed mostly by the holding time in which theegg white was held before and after addition of hydrogen peroxide.It was felt that this pre-heating helped inactivate natural catalasewhich, in turn, inactivated some of the hydrogen peroxide.Holding time was changed by either adjusting the pump rate orthe length of holding tube. Since the project involved a primary-heating regimen, it was preferred to change the final residence timeby changing the holding tube length, which eliminated the need tochange the configuration involving the initial heating of egg whiteas required by both processes.
Hydrogen peroxide levels used (final concentrations) wereminimum levels of 0.0875% (w/v) for the Standard Brandsprocess and 0.05% (w/v) for the Armour process. Distilled de-ionized water was used to make any dilutions of the H2O2 stocksolution. The final concentration of H2O2 was obtained aftermixing via mixing coils (i.e., residence time in the mixing coilwas calibrated as part of the residence time for the process). Theproper pre-blend concentration was determined empirically frommanual calibration of pumped volume dispensed from differentsized pumping tubes for egg white and H2O2 such that the eggwhite was diluted less than 5% by addition of hydrogen peroxide.
I N T E R N A T I O N A L E G G P A S T E U R I Z A T I O N M A N U A L 21
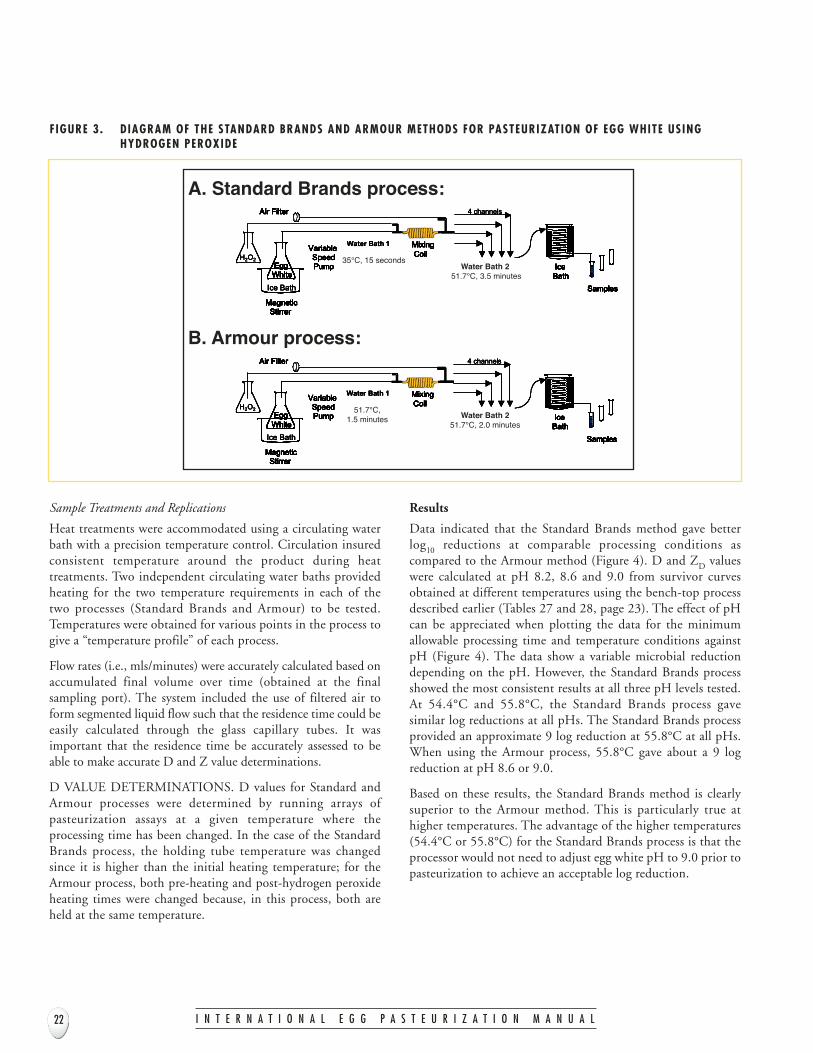
Sample Treatments and Replications
Heat treatments were accommodated using a circulating waterbath with a precision temperature control. Circulation insuredconsistent temperature around the product during heattreatments. Two independent circulating water baths providedheating for the two temperature requirements in each of thetwo processes (Standard Brands and Armour) to be tested.Temperatures were obtained for various points in the process togive a “temperature profile” of each process.
Flow rates (i.e., mls/minutes) were accurately calculated based onaccumulated final volume over time (obtained at the finalsampling port). The system included the use of filtered air toform segmented liquid flow such that the residence time could beeasily calculated through the glass capillary tubes. It wasimportant that the residence time be accurately assessed to beable to make accurate D and Z value determinations.
D VALUE DETERMINATIONS. D values for Standard andArmour processes were determined by running arrays ofpasteurization assays at a given temperature where theprocessing time has been changed. In the case of the StandardBrands process, the holding tube temperature was changedsince it is higher than the initial heating temperature; for theArmour process, both pre-heating and post-hydrogen peroxideheating times were changed because, in this process, both areheld at the same temperature.
Results
Data indicated that the Standard Brands method gave betterlog10 reductions at comparable processing conditions ascompared to the Armour method (Figure 4). D and ZD valueswere calculated at pH 8.2, 8.6 and 9.0 from survivor curvesobtained at different temperatures using the bench-top processdescribed earlier (Tables 27 and 28, page 23). The effect of pHcan be appreciated when plotting the data for the minimumallowable processing time and temperature conditions againstpH (Figure 4). The data show a variable microbial reductiondepending on the pH. However, the Standard Brands processshowed the most consistent results at all three pH levels tested.At 54.4°C and 55.8°C, the Standard Brands process gavesimilar log reductions at all pHs. The Standard Brands processprovided an approximate 9 log reduction at 55.8°C at all pHs.When using the Armour process, 55.8°C gave about a 9 logreduction at pH 8.6 or 9.0.
Based on these results, the Standard Brands method is clearlysuperior to the Armour method. This is particularly true athigher temperatures. The advantage of the higher temperatures(54.4°C or 55.8°C) for the Standard Brands process is that theprocessor would not need to adjust egg white pH to 9.0 prior topasteurization to achieve an acceptable log reduction.
B. Armour Co. process
Variable SpeedPump
Air Filter
MixingCoil
Variable SpeedPump
Air Filter
MixingCoil
Variable SpeedPump
Air Filter
IceBath
Samples
IceBath
Samples
IceBath
SamplesIce Bath
MagneticStirrer
EggWhite
MagneticStirrer
EggWhite
MagneticStirrer
EggWhite
MixingCoil
Water Bath 251.7oC , 2.0 min
H2O2 51.7oC,1.5 min
4 channels
Water Bath 1
A. Standard Brands process:
Variable SpeedPump
Air Filter
MixingCoil
Variable SpeedPump
Air Filter
MixingCoil
Variable SpeedPump
Air Filter
Ice Bath
MagneticStirrer
EggWhite
MagneticStirrer
EggWhite
MagneticStirrer
EggWhite
MixingCoil
Water Bath 251.7oC , 3.5 min
H2O2 35oC, 15 sec
4 channels
Water Bath 1
IceBath
Samples
IceBath
Samples
IceBath
Samples
B. Armour Co. process
Variable SpeedPump
Air Filter
MixingCoil
Variable SpeedPump
Air Filter
MixingCoil
Variable SpeedPump
Air Filter
IceBath
Samples
IceBath
Samples
IceBath
SamplesIce Bath
MagneticStirrer
EggWhite
MagneticStirrer
EggWhite
MagneticStirrer
EggWhite
MixingCoil
Water Bath 251.7oC , 2.0 min
H2O2 51.7oC,1.5 min
4 channels
Water Bath 1
B. Armour Co. process
Variable SpeedPump
Air Filter
MixingCoil
Variable SpeedPump
Air Filter
MixingCoil
Variable SpeedPump
Air Filter
IceBath
Samples
IceBath
Samples
IceBath
Samples
IceBath
Samples
IceBath
Samples
IceBath
SamplesIce Bath
MagneticStirrer
EggWhite
MagneticStirrer
EggWhite
MagneticStirrer
EggWhite
Ice Bath
MagneticStirrer
EggWhite
MagneticStirrer
EggWhite
MagneticStirrer
EggWhite
MixingCoil
Water Bath 251.7oC , 2.0 min
H2O2H2O2 51.7oC,1.5 min
4 channels4 channels
Water Bath 1
A. Standard Brands process:
Variable SpeedPump
Air Filter
MixingCoil
Variable SpeedPump
Air Filter
MixingCoil
Variable SpeedPump
Air Filter
Ice Bath
MagneticStirrer
EggWhite
MagneticStirrer
EggWhite
MagneticStirrer
EggWhite
MixingCoil
Water Bath 251.7oC , 3.5 min
H2O2 35oC, 15 sec
4 channels
Water Bath 1
IceBath
Samples
IceBath
Samples
IceBath
Samples
A. Standard Brands process:
Variable SpeedPump
Air Filter
MixingCoil
Variable SpeedPump
Air Filter
MixingCoil
Variable SpeedPump
Air Filter
Ice Bath
MagneticStirrer
EggWhite
MagneticStirrer
EggWhite
MagneticStirrer
EggWhite
Ice Bath
MagneticStirrer
EggWhite
MagneticStirrer
EggWhite
MagneticStirrer
EggWhite
MixingCoil
Water Bath 251.7oC , 3.5 min
H2O2H2O2 35oC, 15 sec
4 channels4 channels
Water Bath 1
IceBath
Samples
IceBath
Samples
IceBath
Samples
IceBath
Samples
IceBath
Samples
IceBath
Samples
F IGURE 3. DIAGRAM OF THE STANDARD BRANDS AND ARMOUR METHODS FOR PASTEURIZATION OF EGG WHITE USINGHYDROGEN PEROXIDE
I N T E R N A T I O N A L E G G P A S T E U R I Z A T I O N M A N U A L22
A. Standard Brands process:
B. Armour process:
35°C, 15 seconds
51.7°C,1.5 minutes Water Bath 2
51.7°C, 2.0 minutes
Water Bath 251.7°C, 3.5 minutes

pH D51.7°C D53.1°C D54.4°C D56.8°C ZD
8.2 1.33 1.03 0.78 0.38 4.48
8.6 0.91 0.69 0.37 0.24 5.96
9.0 0.63 0.50 0.35 0.23 10.29
TABLE 27. D VALUES (MINUTES) AND Z VALUES (°C) OBTAINEDWITH THE ARMOUR METHOD FOR EGG WHITE AT pH8.2, 8.6 AND 9.0, PROCESSED AT 51.7°C, 53.1°C,54.4°C AND 56.8°C (VALUES ARE AVERAGES OF TRIPLICATEREPLICATIONS AND 2 SAMPLES PER REPLICATION)
pH D51.7°C D53.1°C D54.4°C D56.8°C ZD
8.2 1.19 0.75 0.52 0.305 4.73
8.6 1.03 0.66 0.52 0.298 5.85
9.0 0.81 0.54 0.47 0.286 8.16
TABLE 28. D VALUES (MINUTES) AND Z VALUES (°C) OBTAINEDWITH THE STANDARD BRANDS METHOD FOR EGGWHITE AT pH 8.2, 8.6 AND 9.0, PROCESSED AT51.7°C, 53.1°C, 54.4°C AND 56.8°C (VALUES AREAVERAGES OF TRIPLICATE REPLICATIONS AND 2 SAMPLES PERREPLICATION)
The Armour Method
-9
-8
-7
-6
-5
-4
-3
-2
-1
8.2 8.6 9pH
Log
Red
uctio
n
Standard Brands Metho
-9
-8
-7
-6
-5
-4
-3
-2
-1
8.2 8.6 9pH
Log
Red
uctio
n
53.1oC
51.7oC
54.4oC
55.8oC
53.1oC
51.7oC
54.4oC
55.8oC
The Armour Method
-9
-8
-7
-6
-5
-4
-3
-2
-1
8.2 8.6 9pH
Log
Red
uctio
n
Standard Brands Metho
-9
-8
-7
-6
-5
-4
-3
-2
-1
8.2 8.6 9pH
Log
Red
uctio
n
53.1oC
51.7 oC
54.4oC
55.8oC
53.1 oC
51.7oC
54.4oC
55.8oC
F IGURE 4. EFFECT OF pH AND TEMPERATURE ON EGG WHITE PASTEURIZATION ACCORDING TO THE ARMOUR AND STANDARDBRANDS METHODS AT THE MINIMUM ALLOWABLE T IME AND TEMPERATURE CONDITIONS
I N T E R N A T I O N A L E G G P A S T E U R I Z A T I O N M A N U A L 23
Armour Method Standard Brands Method
53.1°C
-1
-2
-3
-4
-5
-6
-7
-8
-9
-1
-2
-3
-4
-5
-6
-7
-8
-9

I N T E R N A T I O N A L E G G P A S T E U R I Z A T I O N M A N U A L 25
On the basis of these studies, times and temperatures toprovide equivalent pasteurization effectiveness at 5 and 7 logreductions are presented in Appendix Figures 17 to 26 (pages47-56). These graphic presentations should allow processors toestimate times and temperatures for a selected process.Research presented in this manual did not include all eggproducts. Some egg products, such as those containing highersalt or sugar contents, would likely require the processor tovalidate the proper pasteurization process. As noted previouslyin this manual, researchers have indicated that egg productscontaining as high as 20% salt, or combinations of salt andsugar, may not have adequate log reductions using currentpasteurization methods (Palumbo et al., 1995; Michalski et al.,1999). Perhaps egg products with higher levels of salt orcombinations with sugar may need to be pasteurized prior toaddition of salt and sugar. This approach would require carefulmonitoring to avoid recontamination.
Table 29 shows new pasteurization guidelines for egg products.With these processes, some changes are indicated. Adjustmentof pH of albumen would be required if the 56.7°Cpasteurization temperature was used. However, this may notbe practical for many processors. Therefore, it is recommendedthat a pasteurization temperature of 57.7°C also beconsidered. In many cases, the hydrogen peroxide methodshould not require any pH adjustment.
With respect to salted yolk, it is recommended that the holdingtime be increased to 63.3°C. Salted whole egg would continueto have a process of 63.3°C for 3.5 minutes if held 96 hoursafter salt addition. Many processors may find holding time tobe impractical and prefer to increase the holding time for saltedwhole egg. These changes for salted egg products should haveminimum influence on functional properties.
Times and temperatures for various blended products areshown. These guidelines, of course, are presented for specificformulations. If processors have formulations different fromthese, they would have to obtain approval from USDA.
This study did not include plain yolk or plain whole egg.Presently, it would appear that the old pasteurizationrequirements should be adequate for these egg products, asindicated by recent studies by other microbiologists (Palumboet al., 1995; Michalski et al., 1999).
Sanitary standards for equipment are important and shouldmeet 3-A sanitary standards. The 3-A sanitary standards arepublished by the International Association for FoodProtection, 6200 Aurora Avenue, Suite 200W, Des Moines, IA50322-2863.
Minimum Temperature Minimum Holding TimeLiquid Egg Product °C (°F) Minutes1
Egg white with pH adjusted 56.7 (134) 4.3
Egg white without pH adjusted 57.7 (136) 6.3
Egg white pH 8.6 with hydrogen 54.4 (130) 3.5peroxide (Standard Brands process)
USDA scrambled egg mix (30% solids) 62.2 (144) 2.0
Scrambled egg mix (22% solids) 60.0 (140) 2.4
Fortified whole egg “Tex” product 62.2 (144) 2.0(32% solids)
Fortified egg yolk “Tex” product (49% solids) 63.3 (146) 3.5
Imitation egg product 56.7 (134) 4.6
Salted yolk (10%) 63.3 (146) 4.5
Salted whole egg (10%) without storage 63.3 (146) 5.7
Salted whole egg (10%) with 96-hours storage 63.3 (146) 3.5
Sugared yolk (10%) 63.3 (146) 3.5
Sugared whole egg (10%) 61.1 (142) 3.5
Plain yolk 61.1 (142) 3.560.0 (140) 6.2
Plain whole egg 60.0 (140) 3.51Based on a 5 log reduction
TABLE 29. NEW PASTEURIZATION GUIDELINES
CONCLUSIONS

I N T E R N A T I O N A L E G G P A S T E U R I Z A T I O N M A N U A L 27
Ayres, J. C. and H. M. Slosberg, 1949. Destruction ofSalmonella in egg albumen. Food Technol. 3:180-183.
Baird-Parker, A. C., M. Boothroyd and E. Jones, 1970. The effectof water activity on the heat resistance of heat sensitive and heatresistant strains of Salmonella. J. Appl. Bacteriol. 33:515-522.
Ball, H. R., Jr., M. Hamid-Samimi, P. M. Foegeding and K. R.Swartzel, 1987. Functionality and microbial stability ofultrapasteurized, aseptically-packaged refrigerated whole egg.J. Food Sci. 52:1212-1218.
Banwart, G. J. and J. C. Ayres, 1956. The effect of hightemperature storage on the content of Salmonella and thefunctional properties of dried egg white. Food Technol. 10:68-73.
Bergquist, D. H., 1961. Method of producing egg albumensolids with low bacterial count. U. S. Patent No. 2,982,663.
Board, R. G. and H. S. Tranter, 1995. In Egg Science andTechnology. Edited by William J. Stadelman and Owen J.Cotterill, Fourth Edition, pages 81-104. The Haworth Press,Inc., 10 Alice St., Binghamton, NY 13904-1580.
Bradshaw, J. G., D. B. Shah, E. Forney and J. M. Madden, 1990.Growth of Salmonella enteritidis in yolk of shell eggs from normaland seropositive hens. J. of Food Prot. 53:1033-1036.
Brooks, J. and D. J. Taylor, 1955. 1. Eggs and egg products. G. B.Dep. Sci. Ind. Res. Food Invest. Board Spec. Rep. 60.
Cassiday, P. K., L. M. Graves and B. Swaminathan, 1990. Replicaplating of colonies from Listeria selective agars to blood agar toimprove the isolation of Listeria monocytogenes from foods. Appl.Environ. Microbiol. 56:2274-2275.
Cherian, G. and J. S. Sim, 1991. Effect of feeding full-fat flax andcanola seeds to laying hens on the fatty acid composition of eggs,embryos and newly-hatched chicks. Poultry Sci. 70:917-922.
Cotterill, O. J., G. M. Amick, B. A. Kluge and V. C. Rinard,1963. Some factors affecting the performance of egg white indivinity candy. Poultry Sci. 42:218-224.
Cotterill, O. J. and G. S. Geiger, 1977. Egg product yield trendsfrom shell eggs. Poultry Sci. 56:1027-1031.
Cotterill, O. J., 1968. Equivalent pasteurization temperatures tokill Salmonella in liquid egg white at various pH levels. PoultrySci. 47:352-365.
Cotterill, O. J. and J. Glauert, 1971. Thermal resistance ofSalmonella in egg yolk containing 10% sugar or salt after storageat various temperatures. Poultry Sci. 50:109-115.
Cunningham, F. E., O. J. Cotterill and E. M. Funk, 1960. Theeffect of season and age of birds on the chemical composition ofegg white. Poultry Sci. 39:300-307.
Cunningham, F. E. and H. Lineweaver, 1965. Stabilizing of eggwhite proteins to pasteurization temperatures above 60°C. FoodTechnol. 19:1442-1446.
Cunningham, F. E. 1995. In Egg Science and Technology. Editedby William J. Stadelman and Owen J. Cotterill, Fourth Edition,pages 289-321. The Haworth Press, Inc., 10 Alice St.,Binghamton, NY 13904-1580.
Curtis, P. A., K. E. Anderson and F. T. Jones, 1995. Cryogenicgas for rapid cooling of commercially processed shell eggs beforepackaging. J. of Food Prot. 58:389-394.
Dixon, D. K. and O. J. Cotterill, 1981. Electrophoretic andchromatographic changes in egg-yolk proteins due to heat.J. of Food Sci. 46:981-983.
Duguid, J. P. and R A. E. North, 1991. Eggs and Salmonella food-poisoning: an evaluation. J. of Medical Microbiology 34:65-72.
FDA, 1971. The Egg Products Inspection Act. Federal Register36, 9814.
FDA, 2000. Irradiation in the production, processing andhandling of food. 21 CFR Part 179.
FDA, 2002a. Eggs and Egg Products. Code of Federal Regulations21:160, 180. Revised April 1, 2002.
FDA, 2002b. Egg Refrigeration Regulations. Code of FederalRegulations 21:16, 101 and 115.
FDA, 2002. Pasteurization Requirements. Code of FederalRegulations 9:590, 570.
Florian, F. L. E. and P. C. Trussel, 1957. Bacterial spoilage ofeggs. IV. Identification of spoilage organisms. Food Technol.11:56-60.
Flowers, R. S., J. Y. D’Aoust, W. H. Andrew and J. S. Bailey,1992. Salmonella. In Compendium of Methods for theMicrobiological Examination of Foods. Third Edition, pages 371-442. Edited by C. Vanderzant and D. F. Splittstoesser. AmericanPublic Health Association, Washington, D.C.
Forsythe, R. H., 1963. Chemical and physical properties of eggsand egg products. Cereal Sci. Today 8:309-312, 328.
Froning, G. W. and M. H. Swanson, 1962. Oiled vs unoiled eggsfor short storage periods. 1. The effect of time and method ofoiling. Poultry Sci. 41:1880-1886.
REFERENCES
I N T E R N A T I O N A L E G G P A S T E U R I Z A T I O N M A N U A L28
Garibaldi, J. A. and J. L. Stokes, 1958. Protective role of shellmembranes in bacterial spoilage of eggs. Food Res. 23:283-290.
Garibaldi, J. A., R. P. Straka and K. Ijichi, 1969. Heat resistance ofSalmonella in various egg products. Appl. Microbiol. 17:491-496.
Gast, R. K. and C. W. Beard, 1990. Current ARS research onSalmonella enteritidis in chicken: experimental infections inlaying hens. Dairy Food Environ. Sanit. 10:276-278.
Gast, R. K. and C. W. Beard, 1992. Detection and enumerationof Salmonella enteritidis in fresh and stored eggs laid byexperimentally infected hens. J. of Food Prot. 55:152-156.
Gast, R. K. and P. S. Holt, 2000. Influence of the level andlocation of contamination on the multiplication of Salmonellaenteritidis at different storage temperatures in experimentallyinoculated egg. Poultry Sci. 79:559-563.
Goepfert, J. M., I. K. Iskander and C. H. Amundson, 1970.Relation of the heat resistance of Salmonella to the water activityof the environment. Appl. Microbiol. 19:429-433.
Haines, R. B. and T. Moran, 1940. Porosity and bacterialinvasion through the shell of the hen’s egg. J. Hyg. 40:453-461.
Hargis, P. S., M. E. Van Elswyk and B. M. Hargis, 1991. Dietarymodification of yolk lipid with menhaden oil. Poultry Sci.70:874-883.
Heath, 1977. Chemical and related osmotic changes in eggalbumen during storage. Poultry Sci. 56:822-828.
Herald, T. J. and D. M. Smith, 1989. Functional properties andcomposition of liquid whole egg proteins as influenced bypasteurization and frozen storage. Poultry Sci. 68:1461-1469.
Hong, C., S. Hayashi and H. Yamazaki, 1995. Effects of highlevels of selenite and Escherichi coli on enrichment of Salmonellaand detection of Salmonella by polymyxin-cloth enzymeimmunoassay. Int. J. Food Microbiol. 25:119-129.
Huang, S., T. J. Herald and D. D. Mueller, 1997. Effect ofelectron beam irradiation on physical, physiochemical andfunctional properties of liquid egg yolk during frozen storage.Poultry Sci. 76:1607-1615.
Humphrey, T. J., 1990. Growth of Salmonella in intact shell eggs:influence of storage temperature. Vet. Rec. 126:292.
Humphrey, T. J., A. Whitehead, A. H. L. Gawler, A. Henley and B.Rowe, 1991. Number of Salmonella enteritidis in the contents ofnaturally contaminated hens’ eggs. Epidemiol. Infect. 106:489-496.
Humphrey, T. J., P. A. Chapman, B. Rowe and R. J. Gilbert,1990. A comparative study of the heat resistance of Salmonella inhomogenized whole egg, egg yolk or albumen. Epidemiol. Infect.104:237-241.
Humphrey, T. J., A. Baskerville, S. Mawer, B. Rowe and S.Hopper, 1989. Salmonella enteritidis phage type 4 from thecontents of intact eggs: a study involving naturally infected hens.Epidemiol. Infect. 103:415-423.
Institute of Food Technologists, 2000. Kinetics of microbialinactivation for alternative food processing technologies. J. ofFood Sci. Special Supplement Nov/Dec, pages 1-108.
Kaufman, V. F., G. W. Putman and K. Ijichi, 1968. Test methodsfor measuring minimum holding times in continuous eggpasteurizers. J. Milk and Food Technol. 31:310-314.
Kinde, H., D. H. Read, R. P. Chin, A. A. Bickford, R. L. Walker, A.Ardans, R. E. Breitmeyer, D. Willoughby, H. E. Little, D. Kerr andI. A. Gardner, 1996. Salmonella enteritidis phage type 4 infection ina commercial layer flock in Southern California: bacteriological andepidemiologic findings. Avian Dis. 40:665-671.
Kijowski, J., G. Lesnierowski, J. Zabielski, W. Fizer and T.Magnuski, 1994. In Egg Uses and Processing Technologies. Editedby J. S. Sim and S. Nakai, pages 340-348. CAB International,Wallingford, Oxon OX10 8DE UK.
LiChan, E. C. Y., W. D. Powrie and S. Nakai, 1995. In EggScience and Technology. Edited by William J. Stadelman andOwen J. Cotterill, Fourth Edition, pages 105-175. The HaworthPress Inc., 10 Alice St., Binghamton, NY 13904-1580.
Liftshitz, A., R. C. Baker and H. B. Naylor, 1964. The relativeimportance of chicken egg exterior structures in resistingbacterial penetration. J. of Food Sci. 29:94-99.
Liftshitz, A., R. C. Baker and H. B. Naylor, 1965. The exteriorstructures of the egg as nutrients for bacteria. J. of Food Sci.30:516-519.
Lineweaver, H. and F. E. Cunningham, 1966. Process forpasteurizing egg white. U.S. Patent No. 3,251,697.
Lloyd, W. E. and L. A. Harriman, 1957. Method of treating eggwhite. U.S. Patent No. 2,776,214.
Michalski, C. B., R. E. Brackett, Y. C. Hung and G. O. I. Ezeike,1999. Use of capillary tubes and plate heat exchanger to validateUSDA pasteurization protocols for elimination of Salmonellaenteritidis from liquid egg products. J. of Food Prot. 62(2):112-117.
Muriana, P. M., H. Hou and R. K. Singh, 1996. A flow-injectionsystem for studying heat inactivation of Listeria monocytogenesand Salmonella enteritidis in liquid whole egg. J. of Food Prot.59:121-126.
Muriana, P. M., 1997. Effect of pH and hydrogen peroxide onheat inactivation of Salmonella and Listeria in egg white. FoodMicrobiology 14:11-19.
Nakamura, R., T. Fukano and M. Taniguchi, 1982. Heat-induced gelation of hen’s egg yolk low density lipoprotein (LDLdispersion). J. Food Sci. 47:1449-1453.
I N T E R N A T I O N A L E G G P A S T E U R I Z A T I O N M A N U A L 29
National Canners Association, 1968. Thermal death time. InLaboratory Manual for Canners and Processors. Edited by I. I.Somers, Ch. 7, p. 166. AVI Publishing Co. Inc., Westport, CT.
Ng, H., J. A. Gardibaldi, K. Ijichi and K. L. Mihara, 1979.Pasteurization of salted whole egg inoculated with Arizona orSalmonella. Appl. Environ. Microbiol. 37:1091-1095.
Palumbo, M. S., S. M. Beers, Saumya Bhaduri and S. A. Palumbo,1995. Thermal resistance of Salmonella spp. and Listeriamonocytogenes in liquid egg yolk and egg yolk products. J. of FoodProt. 58(9):960-966.
Palumbo, M. S., S. M. Beers, S. Bhaduri and S. A. Palumbo, 1996.Thermal resistance of Listeria monocytogenes and Salmonella spp. inliquid egg white. J. of Food Prot. 59(11):1182-1186.
Romanoff, A. L. and A. J. Romanoff, 1949. The Avian Egg. Wileyand Sons, New York.
SAS Institute Incorporated, 1999. SAS On-line Doc.; version 8.Cary, NC.
Sauter, E. A. and C. F. Petersen, 1974. The effect of egg shellquality on penetration by various Salmonella. Poultry Sci.53:2159-2163.
Scalzo, A. M., R. W. Dickerson, Jr., J. T. Peeler and R. B. Read,Jr., 1970. The viscosity of egg and egg products. Food Technol.24(11):113-119.
Schlosser, W. D., D. J. Henzler, J. Mason, D. C. Kradel and S.Hurd, 1995. The Salmonella enteritidis Pilot Project and thePennsylvania Egg Quality Assurance Program Proc. U.S. Anim.Health Assoc. 98:425-430.
Schuman, J. D., B. W. Sheldon and P. M. Foegeding, 1997.Thermal resistance of Aeromonas hydropohila in liquid whole egg.J. of Food Prot. 60(3):231-236.
Schwall, D. V., F. A. Gardner and E. D. Parnell, 1961. Effects ofoil treating on shell egg quality during short-term refrigeratedstorage. Poultry Sci. 40:583-588.
Serrano, L. E., E. A. Murano, K. Shenoy and D. G. Olson, 1997.D values of Salmonella enteritidis isolates and quality attributes ofshell eggs and liquid whole eggs treated with irradiation. PoultrySci. 76:202-205.
Sharpe, K. and R. M. Bektash, 1977. Heterogeneity and themodeling of bacterial spore death: the case of continuouslydecreasing death rate. Can. J. of Microbiology 23:1501.
Stadelman, W. J., 1995. In Egg Science and Technology. Edited byWilliam J. Stadelman and Owen J. Cotterill, Fourth Edition, pages67-79. The Haworth Press Inc., 10 Alice St., Binghamton, NY13904-1580.
Stadelman, W. J. and D. E. Pratt, 1989. Factors influencingcomposition of the hen’s egg. World’s Poultry Sci. J. 45:247-266.
Statutory Instruments, 1963. The liquid egg (pasteurization)regulations 1963, No. 1503, Her Majesty’s Stationery Office,London, UK.
Stumbo, C. R., 1973. Thermobacteriology in Food Processing.New York, Academic Press.
Sumner, S. S., T. M. Sandros, M. C. Harmon, V. N. Scott and D.T. Bernard, 1991. Heat resistance of Salmonella typhimurium andListeria monocytogenes in sucrose solutions of various wateractivities. J. Food Sci. 56:1741-1743.
Swartzel, K. R., H. R. Ball, Jr. and M. H. Hamid-Samimi, 1989.Method for the ultrapasteurization of liquid whole egg. U.S.Patent No. 4,808,425.
USDA, 1998. Advanced notice of proposed rule-making:Salmonella enteritidis in eggs. Fed. Reg. 63:27502-27511.
USDA, 1969. Egg Pasteurization Manual. ARS 74-48, USDA,Albany, CA.
USDA, 1980. Regulations governing inspection of egg products.7 CFR, Part 2859. Effective May 8, 1980.
USDA, ARS, 2000. Nutritive Content of Egg Products.
Wang, C. and L. A. Shelef, 1991. Factors contributing toantilisterial effects of raw egg albumen. J. Food Sci. 56:1251-1254.
Watkins, B. A., 1991. Importance of essential fatty acids andtheir derivatives in poultry. J. Nutrition 121:1475-1485.
Wedral, E. M., D. V. Vadehra and R. C. Baker, 1971.Mechanism of bacterial penetration through the eggs of Gallusgallus. J. Food Sci. 36:520-522.
Wesley, R. L. and W. L. Beane, 1967. The effect of various washwater and internal egg temperatures on the number of thermalchecks of oiled and unoiled eggs. Poultry Sci. 46:1336.
Wong, Y. C., T. J. Herald and K. A. Hachmeister, 1996.Comparison between irradiated and thermally pasteurized liquidegg white on functional, physical and microbiological properties.Poultry Sci. 75:803-808.
Woodward, S. A. and O. J. Cotterill, 1983. Electrophoresis andchromatography of heat-treated plain, sugared and salted wholeegg. J. of Food Sci. 48:501-506.
Yang, Sheng-Chin and R. E. Baldwin, 1995. In Egg Science andTechnology. Edited by William J. Stadelman and Owen J.Cotterill, Fourth Edition, pages 405-463. The Haworth PressInc., 10 Alice St., Binghamton, NY 13904-1580.

I N T E R N A T I O N A L E G G P A S T E U R I Z A T I O N M A N U A L 31
APPENDIX A: FIGURES
54.4o
C
0 10 20 30 40 50
1e+6
1e+7
1e+8
1e+9
1e+10
All curves:Coefficients:b[0] = 9.59b[1] = -0.08r ? = 0.96
55.5o
C
0 5 10 15 20 25 30
1e+5
1e+6
1e+7
1e+8
1e+9
1e+10
All curves:Coefficients:b[0] = 9.65b[1] = -0.17r ? = 0.98
56.7o
C
0 2 4 6 8 10 12 14
1e+4
1e+5
1e+6
1e+7
1e+8
1e+9
1e+10
1e+11
All curves:Coefficients:b[0] = 9.75b[1] = -0.41r ? = 0.98
57.7o
C
0 2 4 6 8 10
1e+2
1e+3
1e+4
1e+5
1e+6
1e+7
1e+8
1e+9
1e+10
1e+11
All curves:Coefficients:b[0] = 9.85b[1] = -0.82r ? = 0.97
F IGURE 1. REDUCTION OF SALMONELLA IN L IQUID EGG WHITE AT pH 7.8 AT VARIOUS TEMPERATURES, SHOWING L INEARREGRESSION WIH 95% CONFIDENCE INTERVALS (3 REPS/GRAPH, Y = MICROBIAL LOAD, X = T IME IN MINUTES)
r 2 r 2
r 2r 2
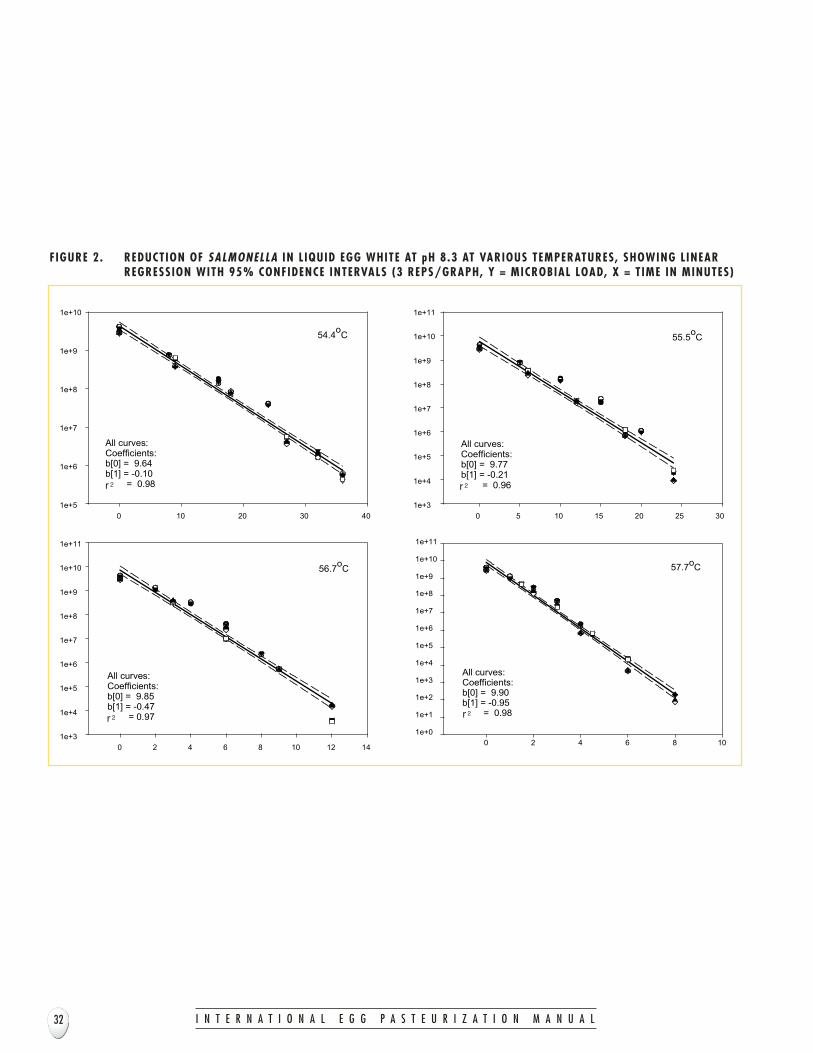
54.4o
C
0 10 20 30 40
1e+5
1e+6
1e+7
1e+8
1e+9
1e+10
All curves:Coefficients:b[0] = 9.64b[1] = -0.10r ? = 0.98
55.5oC
0 5 10 15 20 25 30
1e+3
1e+4
1e+5
1e+6
1e+7
1e+8
1e+9
1e+10
1e+11
All curves:Coefficients:b[0] = 9.77b[1] = -0.21r ? = 0.96
56.7oC
0 2 4 6 8 10 12 14
1e+3
1e+4
1e+5
1e+6
1e+7
1e+8
1e+9
1e+10
1e+11
All curves:Coefficients:b[0] = 9.85b[1] = -0.47r ? = 0.97
57.7oC
0 2 4 6 8 10
1e+0
1e+1
1e+2
1e+3
1e+4
1e+5
1e+6
1e+7
1e+8
1e+9
1e+10
1e+11
All curves:Coefficients:b[0] = 9.90b[1] = -0.95r ? = 0.98
F IGURE 2. REDUCTION OF SALMONELLA IN L IQUID EGG WHITE AT pH 8.3 AT VARIOUS TEMPERATURES, SHOWING L INEARREGRESSION WITH 95% CONFIDENCE INTERVALS (3 REPS/GRAPH, Y = MICROBIAL LOAD, X = T IME IN MINUTES)
I N T E R N A T I O N A L E G G P A S T E U R I Z A T I O N M A N U A L32
r 2 r 2
r 2r 2

I N T E R N A T I O N A L E G G P A S T E U R I Z A T I O N M A N U A L 33
54.4oC
0 5 10 15 20 25 30
1e+5
1e+6
1e+7
1e+8
1e+9
1e+10
All curves:Coefficients:b[0] = 9.38b[1] = -0.15r ? = 0.93
55.5o
C
0 5 10 15 20 25
1e+3
1e+4
1e+5
1e+6
1e+7
1e+8
1e+9
1e+10
1e+11
All curves:Coefficients:b[0] = 9.43b[1] = -0.23r ? = 0.92
56.7oC
0 2 4 6 8 10 12 14
1e+2
1e+3
1e+4
1e+5
1e+6
1e+7
1e+8
1e+9
1e+10
1e+11
All curves:Coefficients:b[0] = 9.57b[1] = -0.50r ? = 0.97
57.7o
C
0 1 2 3 4 5 6 7
1e+2
1e+3
1e+4
1e+5
1e+6
1e+7
1e+8
1e+9
1e+10
1e+11
All curves:Coefficients:b[0] = 9.57b[1] = -0.94r ? = 0.96
F IGURE 3. REDUCTION OF SALMONELLA IN L IQUID EGG WHITE AT pH 8.8 AT VARIOUS TEMPERATURES, SHOWING L INEARREGRESSION WITH 95% CONFIDENCE INTERVALS (3 REPS/GRAPH, Y = MICROBIAL LOAD, X = T IME IN MINUTES)
r 2 r 2
r 2r 2

54.4o
C
0 2 4 6 8 10 12 14 16 18
1e+3
1e+4
1e+5
1e+6
1e+7
1e+8
1e+9
1e+10
All curves:Coefficients:b[0] = 9.34b[1] = -0.33r ? = 0.99
55.5o
C
0 2 4 6 8 10 12 14
1e+1
1e+2
1e+3
1e+4
1e+5
1e+6
1e+7
1e+8
1e+9
1e+10
All curves:Coefficients:b[0] = 9.45b[1] = -0.59r ? = 0.99
56.7oC
0 2 4 6 8
1e-2
1e-1
1e+0
1e+1
1e+2
1e+3
1e+4
1e+5
1e+6
1e+7
1e+8
1e+9
1e+10
1e+11
All curves:Coefficients:b[0] = 9.18b[1] = -1.08r ? = 0.98
57.7o
C
0 1 2 3 4
1e-2
1e-1
1e+0
1e+1
1e+2
1e+3
1e+4
1e+5
1e+6
1e+7
1e+8
1e+9
1e+10
1e+11
All curves:Coefficients:b[0] = 9.94b[1] = -2.34r ? = 0.97
F IGURE 4. REDUCTION OF SALMONELLA IN L IQUID EGG WHITE AT pH 9.3 AT VARIOUS TEMPERATURES, SHOWING L INEARREGRESSION WITH 95% CONFIDENCE INTERVALS (3 REPS/GRAPH, Y = MICROBIAL LOAD, X = T IME IN MINUTES)
I N T E R N A T I O N A L E G G P A S T E U R I Z A T I O N M A N U A L34
r 2 r 2
r 2r 2
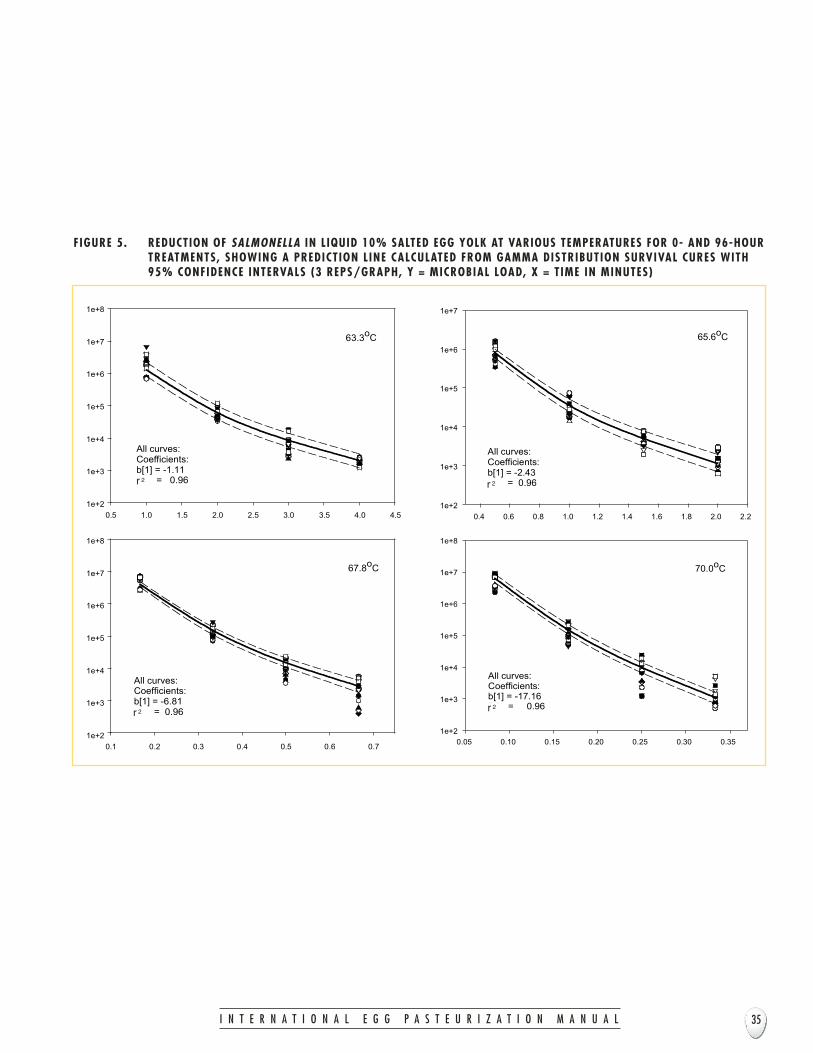
I N T E R N A T I O N A L E G G P A S T E U R I Z A T I O N M A N U A L 35
63.3oC
0.5 1.0 1.5 2.0 2.5 3.0 3.5 4.0 4.5
1e+2
1e+3
1e+4
1e+5
1e+6
1e+7
1e+8
All curves:Coefficients:b[1] = -1.11R? = 0.96
65.6oC
0.4 0.6 0.8 1.0 1.2 1.4 1.6 1.8 2.0 2.2
1e+2
1e+3
1e+4
1e+5
1e+6
1e+7
All curves:Coefficients:b[1] = -2.43R? = 0.96
67.8oC
0.1 0.2 0.3 0.4 0.5 0.6 0.7
1e+2
1e+3
1e+4
1e+5
1e+6
1e+7
1e+8
All curves:Coefficients:b[1] = -6.81R? = 0.96
70.0oC
0.05 0.10 0.15 0.20 0.25 0.30 0.35
1e+2
1e+3
1e+4
1e+5
1e+6
1e+7
1e+8
All curves:Coefficients:b[1] = -17.16R? = 0.96
F IGURE 5. REDUCTION OF SALMONELLA IN L IQUID 10% SALTED EGG YOLK AT VARIOUS TEMPERATURES FOR 0- AND 96-HOURTREATMENTS, SHOWING A PREDICTION L INE CALCULATED FROM GAMMA DISTRIBUTION SURVIVAL CURES WITH95% CONFIDENCE INTERVALS (3 REPS/GRAPH, Y = MICROBIAL LOAD, X = T IME IN MINUTES)
r 2 r 2
r 2r 2

I N T E R N A T I O N A L E G G P A S T E U R I Z A T I O N M A N U A L36
61.1oC
1 2 3 4 5 6 7 8 9
1e+3
1e+4
1e+5
1e+6
1e+7
All curves:Coefficients:b[1] = -0.47R? = 0.92
63.3oC
0.5 1.0 1.5 2.0 2.5 3.0 3.5 4.0 4.5
1e+2
1e+3
1e+4
1e+5
1e+6
1e+7
All curves:Coefficients:b[1] = -0.88R? = 0.92
65.6oC
0.2 0.4 0.6 0.8 1.0
1e+2
1e+3
1e+4
1e+5
1e+6
1e+7
All curves:Coefficients:b[1] = -3.47R? = 0.92
67.8oC
0.1 0.2 0.3 0.4 0.5
1e+1
1e+2
1e+3
1e+4
1e+5
1e+6
1e+7
1e+8
All curves:Coefficients:b[1] = -9.41R? = 0.92
F IGURE 6. REDUCTION OF SALMONELLA IN L IQUID 10% SALTED WHOLE EGG AT VARIOUS TEMPERATURES FOR 0 HOURS,SHOWING A PREDICTION L INE CALCULATED FROM GAMMA DISTRIBUTION SURVIVAL CURES WITH 95%CONFIDENCE INTERVALS (3 REPS/GRAPH, Y = MICROBIAL LOAD, X = T IME IN MINUTES)
r 2
r 2 r 2
r 2
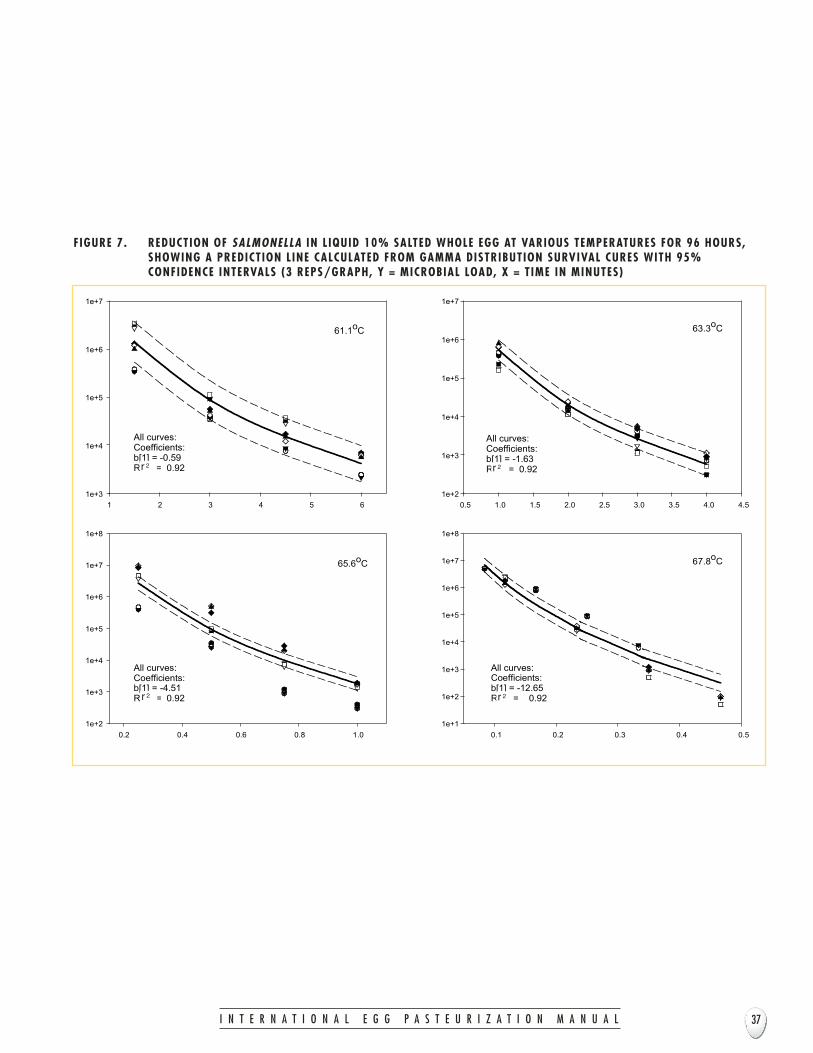
I N T E R N A T I O N A L E G G P A S T E U R I Z A T I O N M A N U A L 37
61.1oC
1 2 3 4 5 6
1e+3
1e+4
1e+5
1e+6
1e+7
All curves:Coefficients:b[1] = -0.59R? = 0.92
63.3oC
0.5 1.0 1.5 2.0 2.5 3.0 3.5 4.0 4.5
1e+2
1e+3
1e+4
1e+5
1e+6
1e+7
All curves:Coefficients:b[1] = -1.63R? = 0.92
65.6oC
0.2 0.4 0.6 0.8 1.0
1e+2
1e+3
1e+4
1e+5
1e+6
1e+7
1e+8
All curves:Coefficients:b[1] = -4.51R? = 0.92
67.8oC
0.1 0.2 0.3 0.4 0.5
1e+1
1e+2
1e+3
1e+4
1e+5
1e+6
1e+7
1e+8
All curves:Coefficients:b[1] = -12.65R? = 0.92
F IGURE 7. REDUCTION OF SALMONELLA IN L IQUID 10% SALTED WHOLE EGG AT VARIOUS TEMPERATURES FOR 96 HOURS,SHOWING A PREDICTION L INE CALCULATED FROM GAMMA DISTRIBUTION SURVIVAL CURES WITH 95%CONFIDENCE INTERVALS (3 REPS/GRAPH, Y = MICROBIAL LOAD, X = T IME IN MINUTES)
r 2 r 2
r 2r 2

I N T E R N A T I O N A L E G G P A S T E U R I Z A T I O N M A N U A L38
61.1oC
0.0 2.0 4.0 6.0 8.0
1e-1
1e+0
1e+1
1e+2
1e+3
1e+4
1e+5
1e+6
1e+7
1e+8
1e+9
1e+10
1e+11
All curves:Coefficients:b[0] = 9.38b[1] = -1.20r ? = 0.95
63.3o
C
0.0 0.5 1.0 1.5 2.0 2.5
1e-1
1e+0
1e+1
1e+2
1e+3
1e+4
1e+5
1e+6
1e+7
1e+8
1e+9
1e+10
1e+11
All curves:Coefficients:b[0] = 9.52b[1] = -3.91r ? = 0.96
65.6oC
0.0 0.2 0.4 0.6 0.8 1.0
1e-1
1e+0
1e+1
1e+2
1e+3
1e+4
1e+5
1e+6
1e+7
1e+8
1e+9
1e+10
1e+11
All curves:Coefficients:b[0] = 8.83b[1] = -8.28r ? = 0.94
67.8o
C
0.0 0.1 0.2 0.3
1e-1
1e+0
1e+1
1e+2
1e+3
1e+4
1e+5
1e+6
1e+7
1e+8
1e+9
1e+10
1e+11
All curves:Coefficients:b[0] = 9.31b[1] = -21.48r ? = 0.98
F IGURE 8. REDUCTION OF SALMONELLA IN L IQUID 10% SUGARED EGG YOLK AT VARIOUS TEMPERATURES FOR 0 HOURS,SHOWING A L INEAR REGRESSION WITH 95% CONFIDENCE INTERVALS (3 REPS/GRAPH, Y = MICROBIAL LOAD, X = T IME IN MINUTES)
r 2 r 2
r 2r 2

I N T E R N A T I O N A L E G G P A S T E U R I Z A T I O N M A N U A L 39
61.1oC
0 1 2 3 41e+1
1e+2
1e+3
1e+4
1e+5
1e+6
1e+7
1e+8
1e+9
1e+10
All curves:Coefficients:b[0] = 9.16b[1] = -1.82r ? = 0.99
63.3o
C
0.0 0.2 0.4 0.6 0.8 1.0 1.2 1.4 1.61e+0
1e+1
1e+2
1e+3
1e+4
1e+5
1e+6
1e+7
1e+8
1e+9
1e+10
All curves:Coefficients:b[0] = 9.14b[1] = -5.21r ? = 0.97
65.6o
C
0.0 0.2 0.4 0.6 0.81e-1
1e+0
1e+1
1e+2
1e+3
1e+4
1e+5
1e+6
1e+7
1e+8
1e+9
1e+10
All curves:Coefficients:b[0] = 8.73b[1] = -11.25r ? = 0.91
67.8o
C
0.0 0.1 0.2 0.31e-1
1e+0
1e+1
1e+2
1e+3
1e+4
1e+5
1e+6
1e+7
1e+8
1e+9
1e+10
1e+11
All curves:Coefficients:b[0] = 9.25b[1] = -23.60r ? = 0.94
FIGURE 9. REDUCTION OF SALMONELLA IN LIQUID 10% SUGARED EGG YOLK AT VARIOUS TEMPERATURES FOR 96 HOURS,SHOWING A LINEAR REGRESSION WITH 95% CONFIDENCE INTERVALS (3 REPS/GRAPH, Y = MICROBIAL LOAD, X = TIME IN MINUTES)
r 2 r 2
r 2r 2

I N T E R N A T I O N A L E G G P A S T E U R I Z A T I O N M A N U A L40
60.0oC
0 1 2 3 4 5 6 7
1e+1
1e+2
1e+3
1e+4
1e+5
1e+6
1e+7
1e+8
1e+9
1e+10
1e+11
All curves:Coefficients:b[0] = 9.86b[1] = -1.25r ? = 0.99
62.2oC
0.0 0.5 1.0 1.5 2.0
1e+1
1e+2
1e+3
1e+4
1e+5
1e+6
1e+7
1e+8
1e+9
1e+10
1e+11
All curves:Coefficients:b[0] = 9.76b[1] = -4.01r ? = 0.99
64.4oC
0.0 0.2 0.4 0.6
1e+1
1e+2
1e+3
1e+4
1e+5
1e+6
1e+7
1e+8
1e+9
1e+10
1e+11
All curves:Coefficients:b[0] = 9.97b[1] = -12.35r ? = 0.98
66.7oC
0.00 0.05 0.10 0.15 0.20 0.25 0.30 0.35
1e+0
1e+1
1e+2
1e+3
1e+4
1e+5
1e+6
1e+7
1e+8
1e+9
1e+10
1e+11
All curves:Coefficients:b[0] = 10.05b[1] = -26.80r ? = 0.97
F IGURE 10. REDUCTION OF SALMONELLA IN LIQUID 10% SUGARED WHOLE EGG AT VARIOUS TEMPERATURES FOR 0 HOURS,SHOWING A LINEAR REGRESSION WITH 95% CONFIDENCE INTERVALS (3 REPS/GRAPH, Y = MICROBIAL LOAD, X = TIME IN MINUTES)
r 2 r 2
r 2r 2

I N T E R N A T I O N A L E G G P A S T E U R I Z A T I O N M A N U A L 41
57.8oC
0 2 4 6 8
1e+1
1e+2
1e+3
1e+4
1e+5
1e+6
1e+7
1e+8
1e+9
1e+10
1e+11
All curves:Coefficients:b[0] = 9.56b[1] = -0.88r ? = 0.98
60.0oC
0 1 2 3 4
1e+1
1e+2
1e+3
1e+4
1e+5
1e+6
1e+7
1e+8
1e+9
1e+10
1e+11
All curves:Coefficients:b[0] = 9.52b[1] = -1.81r ? = 0.99
62.2oC
0.0 0.2 0.4 0.6 0.8 1.0 1.2 1.4
1e+1
1e+2
1e+3
1e+4
1e+5
1e+6
1e+7
1e+8
1e+9
1e+10
1e+11
All curves:Coefficients:b[0] = 9.56b[1] = -5.60r ? = 0.99
64.4oC
0.0 0.1 0.2 0.3 0.4 0.5
1e+1
1e+2
1e+3
1e+4
1e+5
1e+6
1e+7
1e+8
1e+9
1e+10
1e+11
All curves:Coefficients:b[0] = 9.69b[1] = -16.09r ? = 0.97
F IGURE 11. REDUCTION OF SALMONELLA IN LIQUID 10% SUGARED WHOLE EGG AT VARIOUS TEMPERATURES FOR 96 HOURS,SHOWING A LINEAR REGRESSION WITH 95% CONFIDENCE INTERVALS (3 REPS/GRAPH, Y = MICROBIAL LOAD, X = TIME IN MINUTES)
r 2 r 2
r 2r 2

60.0o
C
0 1 2 3 4 5 6
1e+1
1e+2
1e+3
1e+4
1e+5
1e+6
1e+7
1e+8
1e+9
1e+10
1e+11
All curves:Coefficients:b[0] = 9.70b[1] = -1.32r ? = 0.98
62.2o
C
0.0 0.5 1.0 1.5 2.0
1e+0
1e+1
1e+2
1e+3
1e+4
1e+5
1e+6
1e+7
1e+8
1e+9
1e+10
1e+11
All curves:Coefficients:b[0] = 9.60b[1] = -4.01r ? = 0.98
62.2o
C
0.0 0.5 1.0 1.5 2.0
1e+0
1e+1
1e+2
1e+3
1e+4
1e+5
1e+6
1e+7
1e+8
1e+9
1e+10
1e+11
All curves:Coefficients:b[0] = 9.60b[1] = -4.01r ? = 0.98
66.7o
C
0.0 0.2 0.4 0.6
1e-1
1e+0
1e+1
1e+2
1e+3
1e+4
1e+5
1e+6
1e+7
1e+8
1e+9
1e+10
1e+11
All curves:Coefficients:b[0] = 9.22b[1] = -12.84r ? = 0.99
F IGURE 12. REDUCTION OF SALMONELLA IN LIQUID USDA SCRAMBLED EGG MIX (#1) AT VARIOUS TEMPERATURES, SHOWING ALINEAR REGRESSION WITH 95% CONFIDENCE INTERVALS (3 REPS/GRAPH, Y = MICROBIAL LOAD, X = TIME IN MINUTES)
I N T E R N A T I O N A L E G G P A S T E U R I Z A T I O N M A N U A L42
r 2 r 2
r 2r 2
64.4°C
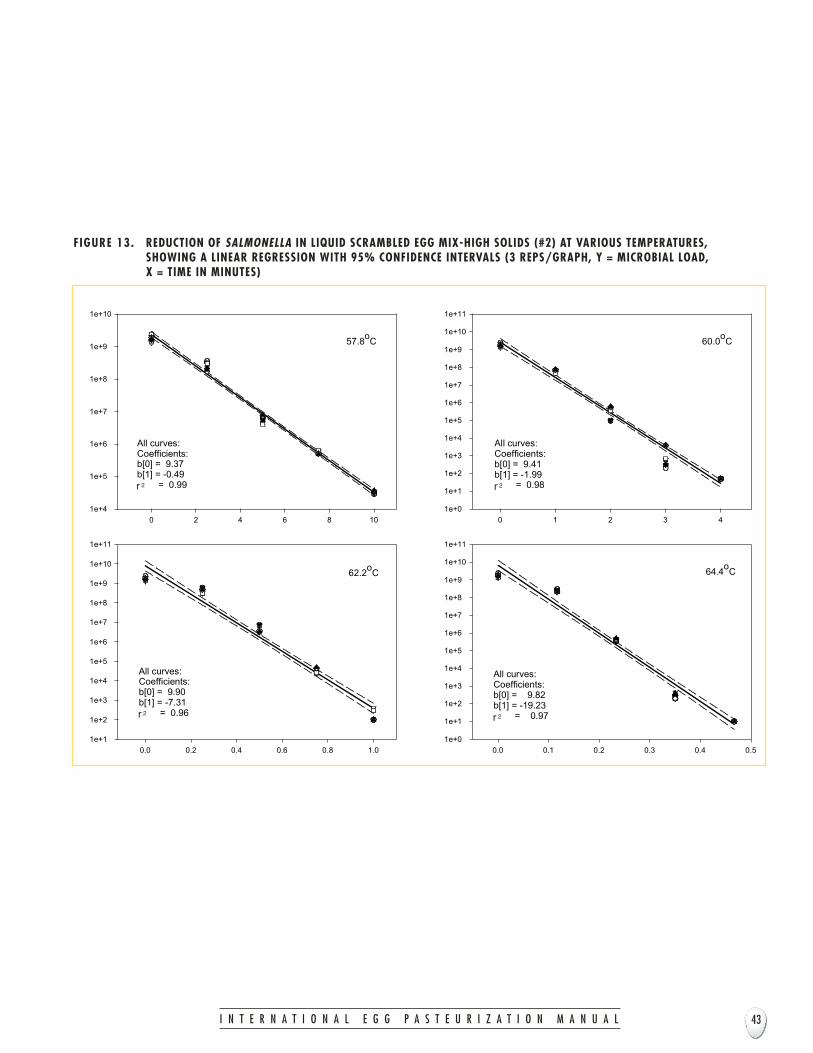
I N T E R N A T I O N A L E G G P A S T E U R I Z A T I O N M A N U A L 43
57.8o
C
0 2 4 6 8 10
1e+4
1e+5
1e+6
1e+7
1e+8
1e+9
1e+10
All curves:Coefficients:b[0] = 9.37b[1] = -0.49r ? = 0.99
60.0o
C
0 1 2 3 4
1e+0
1e+1
1e+2
1e+3
1e+4
1e+5
1e+6
1e+7
1e+8
1e+9
1e+10
1e+11
All curves:Coefficients:b[0] = 9.41b[1] = -1.99r ? = 0.98
62.2o
C
0.0 0.2 0.4 0.6 0.8 1.0
1e+1
1e+2
1e+3
1e+4
1e+5
1e+6
1e+7
1e+8
1e+9
1e+10
1e+11
All curves:Coefficients:b[0] = 9.90b[1] = -7.31r ? = 0.96
64.4o
C
0.0 0.1 0.2 0.3 0.4 0.5
1e+0
1e+1
1e+2
1e+3
1e+4
1e+5
1e+6
1e+7
1e+8
1e+9
1e+10
1e+11
All curves:Coefficients:b[0] = 9.82b[1] = -19.23r ? = 0.97
F IGURE 13. REDUCTION OF SALMONELLA IN LIQUID SCRAMBLED EGG MIX-HIGH SOLIDS (#2) AT VARIOUS TEMPERATURES, SHOWING A LINEAR REGRESSION WITH 95% CONFIDENCE INTERVALS (3 REPS/GRAPH, Y = MICROBIAL LOAD, X = TIME IN MINUTES)
r 2 r 2
r 2r 2
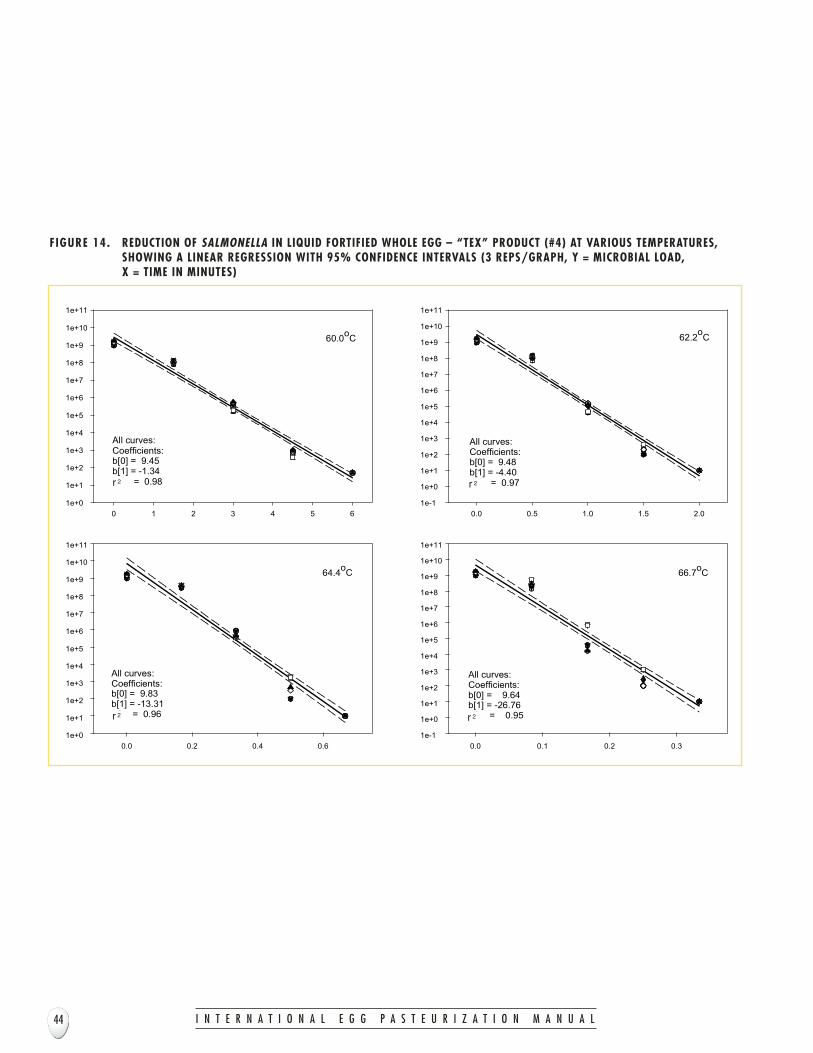
60.0o
C
0 1 2 3 4 5 61e+0
1e+1
1e+2
1e+3
1e+4
1e+5
1e+6
1e+7
1e+8
1e+9
1e+10
1e+11
All curves:Coefficients:b[0] = 9.45b[1] = -1.34r ? = 0.98
62.2o
C
0.0 0.5 1.0 1.5 2.01e-1
1e+0
1e+1
1e+2
1e+3
1e+4
1e+5
1e+6
1e+7
1e+8
1e+9
1e+10
1e+11
All curves:Coefficients:b[0] = 9.48b[1] = -4.40r ? = 0.97
64.4o
C
0.0 0.2 0.4 0.6
1e+0
1e+1
1e+2
1e+3
1e+4
1e+5
1e+6
1e+7
1e+8
1e+9
1e+10
1e+11
All curves:Coefficients:b[0] = 9.83b[1] = -13.31r ? = 0.96
66.7oC
0.0 0.1 0.2 0.3
1e-1
1e+0
1e+1
1e+2
1e+3
1e+4
1e+5
1e+6
1e+7
1e+8
1e+9
1e+10
1e+11
All curves:Coefficients:b[0] = 9.64b[1] = -26.76r ? = 0.95
F IGURE 14. REDUCTION OF SALMONELLA IN LIQUID FORTIFIED WHOLE EGG – “TEX” PRODUCT (#4) AT VARIOUS TEMPERATURES,SHOWING A LINEAR REGRESSION WITH 95% CONFIDENCE INTERVALS (3 REPS/GRAPH, Y = MICROBIAL LOAD, X = TIME IN MINUTES)
I N T E R N A T I O N A L E G G P A S T E U R I Z A T I O N M A N U A L44
r 2 r 2
r 2r 2

I N T E R N A T I O N A L E G G P A S T E U R I Z A T I O N M A N U A L 45
61.1o
C
0 2 4 6 8 10
1e+4
1e+5
1e+6
1e+7
1e+8
1e+9
1e+10
All curves:Coefficients:b[0] = 9.03b[1] = -0.45r ? = 0.98
63.3o
C
0 1 2 3 4
1e+2
1e+3
1e+4
1e+5
1e+6
1e+7
1e+8
1e+9
1e+10
All curves:Coefficients:b[0] = 8.94b[1] = -1.43r ? = 0.98
65.6oC
0.0 0.2 0.4 0.6 0.8 1.0
1e+3
1e+4
1e+5
1e+6
1e+7
1e+8
1e+9
1e+10
All curves:Coefficients:b[0] = 9.26b[1] = -5.42r ? = 0.99
67.8o
C
0.0 0.1 0.2 0.3 0.4
1e+3
1e+4
1e+5
1e+6
1e+7
1e+8
1e+9
1e+10
All curves:Coefficients:b[0] = 9.33b[1] = -14.03r ? = 0.99
F IGURE 15. REDUCTION OF SALMONELLA IN LIQUID FORTIFIED EGG YOLK – ”TEX” PRODUCT (#6) AT VARIOUS TEMPERATURES,SHOWING A LINEAR REGRESSION WITH 95% CONFIDENCE INTERVALS (3 REPS/GRAPH, Y = MICROBIAL LOAD, X = TIME IN MINUTES)
r 2 r 2
r 2r 2
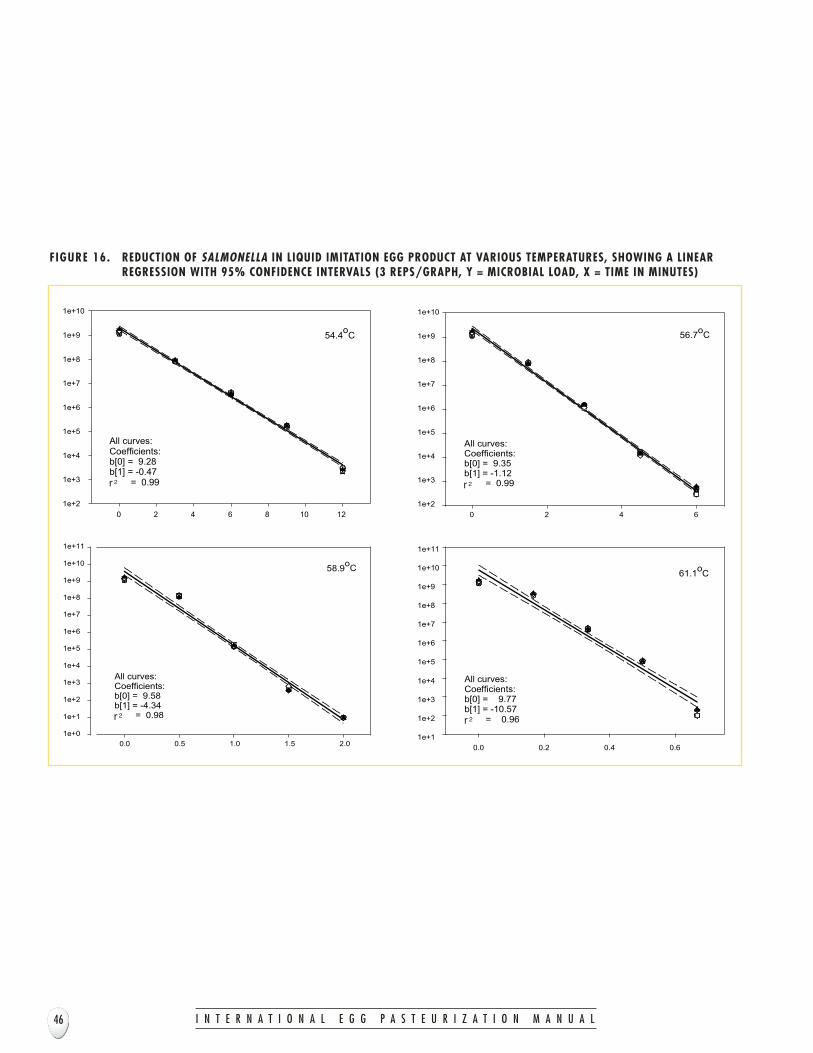
54.4o
C
0 2 4 6 8 10 121e+2
1e+3
1e+4
1e+5
1e+6
1e+7
1e+8
1e+9
1e+10
All curves:Coefficients:b[0] = 9.28b[1] = -0.47r ? = 0.99
56.7oC
0 2 4 6
1e+2
1e+3
1e+4
1e+5
1e+6
1e+7
1e+8
1e+9
1e+10
All curves:Coefficients:b[0] = 9.35b[1] = -1.12r ? = 0.99
58.9oC
0.0 0.5 1.0 1.5 2.0
1e+0
1e+1
1e+2
1e+3
1e+4
1e+5
1e+6
1e+7
1e+8
1e+9
1e+10
1e+11
All curves:Coefficients:b[0] = 9.58b[1] = -4.34r ? = 0.98
61.1oC
0.0 0.2 0.4 0.6
1e+1
1e+2
1e+3
1e+4
1e+5
1e+6
1e+7
1e+8
1e+9
1e+10
1e+11
All curves:Coefficients:b[0] = 9.77b[1] = -10.57r ? = 0.96
F IGURE 16. REDUCTION OF SALMONELLA IN LIQUID IMITATION EGG PRODUCT AT VARIOUS TEMPERATURES, SHOWING A LINEARREGRESSION WITH 95% CONFIDENCE INTERVALS (3 REPS/GRAPH, Y = MICROBIAL LOAD, X = TIME IN MINUTES)
I N T E R N A T I O N A L E G G P A S T E U R I Z A T I O N M A N U A L46
r 2 r 2
r 2r 2

I N T E R N A T I O N A L E G G P A S T E U R I Z A T I O N M A N U A L 47
1
10
100
55 56 57 58 59 60
TemperatureoC
pH = 7.8
pH = 8.2
pH = 8.8
pH = 9.3
ImitationEgg Product
F IGURE 17. T IMES AND TEMPERATURES REQUIRED TO ACHIEVE A 5 LOG10 REDUCTION OF SALMONELLA POPULATIONS FROM AN INIT IAL POPULATION OF APPROXIMATELY 9.3 LOG10 FOR L IQUID EGG WHITE AT VARIOUS pHs ANDLIQUID IMITATION EGG PRODUCT
Tim
e (m
inut
es)
pH = 7.8 Liquid Egg White
pH = 8.2 Liquid Egg White
pH = 8.8 Liquid Egg White
pH = 9.3 Liquid Egg White
Liquid Imitation Egg Product
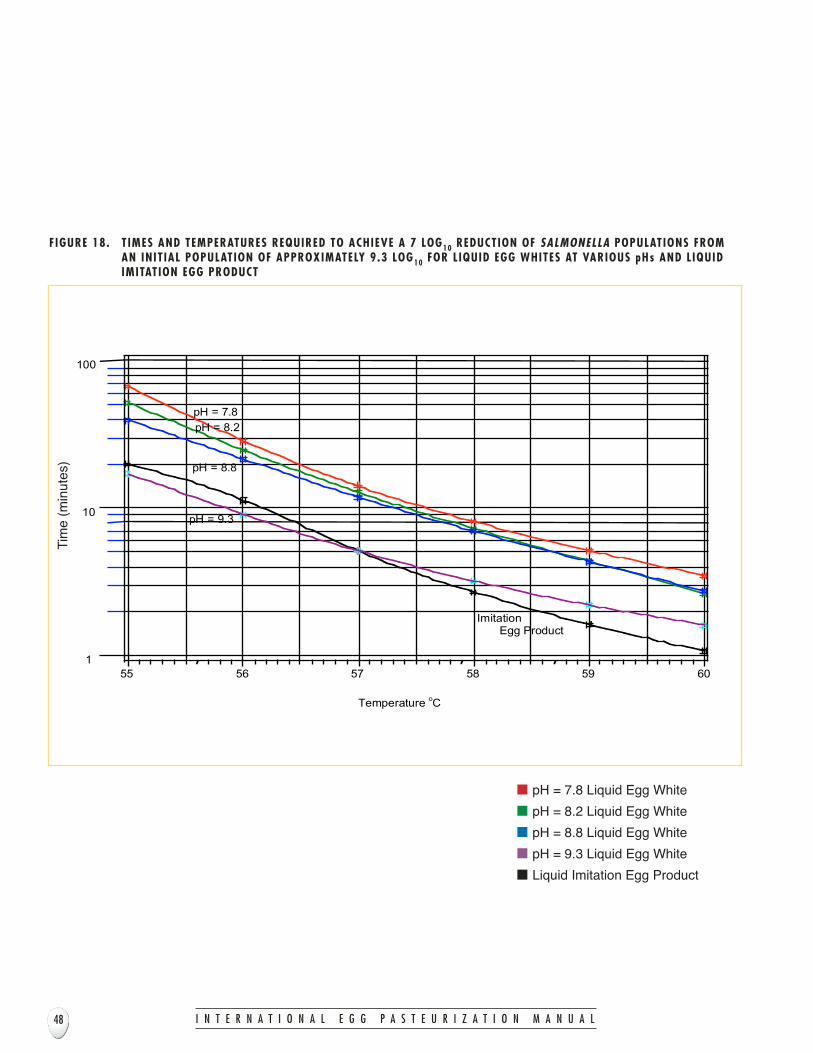
I N T E R N A T I O N A L E G G P A S T E U R I Z A T I O N M A N U A L48
1
10
100
55 56 57 58 59 60
TemperatureoC
pH = 7.8
pH = 8.2
pH = 8.8
pH = 9.3
Imitation Egg Product
F IGURE 18. T IMES AND TEMPERATURES REQUIRED TO ACHIEVE A 7 LOG10 REDUCTION OF SALMONELLA POPULATIONS FROMAN INIT IAL POPULATION OF APPROXIMATELY 9.3 LOG10 FOR L IQUID EGG WHITES AT VARIOUS pHs AND L IQUIDIMITATION EGG PRODUCT
Tim
e (m
inut
es)
pH = 7.8 Liquid Egg White
pH = 8.2 Liquid Egg White
pH = 8.8 Liquid Egg White
pH = 9.3 Liquid Egg White
Liquid Imitation Egg Product

I N T E R N A T I O N A L E G G P A S T E U R I Z A T I O N M A N U A L 49
.1
1
10
62 63 64 65 66 67 68
Temperature oC
F IGURE 19. T IMES AND TEMPERATURES REQUIRED TO ACHIEVE A 5 LOG10 REDUCTION OF SALMONELLA POPULATIONS FROMAN INIT IAL POPULATION OF APPROXIMATELY 9.3 LOG10 FOR L IQUID SALTED YOLK AND L IQUID SALTED WHOLEEGG AT HOLDING T IMES OF 0 AND 96 HOURS
Tim
e (m
inut
es)
0 and 96 Hours Liquid Salted Egg Yolk
0 Hours Liquid Salted Whole Eggs
96 Hours Liquid Salted Whole Eggs
Salted Whole Egg
Salted Yolk
0 and 96 hrs
0 hrs
96 hrs

I N T E R N A T I O N A L E G G P A S T E U R I Z A T I O N M A N U A L50
.1
1
10
62 63 64 65 66 67 68
Temperature oC
F IGURE 20. T IMES AND TEMPERATURES REQUIRED TO ACHIEVE A 7 LOG10 REDUCTION OF SALMONELLA POPULATIONS FROMAN INIT IAL POPULATION OF APPROXIMATELY 9.3 LOG10 FOR L IQUID SALTED EGG YOLK AND L IQUID SALTEDWHOLE EGG AT HOLDING T IMES OF 0 AND 96 HOURS
Tim
e (m
inut
es)
0 and 96 Hours Liquid Salted Egg Yolk
0 Hours Liquid Salted Whole Eggs
96 Hours Liquid Salted Whole Eggs
Salted Whole Egg
Salted Yolk
0 and 96 hrs
0 hrs
96 hrs
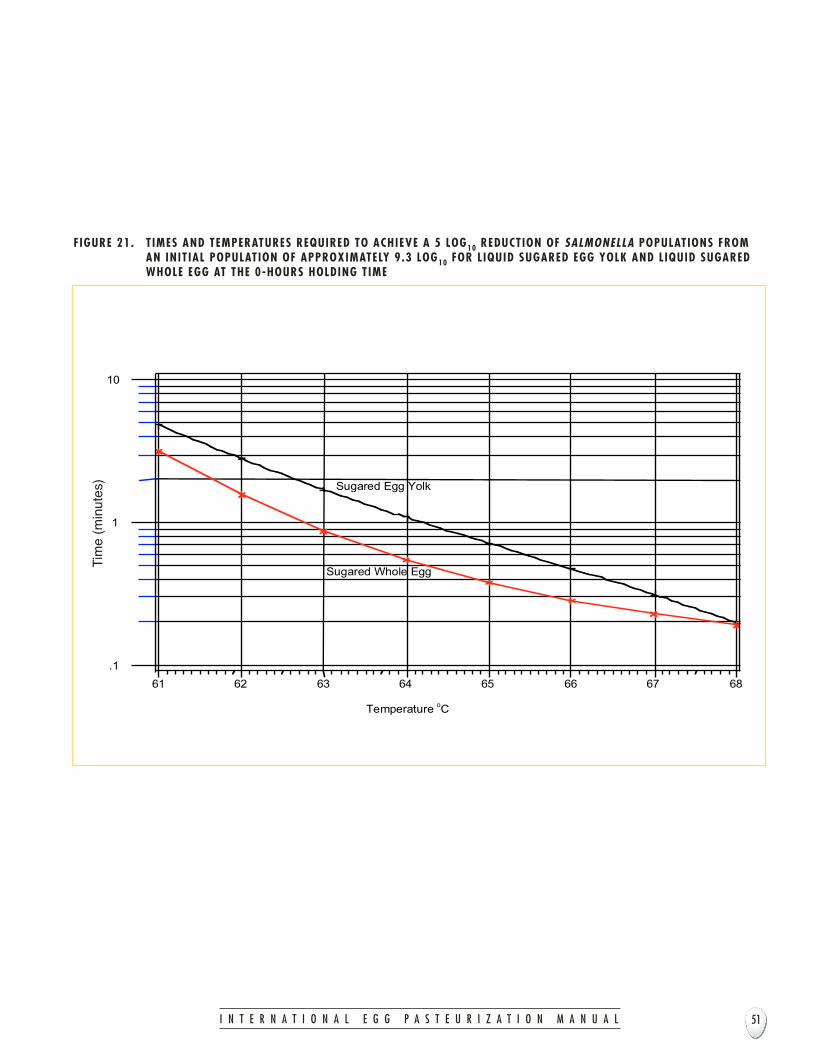
I N T E R N A T I O N A L E G G P A S T E U R I Z A T I O N M A N U A L 51
.1
1
10
61 62 63 64 65 66 67 68
Sugared Egg Yolk
Sugared Whole Egg
TemperatureoC
F IGURE 21. T IMES AND TEMPERATURES REQUIRED TO ACHIEVE A 5 LOG10 REDUCTION OF SALMONELLA POPULATIONS FROMAN INIT IAL POPULATION OF APPROXIMATELY 9.3 LOG10 FOR L IQUID SUGARED EGG YOLK AND L IQUID SUGAREDWHOLE EGG AT THE 0-HOURS HOLDING TIME
Tim
e (m
inut
es)
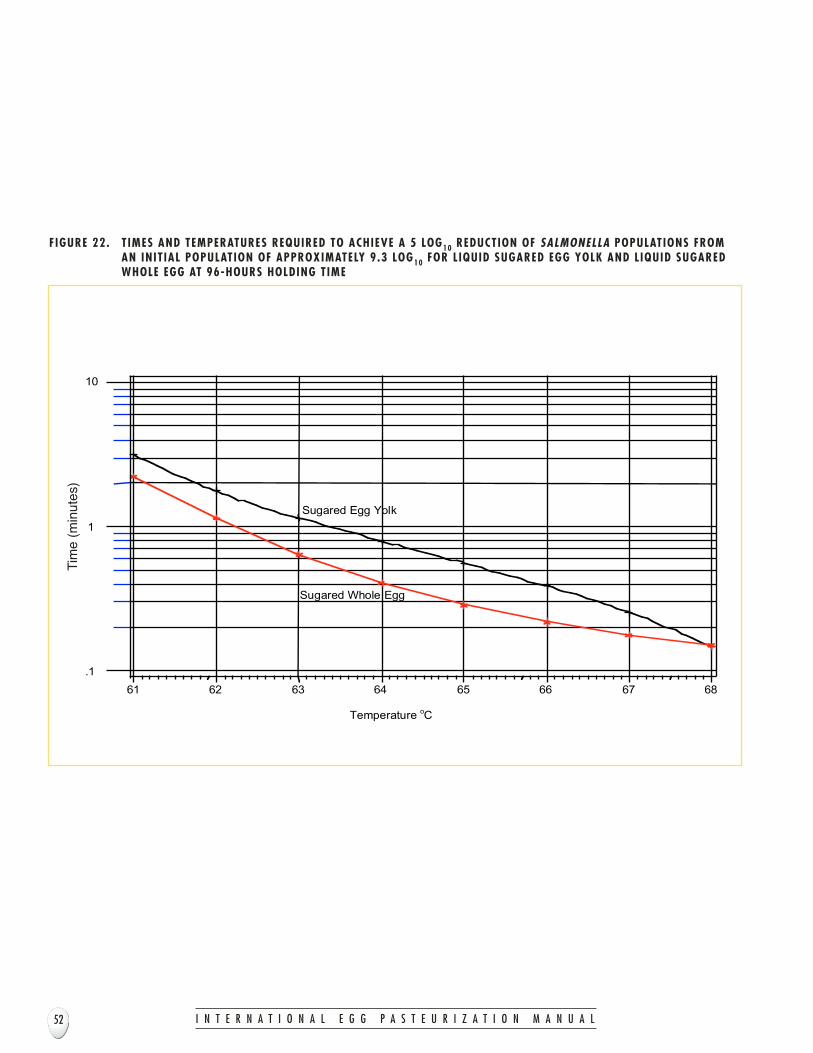
I N T E R N A T I O N A L E G G P A S T E U R I Z A T I O N M A N U A L
.1
1
10
61 62 63 64 65 66 67 68
Sugared Egg Yolk
Sugared Whole Egg
TemperatureoC
F IGURE 22. T IMES AND TEMPERATURES REQUIRED TO ACHIEVE A 5 LOG10 REDUCTION OF SALMONELLA POPULATIONS FROMAN INIT IAL POPULATION OF APPROXIMATELY 9.3 LOG10 FOR L IQUID SUGARED EGG YOLK AND L IQUID SUGAREDWHOLE EGG AT 96-HOURS HOLDING TIME
52
Tim
e (m
inut
es)
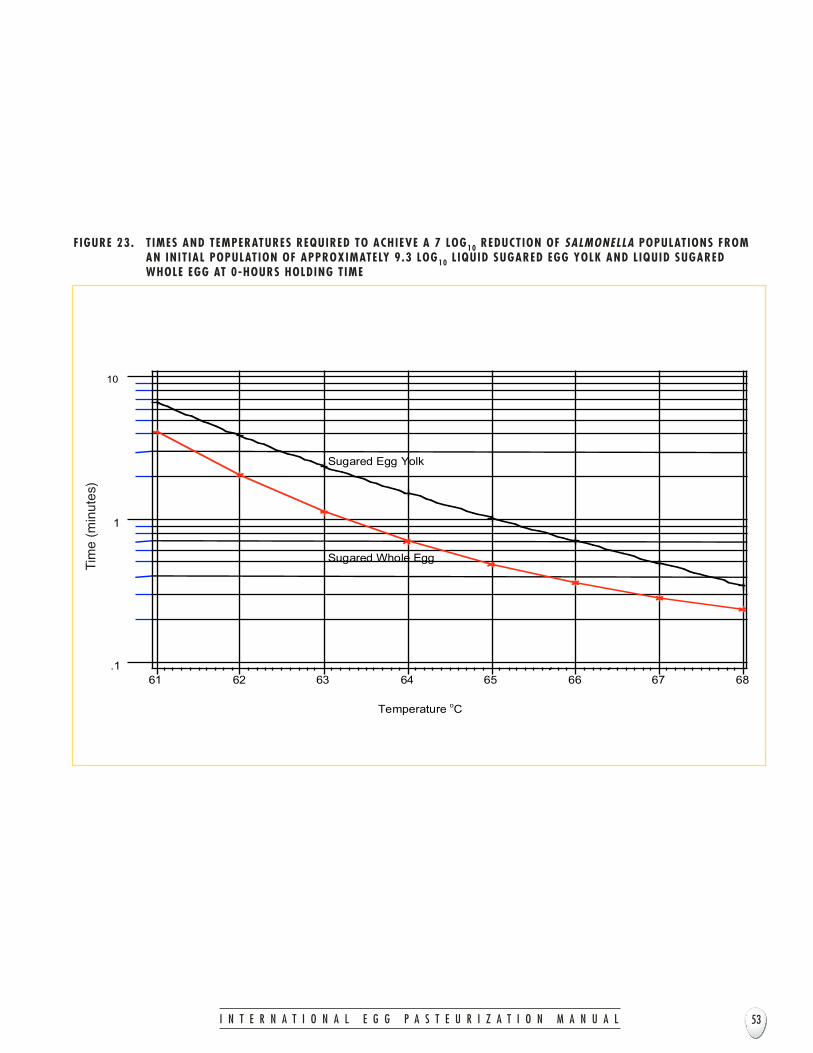
I N T E R N A T I O N A L E G G P A S T E U R I Z A T I O N M A N U A L 53
.1
1
10
61 62 63 64 65 66 67 68
Sugared Egg Yolk
Sugared Whole Egg
Temperature oC
F IGURE 23. T IMES AND TEMPERATURES REQUIRED TO ACHIEVE A 7 LOG10 REDUCTION OF SALMONELLA POPULATIONS FROMAN INIT IAL POPULATION OF APPROXIMATELY 9.3 LOG10 L IQUID SUGARED EGG YOLK AND L IQUID SUGAREDWHOLE EGG AT 0-HOURS HOLDING TIME
Tim
e (m
inut
es)
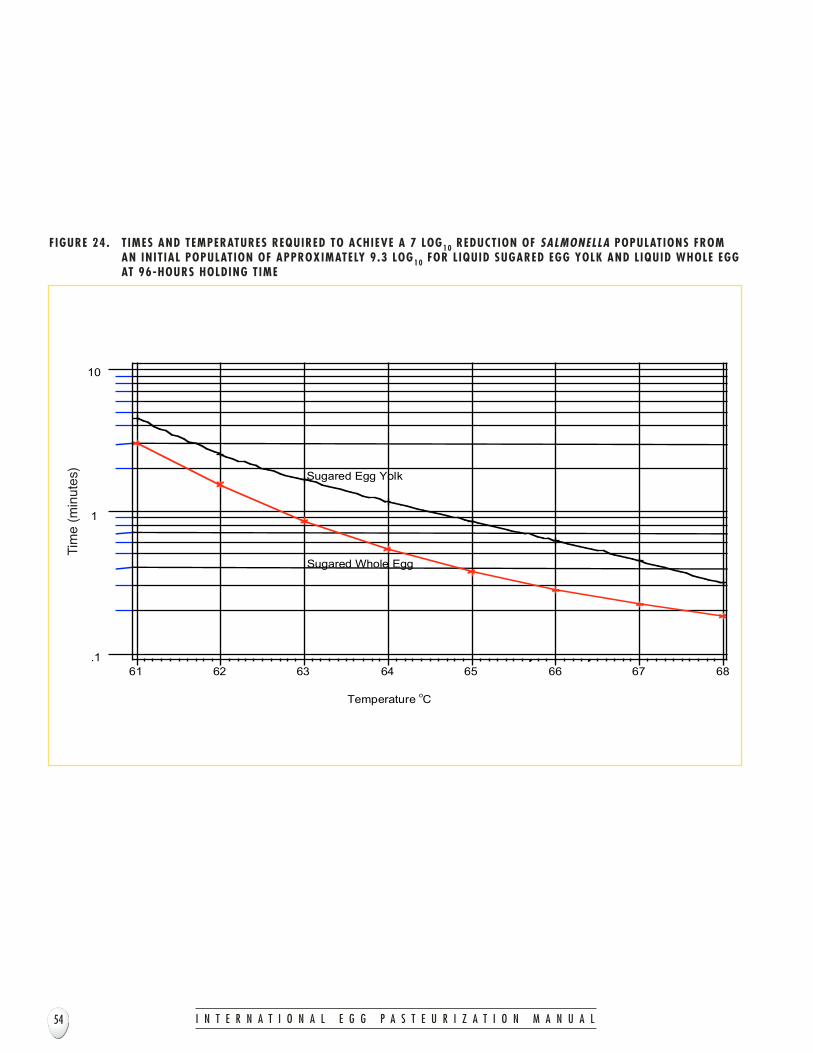
I N T E R N A T I O N A L E G G P A S T E U R I Z A T I O N M A N U A L54
.1
1
10
61 62 63 64 65 66 67 68
Sugared Whole Egg
Sugared Egg Yolk
Temperature oC
F IGURE 24. T IMES AND TEMPERATURES REQUIRED TO ACHIEVE A 7 LOG10 REDUCTION OF SALMONELLA POPULATIONS FROMAN INIT IAL POPULATION OF APPROXIMATELY 9.3 LOG10 FOR L IQUID SUGARED EGG YOLK AND L IQUID WHOLE EGGAT 96-HOURS HOLDING TIME
Tim
e (m
inut
es)
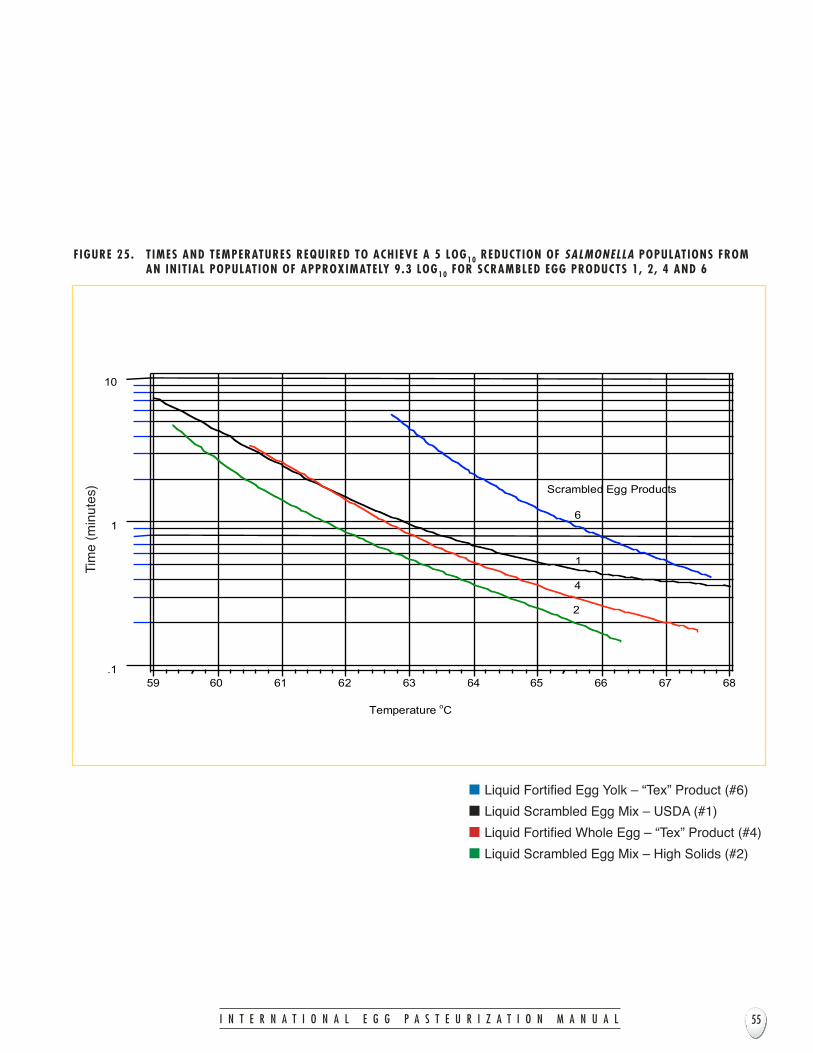
I N T E R N A T I O N A L E G G P A S T E U R I Z A T I O N M A N U A L 55
.1
1
10
59 60 61 62 63 64 65 66 67 68
TemperatureoC
Scrambled Egg Products
6
4
2
1
F IGURE 25. T IMES AND TEMPERATURES REQUIRED TO ACHIEVE A 5 LOG10 REDUCTION OF SALMONELLA POPULATIONS FROMAN INIT IAL POPULATION OF APPROXIMATELY 9.3 LOG10 FOR SCRAMBLED EGG PRODUCTS 1, 2 , 4 AND 6
Tim
e (m
inut
es)
Liquid Fortified Egg Yolk – “Tex” Product (#6)
Liquid Scrambled Egg Mix – USDA (#1)
Liquid Fortified Whole Egg – “Tex” Product (#4)
Liquid Scrambled Egg Mix – High Solids (#2)

.1
1
10
59 60 61 62 63 64 65 66 67 68
TemperatureoC
Scrambled Egg Products
6
1
4
2
F IGURE 26. T IMES AND TEMPERATURES REQUIRED TO ACHIEVE A 7 LOG10 REDUCTION OF SALMONELLA POPULATIONS FROMAN INIT IAL POPULATION OF APPROXIMATELY 9.3 LOG10 FOR L IQUID SCRAMBLED EGG PRODUCTS 1, 2 , 4 AND 6
I N T E R N A T I O N A L E G G P A S T E U R I Z A T I O N M A N U A L56
Tim
e (m
inut
es)
Liquid Fortified Egg Yolk – “Tex” Product (#6)
Liquid Scrambled Egg Mix – USDA (#1)
Liquid Fortified Whole Egg – “Tex” Product (#4)
Liquid Scrambled Egg Mix – High Solids (#2)

I N T E R N A T I O N A L E G G P A S T E U R I Z A T I O N M A N U A L 57
APPENDIX B: LETTERS
I N T E R N A T I O N A L E G G P A S T E U R I Z A T I O N M A N U A L 59
Mr. Al Pope, PresidentUnited Egg AssociationSuite 200, 1303 Hightower TrailAtlanta, Georgia 30350
Dear Mr. Pope:
The United States Department of Agriculture (USDA) has a goal to provide safe and wholesomefood to all consumers. No part of the Department plays a more critical role in public health thanour food safety mission area.
The Office of Food Safety believes in science as the basis for enhancing food safety, andencourages collaborative efforts by industry and the scientific community to achieve this. The EggPasteurization Guidelines developed by scientists at the University of Nebraska and OklahomaState University, through work supported by the egg products industry, are a good example of howsuch cooperation can work to the benefit of consumers.
USDA commends the United Egg Association’s work on pasteurization guidelines and hopes thattheir application will enhance the safety of egg products.
Sincerely,
Dr. Elisa A. MuranoUnder SecretaryFood Safety
I N T E R N A T I O N A L E G G P A S T E U R I Z A T I O N M A N U A L 61
Mr. Al Pope, PresidentUnited Egg ProducersOne Massachusetts Avenue, N.W. Suite 800Washington, D.C. 20001
Dear Mr. Pope:
In 1996, the United Egg Producers (UEP) presented to the Food Safety Inspection Service (FSIS) a protocol forstudying lethality kinetics of Salmonella spp. in liquid egg products. The study results were to be used in thedevelopment of industry guidelines for pasteurization treatment of liquid egg products. In a written letter to the UEP,FSIS agreed with the design of the study as spelled out in the protocol. The study was to be conducted under thedirection of Dr. Glenn Froning of the University of Nebraska.
In the past year, data from the study were provided to FSIS for review and a series of meetings between FSIS and UEPrepresentatives took place wherein issues concerning the data, statistical analysis and the application of the developedmodels were discussed.
FSIS believes the data from the University of Nebraska study provide a reliable source of information for use indeveloping models for predicting the lethality of Salmonella spp. for pasteurization treatments and thus can beconsidered in developing guidelines.
FSIS does not intend to in any way prescribe statistical procedures that can be used for developing models andderivative guidelines for pasteurization of liquid egg products. As with HACCP, FSIS expects that plants justify theirpasteurization procedures on scientifically-based considerations.
Sincerely,
William J. HudnallActing Administrator
Food Safety Inspection Service
Washington, D.C. 20250

I N T E R N A T I O N A L E G G P A S T E U R I Z A T I O N M A N U A L 63
Food Safety Inspection Service
FSIS STATEMENT
Ken Klippen, Vice PresidentUnited Egg ProducersOne Massachusetts Ave., N.W., Suite 800Washington, D.C. 20001
Dear Ken:
In 1996, the United Egg Producers (UEP) presented to the Food Safety Inspection Service (FSIS) a protocol forstudying lethality kinetics of Salmonella spp. in liquid egg products. The study results were to be used in thedevelopment of industry guidelines for pasteurization treatment of liquid egg products. In a written letter to the UEP,FSIS agreed with the design of the study as spelled out in the protocol. The study was to be conducted under thedirection of Dr. Glenn Froning of the University of Nebraska.
In the past year, data from the study were provided to FSIS for review and a series of meetings between FSIS and UEPrepresentatives took place wherein issues concerning the data, statistical analysis and the application of the developedmodels were discussed. The purpose of this letter is to express FSIS’s opinion on the above issues.
FSIS believes that this study is the most extensive of its kind on liquid egg products with respect to the number of typesof products covered, and thus, the results will be an important contribution to the scientific literature. The contributionis further enhanced because of the good repeatability of the results that were obtained from three independentreplications performed for each product type studied. Thus, FSIS believes that these data could and should be used inconsidering time-temperature guidelines for pasteurization of liquid egg products.
FSIS does not intend to in any way prescribe statistical procedures that can be used for developing models andderivative guidelines for pasteurization of liquid egg products; as with HACCP, FSIS expects that plants justify theirpasteurization procedures on scientifically-based considerations. FSIS believes the data from the University of Nebraskastudy provide a reliable source of information for use in developing models for predicting lethality of Salmonella spp. forpasteurization treatments, and thus, should be considered in developing guidelines.
The agency is willing to assist you in developing scientifically-based models and would be glad to comment on technicalpapers that you are developing for this purpose. My staff and I would be glad to further discuss with you matters raisedin this letter.
Sincerely,
Judith W. RigginsAssociate Deputy AdministratorOffice of Policy, Program Developmentand Evaluation
I N T E R N A T I O N A L E G G P A S T E U R I Z A T I O N M A N U A L 65
July 22, 2002
All Stakeholders:
On behalf of the United Egg Association’s Further Processors Board of Directors, we want toacknowledge all the financial contributors, cooperation from the US Department of Agriculture,and certainly the authors, and UEA Technical Committee.
The pasteurization manual will provide the stakeholders a valuable resource in their current andfuture research and marketing activities.
Elliot Gibber, Chairman Albert Pope, President
EG,AP/ck
Al Pope*President
Gene Gregory*Sr. Vice President
Ken Klippen**V.P. Government Relations
Michael McLeod**Washington Counsel
Randy Green**Sr. Government Relations Rep.
United Egg Association
*1720 Windward Concourse, Suite 230 • Alpharetta, Georgia 30005 • (770) 360-9220 • Fax (770) 360-7058
**One Massachusetts Ave., N.W., Suite 800 • Washington, D.C. 20001 • (202) 842-2345 • Fax (202) 682-0775 or (202) 408-7763
U AE
I N T E R N A T I O N A L E G G P A S T E U R I Z A T I O N M A N U A L 67
Mr. Al Pope, PresidentUnited Egg ProducersOne Massachusetts Avenue, N.W. Suite 800Washington, D.C. 20001
Dear Mr. Pope:
As Chairman of the International Egg Commission and a member of the European Egg Processors Association (EEPA),I am pleased to have been involved with this study.
This important work has updated our knowledge of effective pasteurisation and will be of great value to the eggproducts industry worldwide, as we all seek to achieve the highest standards of food safety.
Sincerely,
Clive FramptonPresidentFramptons Ltd.Somerset, England
IECINTERNATIONAL EGG COMMISSION


![Ovissipour] Pasteurization Conditions (Spinacia Oleracea ...](https://static.fdocuments.in/doc/165x107/620925e7e2850e2aa1004127/ovissipour-pasteurization-conditions-spinacia-oleracea-.jpg)