Efficient Small Engines for CHP - ARPA-E Zhao_Small engines... · Efficient Small Engines for CHP...
35
Efficient Small Engines for CHP Program Director: J.-C. Zhao Program Team: Ashwin Salvi, Adam Fischer, Will Regan, Joel Fetter, Colleen Nehl, Joe Stekli, John Tuttle, Bryan Willson ARPA-E Efficient Small Engines Workshop, Chicago, May 28-29, 2014
Transcript of Efficient Small Engines for CHP - ARPA-E Zhao_Small engines... · Efficient Small Engines for CHP...

Efficient Small Engines for CHP
Program Director: J.-C. Zhao
Program Team: Ashwin Salvi, Adam Fischer, Will
Regan, Joel Fetter, Colleen Nehl,
Joe Stekli, John Tuttle, Bryan Willson
ARPA-E Efficient Small Engines Workshop, Chicago, May 28-29, 2014

2
The Business & Environmental Case

Source: U.S. Energy Information Administration Annual Energy Review, Tables 1.2, 10.1, and E1.
Age of
Wood
Age of
Coal
Age of
Oil
Age of Gas &
Renewables ?
America has abundant natural gas
Total U.S. Energy Consumption
Efficient use is our responsibility

Centralized Power Waste

Centralized Power Waste
67% wasted
25.7 quads
Combined Heat and Power (CHP)
& Distributed Generation (DG)
4.3

Combined Heat and Power (CHP)
e-
Current - Central
e-
CHP
4.3 Quads
Heat loss 9.7 Quads
US Residential (Annual total)
4.7 Quads e-
“18.7 Quads”
18.8 Quads
18.8 Quads
4.7 Quads
4.3 Quads
At 25% e- efficiency, CHP requires of sizable heat
storage & utilization systems to be viable or only
viable in cold climate states.
Scenario 1: 25% e- efficiency
9.8 Quads excess heat

Combined Heat and Power (CHP)
e-
CHP
e-
Scenario 2: 40% e- efficiency
11.7 Quads
• At 40% e- efficiency, CHP could save 3 Quads of primary energy for residential
• + 2 Quads for commercial
11.7 Quads
4.7 Quads
4.3 Quads
2.7 Quads excess heat
Overall efficiency: 48% Overall efficiency: 77%
US Residential (Annual total)
e-
4.3 Quads
Heat loss 9.7 Quads
4.7 Quads
“18.7 Quads”
Current - Central
8 Source: RMI, White House, LBNL, DOE
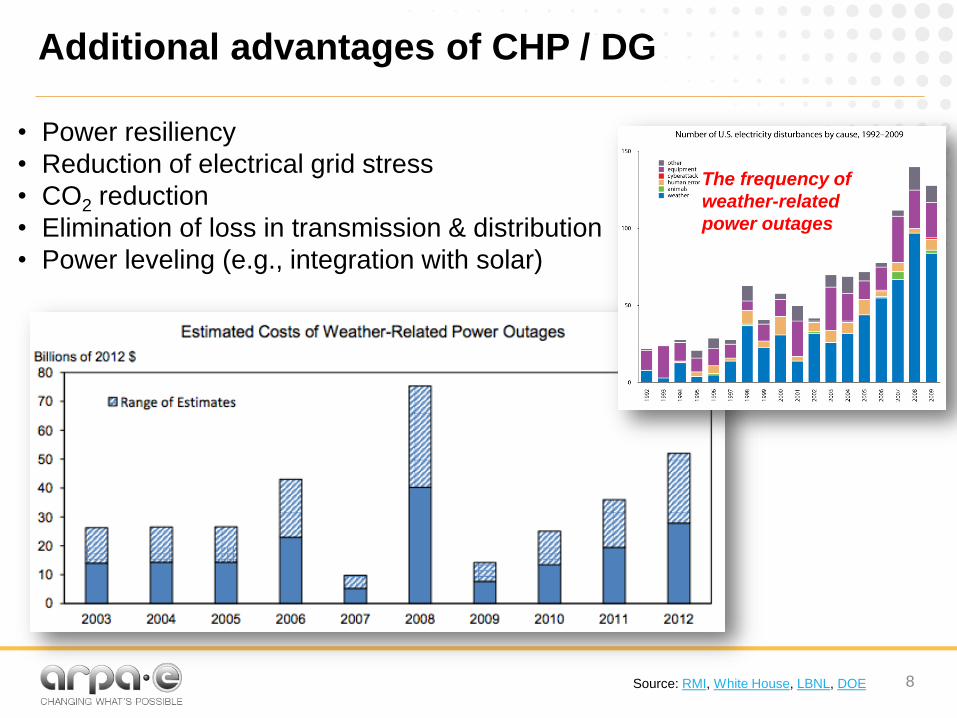
Additional advantages of CHP / DG
The frequency of
weather-related
power outages
• Power resiliency
• Reduction of electrical grid stress
• CO2 reduction
• Elimination of loss in transmission & distribution
• Power leveling (e.g., integration with solar)

9
What’s the right size for home CHP ?
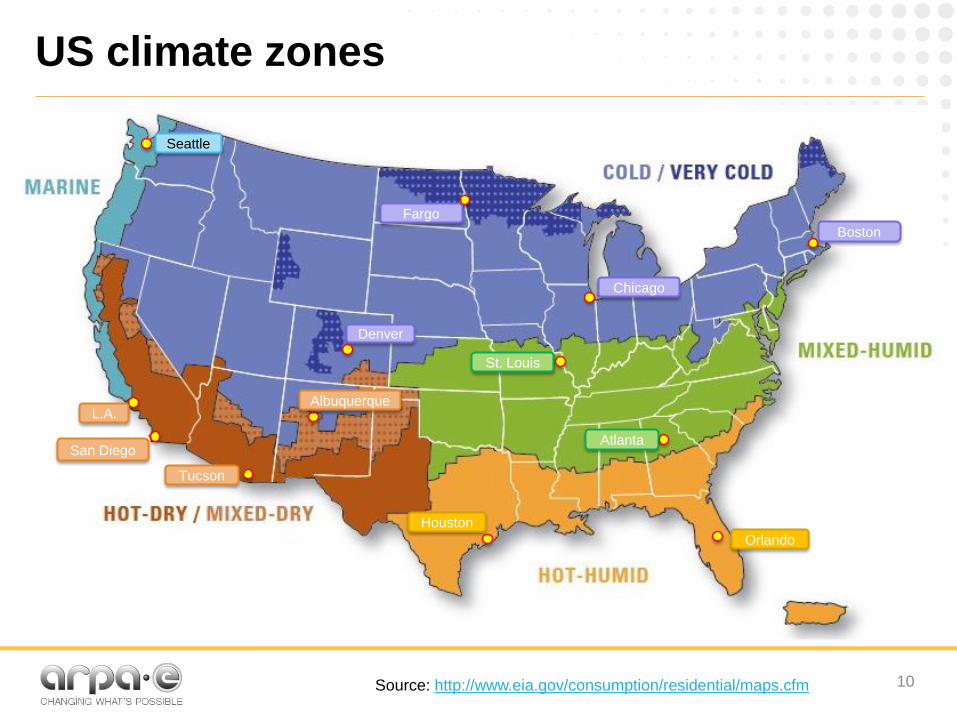
US climate zones
10 Source: http://www.eia.gov/consumption/residential/maps.cfm
Chicago
Seattle
Denver
Fargo
Tucson
L.A.
San Diego
Albuquerque
Houston
Atlanta
St. Louis
Boston
Orlando

Hourly residential load profile: Chicago
11
0
2
4
6
8
10
12
14
kW
h
0
2
4
6
8
10
12
14
Heating
1 24 Hour 1 24 Hour
January July
Hot Water
Electricity Electricity

12
Annual residential load profile: Chicago
0
2
4
6
8
10
12
14
16
kW
h
Average of Cooling
Average of Heating kWh
Average of Hot Water kWh
Average of Total Electric
Source: NREL BEopt
January December Month
40%e-, 3 kW-e system, heat
30%e-, 1 kW-e system, heat

Hourly residential load profile: Houston
13
0
2
4
6
8
10
12
14
kW
h
0
2
4
6
8
10
12
14
Heating
Cooling
January July
1 24 Hour 1 24 Hour
Hot Water
Source: NREL BEopt
Electricity Electricity

Annual residential load profile: Houston
14
0
2
4
6
8
10
12
14
16
kW
h
Average of Cooling
Average of Heating kWh
Average of Hot Water kWh
Average of Total Electric
January December Month
Source: NREL BEopt
30%e-, 1 kW-e system, heat
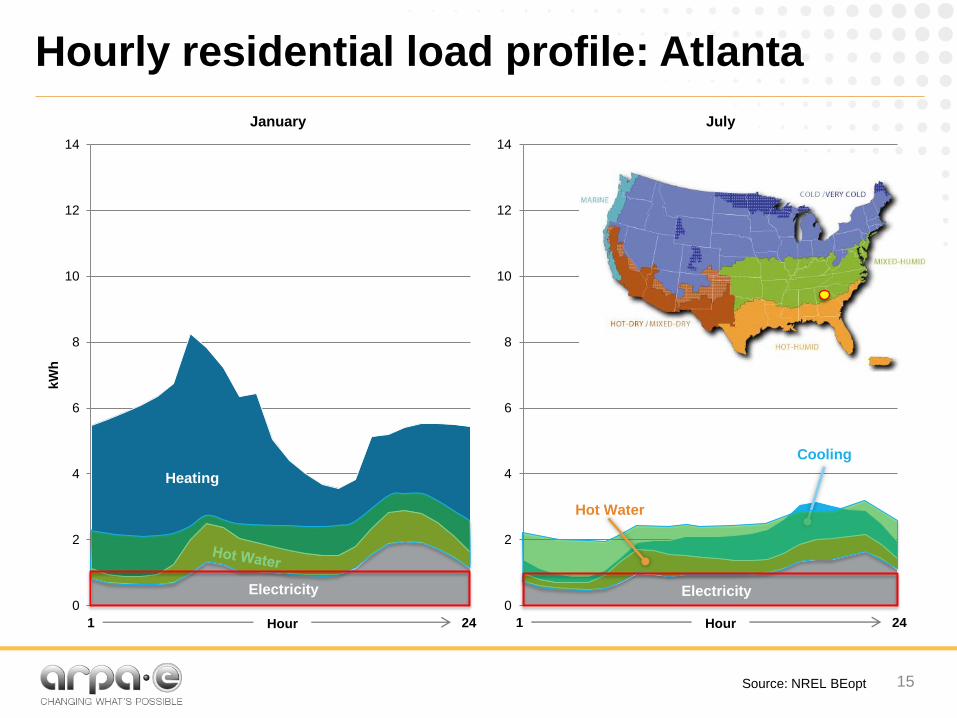
Hourly residential load profile: Atlanta
15
0
2
4
6
8
10
12
14
kW
h
0
2
4
6
8
10
12
14
Heating
Cooling
January July
1 24 Hour 1 24 Hour
Electricity Electricity
Hot Water
Source: NREL BEopt

Annual residential load profile: Atlanta
16
0
2
4
6
8
10
12
14
16
kW
h
Average of Cooling
Average of Heating
Average of Hot Water
Average of Total Electric
January December Month
Source: NREL BEopt
30%e-, 1 kW-e system, heat

17
Energy saving calculations
0
2
4
6
8
10
12
14
16
kW
h
Source: NREL BEopt
January December Month
Chicago
• Integrate usable heat hourly to a yr
• Average across each climate zone
• Multiply the number of homes with
NG at each zone
• Obtain total energy saving by
usable heat = 1.9 Quads per year
for 69M US homes with NG
• Extrapolate to all US homes = 3.1
Quads per year

18
Techno-Economic Analysis
Thermodynamics predicts what’s possible.
Economics dictates whether it will occur.

Techno-economic analysis
19
• Most customers want to remain on the grid
• System size to 1 kW (minimum electricity sell to
utilities)
• 90% capacity factor
• System (CAPEX) and installation cost
• Durability/lifetime of the system
• Different modes of operations not considered
Widespread adoption requires little or no government incentives
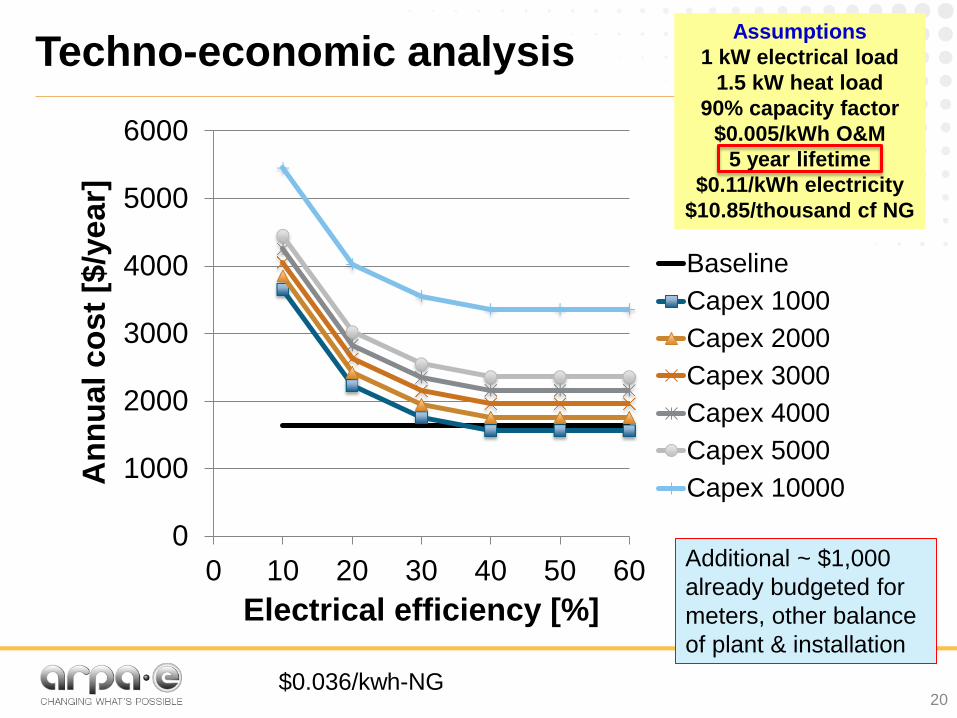
Techno-economic analysis Assumptions
1 kW electrical load
1.5 kW heat load
90% capacity factor
$0.005/kWh O&M
5 year lifetime
$0.11/kWh electricity
$10.85/thousand cf NG
0
1000
2000
3000
4000
5000
6000
0 10 20 30 40 50 60
An
nu
al
co
st
[$/y
ear]
Electrical efficiency [%]
Baseline
Capex 1000
Capex 2000
Capex 3000
Capex 4000
Capex 5000
Capex 10000
Additional ~ $1,000
already budgeted for
meters, other balance
of plant & installation
20 $0.036/kwh-NG

Techno-economic analysis
21
Assumptions
1 kW electrical load
1.5 kW heat load
90% capacity factor
$0.005/kWh O&M
10 year lifetime
$0.11/kWh electricity
$10.85/thousand cf NG
0
500
1000
1500
2000
2500
3000
3500
4000
4500
0 10 20 30 40 50 60
An
nu
al
co
st
[$/y
ear]
Electrical efficiency [%]
Baseline
Capex 1000
Capex 2000
Capex 3000
Capex 4000
Capex 5000
Capex 10000
Additional ~ $1,000
already budgeted for
meters, other balance
of plant & installation

Techno-economic analysis
22
0
1000
2000
3000
4000
5000
6000
20% 30% 40% 50% 60%
Maxim
um
Cap
ex [
$]
Efficiency [%]
Year 1Year 2Year 3Year 4Year 5Year 6Year 7
Assumptions
1 kW electrical load
1.5 kW heat load
90% capacity factor
$0.005/kWh O&M
10 year lifetime
$0.11/kWh electricity
$10.85/thousand cf NG
CAPEX payback years:
Additional ~ $1,000
already budgeted for
meters, other balance
of plant & installation

23
Technology Pathway & White Space
~ 40% electrical efficiency
~ 10 year durability/life
< $3,000 for a 1 kW-e system

White Space – Technology needs
24
White
Space
Source: Adapted from Catalog of CHP Technologies, U.S. Environmental Protection Agency Combined Heat and Power Partnership (2008).
Durability
Emission
Noise
ICE
ICE data from W. Liss, ARPA-E Small Engine Workshop presentation

40% e- efficiency 1 kW-e system feasibility
25
Mechanical /
Combustion Solid State
• Stirling engine
• ICE
• Microturbine
• Thermoacoustics
• ……
• Thermoeletrics
• Ion expansion (Na, O)
• Thermionic emission
• Electrocalorics
• Thermophotovoltaics
• ……
Cost, Durability, Emission, Noise
Coupling with Materials and Manufacturing Innovations …

26
Deployment Challenges & Opportunities
69,000,000
homes have NG

Deployment Challenges
27
• Utility acceptance
• Integration with the forced air heating/cooling
• Heat to cooling for southern states
• Emissions regulations
• Consumer acceptance and benefits
• Initial investment

Changing Regulatory Environment
‣ Addressing Interconnection: IEEE DG Standards Document 1547 – Updated 8 times since creation, with specific changes that reflect rapid
changes in DG interest1
– Power quality, interconnection standards, voltage regulation, islanding, active management
‣ Business Model Disruptions: – Players support change: NRG supports customer independence, counter to
NRG direction2
– Utility Death Spiral Hype:
• Edison Electric Institute alarmist report3
• Changes in policy that allow utilities to own DG and offset infrastructure support loss/death spiral
‣ FERC Order #755 & #784 Pay-for-Performance: – Reduces technology payment “discrimination”—requires consideration of
speed and accuracy4
28 1. MITEI, “The Impact of DG and EV”, Chap. 5, mitei.mit.edu
2. http://blogs.wsj.com/corporate-intelligence/2013/03/22/utility-boss-faces-mortal-threat-from-solar/?KEYWORDS=crane+mortal
3. http://www.eei.org/ourissues/finance/Documents/disruptivechallenges.pdf
4. http://www.ferc.gov/whats-new/comm-meet/2011/102011/E-28.pdf

Net metering and interconnection standards
Several states have specific net metering policies for micro-CHP
New York 10 kW system capacity limit for micro-CHP; net excess generation is credited at the utility’s avoided cost rate
Vermont 20 kW system capacity limit for micro-CHP
Maryland 30 kW system capacity limit for micro-CHP
New Hampshire CHP systems <30 kW must have a system efficiency of at least 80% to be eligible
Maine CHP systems <30 kW must have a combined electrical and thermal efficiency of at least 80% to be eligible
29
█ Renewable generation or fuel cell systems only
Mandatory state EERS or RPS* includes CHP/waste-heat █ Only systems smaller than 50 kW eligible
█ Specific rules for micro-CHP
▲ States with utility-level net metering rules
States with interconnection standards States with net metering rules
Source: DSIRE, Freeing the Grid, EPA, EPA
▲
▲
▲
▲
▲
▲
▲ ▲
▲
▲
▲
▲
* EERS = Energy efficiency resource standard
RPS = Renewable portfolio standard
43 states
44
states

30
Spillovers & Opportunities

Spillovers and Other Opportunities
31
• Commercial & industrial CHP
• Military power
• Backup power systems
• Concentrated solar power (CSP)
• Generator for hybrid light-duty vehicles
Easier to scale up than scale down
Wikipedia

32
Workshop Objectives

Workshop Objectives
33
• Identify the white space & metrics
• Bring researchers on mechanical engines
together with those on solid-state devices
• Stimulate innovations with mini-presentations
• Identify potential technology pathways
• Foster teaming
• Identify barriers to widespread deployment
Efficiency, Cost, Durability, Emission, Noise

Workshop Objectives
34
Efficiency, Cost, Durability, Emission, Noise
What can we do to enable widespread
adoption of home/residential CHP ?
Bottom-line:

Welcome and Thank You