Efficient sigma‑delta beamforming techniques for ...
145
This document is downloaded from DR‑NTU (https://dr.ntu.edu.sg) Nanyang Technological University, Singapore. Efficient sigma‑delta beamforming techniques for ultrasound imaging application Cheong, Jia Hao 2009 Cheong, J. H. (2009). Efficient sigma‑delta beamforming techniques for ultrasound imaging application. Doctoral thesis, Nanyang Technological University, Singapore. https://hdl.handle.net/10356/18657 https://doi.org/10.32657/10356/18657 Downloaded on 20 Mar 2022 14:43:59 SGT
Transcript of Efficient sigma‑delta beamforming techniques for ...

This document is downloaded from DR‑NTU (https://dr.ntu.edu.sg)Nanyang Technological University, Singapore.
Efficient sigma‑delta beamforming techniques forultrasound imaging application
Cheong, Jia Hao
2009
Cheong, J. H. (2009). Efficient sigma‑delta beamforming techniques for ultrasound imagingapplication. Doctoral thesis, Nanyang Technological University, Singapore.
https://hdl.handle.net/10356/18657
https://doi.org/10.32657/10356/18657
Downloaded on 20 Mar 2022 14:43:59 SGT

EFFICIENT SIGMA-DELTA
BEAMFORMING TECHNIQUES
FOR ULTRASOUND IMAGING
APPLICATION
Cheong Jia Hao
School of Electrical & Electronic Engineering
A thesis submitted to Nanyang Technological University in fulfillment of the requirements for the degree of Doctor of
Philosophy
2009
ATTENTION: The Singapore Copyright Act applies to the use of this document. Nanyang Technological University Library

i
ACKNOWLEDGMENTS
First of all, I would like to give thanks to my dear heavenly Father for the chance to
experience this new stage of my life. He has never failed to deliver me from any
discouragement and low spirit. I am thankful for the wonderful people He has brought to
me through this project and the challenges He has entrusted me.
I am also full of gratitude to my supervisor Assoc Prof Yvonne Lam Ying Hung for her
thoughtful guidance and planning to enable the progress of this project, and also Assoc
Prof Koh Liang Mong, Asst Prof Tiew Kei Tee for their attentive teaching during
weekly meetings.
I am especially grateful to my teammate Dr. Gao Changqing for his selfless help in this
project. He has imparted the important knowledge of beamforming and ultrasound
imaging to me and has dedicated his time in answering lots of my queries. I appreciate
the discussions with Mr. Song Pengyu on sigma-delta modulator as well, which is
always a way to discover neglected details.
Gratitude is also due to Professor Yongmin Kim, Mr. Yang Mo Yoo, Mr. Anup Agarwal
and Mr. Fabio K. Schneider for their help and discussion during our six month
collaboration at University of Washington.
I would like to thank Mr. Cao Ji, Dr. Zhang Fan for the wonderful time of being a team.
ATTENTION: The Singapore Copyright Act applies to the use of this document. Nanyang Technological University Library

ii
TABLE OF CONTENTS
Acknowledgments .......................................................................................................... i
Table of Contents ........................................................................................................... ii
List of Figures .............................................................................................................. vii
List of Tables ............................................................................................................... xii
List of Symbols ........................................................................................................... xiv
Glossary ..................................................................................................................... xviii
Abstract ...................................................................................................................... xxii
Chapter 1 Introduction ................................................................................................ 1
1.1 Background ......................................................................................................... 1
1.2 3-D ultrasound imaging systems .................................................................... 2
1.3 Portable ultrasound systems ............................................................................ 3
1.4 Ultrasound receive beamformer ..................................................................... 5
1.5 Organization of thesis ....................................................................................... 6
1.6 Contributions ....................................................................................................... 7
ATTENTION: The Singapore Copyright Act applies to the use of this document. Nanyang Technological University Library

iii
Chapter 2 Literature review ........................................................................................ 9
2.1 Ultrasound system architecture ...................................................................... 9
2.2 Acquisition modes ........................................................................................... 12
2.3 Discrete array transducer ............................................................................... 13
2.4 Receive beamforming ..................................................................................... 15
2.4.1 Beamforming principle .............................................................................. 15
2.4.2 Conventional digital receive beamforming ........................................... 17
2.4.2.1 Time domain approach ....................................................................... 19
2.4.2.1.1 Delay-and-sum beamformer ....................................................... 19
2.4.2.1.2 Partial sum beamformer .............................................................. 19
2.4.2.1.3 Interpolation beamformer ........................................................... 20
2.4.2.1.4 Shifted sideband beamformer ..................................................... 20
2.4.2.2 Frequency domain approach ............................................................ 21
2.4.2.2.1 Discrete Fourier Transform beamformer ............................... 21
2.4.2.2.2 Phase shift beamformer ............................................................... 21
ATTENTION: The Singapore Copyright Act applies to the use of this document. Nanyang Technological University Library

iv
2.5 Sigma-delta receive beamforming ............................................................... 22
2.5.1 Insert zero, divide-by-two and compensated SDBF ........................... 24
2.5.2 Insert +1 -1 method ..................................................................................... 26
2.5.3 Non-uniform sampling method ................................................................ 26
2.5.4 Block-based sigma-delta beamforming ................................................. 28
2.6 Summary ............................................................................................................ 30
Chapter 3 Dynamic focusing artifacts ...................................................................... 32
3.1 Sigma-delta modulator ................................................................................... 33
3.1.1 Sinusoidal input ........................................................................................... 33
3.1.2 Ultrasound input .......................................................................................... 36
3.1.3 Simulation results ........................................................................................ 37
3.1.4 Challenges ..................................................................................................... 39
3.2 Sample repetition ............................................................................................. 40
3.3 Time domain analysis ..................................................................................... 46
3.4 Frequency domain analysis ........................................................................... 50
ATTENTION: The Singapore Copyright Act applies to the use of this document. Nanyang Technological University Library
v
Chapter 4 Cascaded reconstruction based sigma-delta beamforming .................... 53
4.1 Beamformer structure ..................................................................................... 53
4.2 First filter selection .......................................................................................... 58
4.3 Results and discussions .................................................................................. 62
4.4 Hardware estimation ....................................................................................... 71
4.4.1 Cascaded reconstruction SDBF ............................................................... 71
4.4.2 Delay generator ............................................................................................ 72
4.4.2.1 Complete lookup table method .......................................................... 73
4.4.2.2 Compressed lookup table with delta encoding ............................. 74
4.4.2.3 General parametric approach .......................................................... 75
4.4.2.4 Implementation results and discussions ......................................... 78
4.5 Summary ............................................................................................................ 79
Chapter 5 Multi-bit Sigma-delta beamformer ......................................................... 82
5.1 Theory ................................................................................................................. 82
5.2 Beamformer structure ..................................................................................... 87
ATTENTION: The Singapore Copyright Act applies to the use of this document. Nanyang Technological University Library

vi
5.3 Results................................................................................................................. 89
5.3.1 Image simulation results ............................................................................ 89
5.3.2 Hardware synthesis results ........................................................................ 93
5.4 Summary ............................................................................................................ 97
Chapter 6 Conclusions and future work .................................................................. 99
6.1 Conclusions ....................................................................................................... 99
6.2 Future work .................................................................................................... 102
6.2.1 Doppler mode imaging............................................................................ 102
6.2.2 Coded excitation ....................................................................................... 103
References .................................................................................................................. 105
Appendix A Beamforming ...................................................................................... 115
Appendix B Beamformer structures ........................................................................ 117
Appendix C Multi-bit ADC specification ............................................................... 119
C.1 Doppler mode .................................................................................... 119
C.2 High quality B-mode .................................................................................... 120
ATTENTION: The Singapore Copyright Act applies to the use of this document. Nanyang Technological University Library
vii
LIST OF FIGURES
Number Page
Fig. 2.1. Block diagram of an ultrasound imaging system. .............................................. 10
Fig. 2.2. (a) Linear array transducer, (b) convex array transducer and (c)
phased array transducer. ................................................................................... 14
Fig. 2.3. Geometric diagram from delay calculation. ..................................................... 15
Fig. 2.4. A typical digital receive beamformer system. .................................................... 18
Fig. 2.5. Post-delay reconstruction sigma-delta beamformer. .......................................... 22
Fig. 2.6. Point phantom images (a) without dynamic focusing artifacts, (b) with
dynamic focusing artifacts. ............................................................................... 24
Fig. 2.7. The output digital sample in a channel (a) before dynamic focusing,
(b) after dynamic focusing, (c) after insert zero correction scheme,
(d) after divide-by-two correction scheme. ...................................................... 25
Fig. 2.8. Block-based sigma-delta beamformer. ............................................................... 29
Fig. 3.1. Practical single-bit 2nd-order sigma-delta modulator. ........................................ 33
Fig. 3.2. Output SQNR vs. input level of a single-bit 2nd-order sigma-delta
modulator with OSR=16. .................................................................................. 35
ATTENTION: The Singapore Copyright Act applies to the use of this document. Nanyang Technological University Library

viii
Fig. 3.3. Ultrasound signal with centre frequency at 3.5MHz and fractional
bandwidth of 0.6. .............................................................................................. 36
Fig. 3.4. Signal and quantization noise spectra with an input level of -4dBFS. .............. 38
Fig. 3.5. SQNR vs. input level of a single-bit 2nd-order sigma-delta modulator
with ultrasound input signal. ............................................................................ 38
Fig. 3.6. Signal spectra (a) before and (b) after sample repetition every m
samples. ............................................................................................................. 43
Fig. 3.7. Signal spectra before and after sample repetition when samples are
repeated every (a) 2 samples, (b) 3 samples, (c) 10 samples. .......................... 45
Fig. 3.8. RF signal waveform after going through (a) sigma-delta modulation,
reconstruction, sample repetition, and envelope detection in
sequence, (b) sigma-delta modulation, sample repetition,
reconstruction, and envelope detection in sequence. ....................................... 47
Fig. 3.9. Simulation setup that investigates the effect of pre-delay SQNR on
PSNR. ................................................................................................................ 48
Fig. 3.10. Single channel PSNR obtained against different pre-delay SQNR at
different sample repetition rates. ...................................................................... 49
ATTENTION: The Singapore Copyright Act applies to the use of this document. Nanyang Technological University Library

ix
Fig. 3.11. Frequency spectra of sigma-delta modulated signal before and after
dynamic delay when (a) no pre-delay filtering is utilized, (b) when
8-tap boxcar filter was utilized as pre-delay filter. .......................................... 51
Fig. 4.1. Cascaded reconstruction of a sigma-delta modulated bit stream. ...................... 54
Fig. 4.2. Block diagram of a SDBF based on cascaded reconstruction. .......................... 54
Fig. 4.3. Block diagram showing the difference in hardware requirement by
applying delay focusing (a) after the first filter, (b) before the first
filter. .................................................................................................................. 56
Fig. 4.4. Cascaded reconstruction SDBF where delay focusing is performed
before the first filtering. .................................................................................... 57
Fig. 4.5. Required pre-delay SQNR at different OSR and the corresponding
achievable PSNR per channel after beamforming. .......................................... 61
Fig. 4.6 Frequency responses of 160 tap FIR filter and CIC decimator with 30
tap FIR filter. ..................................................................................................... 65
Fig. 4.7. Wire phantom images with axial projection obtained using (a) pre-
delay reconstruction, (b) post-delay reconstruction, (c) insert zero,
and (d) cascaded reconstruction SDBF. ........................................................... 67
Fig. 4.8. Wire phantom image which shows the 3 areas of noise power that are
used to calculate the PSNR. .............................................................................. 68
ATTENTION: The Singapore Copyright Act applies to the use of this document. Nanyang Technological University Library

x
Fig. 4.9. Image of the cyst phantom data acquired by Biomedical Ultrasonics
Laboratory at University of Michigan. ............................................................. 70
Fig. 4.10. Block diagram of a complete lookup table approach. ...................................... 73
Fig. 4.11. Block diagram of the compressed lookup table with delta encoding
approach. ........................................................................................................... 74
Fig. 4.12. Delay calculation geometry for 1D linear transducer array. ............................ 75
Fig. 4.13. Block diagram of the general parametric on-the-fly calculation
approach. ........................................................................................................... 77
Fig. 5.1. The required SQNR to achieve at least -3dB of the maximum
achievable PSNR value per channel under different OSR. ............................. 85
Fig. 5.2. Multi-bit sigma-delta beamformer using N-bit modulators. .............................. 87
Fig. 5.3. Wire phantom image which shows the 3 areas of noise power that are
used to calculate the PSNR. .............................................................................. 90
Fig. 5.4. Image of the cyst phantom data acquired by Biomedical Ultrasonics
Laboratory at University of Michigan. ............................................................. 92
Fig. 5.5. System I/O configuration of the SDBFs (the figures in bracket are
meant for 3-bit SDBF). ..................................................................................... 94
ATTENTION: The Singapore Copyright Act applies to the use of this document. Nanyang Technological University Library

xi
Fig. 5.6. Layout of the test-chip of a 2nd-order 3-bit sigma-delta modulator
done by R. Gaggl et al. ..................................................................................... 97
Fig. A1. Beamforming process. ....................................................................................... 115
Fig. B1. Pre-delay reconstruction SDBF. ........................................................................ 117
Fig. B2. Post-delay reconstruction SDBF. ...................................................................... 118
ATTENTION: The Singapore Copyright Act applies to the use of this document. Nanyang Technological University Library

xii
LIST OF TABLES
Number Page
Table 2.1. Comparison of delta-sigma dynamic focusing artifact correction
schemes. ........................................................................................................... 31
Table 4.1. PSNR values of 3 different depths for different beamforming
techniques at 111MHz beamforming frequency. ........................................... 69
Table 4.2. Contrast-to-noise ratio (CNR) in anechoic region of the cyst
phantom image obtained by various SDBF. ................................................... 70
Table 4.3. Number of multipliers and adders for pre-delay reconstruction
SDBF and cascaded reconstruction SDBF with 8-tap boxcar pre-
delay filter for 64-channel system. .................................................................. 72
Table 4.4. Implementation results of (a) complete lookup table approach, (b)
compressed lookup table with delta encoding approach and (c)
general parametric approach. .......................................................................... 78
Table 4.5. Device utilization of (a) complete lookup table approach, (b)
compressed lookup table with delta encoding approach and (c)
general parametric approach. .......................................................................... 79
ATTENTION: The Singapore Copyright Act applies to the use of this document. Nanyang Technological University Library

xiii
Table 5.1. Theoretical and simulated pre-delay SQNR of the multi-bit 2nd order
sigma-delta modulator. .................................................................................... 86
Table 5.2. PSNR values of 3 different depths for different beamforming
techniques. ....................................................................................................... 91
Table 5.3. Contrast-to-noise ratio (CNR) in anechoic region of the cyst
phantom image obtained by various SDBF. ................................................... 93
Table 5.4. Hardware synthesis results of various SDBF. ................................................. 95
ATTENTION: The Singapore Copyright Act applies to the use of this document. Nanyang Technological University Library

xiv
LIST OF SYMBOLS
∆ Instant increment of focal depth
∆x Pitch between adjacent elements
c Speed of sound
df Focal depth
dr Length of the echo path
e(t) Quantization error of sigma-delta modulators
E(z) Quantization error function of sigma-delta modulators
fB Signal bandwidth
fBF Beamforming frequency
fnum f-number
fS Sampling frequency
GSNR Apodization power gain
kN Constant xn·sinθ
ATTENTION: The Singapore Copyright Act applies to the use of this document. Nanyang Technological University Library

xv
L Number of samples in each block selected in block-based SDBF
M Twice the oversampling ratio used in block-based SDBF
m Sample interval
Nb Number of bits
Nch Number of active channels in receive beamforming
ne2 Unshaped quantization noise power
nq2 Quantization noise power after noise shaping
NS Number of samples
p Full pulse-echo path
Py Output power of sigma-delta modulators
R Distance from the transducer to the focal point, which is also the focal
depth
rcor Correlation coefficient
Re Auto correlation of e[n]
rf Ratio of sampling frequency to signal bandwidth
ATTENTION: The Singapore Copyright Act applies to the use of this document. Nanyang Technological University Library

xvi
Rn' Distance between the nth element and the focal point
Ru Auto correlation of u[n]
Rue Cross correlation of u[n] and e[n]
T Period of signal
tn' Time of arrival of ultrasound echoes at the nth element
TS Sampling period
u(t) Input signal of sigma-delta modulators
U(z) Input function of sigma-delta modulators
wn Apodization weightage at the nth element
X(z) Z-transform of signal x
xn Distance from the centre of the scanline to the nth elemtne
y(t) Output signal of sigma-delta modulators
Y(z) Ourput function of sigma-delta modulators
θ Steering angle
λ Wavelength
ATTENTION: The Singapore Copyright Act applies to the use of this document. Nanyang Technological University Library

xvii
µc Mean values of cyst
µs Mean values of scatterers
σs Standard deviation of scatterers
Ω Digital frequency
ATTENTION: The Singapore Copyright Act applies to the use of this document. Nanyang Technological University Library

xviii
GLOSSARY
ADC Analog-to-Digital Converter
A-mode Amplitude mode
Apodization The amplitude windowing of electrical pulses across the
aperture in order to reduce side lobe level and prevent gating
lobes.
B-mode Brightness mode
CE-SDBF Coded Excitation Sigma-Delta BeamFormer
CIC filter Cascaded Integrator-Comb filter
CNR Contrast-to-Noise Ratio: The ratio of the mean value
difference between scatterers and cyst to the standard
deviation of the scatterers.
CW Continuous Wave
DAC Digital-to-Analog Converter
DEM Dynamic Element Matching
ATTENTION: The Singapore Copyright Act applies to the use of this document. Nanyang Technological University Library

xix
DFT Discrete Fourier Transform
D-mode Doppler mode
DR Dynamic Range: The ratio between the maximum and
minimum signal power that a system can process.
Dynamic aperture The varying of aperture size with focal depth in order to
achieve uniform point spread function.
ENBW Equivalent Noise BandWidth
ENOB Equivalent Number Of Bits
FIFO First-In-First-Out
FIR filter Finite Impulse Response filter
F-mode Color Flow mode
f-number The ratio of the focal length to the size of the aperture.
FPGA Field Programmable Gate Array
IBF Interpolation BeamFormer
IFT Inverse Fourier Transform
ATTENTION: The Singapore Copyright Act applies to the use of this document. Nanyang Technological University Library

xx
LSB Least Significant Bit
LUT LookUp Table
MI Mechanical Index: A standard measure of the acoustic output
in a diagnostic ultrasound system, defined as the peak
rarefactional pressure of an ultrasound longitudinal wave
divided by the square root of the centre frequency.
Near field A non-uniform beam intensity exists in the near field (area of
non-divergence). It is also called the Fresnel zone. For a non-
focused transducer, the depth of the near field (D) can be
estimated usingλ
2rD = , where r is the radius of the
transducer and λ is the wavelength of the ultrasound.
OSR OverSampling Ratio: The ratio of the sampling frequency to
two times the signal bandwidth.
PRBF Phase Rotation BeamFormer
PSNR Peak Signal-to-Noise Ratio: The ratio of the peak signal
power to the average noise floor level of an image.
QD Quadrature Demodulation
ATTENTION: The Singapore Copyright Act applies to the use of this document. Nanyang Technological University Library

xxi
RF Radio Frequency
ROM Read-Only Memory
RTL Register Transfer Level
Rx Receive
SDBF Sigma-Delta BeamFormer
SL SideLobe
SNR Signal-to-Noise Ratio
SQNR Signal-to-Quantization Noise Ratio: The ratio of the signal
power to the quantization noise power.
TGC Time Gain Control
Tx Transmit
VHDL Very high speed integrated circuit Hardware Description
Language
Σ∆ Sigma-Delta
ATTENTION: The Singapore Copyright Act applies to the use of this document. Nanyang Technological University Library

xxii
ABSTRACT
Pre-delay reconstruction sigma-delta beamformer (SDBF) was proposed in recent years
to achieve a higher level of integration in ultrasound imaging systems. The high-order
reconstruction filter used in each channel of SDBF makes the beamformer highly
complex. The beamformer can be simplified by reconstructing the signal only after the
delay-and-sum process. It requires only one reconstruction filter for the entire
beamformer. However, this post-delay reconstruction-based beamformer degrades the
image quality when dynamic focusing is performed. This thesis studied the cause of the
dynamic focusing artifact problem suffered by the sigma-delta beamformer. It was
found that the degree of the problem is related to the pre-delay quantization noise that is
present in the signal. Hence, similar performance to the conventional pre-delay
reconstruction SDBF can be achieved by simply employing a simple pre-delay filter, as
long as the pre-delay filter provides the required pre-delay signal-to-quantization noise
ratio (SQNR). Based on this finding, a cascaded reconstruction beamformer was
developed that utilizes a boxcar filter as the pre-delay filter in each channel to achieve
the required pre-delay SQNR value. Simulations using real phantom data demonstrated
that the proposed cascaded reconstruction beamforming method can achieve a contrast
resolution comparable to that of the pre-delay reconstruction beamforming method. In
addition, the savings on hardware and power can be as much as 85% and 68%
respectively, as compared to the pre-delay reconstruction SDBF.
ATTENTION: The Singapore Copyright Act applies to the use of this document. Nanyang Technological University Library

xxiii
Based on the same principle, a multi-bit SDBF was developed to further improve the
hardware and power performances as compared to the cascaded reconstruction SDBF.
Real point and cyst phantom images show that the multi-bit SDBF provides comparable
image quality as the cascaded reconstruction SDBF without any extra artifact correction
processing. It also reduces the operation frequency compared to the single-bit SDBF.
Hardware synthesis result shows that the proposed multi-bit SDBF can save up to 44%
and 62% on hardware and power respectively, as compared to the cascaded
reconstruction SDBF.
The author believes that the development of these efficient beamformer structures will
assist the advancement of ultrasound imaging systems in the two current trends, that is
the low-end portable handheld systems as well as the high-end 3-D machines, since the
proposed beamformer structures can be applied to both types of machine.
ATTENTION: The Singapore Copyright Act applies to the use of this document. Nanyang Technological University Library

1
C h a p t e r 1
INTRODUCTION
1.1 Background
Acoustic wave is used by animals like bats and dolphins to detect objects and measure
distances. This incredible idea was first utilized by human for underwater echo-ranging
application after the catastrophic Titanic disaster in 1912 [1]. Its application was then
extended to SONAR (Sound Navigation and Ranging) which was an important military
technology during the Second World War. This most destructive tragedy in recent
human history somehow brought along a rapid development of diagnostic ultrasound
instrumentation. In the late 1940s and early 1950s, ultrasound signal was found useful
for the detection of different tissue structures due to its change in velocity when
traveling through different mediums. This finding brought forth the amplitude mode (or
A-mode) application of ultrasound signal [2] in medical application and the first
brightness mode (or B-mode) ultrasound scanner was demonstrated in 1952 [3]. Since
then, more medical diagnostic functions have been introduced to ultrasound scanner like
Doppler and color flow imaging.
Due to the breakthrough in several technological aspects (e.g. wideband transducers,
digital circuitries, etc.), ultrasound image quality has improved significantly over the
past decade. In particular, the introduction of various new contrast agents (e.g. Optison,
ATTENTION: The Singapore Copyright Act applies to the use of this document. Nanyang Technological University Library
2
Definity, Sonovue, etc.) has facilitated the development of 3-dimensional (3-D)
ultrasound imaging systems, which is very helpful in the guidance of biopsy needle.
Currently, 3-D ultrasound imaging systems have already been used for the planning of
complicated surgeries.
Contrasting to the development of more sophisticated 3-D ultrasound imaging system,
there is another trend to develop low-end portable ultrasound imaging systems. Together
with the advancement of the communication systems, the diagnosis of ultrasound
imaging no longer needs to be performed locally. Remote analysis can be carried out
where physicians are stationed while ultrasound scanning can be done by patients
themselves using home-based ultrasound system.
The two trends of ultrasound imaging systems (i.e., high-end 3-D ultrasound imaging
system and low-end portable ultrasound imaging system) directed the research towards a
common goal, which is a low cost and low power beamformer without compromising
image quality. The details of the 3-D ultrasound machine, portable imaging system and
ultrasound beamformer are discussed in Section 1.2 to 1.4.
1.2 3-D ultrasound imaging systems
Although the development of 3-D ultrasound imaging systems has been investigated for
decades, it is receiving more attention in recent years. Three dimensional ultrasound
imaging systems not only provide a more accurate way of diagnosis, but also reduce the
ATTENTION: The Singapore Copyright Act applies to the use of this document. Nanyang Technological University Library
3
examination time. The 3-D technology is a process to build precise 3-D image based on
2-D information, and thus helps the physicians in their diagnosis.
Most of the 3-D ultrasound imaging systems construct 3-D images from a number of
2-D image slices. A 1-D ultrasound transducer array is moved either by free-hand or
mechanically to obtain slices of 2-D image for different locations. The final 3-D images
are constructed by stacking up the 2-D images. Such technique not only faces the
accuracy problem in the positioning of the transducer, it is also too slow to image
moving structures such as heart [4], [5].
In order to develop a more accurate real-time 3-D imaging system, large channel count
2-D transducer array needs to be utilized to capture the different slices of 2-D image
simultaneously. The number of front-end processing channels needs to be increased as
well. Thus, it is important to design simple, low cost, low power but high performance
front-end processing circuitry for the realization of a high performance 3-D ultrasound
imaging system [5]. This trend constitutes the motivation of this project.
1.3 Portable ultrasound systems
In current hospital environment, expensive, large and heavy ultrasound imaging systems
are used on patients. For most cases, the medical workers need to move a bedridden
patient if ultrasound scanning is needed. A portable, handheld ultrasound machine
would be useful in such a case. Tom Dugan, senior vice president of global marketing
and US sales for SonoSite Inc. said that "with hand-carried ultrasound, the goal is not to
ATTENTION: The Singapore Copyright Act applies to the use of this document. Nanyang Technological University Library

4
replace traditional systems. It is to enable physicians to perform procedures using
ultrasound more efficiently and effectively, bringing the system to the patient rather than
the patient to the system." [6]
Besides advancing the ultrasound imaging systems for the high-end application, there is
also a trend to minimize the ultrasound systems to be portable and battery operated
while maintaining reasonable image quality. Such a system will facilitate the archiving,
retrieving of images and also remote consultation, which could bring a breakthrough in
the medical world. The home ultrasound system proposed by Y. M. Yoo et al. is an
example of a portable and battery operated ultrasound imaging system [7]. This home
ultrasound system would save the hospitalization cost for mothers with high risk
pregnancy. Remote monitoring can be done with such a system at home. Several
portable ultrasound machines have been commercialized like Terason t3000, Sonosite
180 Plus, iLook, and My sono. Nonetheless, these systems are restricted to the usage of
clinicians and sonographers and their price is still high, greater than USD8000- not
affordable for home users.
The primary consideration for portable ultrasound systems is not only small size, but
also low cost and low power. As receive beamformer is the most processing intensive
part of an ultrasound imaging system, it is the main challenge for size, cost, and power
reduction of the whole system [8], [9]. This need also motivates the research interest in
this project.
ATTENTION: The Singapore Copyright Act applies to the use of this document. Nanyang Technological University Library

5
1.4 Ultrasound receive beamformer
Receive beamforming has been shifted extensively into the digital domain due to the
processing flexibility and the ease of handling crosstalk, noise problem [10]. The
detailed beamforming process is described in Appendix A. However, high speed multi-
bit analog-to-digital converters (ADC) and front-end digital circuitries are required to
achieve the necessary delay accuracy. To mitigate the high speed requirement of ADCs,
interpolation beamformer (IBF) [11], [12] and quadrature demodulation (QD) based
phase rotation beamformer (PRBF) [13-15] have been developed and have become
common practices. Although IBF and PRBF relieve the sampling frequency of the
ADC, computationally demanding finite impulse response (FIR) filter is required in
each channel (as interpolation filter for IBF and demodulation filter for QD-based
PRBF).
To reduce the hardware complexity of digital receive beamformer, beamforming
techniques based on sigma-delta (Σ∆) ADC were proposed [16], [17]. By directly
replacing the multi-bit ADCs with sigma-delta ADCs of similar resolution (including
modulators and reconstruction filters), the (pre-delay reconstruction) sigma-delta
beamformer (SDBF) can provide comparable image quality to the conventional multi-bit
beamformer. However, the hardware is still complex due to the use of a
computationally-demanding reconstruction filter in each channel and the number of
channels can be from a minimum of 32 for low-end machine up to 128 channels for
high-den machine. To alleviate the hardware requirement in the pre-delay reconstruction
SDBF, Noujaim et al. developed a post-delay reconstruction SDBF [16], in which one
ATTENTION: The Singapore Copyright Act applies to the use of this document. Nanyang Technological University Library

6
reconstruction filter is utilized after the delay-and-sum process (instead of one filter in
each channel) to recover the modulated signal. The detailed structure of the pre-delay
reconstruction SDBF and post-delay reconstruction SDBF is described in Appendix B.
This approach significantly reduces the hardware but it was later found to be suffered
from dynamic focusing artifacts introduced when samples are repeated during delay-
and-sum process. Hence, there is still a need to design a SDBF that is power and
hardware efficient without compromising the image quality.
1.5 Organization of thesis
The objective of this research is formed, that is to develop a sigma-delta beamformer
(SDBF) that is-low cost, low power and with good image quality. The success in
developing such a SDBF will provide a cost effective and power efficient front-end
solution for the realization of a high end, large channel count 3-D ultrasound imaging
system or a low end, low cost, low power portable system. This thesis reports the
development of such a SDBF based on theoretical studies that were carried out.
The organization of the thesis is such that the architecture of an ultrasound imaging
system, the theory of a sigma-delta modulator, the existing SDBF are reviewed and
presented in Chapter 2. Chapter 3 presents the study on the cause of dynamic focusing
artifact problem. Chapter 4 describes a proposed SDBF structure - cascaded
reconstruction based SDBF, which effectively reduces the dynamic focusing artifacts.
Three ways of developing the delay generator (complete lookup table (LUT),
ATTENTION: The Singapore Copyright Act applies to the use of this document. Nanyang Technological University Library

7
compressed lookup table (LUT), general parameter approach) are also compared in
Chapter 4. Chapter 5 describes a power efficient multi-bit SDBF, which is designed
based on cascaded reconstruction SDBF but provides a better solution, in terms of both
hardware complexity and power consumption, to the dynamic focusing artifact problem.
Finally, Chapter 6 concludes the research works done and presents possible future works
that can be followed up.
1.6 Contributions
The works of this thesis have been published or submitted in the following papers:
• J. H. Cheong, Y. Y. H. Lam, K. T. Tiew, and L. M. Koh, "Sigma-Delta Receive
Beamformer Based on Cascaded Reconstruction for Ultrasound Imaging
Application," IEEE Transactions on Ultrasonics, Ferroelectrics and Frequency
Control, vol. 55, pp. 1935-1946, 2008.
• J. H. Cheong, Y. Y. H. Lam, L. M. Koh, and K. T. Tiew, "Delay-and-sum Multi-
bit Sigma-delta Beamformer with Minimal Dynamic Focusing Artifacts,"
submitted for publication in IEEE Transactions on Ultrasonics, Ferroelectrics
and Frequency Control.
• J. H. Cheong, Y. Y. H. Lam, L. M. Koh, and K. T. Tiew, "Multi-bit Sigma-delta
Beamformer with Minimal Dynamic Focusing Artifacts," in IEEE international
ATTENTION: The Singapore Copyright Act applies to the use of this document. Nanyang Technological University Library

8
Conference on Electron Devices and Solid-state Circuits 2008, was awarded the
Best Student Paper Award.
• J. H. Cheong, Y. Y. H. Lam, L. M. Koh, and K. T. Tiew, "Sigma-delta Receive
Beamformer Based on Cascaded Reconstruction for Ultrasound Imaging
Application," accepted for publication in the 3rd International Conference on
Bioinformatics and Biomedical Engineering 2009.
• B. Yang, J. H. Cheong, Y. Y. H. Lam, and L. S. Ng, "A Comparison of the
Lookup Table and On-The-Fly Calculation Methods for the Beamforming Control
Unit," in the 23rd International Technical Conference on Circuits/Systems,
Computers and Communications, 2008.
• Y. Deng, J. H. Cheong, Y. Y. H. Lam, and L. S. Ng, "VHDL Implementation of
Sigma-delta Beamformers for Ultrasound Application," in the 23rd International
Technical Conference on Circuits/Systems, Computers and Communications,
2008.
ATTENTION: The Singapore Copyright Act applies to the use of this document. Nanyang Technological University Library

9
C h a p t e r 2
LITERATURE REVIEW
2.1 Ultrasound system architecture
The basic structure of an ultrasound system is shown in Fig. 2.1[18]. The system
consists of a transducer which converts electrical signals to ultrasound signals and vice
versa. The transducer can be configured for both transmitting and receiving modes, and
it can either be continuous aperture or discrete array. Discrete array transducer is
preferred today because of its ability to perform focusing and beam-steering. Linear
array, convex array and phase array are used by the most commonly available discrete
array transducer.
The transmit path of an ultrasound system comprises a beamforming control unit, a
transmit beamformer, and high voltage amplifiers. The beamforming control unit
calculates the delay pattern for the beamformer to generate electrical pulses. The
transducer elements are then excited by the electrical pulses to trigger ultrasound pulses
that focus at different depth according to the delay profile. Theoretically, the transmit
beamformer also controls the amplitude of the electrical pulses across the aperture in
order to reduce the sidelobe level and to prevent grating lobes. This is known as
apodization.
ATTENTION: The Singapore Copyright Act applies to the use of this document. Nanyang Technological University Library

10
Fig. 2.1. Block diagram of an ultrasound imaging system.
The aperture size of transducer can be varied with the focal depth in order to achieve
uniform point spread function, and this is known as dynamic aperture. A parameter,
f-number, which is the ratio of the focal length to the size of the aperture, was found to
be 2 to provide optimal focusing performance [19]. A high voltage amplifier is needed
in each channel to provide high voltage signal for transducer element excitation. At the
same time, the amplifiers shape the electrical pulses to increase the transmission
efficiency.
The front-end of an ultrasound receiver can consist of two different paths. One path is
utilized for Doppler mode (or D-mode) scanning while the other path is for brightness
Transducer
TGC
ATTENTION: The Singapore Copyright Act applies to the use of this document. Nanyang Technological University Library
11
mode (or B-mode) and color flow imaging (or F-mode) scanning. In the case of D-mode
scanning, an additional Continuous Wave (CW) analog beamformer is needed because
the Doppler signal strength is very low. To date, there is no such a high speed ADC (eg.
150MHz) commonly available that is able to provide 14-bit resolution so that the
Doppler signal can be processed digitally [20]. The calculation of the resolution can be
found in Appendix C.1. Digital beamformers can be used for B-mode and F-mode
scanning because of their stability, reliability and the reduction in cost of digital circuitry
[21]. Time gain compensation (TGC) amplifiers are placed before the beamformer to
amplify the signal with increasing gain when the firing time is longer, so that the path
loss is compensated. The digital beamformer then delays the received signal from each
channel according to the respective delay pattern calculated by the beamformer control
unit. Similarly with transmit beamforming, apodization and dynamic aperture can be
executed as well, which applies different weights to the ultrasound signal transmitted by
each transducer array element. It gradually decreases the weights of the transducer
elements with the distance from the transducer center. The purpose is to reduce the side
lobes of the transmitted beam.
Aperture size of the transducer can be varied as well with the focal depth in order to
achieve homogenous signal strength and uniform point spread function. This is known
as dynamic aperture, which is commonly used in beamforming. The transducer aperture
is gradually opened up from the central receive processing channels according to
f-number, which is the ratio of the instant focal depth over the size of the aperture as
defined in (2.1)
ATTENTION: The Singapore Copyright Act applies to the use of this document. Nanyang Technological University Library

12
( ) xN
df f
num ∆−=
1 (2.1)
where df is the instant focal depth, N is the number of active channels and ∆x is the pitch
between adjacent transmitting elements on the transducer array.
It has been found that optimal focusing performance can be achieved when the f-number
is greater than or equal to 2 [19]. In other words, when the focal depth increases, the
number of active channels is gradually increases to ensure that the instant focal depth is
always 2 times greater than or equal to the width of the opened aperture, until all the
channels have been activated.
2.2 Acquisition modes
Since the use of ultrasound in medical diagnosis in the late 1940s, several acquisition
modes have been developed for different purposes. The amplitude mode (or A-mode)
scanning was first used for eye examination and for echoencephalography. The
amplitude of the signal is displayed against the depth of the scanned object as spikes.
Only one-dimensional information is conveyed. The information obtained by this mode
is useful for tissue characterization [19]. The interfaces of different tissues can be
produced when the ultrasound signal is being reflected by them.
The three main modes for contemporary ultrasound imaging application are B-mode, D-
mode and F-mode which are shown in Fig. 2.1. Unlike A-mode scanning, B-mode
scanning displays the strength of the reflected echoes as the brightness of the pixels. The
ATTENTION: The Singapore Copyright Act applies to the use of this document. Nanyang Technological University Library

13
scanning beam can be steered to cover across a 2-D area. Thus, this scanning mode is
usually used to obtain 2-D grey scale image.
Ultrasound can also be used for color-flow imaging (F-mode) which displays blood flow
as colors overlaying on the B-mode display. On the other hand, Spectral Doppler (D-
mode) indicates the blood flow velocity and frequency [18]. Over the decades, the
application of ultrasound imaging system has been extended greatly from obstetric
sonography to treatment in stroke sufferers, acoustic targeted drug delivery and even
elastography on soft tissue to detect tumors.
2.3 Discrete array transducer
There are 5 different transducer array schemes available and each having a different
elevation resolution, which is the ability to resolve adjacent structures in a plane
perpendicular to the image plane [22]:
1-D: One dimensional dynamic focusing. Elevation aperture is fixed and focal length
is fixed.
1.25-D: Elevation aperture is variable but focusing is static.
1.5-D: Elevation aperture, shading, focusing are dynamically variable, but symmetric
about the centre line.
1.75-D: Similar to 1.5-D without the constraint of symmetry. Steering angle is
limited.
2-D: Full apodization, focusing, steering in elevation direction.
ATTENTION: The Singapore Copyright Act applies to the use of this document. Nanyang Technological University Library

14
Transducer can also be classified into linear, convex and phased array. Linear array has
its elements arranged in a straight row, as shown in Fig. 2.2(a). A group of elements are
fired at the same instance to form a scanline. It is then shifted by one element at a time
across the entire transducer to scan over the area covered by the transducer. The
operation of convex array is the same as linear array. The only difference is that the
elements of a convex array are arranged in a curvilinear shape, as shown in Fig. 2.2(b).
Fig. 2.2(c) shows the scanning area of the phased array transducer. The element
arrangement is the same as linear array but all the elements are fired according to a
certain timing pattern to form a scanline at a certain steering angle. The area covered by
a phased array is wider than that of a linear array with the same number of elements.
However, more complex beamforming control unit is required for phase array
transducers.
(a) (b) (c)
Fig. 2.2. (a) Linear array transducer, (b) convex array transducer and (c) phased array transducer.
ATTENTION: The Singapore Copyright Act applies to the use of this document. Nanyang Technological University Library

15
2.4 Receive beamforming
2.4.1 Beamforming principle
During transmission, focusing can provide better resolution for ultrasound imaging.
Ultrasound signal transmitted by different elements can be directed to arrive at a certain
focal point simultaneously, so that the total signal strength at that focal point is their
coherent sum. This can be achieved mechanically by arranging the transducer elements
in a certain shape, or electronically by delaying the firing time of the elements with
certain pattern. The delay pattern can be calculated according to the distance from the
transducer to the focal point. This focusing process is known as beamforming. The delay
pattern for beamforming can be calculated according to the geometric diagram shown in
Fig. 2.3.
Fig. 2.3. Geometric diagram from delay calculation.
From Fig. 2.3, the distance between the nth element and the focal point can be calculated
as below:
Focal point
ATTENTION: The Singapore Copyright Act applies to the use of this document. Nanyang Technological University Library
16
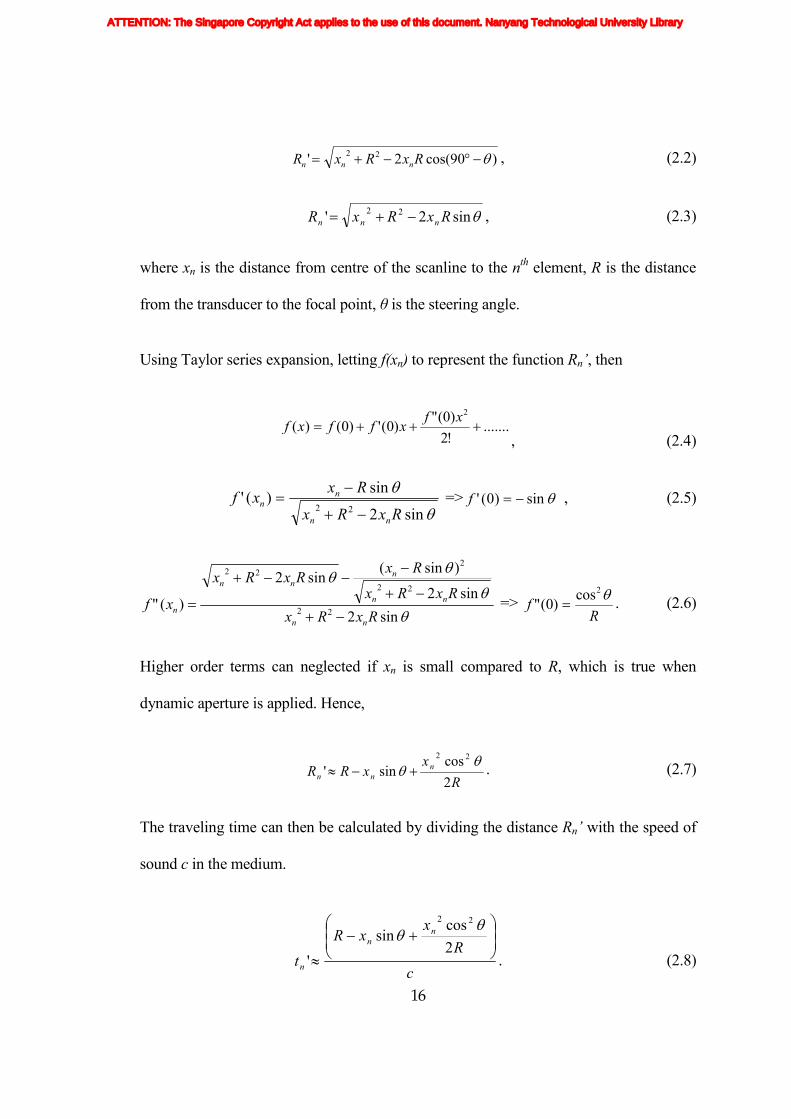
)90cos(2' 22 θ−°−+= RxRxR nnn , (2.2)
θsin2' 22 RxRxR nnn −+= , (2.3)
where xn is the distance from centre of the scanline to the nth element, R is the distance
from the transducer to the focal point, θ is the steering angle.
Using Taylor series expansion, letting f(xn) to represent the function Rn’, then
.......
!2)0("
)0(')0()(2
+++=xf
xffxf, (2.4)
θ
θ
sin2
sin)('
22 RxRx
Rxxf
nn
nn
−+
−= => θsin)0(' −=f , (2.5)
θθ
θθ
sin2
sin2
)sin(sin2
)("22
22
222
RxRx
RxRx
RxRxRx
xfnn
nn
nnn
n −+
−+
−−−+
= => R
fθ2cos
)0(" = . (2.6)
Higher order terms can neglected if xn is small compared to R, which is true when
dynamic aperture is applied. Hence,
R
xxRR n
nn 2cos
sin'22 θ
θ +−≈ . (2.7)
The traveling time can then be calculated by dividing the distance Rn’ with the speed of
sound c in the medium.
c
Rx
xR
t
nn
n
+−
≈2cos
sin
'
22 θθ
. (2.8)
ATTENTION: The Singapore Copyright Act applies to the use of this document. Nanyang Technological University Library

17
Transmit focusing is achieved by providing the relative time delay according to (2.7)
when firing the transducer elements. To avoid signal interference, the transducer
elements can only be fired again after the previously fired ultrasound signal has
dispersed. For this reason, transmit focusing is normally static focusing. Each scanline is
obtained by one firing only, for one focal point, so that the frame rate will not be limited
by multiple firing in the case where dynamic focusing is applied.
On the other hand, receive focusing can be performed dynamically. Focusing can be
done at different depths. Theoretically, the receive beamformer inserts the necessary
time delay to each channel in order to compensate the arrival time difference as
calculated by (2.7). In practice, the receive beamformer realizes this time delay by
selecting the received samples stored in a temporary storage according to the time delay
pattern from (2.7). By doing so, the signal received from the focal point is coherently
summed. Noise from locations other than the focal point will be partially or even
completely cancelled off. The resultant effect is that the coherently summed signal
power will dominate over the noise power.
The generation of the delay can be done by pre-calculating it and storing it in a lookup
table (LUT), or on-the-fly calculation. The detailed hardware comparison between the
LUT and on-the-fly calculation is presented in Section 4.4.
2.4.2 Conventional digital receive beamforming
Due to the advancement of technology, the cost of designing a digital circuitry is
reducing. Hence, analog beamformer has gradually been replaced by digital beamformer
ATTENTION: The Singapore Copyright Act applies to the use of this document. Nanyang Technological University Library

18
as there are a numbers of advantages that digital systems have over analog systems.
Digital systems have higher precision, stability and reliability compared to analog
systems [21]. Crosstalk problem can be handled more easily in digital domain without
the supply voltage limitation. Digital system is also more flexible in terms of its
functionality. Thus, ultrasound scanners using digital beamformer are programmable
and more compact [23], [24]. Apodization can also be applied more accurately as well.
Digital beamformers can even perform complex signal processing with lower power
dissipation, which is of increasing importance [25].
A typical digital receive beamformer structure is shown in Fig. 2.4.
Fig. 2.4. A typical digital receive beamformer system.
The received ultrasound echoes are digitized by the ADCs and then stored in a
temporary storage (or first-in-first-out (FIFO) memories). The length of the temporary
ATTENTION: The Singapore Copyright Act applies to the use of this document. Nanyang Technological University Library

19
storage is variable depending on the delay information used to perform dynamic
focusing.
Several conventional digital beamforming methods have been developed. They can be
classified into time domain and frequency domain techniques [15].
2.4.2.1 Time domain approach
Time domain beamforming techniques include delay-sum, partial-sum, interpolation,
and shifted-side-band methods which are presented below.
2.4.2.1.1 Delay-and-sum beamformer
Delay-and-sum beamformer, as its name implies, performs the focusing by delaying the
samples and then sum them up across the channels. The minimum delay resolution is
one sampling period. Thus, high sampling rate is necessary to achieve sufficient delay
resolution. Large storage and large connection bandwidth between ADCs and
beamformer are needed because of the amount of data transmitted between them. The
computation of apodization and summation can generally operate at Nyquist rate. It is
the most direct and simple beamforming technique.
2.4.2.1.2 Partial sum beamformer
Partial sum beamformer predefines memories for beamformed output storage. Every
beam output sample is the summation of the delayed samples across the channels. It is
different from delay-and-sum in that its output is not obtained at one shot. Instead, the
beam output is updated every time when the required samples from a particular focal
point are received. Partial sum beamformer does not require long memory to store the
ATTENTION: The Singapore Copyright Act applies to the use of this document. Nanyang Technological University Library

20
received echo samples. The received samples are added directly to the corresponding
beam output memory once they are received. Hence, if the number of elements is larger
than the number of beams and the beam output sampling rate is lower than the input
sampling rate, the memory size required will be reduced. Although partial sum reduces
input data storage, high input sampling rate (usually more than 100MHz) is still needed
to provide sufficient delay resolution.
2.4.2.1.3 Interpolation beamformer
Interpolation beamformer upsamples the received echoes to obtain the necessary delay
resolution. It can thus reduce both the input data storage and the input sampling rate,
therefore the design of ADC circuitry and the connection bandwidth are relieved. Since
beamforming and interpolation filtering are linear, the sequence of them is
interchangeable. The appropriate placement of the interpolation filters depends on the
beamforming scenario (if the number of beam is greater than the number of elements,
pre-beamforming interpolation will be less computationally expensive) as well as the
choice between partial sum and delay sum.
2.4.2.1.4 Shifted sideband beamformer
Shifted sideband beamformer translates the signal to lower frequency [26]. This results
in a reduction of the required input sampling rate, the area of ADCs, data transmission
bandwidth and input data storage. Nevertheless, there is grating lobe phenomenon which
occurs for certain array geometries, e.g. linear array when small groups of adjacent
transducer element receive the same quantized steering delay.
ATTENTION: The Singapore Copyright Act applies to the use of this document. Nanyang Technological University Library

21
2.4.2.2 Frequency domain approach
Frequency domain beamforming techniques include Discrete Fourier Transform (DFT)
and phase-rotation (phase-shift) beamforming which are presented below.
2.4.2.2.1 Discrete Fourier Transform beamformer
Discrete Fourier Transform (DFT) beamformer accomplishes the delay task by
multiplying exponential phase offset to the frequency domain input signals. Different
phase offsets are applied to different input frequencies. Generally the Inverse Fourier
Transform (IFT) is not required because the frequency domain beam output
representation is highly suitable for post-beamforming processing.
2.4.2.2.2 Phase shift beamformer
Phase shift beamformer is similar to DFT beamformer except that it assumes the
received echo to have only single frequency component. Therefore, Fourier Transform is
not required to find the different frequency components. Phase correction exponential
term can be directly multiplied to the time domain input signal.
Both DFT and phase shift beamformer using frequency domain approach eliminate the
need for high input sampling rate. Larger amount of input data storage is generally
required for DFT. Although phase shift beamformer requires a relatively small amount
of circuitry, good results are achieved for only narrow frequency bands.
Detailed description of all the beamforming techniques mentioned above can be found
in [15]. They all need extra processing to provide sufficient delay resolution except the
delay-and-sum and partial sum techniques which achieve the delay resolution by high
ATTENTION: The Singapore Copyright Act applies to the use of this document. Nanyang Technological University Library

22
input sampling rate. However, there is currently no such multi-bit ADCs commercially
available that can operate at high sampling rate (e.g. 175MHz as calculated in Appendix
C.2) for delay-and-sum and partial sum beamforming techniques.
In addition, conventional digital beamformer needs a multi-bit ADC in every receive
channel. If the number of channels is large, then the number of multi-bit ADCs required
becomes impractical in terms of hardware complexity, cost and power consumption
[27]. It also hinders single-chip solution for digital receive beamformers.
2.5 Sigma-delta receive beamforming
Sigma-delta beamformer (SDBF) was first developed and patented by General Electric
Company in 1993 with the objective to simplify beamforming circuitry without
sacrificing the image quality. The simplified structure of this post-delay reconstruction
SDBF is shown in Fig. 2.5.
Fig. 2.5. Post-delay reconstruction sigma-delta beamformer.
TGC
ATTENTION: The Singapore Copyright Act applies to the use of this document. Nanyang Technological University Library

23
For the SDBF system shown, the received ultrasound echoes go through the TGC before
they are converted to digital data by the sigma-delta modulators. The digital outputs
from the modulators are then stored in delay registers which can either be shift registers
or first-in-first-out (FIFO) memories. Delay control signals, generated either by real-
time calculation or LUT, select the samples from the delay registers to the adder. A
reconstruction filter is then used to reconstruct the signal of the summed output. The
reconstruction of post-delay reconstruction SDBF is done after the delay-and-sum
process. There is only one reconstruction filter needed for the whole system. In contrast,
pre-delay reconstruction beamforming needs a reconstruction filter in each beamforming
channel.
Post-delay reconstruction beamformer has less hardware requirement than the pre-delay
reconstruction beamformer. However, there is a problem inherently suffered by the post-
delay reconstruction beamforming. When dynamic focusing is performed to obtain
better image quality, delay is updated every sampling period. There are times that the
same sample would be selected repeatedly when the quantized time delay remains
unchanged. This sample repetition introduces unexpected artifact problem in the final
image produced by post-delay reconstruction SDBF, which is not addressed by General
Electric patent [16]. The white speckles at the background of Fig. 2.6(b) are the resultant
artifacts.
ATTENTION: The Singapore Copyright Act applies to the use of this document. Nanyang Technological University Library

24
Fig. 2.6. Point phantom images (a) without dynamic focusing artifacts, (b) with dynamic
focusing artifacts.
For a single-bit sigma-delta modulator, the higher the density of +1 present in the digital
output, the higher the value of its reconstructed value will be. Since the value of the
reconstructed digital output does not depend only on a single sample but also on the
neighbouring samples, any sample insertion to sigma-delta modulator output will cause
amplitude distortion in addition to signal stretching. Hence, when dynamic focusing is
performed, post-delay reconstruction SDBF will produce artifacts. Such problem does
not exist in multi-bit ADC beamforming, which will be discussed in Chapter 3.
Repeating a sample is feasible in such case. Several techniques have been proposed to
handle the dynamic focusing artifact problem suffered by SDBF, and they are discussed
in the following sections.
2.5.1 Insert zero, divide-by-two and compensated SDBF
Freeman et al. brought up this dynamic focusing issue for sigma-delta post-delay
reconstruction beamforming in 1999 [17], [24], [28]. Three methods were proposed to
correct the artifacts: insert-zero, divide-by-two, and compensated sigma-delta
modulator. For all these 3 methods, extra logic circuitries have to be introduced to detect
sample repetition so that the artifacts can be corrected.
(b) (a)
ATTENTION: The Singapore Copyright Act applies to the use of this document. Nanyang Technological University Library

25
Insert-zero method replaces the repeated samples with zeros, whenever repetition is
detected. On the other hand, the sample is first divided by two before it is repeated for
divide-by-two method. The principle of these two methods is to avoid inserting extra
energy to the sample stream so that the average value of the sample stream will not be
altered. They are illustrated in Fig. 2.7. The extra samples inserted are circled by the
dotted line.
Fig. 2.7. The output digital sample in a channel (a) before dynamic focusing, (b) after dynamic
focusing, (c) after insert zero correction scheme, (d) after divide-by-two correction scheme.
The third method, compensated sigma-delta modulator, doubles the feedback signal of
the modulator whenever a sample is being repeated. Thus, the extra energy injected due
to sample repetition is taken into account by the modulator.
ATTENTION: The Singapore Copyright Act applies to the use of this document. Nanyang Technological University Library

26
All these 3 methods have limited performance. They cannot correct the artifact problem
when the delay is updated more frequently at near field.
2.5.2 Insert +1 -1 method
Following the proposal of Freeman et al., Rigby developed a patent to further improve
the insert zero method [29]. As a zero level is introduced, insert-zero method requires an
extra bit during the summation of the signals from all the channels. To avoid the extra
bit, Rigby inserts +1 and -1 instead of zero when a sample is to be repeated. However,
the insertion of two samples at a time degrades the delay resolution to twice the
sampling period. Another way suggested in the patent is to insert +1 in one channel and
-1 in the complementary channel so that the sum of them produces the same result as
inserting zeros. This method does not suffer from delay resolution degradation.
The same technique was published by Li et al. in the same year when the patent was
filed [30]. In addition, Rigby also proposed a method that always inserts +1 when a
sample is to be repeated. The number of +1 is counted and then subtracted during the
beam-summation stage. Equivalent result as insert-zero method is obtained.
Just as insert-zero method, the insert +1, -1 method is not able to correct the artifact
properly when the samples are repeated more frequently at near field.
2.5.3 Non-uniform sampling method
Instead of performing the sample selection after sigma-delta modulation, there is another
way to delay the signal in the analog domain. Non-uniform sampling samples the analog
signal of each channel according to the corresponding delay profile before sending them
ATTENTION: The Singapore Copyright Act applies to the use of this document. Nanyang Technological University Library

27
to the sigma-delta modulators. As a result, the input to the modulator of each channel is
actually the delayed version. However, if a sample is to be repeated, the clock frequency
of the sampling circuit has to be doubled in order to obtain that extra sample. Such a
high frequency is difficult to realize in practice. Karaman et al. suggested a way to avoid
sample repetition while using non-uniform sampling [21], [31], [32]. Only sample
dropping is needed in this case, which can easily be realized by deactivating the
sampling clock when the sample is to be dropped.
Non-uniform sampling beamformer uses two different clock frequencies for sampling
and delay update. As shown in (2.7), the delays can be calculated as
c
Rx
xR
t
nn
n
+−
≈2cos
sin22
1
θθ
(2.9)
and
c
RRx
xRR
t
nn
n
∆++−∆+
≈)(2
cossin
22
2
θθ
(2.10)
for two consecutive delay update instant. The difference between them is
( )
∆+∆
−∆≈∆RRR
RxR
ct n
2cos2 22 θ (2.11)
The minimum of this difference occurs when
( ) ( )
∆+−=
∆+∆
−∆≈∆RRR
xfRRR
RxR
ct n
BF
n 12
11
22 2
max2
maxmin
(2.12)
ATTENTION: The Singapore Copyright Act applies to the use of this document. Nanyang Technological University Library

28
In order to avoid sample repetition, the sampling period has to be smaller than the
minimum delay difference. Thus,
( )
∆+−≤
RRRx
ffn
BFS
12
111 2
max (2.13)
( )
∆+−
≥
RRRxf
f
nBF
S
12
1
12
max
(2.14)
By assuming R>>∆R, (2.14) can be further simplified to
18
82
2
−≥
num
num
BF
S
ff
ff
(2.15)
where fnum is the f-number introduced in Section 2.1. If the f-number is always kept to
the optimal value of 2, the sampling frequency needs to be only 1.04 times of the
beamforming frequency to avoid sample repetition.
However, this technique needs to have a second master clock to control the
beamforming frequency. It is difficult to accurately design two clocks whose
frequencies are not the multiple of each other.
2.5.4 Block-based sigma-delta beamforming
The dynamic focusing artifacts mentioned above are present only in post-delay
reconstruction beamforming. A direct way to avoid it is by using pre-delay
reconstruction beamforming. Intuitively, the hardware cost seems to increase a lot as a
reconstruction filter is needed for each channel. However, due to the 1 bit property of
ATTENTION: The Singapore Copyright Act applies to the use of this document. Nanyang Technological University Library

29
the digital signal in every channel, the reconstruction filter can be realized using only
accumulator. Multipliers are not essential. Han et al. proposed a simpler hardware
realization for pre-delay reconstruction type beamforming [33-35], known as block-
based SDBF. A block of samples is first selected according to the delay profile and then
reconstructed with filter of equal length. The filter is realized using an accumulator
which adds or subtracts the filter coefficients as illustrated in Fig. 2.8.
Supposed the number of samples in each block is L, the operating frequency of the
accumulator is MfS, and the output data rate of the accumulator group is decimated to fS
which has to be greater than Nyquist rate, then the number of accumulators needed for
each channel, N, will be L/M. L is normally quite large as high performance filter is
needed to get rid of the high frequency quantization noise of sigma-delta modulator
output. Hence, large number of accumulators is required for each channel.
Fig. 2.8. Block-based sigma-delta beamformer.
ATTENTION: The Singapore Copyright Act applies to the use of this document. Nanyang Technological University Library

30
2.6 Summary
The comparison among all these methods discussed is summarized in Table 2.1. The
insert-zero, divide-by-two, compensated sigma-delta modulator and non-uniform
oversampling methods need only simple hardware implementation to correct the
dynamic focusing artifact problem. However, the correction performance is limited. The
first 3 methods still suffer from the artifact problem when the delay update is frequent
especially at the near field, whereas the noise floor of the non-uniform sampling method
is higher than other methods.
The only correction technique that can provide complete dynamic focusing artifact
correction is the block-based method. However, extra adders and filter coefficient
memory needed are still hinders to single-chip integration.
ATTENTION: The Singapore Copyright Act applies to the use of this document. Nanyang Technological University Library

31
Table 2.1. Comparison of delta-sigma dynamic focusing artifact correction schemes.
Insert zero (or 1 -1)
Divide-by-two
Compensated SDM
Non-uniform oversampling
Block-based SDBF
Image Quality
Artifacts at near field
Better than all except block-based SDBF
Artifacts at near field
Slightly higher noise floor
Complete correction
Control logic
Additional logic to determine sample repetition
Additional logic to determine sample repetition
Additional logic to determine sample repetition
Dynamic aperture
Additional logic to select accumulators and sign of filter coeff.
Clock frequency
1 master clock frequency
1 master clock frequency
1 master clock frequency
2 master clock frequencies
1 master clock frequency
Hardware
# 2-bit input adder for insert zero
# 3-bit input adder
# Additional amplifier in modulator feedback loop
# Additional multiplexer in modulator feedback loop
# Additional hardware imposed by extra master clock
# No other additional hardware except LUT for delay profile
# Accumulators, multiplexers are used for each channel
# Longer delay registers
# No multipliers needed for filtering
# Multi-bit adder works at lower frequency
Pros
Simple hardware
Simple hardware
Simple hardware
No additional processing hardware required
Complete artifact correction
Cons
Artifacts at near field
Artifacts at near field
Artifacts at near field
Slightly higher noise floor
More complicated hardware
ATTENTION: The Singapore Copyright Act applies to the use of this document. Nanyang Technological University Library

32
C h a p t e r 3
DYNAMIC FOCUSING ARTIFACTS
Due to the high sampling frequency of SDBF, sufficient delay resolution can be
achieved directly with delay-and-sum approach. Delay-and-sum beamforming method
selects a sample in each channel according to the quantized delay profile. A dynamic
delay is realized by repeating a sample. However in SDBF, when some sigma-delta
modulator output samples are repeated, signal cannot be reconstructed properly and
artifacts will be introduced in the final image. The author did simulations by introducing
sample repetition to show the artifacts due to dynamic focusing. This effect was shown
in Fig. 2.6 where Fig. 2.6(a) and (b) show a point phantom with and without dynamic
focusing artifacts, respectively.
In order to find out the cause of the dynamic focusing artifacts, the operation of the
sigma-delta modulator was studied and it is presented in Section 3.1. Following that, the
effect of sample repetition upon sigma-delta modulated signal is analyzed in Section 3.2.
The analysis shows that when samples are repeated, some amount of the out-of-band
noise present in the original signal is shifted into the signal band, which causes the
artifact problem. Conventional multi-bit beamformer does not suffer from dynamic
focusing artifact problem because its out-of-band quantization noise level is low
ATTENTION: The Singapore Copyright Act applies to the use of this document. Nanyang Technological University Library

33
whereas sigma-delta modulated signal contains large quantization noise in high
frequency band.
3.1 Sigma-delta modulator
Sigma-delta modulator is able to achieve high signal-to-quantization noise ratio (SQNR)
using low bit resolution by oversampling the input analog signal and noise shaping. The
short bit-length output allows simpler beamforming hardware realization and
integration. The high sampling rate is able to provide high delay resolution as well as
high SQNR.
Single-bit 2nd-order sigma-delta modulator has been generally selected for ultrasound
beamforming application [24], [30] because any single-bit sigma-delta modulators
higher than 2nd-order are not inherently stable.
3.1.1 Sinusoidal input
In practice, a single-bit 2nd-order sigma-delta modulator is implemented as shown in
Fig. 3.1.
Fig. 3.1. Practical single-bit 2nd-order sigma-delta modulator.
ATTENTION: The Singapore Copyright Act applies to the use of this document. Nanyang Technological University Library

34
The two delay integrators in this structure can be easily realized with switched capacitor
circuits [36]. The signal transfer function (STF) and the noise transfer function (NTF) of
such structure is shown in (3.1).
)()1()()( 212 zEzzUzzY −− −+= (3.1)
where Y(z) is the output, U(z) is the input, and E(z) is the quantization error.
Signal-to-quantization noise ratio (SQNR) of a multi-bit 2nd-order sigma-delta
modulator can be calculated using the equation:
)log509.1276.102.6( OSRNSQNR b +−+= dB (3.2)
where Nb is the number of bits, OSR is the oversampling ratio [37]. The expression is
derived based on the assumptions that
(i) the probability of quantization noise is uniformly distributed from –LSB/2 to
+LSB/2 (without overloading the quantizer),
(ii) the quantization noise is white noise,
(iii) input signal is a full scale sine wave,
(iv) oversampling ratio (OSR) >> 1 [38-40].
On the other hand, the SQNR for single-bit 2nd-order sigma-delta modulator is
)log509.1276.1( OSRSQNR +−= dB (3.3)
ATTENTION: The Singapore Copyright Act applies to the use of this document. Nanyang Technological University Library

35
The expression is without the 6.02Nb term because the noise is distributed between
–LSB to +LSB in this case, which is different from the assumption (i). Simulation using
MATLAB 7.0 has shown a compatible result with the theoretical calculation as shown
in Fig. 3.2. The SQNR degradation at large input level is due to the non-linear gain of
the quantizer.
Fig. 3.2. Output SQNR vs. input level of a single-bit 2nd-order sigma-delta modulator with OSR=16.
While the compatibility of the simulation result has implied that the theoretical equation
is valid for sinusoidal input despite the assumption that the quantizer is not overloaded is
violated [40], the validity of the equation for ultrasound input will be examined in the
next section. To the author’s knowledge, verification of the theoretical calculation for
wideband ultrasound signal (whose relative bandwidth, the ratio of bandwidth to 2 times
center frequency, is greater than 0.01) has not been done in spite of the extensive study
using single-tone input signal.
ATTENTION: The Singapore Copyright Act applies to the use of this document. Nanyang Technological University Library

36
3.1.2 Ultrasound input
Signal-to-quantization noise ratio (SQNR) for wideband input signal cannot be obtained
simply from the output spectrum of the modulator because the signal power is not a
single frequency component. Instead, it spreads over a wide range of frequency, causing
the calculation of noise power over that of the frequency range to be impossible. Hence,
the signal and noise power are obtained separately.
Suppose y(t) = u(t) + e(t), where y(t) is the output, u(t) is the input signal, and e(t) is the
quantization error. Power of the output
dttetetutuT
dttyT
PyT
T
T
T ∫∫ −−++== 2
2
222
2
2 )()()(2)(1
)(1 (3. 4)
If the term dttetuT
T
T∫−2
2
)()(21
is equal to zero, then the output power will be equal to the
summation of input signal power and the noise power. The magnitude of this correlation
term can be expressed in terms of correlation coefficient.
Fig. 3.3. Ultrasound signal with centre frequency at 3.5MHz and fractional bandwidth of 0.6.
ATTENTION: The Singapore Copyright Act applies to the use of this document. Nanyang Technological University Library

37
Ultrasound signal shown in Fig. 3.3 with centre frequency at 3.5MHz and fractional
bandwidth of 0.6 is used as the input signal to the single bit 2nd-order sigma-delta
modulator in the simulation. With an OSR of 16, the correlation coefficient, rcor,
between the input signal and the quantization error was calculated as
003.0=×
=eu
uecor
RR
Rr (3. 5)
where ∑=SN
ue nenuR1
][][ , ∑=SN
u nuR1
2 ][ , ∑=SN
e neR1
2 ][ , and the number of samples NS
is 243 which is over one period of the signal. As the correlation coefficient is small, the
output power of the sigma-delta modulator can be approximated as the summation of
input signal power and quantization noise power.
3.1.3 Simulation results
Time domain quantization error was obtained by
),()()( tutyte −= (3. 6)
and Fig. 3.4 shows the power spectra of e(t) and u(t) with input peak value of -4dBFS.
ATTENTION: The Singapore Copyright Act applies to the use of this document. Nanyang Technological University Library

38
Fig. 3.4. Signal and quantization noise spectra with an input level of -4dBFS.
Signal-to-quantization noise ratio (SQNR) with OSR of 16 and 32 are depicted in
Fig. 3.5, where OSR in this case is the ratio of the sampling frequency to twice the
highest frequency component of the signal.
Fig. 3.5. SQNR vs. input level of a single-bit 2nd-order sigma-delta modulator with ultrasound
input signal.
ATTENTION: The Singapore Copyright Act applies to the use of this document. Nanyang Technological University Library

39
The simulated SQNR versus peak signal level of the ultrasound input signal presented in
Fig. 3.5 tallies with the theoretical calculation of
)5.0/log(10log509.1276.1 SOSRSQNR ++−= , (3. 7)
where the 0.5 is the power of a full scale sinusoidal waveform, S is the ultrasound signal
power. There exists similar SQNR degradation when the input peak level approaches
full scale value for both OSR of 16 and 32. The required OSR for a 2nd-order sigma-
delta modulator with ultrasound input signal can be estimated using the theoretical
equation as well. With an OSR of 16, a 2nd-order sigma-delta modulator achieves an
equivalent number of bits (ENOB) that is better than 7.
3.1.4 Challenges
Sigma-delta modulators are more robust against analog circuit mismatches [21] but they
require oversampling to achieve sufficient signal resolution. Therefore, they are
normally employed for low frequency and high resolution application. The incorporation
of sigma-delta modulators in ultrasound beamformer is a high frequency, low resolution
application. It violates the usual application of sigma-delta modulators in exchange for
the ease of signal synchronization among the beamforming channels. Although sigma-
delta modulators underperform in beamforming application, two basic aims are
achieved: sufficient delay resolution and sufficient signal resolution.
Due to the high frequency of ultrasound signal for medical imaging which is centered at
3.5MHz with fractional bandwidth of 0.6, the required sampling rate of the 2nd-order
sigma-delta modulator may be as high as 160MHz for an OSR of 16. To the author’s
ATTENTION: The Singapore Copyright Act applies to the use of this document. Nanyang Technological University Library

40
knowledge, the highest speed sigma-delta modulators available commercially are
ADS1610 and AD9860/9862 with sampling rate of 60MHz and 64MHz respectively.
Although there are only a few research papers addressing the design of CMOS sigma-
delta modulators which can operate at frequency higher than 100MHz with tested results
[41-43], nevertheless along with the development of micro-electronic technology, the
design of a high speed sigma-delta modulator for ultrasound imaging application can be
envisaged.
3.2 Sample repetition
During dynamic focusing beamforming process, samples will be repeated according to
the delay profile. When a discrete time signal goes through a sample repetition process,
the signal is delayed and stretched at the same time. If the samples are repeated at a
constant sample interval, m, the signal can be expressed as
...]13[][
]12[][
]1[][)(
)23(13
2
)2(
)12(12
)1(
1
0
+−++
−++
−+=
+−−
=
+−
+−−
=
+−
−−
=
−
∑
∑
∑
mm
mn
n
mm
mn
n
mm
n
n
zmxznx
zmxznx
zmxznxzX
(3.8)
∑ ∑−
=
−+
=
++−+− −++=1
0
1)1())1(()( ]1)1[(][)(
mN
k
mk
kmn
kmkkn zmkxznxzX (3.9)
∑ ∑−
=
−+
=
+−++− +−+=1
0
1)1()())1(( ][]1)1[()(
mN
k
mk
kmn
knkmk znxzmkxzX (3.10)
ATTENTION: The Singapore Copyright Act applies to the use of this document. Nanyang Technological University Library

41
∑ ∑−
=
−+
=
−+−− +−+=1
0
1)1()1( ][]1)1[()(
mN
k
mk
kmn
nmkk znxzmkxzzX (3.11)
Assuming that ]1[][]1[ +≈≈− kxkxkx , this is true when oversampling is applied.
Then
∑ ∑−
=
−+
=
−+−− ++≈1
0
1)1()1( ][])1[()(
mN
k
mk
kmn
nmkk znxzmkxzzX
(3.12)
∑ ∑−
=
+
=
−−≈1
0
)1(
][)(m
N
k
mk
kmn
nk znxzzX (3.13)
∑ ∑−
= =
+−− +≈1
0 0
)( ][)(m
N
k
m
p
pkmk zpkmxzzX (3.14)
∑ ∑−
= =
++−+≈1
0 0
])1([][)(m
N
k
m
p
pmkzpkmxzX (3.15)
Let
pmkl ++= )1( (3.16)
Then
lN
l
zklxzX −
=∑ −≈ ][)(
0
(3.17)
lN
l
zm
llxzX −
=∑
+
−≈ ]1
[)(0
(3.18)
lN
l
zm
lreml
mm
xzX −
=∑ +
++
≈ ])1
()1
[()(0
(3.19)
ATTENTION: The Singapore Copyright Act applies to the use of this document. Nanyang Technological University Library

42
As the remainder of l divided by m+1 is always smaller than 1, hence
lN
l
zlm
mxzX −
=∑ +
≈ ])1
[()(0
(3.20)
The spectrum of the repeated sample signal as described by (3.20) is like the spectrum of
the original signal being compressed to a frequency band that is 1+mm of the original
fundamental spectrum and it would be repeated every cycle of the sampling frequency
fS. In other words, the noise at 1+mifS (where i is an integer and 10 +≤≤ mi ) would
be shifted to DC. For example, if the samples are repeated every 3 sample interval, noise
at 41 fS, 4
2 fS, 43 fS, and fS would be shifted to DC. This is illustrated in Fig 3.6, where
Fig 3.6(a) shows the original spectrum before repetition and Fig 3.6(b) shows the
spectrum after repetition every m samples. Such a process can also be modeled as non-
uniform sampling process discussed in [44], where the period of the non-uniform
sampling is m+1. Spurious spectra will be created at integer multiple of 1sf
m + .
ATTENTION: The Singapore Copyright Act applies to the use of this document. Nanyang Technological University Library
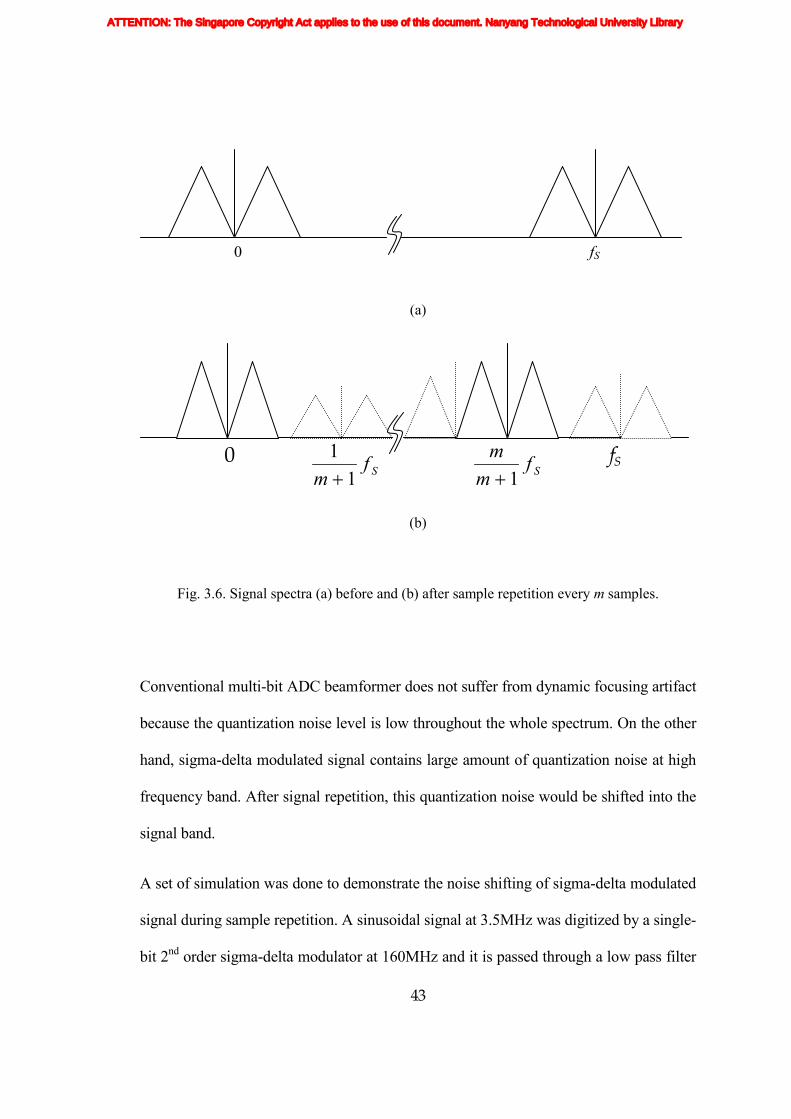
43
(a)
(b)
Fig. 3.6. Signal spectra (a) before and (b) after sample repetition every m samples.
Conventional multi-bit ADC beamformer does not suffer from dynamic focusing artifact
because the quantization noise level is low throughout the whole spectrum. On the other
hand, sigma-delta modulated signal contains large amount of quantization noise at high
frequency band. After signal repetition, this quantization noise would be shifted into the
signal band.
A set of simulation was done to demonstrate the noise shifting of sigma-delta modulated
signal during sample repetition. A sinusoidal signal at 3.5MHz was digitized by a single-
bit 2nd order sigma-delta modulator at 160MHz and it is passed through a low pass filter
0 fS Sf
m 11+ Sf
mm
1+
0 fS
ATTENTION: The Singapore Copyright Act applies to the use of this document. Nanyang Technological University Library

44
with cutoff frequency at )1( +mfS , where m is the sample repetition interval that is
applied on the signal. The spectrum of the signal after going through the low pass filter
is shown in the dotted lines whereas the spectrum after repeating by m sample interval is
shown in the solid lines of Fig. 3.7.
As shown, when the samples are repeated at a constant rate, it is possible to band limit
the signal before hand to avoid signal corruption. However, when samples are repeated
dynamically, noise at different frequency band would be shifted into the signal band and
corrupt the signal. Hence, by reducing the out-of-band noise of the pre-delay signal, the
dynamic focusing artifacts can be reduced.
ATTENTION: The Singapore Copyright Act applies to the use of this document. Nanyang Technological University Library

45
(a)
(b)
(c)
Fig. 3.7. Signal spectra before and after sample repetition when samples are repeated every (a) 2 samples, (b) 3 samples, (c) 10 samples.
ATTENTION: The Singapore Copyright Act applies to the use of this document. Nanyang Technological University Library

46
3.3 Time domain analysis
Sample repetition inserts extra noise, which is not properly shaped by the noise shaping
function. A set of simulations was carried out to study the effect of quantization noise on
dynamic focusing artifacts, and the results are shown in Fig. 3.8. For these simulations, a
radio frequency (RF) signal consisting of a 0.6 fractional bandwidth, 3.5MHz Gaussian
pulse with -50dB white noise was used. The RF signal was digitized at 111MHz using a
single bit 2nd-order low pass sigma-delta modulator and reconstruction was done using a
160-tap low pass finite impulse response (FIR) filter. Higher order sigma-delta
modulator provides better bit resolution but a 2nd-order sigma-delta modulator was
utilized because any single-bit sigma-delta modulators higher than 2nd order are not
inherently stable [39].
Fig. 3.8(a) shows the normalized waveform of the RF signal after it goes through sigma-
delta modulation, reconstruction, single sample repetition (every 50 sample interval),
and then envelope detection in sequence. On the other hand, Fig. 3.8(b) shows the
normalized waveform of the RF signal after it goes through the sequence of sigma-delta
modulation, single sample repetition (every 50 sample interval), reconstruction, and
envelope detection.
ATTENTION: The Singapore Copyright Act applies to the use of this document. Nanyang Technological University Library

47
(a)
(b)
Fig. 3.8. RF signal waveform after going through (a) sigma-delta modulation, reconstruction, sample repetition, and envelope detection in sequence, (b) sigma-delta modulation, sample
repetition, reconstruction, and envelope detection in sequence.
The peak signal-to-noise ratio (PSNR) of the two cases can be obtained from the results
in Fig. 3.8 as the ratio of the peak signal power to the average noise floor level [45]. The
ratio is based on the assumption that the signal distortion (noise floor) is low compared
to the signal power. The PSNR of the two cases are respectively 45dB and 28dB for an
ATTENTION: The Singapore Copyright Act applies to the use of this document. Nanyang Technological University Library

48
average of 5 runs. It demonstrates that sample repetition before signal reconstruction
increases the noise floor of the final output. In practice, since the sample repetition rate
is different along the imaging depth, the increment of noise floor will be different along
the imaging depth.
In order to study the effect of sample repetition at different pre-delay quantization noise
level, an additional 160-tap low pass FIR filter was inserted into the simulation setup as
the adjustable 1st filter shown in Fig. 3.9 to adjust the quantization noise level before
sample repetition.
Adjustable 1st filter
Analog signal
SDM signal
Multi-bit signal
Envelope-detectedsignal
SD modulation
sample repetition
2nd reconstructionfilter
Envelope detection
Pre-delaySQNR
PSNR
Fig. 3.9. Simulation setup that investigates the effect of pre-delay SQNR on PSNR.
ATTENTION: The Singapore Copyright Act applies to the use of this document. Nanyang Technological University Library

49
The signal now goes through sigma-delta modulation, adjustable 1st filter, sample
repetition, 2nd reconstruction filter and then envelope detection. By adjusting the out-of-
band attenuation of the 1st filter, we can obtain a pre-delay signal with different amount
of quantization noise. The PSNR value of the envelope-detected signal after 2nd
reconstruction filter was plotted against the pre-delay signal-to-quantization noise ratio
(SQNR) of the signal after 1st filter for different sample repetition rates, as shown in
Fig. 3.10.
Fig. 3.10. Single channel PSNR obtained against different pre-delay SQNR at different sample
repetition rates.
As shown in Fig. 3.10, when the sample repetition is less frequent, PSNR is higher. In
addition, as the pre-delay SQNR increases, the PSNR achieved at that channel after
sample repetition increases as well. It shows the pre-delay quantization noise level
affects the degree of dynamic focusing artifacts. The lower the quantization noise level,
the lower is the dynamic artifacts caused by sample repetition. Fig. 3.10 also shows that
ATTENTION: The Singapore Copyright Act applies to the use of this document. Nanyang Technological University Library

50
when the pre-delay SQNR is high, the increment of PSNR with respect to pre-delay
SQNR will becomes gradual. Further increment of the pre-delay SQNR hardly improves
the PSNR. It is therefore not necessary to fully reconstruct the signal before delay-and-
sum process while performing partial reconstruction is sufficient.
3.4 Frequency domain analysis
Another set of frequency domain simulation was carried out to study the effect of
dynamic focusing on the spectrum of sigma-delta modulated signal. A similar
simulation setup to Fig. 3.9 was utilized. However, in this simulation samples were
repeated dynamically to model according to the delay profile at the outermost channel of
a 64-channel beamformer.
The input signal is a pre-compressed waveform which when properly delayed according
to the dynamic delay profile will be a single tone sinusoidal wave at 3.5MHz. The input
signal was digitized using a 2nd order low pass modulator at 160MHz. The frequency
spectra of the sigma-delta modulated signal before and after the dynamic delay without
applying any pre-delay filtering are shown in Fig. 3.11(a). When an 8-tap boxcar filter is
used as the pre-delay filter, the frequency spectra of the signal before and after the
dynamic delay are as shown in Fig. 3.11(b).
ATTENTION: The Singapore Copyright Act applies to the use of this document. Nanyang Technological University Library

51
(a)
(b)
Fig. 3.11. Frequency spectra of sigma-delta modulated signal before and after dynamic delay when (a) no pre-delay filtering is utilized, (b) when 8-tap boxcar filter was utilized as pre-
delay filter.
As shown in Fig. 3.11(a), besides the compression and shifting of the signal frequency,
the noise power at low frequency increases significantly and no noise shaping function
ATTENTION: The Singapore Copyright Act applies to the use of this document. Nanyang Technological University Library

52
is observed after dynamic delay is applied. The low frequency noise causes image
artifacts as it cannot be removed by the low pass reconstruction filter. On the other hand,
when an 8-tap boxcar filter is utilized before delay, the noise level caused by dynamic
delay is 20dB lower as compared to the previous case without any pre-delay filtering.
The frequency domain analysis again justifies that reducing pre-delay quantization noise
can alleviate the dynamic focusing artifacts.
Based on the findings, a SDBF based on cascaded reconstruction was proposed and
developed, which will be discussed in Chapter 4.
ATTENTION: The Singapore Copyright Act applies to the use of this document. Nanyang Technological University Library

53
C h a p t e r 4
CASCADED RECONSTRUCTION BASED SIGMA-DELTA BEAMFORMING
Based on the studies of dynamic focusing artifacts in Chapter 3, a cascaded
reconstruction based SDBF has been proposed and developed. The cascaded
reconstruction SDBF utilizes a pre-delay filter to reduce the pre-delay quantization
noise, so that the dynamic focusing artifact problem is suppressed. The selection of the
pre-delay filter depends on the OSR as well as the final image SNR desired. The details
are discussed in this chapter. The relevant work is also reported in [46], [47].
4.1 Beamformer structure
A cascaded reconstruction process for sigma-delta modulation is shown in Fig. 4.1. The
reconstruction of the sigma-delta modulated signal is performed by two filters. The first
filter in Fig. 4.1 is a computationally-inexpensive filter to partially reconstruct the signal,
whereas the second filter fully reconstructs the complete multi-bit signal. Both first and
second filters can be composed of a single stage filter or a set of cascaded filters, as long
as the total filtering effect can successfully reconstructs the signal.
ATTENTION: The Singapore Copyright Act applies to the use of this document. Nanyang Technological University Library

54
Fig. 4.1. Cascaded reconstruction of a sigma-delta modulated bit stream.
The cascaded reconstruction is employed in the developed SDBF, in which the first
filter is applied before dynamic focusing whereas the second filter is applied after delay-
and-sum process, as illustrated in Fig. 4.2.
Fig. 4.2. Block diagram of a SDBF based on cascaded reconstruction.
The analog signal from each receive channel is digitized with a sigma-delta modulator,
and then the first filter is applied to partially reconstruct the intermediate multi-bit data
from the single bit modulator output data. Unlike the sophisticated filters utilized in pre-
delay reconstruction SDBF to fully reconstruct the signal, this first filter can be realized
ATTENTION: The Singapore Copyright Act applies to the use of this document. Nanyang Technological University Library
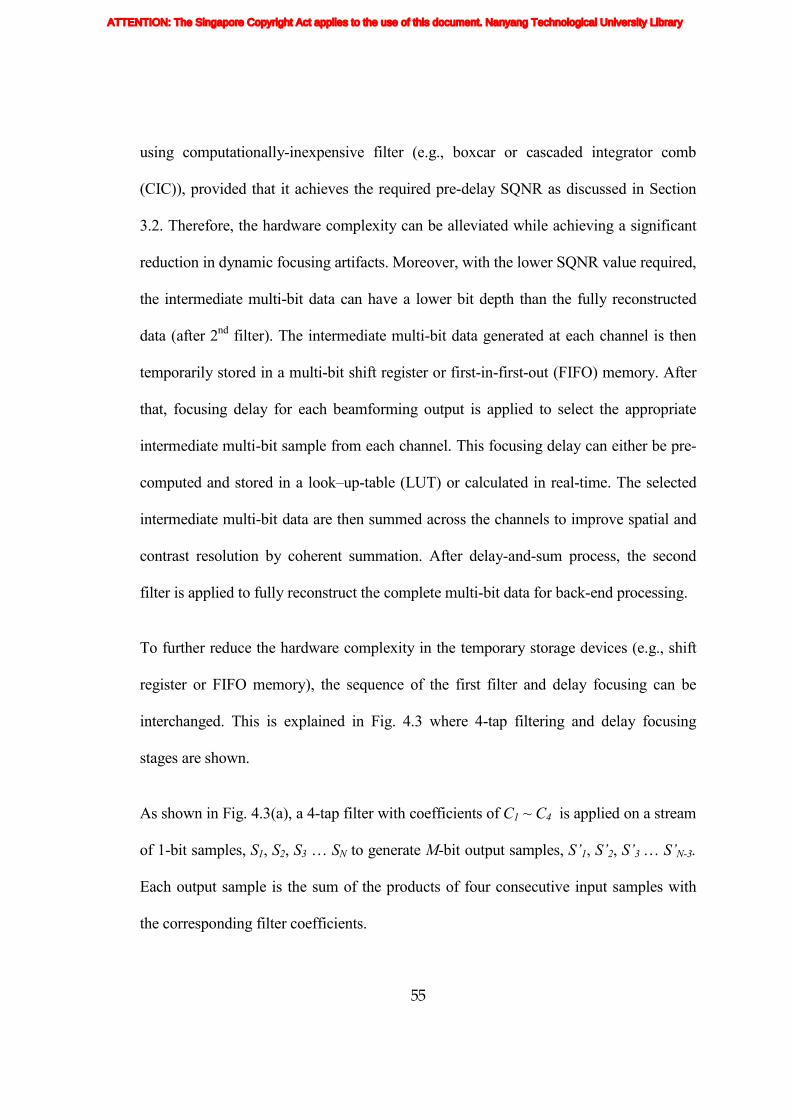
55
using computationally-inexpensive filter (e.g., boxcar or cascaded integrator comb
(CIC)), provided that it achieves the required pre-delay SQNR as discussed in Section
3.2. Therefore, the hardware complexity can be alleviated while achieving a significant
reduction in dynamic focusing artifacts. Moreover, with the lower SQNR value required,
the intermediate multi-bit data can have a lower bit depth than the fully reconstructed
data (after 2nd filter). The intermediate multi-bit data generated at each channel is then
temporarily stored in a multi-bit shift register or first-in-first-out (FIFO) memory. After
that, focusing delay for each beamforming output is applied to select the appropriate
intermediate multi-bit sample from each channel. This focusing delay can either be pre-
computed and stored in a look–up-table (LUT) or calculated in real-time. The selected
intermediate multi-bit data are then summed across the channels to improve spatial and
contrast resolution by coherent summation. After delay-and-sum process, the second
filter is applied to fully reconstruct the complete multi-bit data for back-end processing.
To further reduce the hardware complexity in the temporary storage devices (e.g., shift
register or FIFO memory), the sequence of the first filter and delay focusing can be
interchanged. This is explained in Fig. 4.3 where 4-tap filtering and delay focusing
stages are shown.
As shown in Fig. 4.3(a), a 4-tap filter with coefficients of C1 ~ C4 is applied on a stream
of 1-bit samples, S1, S2, S3 … SN to generate M-bit output samples, S’1, S’2, S’3 … S’N-3.
Each output sample is the sum of the products of four consecutive input samples with
the corresponding filter coefficients.
ATTENTION: The Singapore Copyright Act applies to the use of this document. Nanyang Technological University Library

56
(a)
(b)
Fig. 4.3. Block diagram showing the difference in hardware requirement by applying delay focusing (a) after the first filter, (b) before the first filter.
Beamforming summer
Beamforming summer
ATTENTION: The Singapore Copyright Act applies to the use of this document. Nanyang Technological University Library

57
During the delay focusing stage, one of the output samples is selected according to the
delay information. If S’1 is selected, it is equivalent to selecting the sum of S1×C4, S2×C3,
S3×C2 and S4×C1. Therefore, the same beamforming result can be attained by selecting
the four samples S1, S2, S3, S4 before multiplying with the filter coefficients and
summation as shown in Fig. 4.3(b). As a result, instead of storing the M-bit data, single-
bit data are stored in the temporary storage devices, awaiting to be selected during
dynamic focusing, thereby optimizing the hardware.
Fig. 4.4 shows the block diagram of the cascaded reconstruction SDBF where delay
focusing is performed before the first reconstruction filtering.
Fig. 4.4. Cascaded reconstruction SDBF where delay focusing is performed before the first filtering.
At each instant, K consecutive single-bit input samples are selected by the delay control
from the shift register (or FIFO memory), where K is equal to the length of the first
filter. They are then multiplied with the filter coefficients and summed together along
ATTENTION: The Singapore Copyright Act applies to the use of this document. Nanyang Technological University Library

58
the same channel to obtain the intermediate multi-bit data. To eliminate computationally
expensive multipliers from the beamformer, boxcar filters can be utilized as the first
filters. Thus, it further simplifies the hardware.
4.2 First filter selection
As aforementioned, boxcar filters can be utilized as the first filters to minimize the
hardware complexity. It is desirable to select the boxcar filters to be as simple as
possible while achieving the required image quality. Chapter 3 illustrated that different
pre-delay SQNR are needed before the delay-and-sum process to achieve the required
PSNR after the delay-and-sum process at different sample repetition rates. In practice,
the sample repetition rate is limited as dynamic aperture is usually employed to optimize
focusing at different depths. Optimal focusing occurs when f-number is equal to 2 [19].
The maximum sample repetition rate caused by dynamic focusing was found to be
related to the f-number only. It can be obtained using the time difference, ∆tn, between
two consecutive time of arrival, tn1 and tn2, assuming that the aperture size is small
compared to the focal depth [24],
c
Rx
xR
cR
t
nn
n
+−
+≈2cos
sin22
1
θθ
(4.1)
c
RRx
xRR
cRR
t
nn
n
∆++−∆+
+∆+
≈)(2
cossin
22
2
θθ
(4.2)
ATTENTION: The Singapore Copyright Act applies to the use of this document. Nanyang Technological University Library

59
∆+−≈∆
)(1
4cos
122
RRRx
Tt nn
θ (4.3)
where R is the focal depth, c is the speed of sound, xn is the distance between the nth
element to the centre of the active transducer aperture, θ is the steering angle, T is the
sampling period which is equal to cR
2∆ . When R is much larger than ∆R, the minimum
time difference is
−=
−≈∆ 22
2max
min 161
11
41
num
nn f
TR
xTt (4.4)
where f-number is equal to max2 nx
R .
The minimum number of sample interval, mmin, between two occurrences of sample
repetition can be calculated as
2min 16 numf
tTT
m =∆−
= (4.5)
Hence, when f-number is 2, samples will be repeated at the maximum rate of every 64
samples.
The required pre-delay SQNR and achievable PSNR (per channel) when samples are
repeated every 64 samples were obtained by repeating the simulations described in
Section 3.2 at different oversampling frequencies (OSR, which is defined as B
Sf
f2 ,
where fS is the sampling frequency and fB is the signal bandwidth). The same RF signal
ATTENTION: The Singapore Copyright Act applies to the use of this document. Nanyang Technological University Library

60
as described in Section 3.2 which consists of a 0.6 fractional bandwidth, 3.5MHz
Gaussian pulse was used. White noise was inserted at a level 10dB lower than the
theoretical dynamic range (DR) of a 2nd order sigma-delta modulator, which can be
calculated using
4
5
2)(15
πOSR
DR = (4.6)
assuming the input as a sine wave with amplitude of 1 [39].
The average maximum PSNR and the -3dB corner SQNR (at which the PSNR achieved
is 3dB below the maximum value) for 10 runs of the repeat-every-64-sample simulation
are plotted against the OSR as in Fig. 4.5. They are denoted as the achievable PSNR and
required pre-delay SQNR. As the noise floor of the normalized envelope-detected RF
signal is dominated by the quantization noise of the modulator output, the PSNR will be
equal to the SQNR of the modulator output, which is also the dynamic range (DR) of the
modulator.
The same simulation was carried out under the same condition but with the 1st adjustable
filter in Fig. 3.9 be replaced by a 4-tap, 8-tap, 16-tap and 32-tap boxcar filter
respectively to find the suitable OSR range for each of them to be applied. The pre-delay
SQNR achieved by different filters under different OSR are plotted in Fig. 4.5 as well.
ATTENTION: The Singapore Copyright Act applies to the use of this document. Nanyang Technological University Library

61
Fig. 4.5. Required pre-delay SQNR at different OSR and the corresponding achievable PSNR per channel after beamforming.
Fig. 4.5 shows that when OSR is below 9, 4-tap boxcar filter is sufficient to provide the
required pre-delay SQNR for the beamformer to achieve -3dB PSNR value. The pre-
delay SQNR achieved by 32-tap boxcar filter shows two notches at OSR of 6 and 11
because the signal falls into notches in its frequency response at frequency which is the
multiples of tapsizefS . For example, 4-tap boxcar filter has notches at 4
Sf , 2Sf ,
43 Sf and fS . When the tap size increases, the number of notches in the frequency
response will increase, more out-of-band quantization noise can be filtered off if the
signal frequency is way below the notches. Hence, using 16-tap boxcar filter as the 1st
ATTENTION: The Singapore Copyright Act applies to the use of this document. Nanyang Technological University Library

62
filter can achieve higher PSNR than using 8-tap boxcar filter and 4-tap boxcar filter for
OSR above 9 as shown in Fig. 4.5.
However, the tap size of the boxcar filter should not be larger than 2 times the value of
OSR otherwise it attenuates the signal. For example when OSR is 10, the tap size should
be smaller than 20. This is the reason of the lower SQNR for 16-tap boxcar filter at OSR
below 8 and for 32-tap boxcar filter at OSR below 16. It should be noted that for OSR
above 17, 32-tap boxcar filter does not really meet the -3dB corner SQNR requirement.
Hence, to obtain a better performance, more sophisticated filter needs to be used.
However, if a boxcar filter is chosen to be utilized for its hardware advantage, 32-tap
size is the best candidate.
Fig. 4.5 provides the condition for the design of OSR and boxcar filter length. For
example, if a 40dB DR per channel is required for a SDBF, the sigma-delta modulator in
each channel needs to run at an OSR of 11 as obtained from the lower graph of Fig. 4.5.
Looking up to the upper graph, the pre-delay SQNR has to be higher than 14dB at OSR
of 11 in order to sufficiently suppress the dynamic focusing artifacts and an 8-tap boxcar
filter is sufficient to achieve the required pre-delay SQNR.
4.3 Results and discussions
The developed cascaded reconstruction SDBF was evaluated using the data acquired by
Biomedical Ultrasonics Laboratory at University of Michigan (available at
http://bul.eecs.umich.edu). The data were collected using Acuson, Mountain View, CA,
ATTENTION: The Singapore Copyright Act applies to the use of this document. Nanyang Technological University Library

63
Model #V328, a 128 element, 3.5MHz commercial transducer for a wire target phantom
consisting of 6 wires in a water tank. The same data was used in [24] and [30].
A typical ultrasound image is displayed in 60dB dynamic range to include echoes
reflected from a typical interface (e.g. liver-fat) as well as the echoes from tissue
scattering [48]. Hence, the transmission and reception sidelobe level cannot be higher
than -30dB each, so that the overall sidelobe level is lower than -60dB, fulfilling the
dynamic range specification. To achieve a maximum average sidelobe level of -30dB for
both transmission and reception (for 128 channel array with rectangular windowing), the
sampling frequency required to achieve sufficient delay resolution can be calculated
using the peak random quantization sidelobe (voltage) level equation in [49]
21
36.4
≈
chfpeak N
ENBWr
SLπ
(4.7)
where ENBW is the equivalent noise bandwidth which is 1 in this case when rectangular
window is used for apodization, rf is the ratio of sampling frequency to signal bandwidth
(which is equal to 2×OSR), and Nch is the number of elements, under the condition that
the error components are uncorrelated from channel to channel. The condition of
random noise (uncorrelated with signal, hence uncorrelated among channels) is true for
sigma-delta modulation when the modulator has an active input [50], which is true for
the case of ultrasound imaging.
For a system with 128 channel array with rectangular windowing, rf is found to be 11
from (4.7). Hence the sampling frequency needs to be at least 11 times higher than the
ATTENTION: The Singapore Copyright Act applies to the use of this document. Nanyang Technological University Library

64
central frequency of the ultrasound signal, equivalent to an OSR of 5.5. For 64 channels,
it would be 16 times higher, and for 32 channels, it would be 22 times higher.
On the other hand, the sampling frequency of sigma-delta beamformer also determines
the DR that can be achieved for the final image. For a 128 channel array with
rectangular windowing, the apodization power gain is
dBw
wG N
nn
N
nn
SNR 21
1
2
2
1 =
=
∑
∑
=
= (4.8)
In order to obtain a total DR of 60dB, the DR needed for each channel is 39dB.
For a single bit 2nd-order sigma-delta modulator, the OSR needed can be estimated using
(4.6). Alternatively, the equation can be expressed in terms of dB as
OSRDR log509.1276.1 +−= (dB) (4.9)
OSR was found to be 10.1 in order to obtain a DR of 39dB. That means the sampling
frequency needs to be at least 20.2 times higher than the signal bandwidth. An OSR of
11 can be selected to fulfill the DR requirement for low resolution handheld machine.
The DR achieved would be 41dB. Hence, for the following simulation, the wire
phantom data were converted into 1-bit data streams using typical single bit 2nd-order
low pass sigma-delta modulators at a sampling frequency of 111 MHz (OSR of 11 for
5MHz bandwidth). Nevertheless, higher OSR can be used to ensure that the quantization
noise is well below input noise level and electronic noise for higher resolution machine.
ATTENTION: The Singapore Copyright Act applies to the use of this document. Nanyang Technological University Library

65
From Fig. 4.5, an 8-tap boxcar filter was chosen as the first filter to provide the required
pre-delay SQNR of 39dB per channel. Three different SDBF techniques (i.e., pre-delay
reconstruction, post-delay reconstruction, and insert-zero) were compared with the
developed method. A 160-tap FIR filter was utilized in the pre-delay reconstruction
method. Post-delay reconstruction for all techniques was performed with a 3rd-order
cascaded integrator-comb (CIC) decimation filter [51], [52] followed by a 30-tap FIR
filter. The 160-tap FIR filter and the CIC decimator cascaded with 30-tap FIR filter can
achieve similar pass-band filter characteristic as shown in Fig. 4.6, thus provide fair
comparison in terms of image quality and practical comparison in terms of hardware.
Fig. 4.6 Frequency responses of 160 tap FIR filter and CIC decimator with 30 tap FIR filter.
The various SDBF techniques were simulated using MATLAB 7.0. The floating point
input data from University of Michigan were interpolated to 111MHz and converted to
single-bit data using a 2nd order sigma-delta modulator described in Fig. 3.1. At each
ATTENTION: The Singapore Copyright Act applies to the use of this document. Nanyang Technological University Library

66
cycle, 128 channels of the sigma-delta modulated data went through the beamforming
process to form a scanline. The simulation was repeated for 192 cycles to obtain 192
scanlines. The brightness information along the scanlines was then extracted through
demodulation process and was matched to the pixel of the final image through scan
conversion process as described in [53]. Rectangular window was utilized for
apodization whereas dynamic aperture was applied at f-number ≥ 2.
The images obtained are shown in Fig. 4.7 with 60dB dynamic range. Axial projection
was plotted alongside to show the different noise levels which are not visually
differentiable from the images.
ATTENTION: The Singapore Copyright Act applies to the use of this document. Nanyang Technological University Library
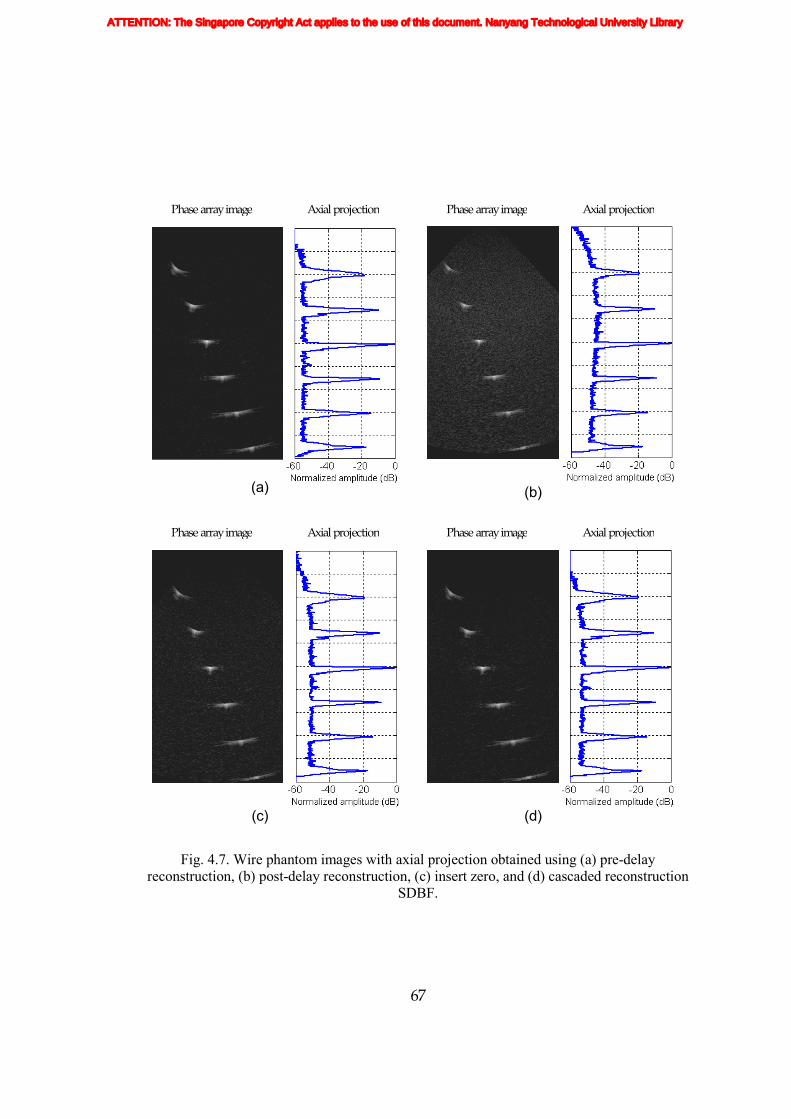
67
Fig. 4.7. Wire phantom images with axial projection obtained using (a) pre-delay reconstruction, (b) post-delay reconstruction, (c) insert zero, and (d) cascaded reconstruction
SDBF.
Phase array image Axial projection
(a) (b)
Phase array image Axial projection
(c)
Phase array image Axial projection
(d)
Phase array image Axial projection
ATTENTION: The Singapore Copyright Act applies to the use of this document. Nanyang Technological University Library
68
As shown in Fig. 4.7, the post-delay reconstruction method (i.e., Fig. 4.7(b)) suffers
from noisy image background due to dynamic focusing artifacts, whereas the other
methods including the developed cascaded reconstruction have cleaner image
background. Comparing Fig. 4.7(c) and (d), the cascaded reconstruction SDBF produces
less background noise than the insert zero method, as supported by the axial projection.
Peak signal-to-noise ratio (PSNR) was calculated from the images based on the ratio of
the peak signal power of the image (which is at the 3rd wire target from top in Fig. 4.8)
to the average background noise within the 3 boxed areas as indicated in Fig. 4.8. The
results obtained for different beamforming techniques are shown in Table 4.1.
Fig. 4.8. Wire phantom image which shows the 3 areas of noise power that are used to calculate the PSNR.
1
2
3
ATTENTION: The Singapore Copyright Act applies to the use of this document. Nanyang Technological University Library

69
Table 4.1. PSNR values of 3 different depths for different beamforming techniques at 111MHz beamforming frequency.
PSNR1(dB) PSNR2(dB) PSNR3(dB)
Pre-delay reconstruction 62.68 62.56 62.62 Post-delay reconstruction 51.74 54.48 55.68
Insert zero 58.79 58.55 58.76 Cascaded
reconstruction using different 1st filters
4-tap boxcar 59.09 59.21 59.50 8-tap boxcar 60.77 60.53 60.79 16-tap boxcar 62.17 62.11 62.07
Table 4.1 shows that at 111MHz, cascaded reconstruction SDBF is able to achieve better
contrast resolution than insert zero method. As mentioned before, boxcar filters have
notches in their frequency response at frequency which is the multiples of tapsizefS .
When the tap size increases, the number of notches in the frequency response will
increase, more out-of-band quantization noise can be filtered off. Hence, using 16-tap
boxcar filter as the 1st filter can achieve higher PSNR than using 8-tap boxcar filter and
4-tap boxcar filter. Table 4.1 also shows that using an 8-tap boxcar filter as the 1st filter,
the largest PSNR difference from pre-delay reconstruction SDBF is at position 2 and it
is only 2.03dB. It is within the 3dB range as predicted from Fig. 4.5.
Another set of cyst phantom data acquired by Biomedical Ultrasonics Laboratory at
University of Michigan was used to evaluate the proposed cascaded reconstruction
SDBF (using 8-tap boxcar filter as the 1st filter) against the same three methods. This
same set of data was also used for comparison by [24] and [30]. The image formed by
the data is shown in Fig. 4.9. The contrast resolution achieved by the different methods
was evaluated for comparison.
ATTENTION: The Singapore Copyright Act applies to the use of this document. Nanyang Technological University Library
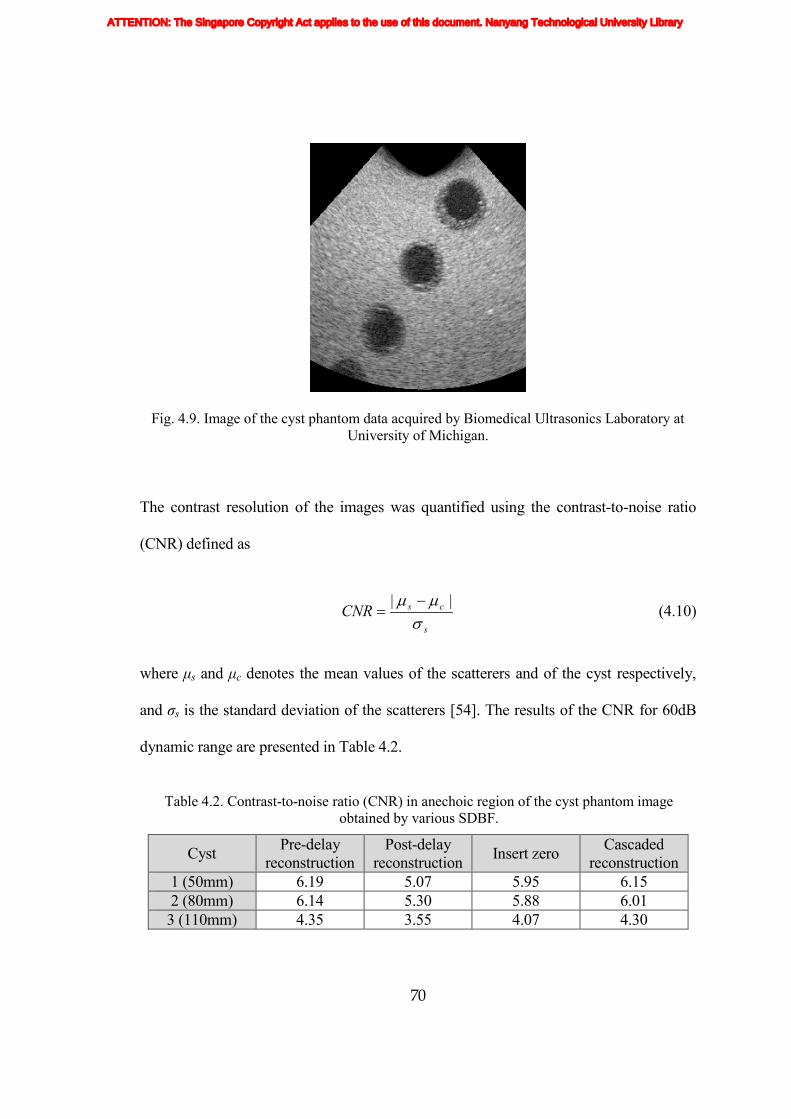
70
Fig. 4.9. Image of the cyst phantom data acquired by Biomedical Ultrasonics Laboratory at University of Michigan.
The contrast resolution of the images was quantified using the contrast-to-noise ratio
(CNR) defined as
s
csCNRσµµ || −
= (4.10)
where µs and µc denotes the mean values of the scatterers and of the cyst respectively,
and σs is the standard deviation of the scatterers [54]. The results of the CNR for 60dB
dynamic range are presented in Table 4.2.
Table 4.2. Contrast-to-noise ratio (CNR) in anechoic region of the cyst phantom image obtained by various SDBF.
Cyst Pre-delay reconstruction
Post-delay reconstruction Insert zero Cascaded
reconstruction 1 (50mm) 6.19 5.07 5.95 6.15 2 (80mm) 6.14 5.30 5.88 6.01 3 (110mm) 4.35 3.55 4.07 4.30
ATTENTION: The Singapore Copyright Act applies to the use of this document. Nanyang Technological University Library
71
The results in Table 4.2, again, indicate that the proposed cascaded reconstruction SDBF
is able to provide better contrast resolution than the insert zero method and the
performance is very close to the pre-delay reconstruction SDBF.
4.4 Hardware estimation
4.4.1 Cascaded reconstruction SDBF
The hardware of the proposed cascaded reconstruction SDBF can also be greatly
simplified compared to pre-delay reconstruction method by having a much simpler filter
in each channel. Table 4.3 shows the hardware comparison for a 64 channel beamformer
with pre-delay reconstruction and cascaded reconstruction (using 8-tap boxcar filter as
1st filter) methods. The number of multipliers needed can be reduced from 5120 (80 per
channel as the filter coefficients are symmetric) to 15 (for the 30-tap FIR filter after CIC
decimator), and the adders can be reduced from 10240 (160 per channel) multi-bit
adders to 64 (1 per channel) 8-input-single-bit adders and 36 multi-bit adders (for CIC
decimator and 30-tap FIR filter).
ATTENTION: The Singapore Copyright Act applies to the use of this document. Nanyang Technological University Library

72
Table 4.3. Number of multipliers and adders for pre-delay reconstruction SDBF and cascaded reconstruction SDBF with 8-tap boxcar pre-delay filter for 64-channel system.
Pre-delay reconstruction Cascaded reconstruction Components Number Components Number
Pre-delay reconstruction filter Multi-bit multipliers 80×64ch = 5120 8-input 1-bit adder 1×64ch = 64
Multi-bit adders 160×64ch = 10240
Post-delay reconstruction filter
Multi-bit multipliers 15
Multi-bit adders 36 Beamforming summer
64-input 8-bit adder 1 64-input 4-bit adder 1
A more thorough hardware synthesis result comparison will be discussed together with
the improved SDBF in Chapter 5.
4.4.2 Delay generator
As SDBF runs at a frequency that is much higher than the conventional beamformer, it
requires delay information to be updated at much higher frequency as well. Hence, the
power consumption and hardware complexity of the delay generator for a SDBF based
ultrasound machine is of great importance as they can affect the overall power
consumption and hardware complexity of the whole machine. This section studies the
three basic delay generation methods including complete lookup table, compressed
lookup table with delta encoding and general parametric algorithm. They were evaluated
and synthesized using Very high speed integrated circuit Hardware Description
Language (VHDL) for a FPGA device Spartan 3E XC3S500E. A comparison among the
ATTENTION: The Singapore Copyright Act applies to the use of this document. Nanyang Technological University Library

73
three delay generation methods on their performances in terms of both logic resource
usage and power consumption is reported in [55].
4.4.2.1 Complete lookup table method
The complete lookup table method is designed to replace the extensive run-time
calculation of instant delay profiles by a simple lookup operation. However, this is done
at the expense of the memory usage due to the storage of the pre-generated delay
patterns for each processing channel. All the delay information necessary for performing
dynamic focusing was pre-calculated according to the beamforming principle presented
in Section 2.4, and stored in complete form into a data structure, usually implemented by
register arrays or read-only memory (ROM) modules. As shown in Fig. 4.10, during
delay update operation, the pre-stored delay values stored in the ROM module are
accessed with read operations according to current focal point index. The ultimate
output of the beamforming control unit takes the form of memory addresses as
applicable delay data such that the desired echo signal samples can be properly selected
from variable length delay lines, which are implemented by using memory elements.
Fig. 4.10. Block diagram of a complete lookup table approach.
Read-only memory module
Read logic
Counter
Reset logic
Reset
Clock
Output data
ATTENTION: The Singapore Copyright Act applies to the use of this document. Nanyang Technological University Library

74
4.4.2.2 Compressed lookup table with delta encoding
The amount of necessary focusing information is large, since delay information for all
receive channels at all focal depths has to be stored. Keeping it in an uncompressed form
requires significant size of memory, and researchers have been working on different
compression approaches for compression since the introduction of digital beamforming.
In order to avoid storing large amount of address data, the delta encoding scheme was
employed to compress the conventional LUT. By applying delta encoding, only the
differences between the delay (index) values instead of the absolute delays were stored
in the lookup table [56]. With the instant increment of focal depth, ∆, specified as half of
the wavelength, λ (λ = c·Ts, where c is the speed of sound and Ts is the sampling period),
the original n-bit-wide delay words can be represented by single bits, thus reducing
effectively the size of the LUT. To recover the n-bit-wide delay addresses, accumulation
operation is incorporated after the read process to add up the address difference stored,
as shown in Fig. 4.11.
Fig. 4.11. Block diagram of the compressed lookup table with delta encoding approach.
Read-only memory module
Counter
Reset logic
Reset
Clock
Output data
Read logic
Register Adder
ATTENTION: The Singapore Copyright Act applies to the use of this document. Nanyang Technological University Library
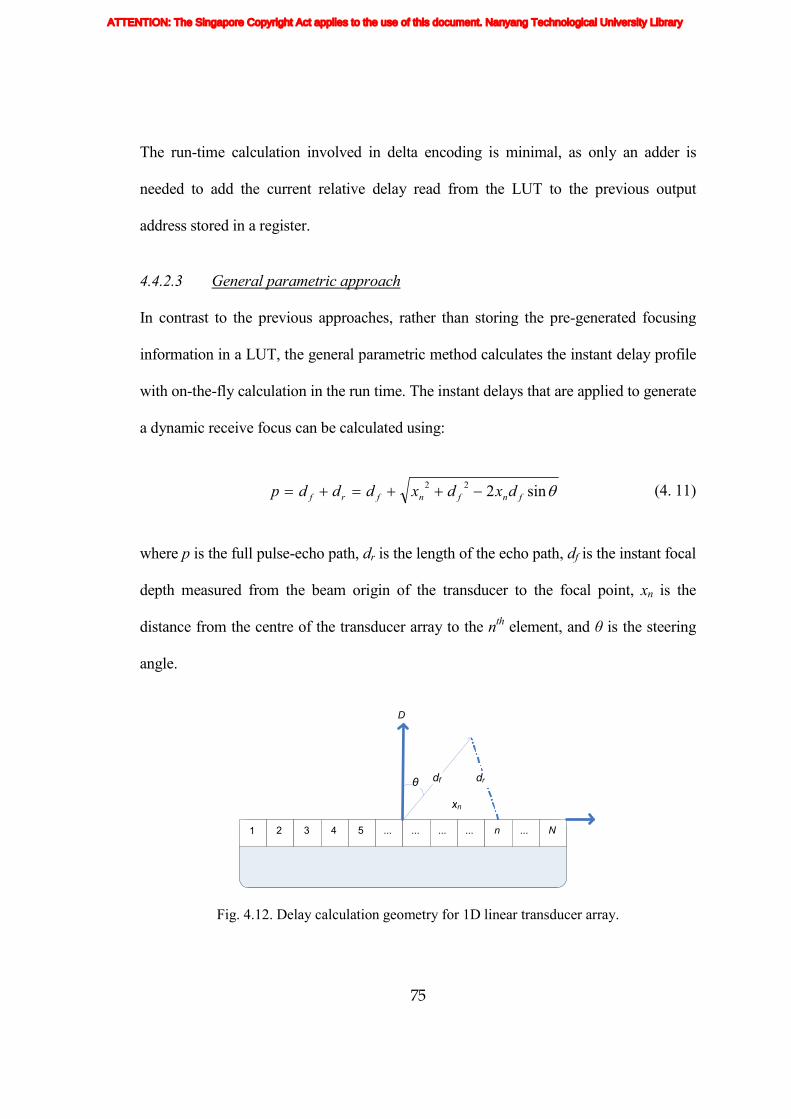
75
The run-time calculation involved in delta encoding is minimal, as only an adder is
needed to add the current relative delay read from the LUT to the previous output
address stored in a register.
4.4.2.3 General parametric approach
In contrast to the previous approaches, rather than storing the pre-generated focusing
information in a LUT, the general parametric method calculates the instant delay profile
with on-the-fly calculation in the run time. The instant delays that are applied to generate
a dynamic receive focus can be calculated using:
θsin222fnfnfrf dxdxdddp −++=+= (4. 11)
where p is the full pulse-echo path, dr is the length of the echo path, df is the instant focal
depth measured from the beam origin of the transducer to the focal point, xn is the
distance from the centre of the transducer array to the nth element, and θ is the steering
angle.
Fig. 4.12. Delay calculation geometry for 1D linear transducer array.
1 2 3 4 5 ... ... ... ... n ... N
df dr
xn
D
θ
ATTENTION: The Singapore Copyright Act applies to the use of this document. Nanyang Technological University Library

76
The general parametric approach utilizes the nature of the focusing delay curves by
describing the delay curve using a quadratic equation:
0)(2),( 22 =−−−≡ NNNNNNN xkpdpdpf (4. 12)
which was derived from (4. 11) by dividing both sides with ∆2, where ∆ is the instant
increment of the focal depth and is defined as the distance that ultrasound signal travels
over a period of the sampling frequency, The term kN, which is xn·sinθ, is constant for a
given image line inclination and transmitting element. The index N denotes time index.
Ideally, the function f(pN, dN) is equal to zero but due to delay quantization, it is not
possible to obtain a perfect zero value for the function. In the general parametric
algorithm, the function f(pN, dN) is kept to be as close to zero as possible by adjusting the
value of pN for each unit increment of dN. It can be seen from (4.13) that if pN is
increased by 1 for each unit increment of dN, the function is reducing. On the other hand,
from (4.14), the function is increasing if pN is increased by 2.
),(122),()1,1( NNNNNNNN dpfkddpfdpf <−+−=++ (4. 13)
),(
242),()1,2(
NN
NNNNNNN
dpf
kdpdpfdpf
>
+−+=++
(4. 14)
Therefore, a step-by-step delay algorithm can be built around the equation by
numerically solving it at each increment of a leading variable, which is the instant focal
depth dN in this case.
ATTENTION: The Singapore Copyright Act applies to the use of this document. Nanyang Technological University Library

77
1. The initial values cf
dd SstartN =)1( ,
cf
pp SstartN =)1( and
cf
xk SnN sin= are applied.
2. If f(pN + 1, dN + 1) > 0, then pN(n + 1) = pN(n) + 1, else pN(n + 1) = pN(n) + 2.
3. dN(n+1) = dN(n) + 1, and if the end of the line is not reached, go back to 2.
Fig. 4.13. Block diagram of the general parametric on-the-fly calculation approach.
The general parametric algorithm generates output with a maximum error of ±1 unit,
which is the distance that ultrasound waves travel in half clock period. The precision is
the same as the two LUT methods presented.
A pipelined design was employed for the implementation of the described algorithm in
order to increase the throughput and also to ensure that the timing constraints imposed
by the real-time system are satisfied. The resulting implementation requires only a few
Counter
Reset logic
Reset
Clock
Output data Output
buffer Parameter register
Comparator
Calculation logic
ATTENTION: The Singapore Copyright Act applies to the use of this document. Nanyang Technological University Library

78
input parameters, but it has the disadvantage of consuming power and logic resource due
to the implementation of the on-the-fly calculations.
4.4.2.4 Implementation results and discussions
A comparison between the three delay generation methods for the delay generator was
done for a 64-channel linear array. The sampling frequency was set to be 160MHz for
the purpose of consuming reasonable amount of power while achieving good focusing.
The occupied logic gate count and power consumption were estimated for the VHDL
implementations of the three methods in an FPGA for a target device Spartan-3E
XC3S500E by Xilinx. The same level of optimization was achieved for the three
designs. The synthesis results for the three delay generation approaches are shown in
Table 4.4.
Table 4.4. Implementation results of (a) complete lookup table approach, (b) compressed lookup table with delta encoding approach and (c) general parametric approach.
Logic gates Power @ 160MHz Complete LUT 1738 241mW
Compressed LUT 1539 261mW General parametric 3369 261mW
It can be seen that the general parametric approach takes up most logic gate count and
consumes most power among the three methods, due to (i) the run-time calculations of
the instant delay profile, which dissipates significant computing power and (ii) the
inefficiency of implementing calculation logics compared to memory modules in FPGA,
as shown in Table 4.5.
ATTENTION: The Singapore Copyright Act applies to the use of this document. Nanyang Technological University Library

79
Table 4.5. Device utilization of (a) complete lookup table approach, (b) compressed lookup table with delta encoding approach and (c) general parametric approach.
Slices registers 4-input LUTs Complete LUT 16 177
Compressed LUT 28 191 General parametric 220 220
On the other hand, the compressed LUT with delta encoding approach has the best
performance in terms of overall logic resources as well as power consumption. The
reduction of logic gate count by applying delta encoding in FPGA is only marginal,
because the same ROM module was used to store the LUTs for the two approaches after
examining their respective RTL schematics. In other words, despite the difference in
word width, the size of both LUTs is the same, which is equal to the total number of
focal depths along an image line. However, for more sophisticated imaging systems
such as 3-D transducer with higher resolution, which require considerable memory size
for their more complex focusing information, the on-the-fly calculation approach might
still be advantageous.
4.5 Summary
Post-delay reconstruction SDBF suffers from artifact problem when dynamic focusing is
performed. It was found in Chapter 3 that the artifact problem is related to the
quantization noise present in the sigma-delta modulated signal. The relation between the
image quality (in terms of PSNR) and the quantization noise before sample repetition is
studied in this Chapter. It shows that dynamic focusing artifacts can be effectively
ATTENTION: The Singapore Copyright Act applies to the use of this document. Nanyang Technological University Library
80
suppressed when a certain SQNR is achieved for the signal before the delay focusing.
Hence, we proposed and developed a cascaded reconstruction SDBF which suppresses
the dynamic focusing artifacts by reducing the quantization noise before performing
delay-and-sum.
Besides, this chapter also presents the condition to select different tap size boxcar filters
for different OSR when dynamic aperture is applied at f-number of 2. Simulation results
using real phantom data show that the dynamic focusing artifacts can be reduced by
simply using an 8-tap boxcar filter as the pre-delay filter when OSR is 11. The contrast
resolution of the image produced by the proposed SDBF is comparable to that produced
by the pre-delay reconstruction SDBF method, and is better than that of the insert zero
method. The hardware can also be greatly simplified compared to pre-delay
reconstruction method by having a much simpler filter in each channel.
Due to the high beamforming frequency required for SDBF system, the selection of
delay generator is important because it contributes to the overall power consumption and
hardware complexity of the entire ultrasound machine. Three delay generation methods
(complete LUT, compressed LUT with delta encoding and general parametric
algorithm) were evaluated in terms of their power and hardware in an FPGA for a target
device Spartan-3E XC3S500E by Xilinx. The result shows that the compressed LUT
method is preferred for a 64-channel linear array system with advantages in both power
consumption and gate counts. However, if the channel count is large (e.g. for 3-D
ultrasound machine), on-the-fly calculation method (general parametric algorithm) may
ATTENTION: The Singapore Copyright Act applies to the use of this document. Nanyang Technological University Library

81
be a better solution because the amount of delay information needed to store is very
large for LUT methods.
ATTENTION: The Singapore Copyright Act applies to the use of this document. Nanyang Technological University Library
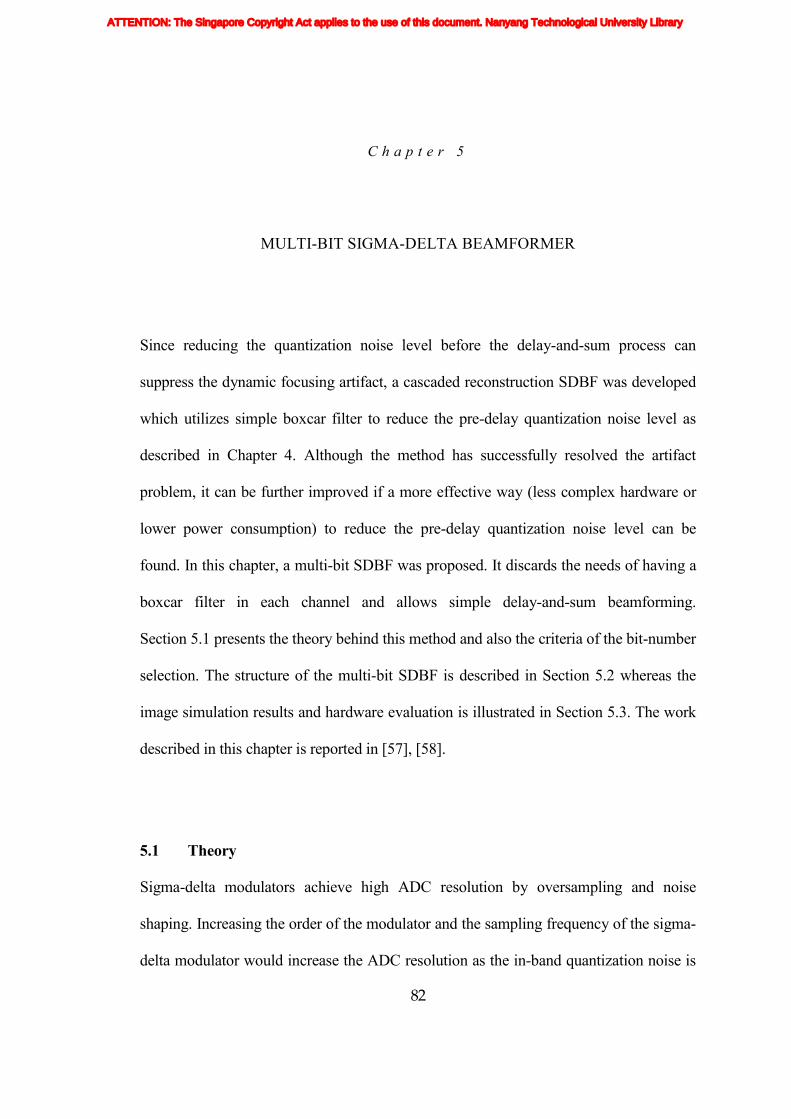
82
C h a p t e r 5
MULTI-BIT SIGMA-DELTA BEAMFORMER
Since reducing the quantization noise level before the delay-and-sum process can
suppress the dynamic focusing artifact, a cascaded reconstruction SDBF was developed
which utilizes simple boxcar filter to reduce the pre-delay quantization noise level as
described in Chapter 4. Although the method has successfully resolved the artifact
problem, it can be further improved if a more effective way (less complex hardware or
lower power consumption) to reduce the pre-delay quantization noise level can be
found. In this chapter, a multi-bit SDBF was proposed. It discards the needs of having a
boxcar filter in each channel and allows simple delay-and-sum beamforming.
Section 5.1 presents the theory behind this method and also the criteria of the bit-number
selection. The structure of the multi-bit SDBF is described in Section 5.2 whereas the
image simulation results and hardware evaluation is illustrated in Section 5.3. The work
described in this chapter is reported in [57], [58].
5.1 Theory
Sigma-delta modulators achieve high ADC resolution by oversampling and noise
shaping. Increasing the order of the modulator and the sampling frequency of the sigma-
delta modulator would increase the ADC resolution as the in-band quantization noise is
ATTENTION: The Singapore Copyright Act applies to the use of this document. Nanyang Technological University Library

83
reduced. However, the total noise content in the whole frequency band (from DC to
2Sf , where fS is the sampling frequency) remains unchanged. This can be shown by
the theoretical quantization noise power calculation for an mth-order sigma-delta
modulator [39]
ΩΩ
= ∫ df
fn
n S
S
em
q ππ
22sin22
22
0
2
(5. 1)
where 2en is the unshaped quantization noise power, 2
qn is the quantization noise power
after noise shaping, Ω is the digital frequency. Second order sigma-delta modulator was
selected for illustration in this paper as any higher order modulators are not inherently
stable [39]. For a 2nd-order sigma-delta modulator, the quantization noise power can be
simplified to
22 6 eq nn = (5. 2)
The total quantization noise power from DC to 2Sf before reconstruction is not related
to the OSR nor to the order of the modulator. It is only related to the unshaped noise
power. One way to reduce the pre-delay quantization noise is to increase the bit
resolution of the quantizer used in sigma-delta modulator, from single-bit to multi-bit.
By having a one-bit increment, the noise level can be reduced by 6dB theoretically [39].
If the number of bits is increase such that the total quantization noise power is low
enough to achieve a certain pre-delay SQNR value, the effect of dynamic focusing
artifacts can be neglected. This is the reason why conventional multi-bit beamformers do
ATTENTION: The Singapore Copyright Act applies to the use of this document. Nanyang Technological University Library

84
not suffer from dynamic artifact problem. The number of bits for a multi-bit SDBF for a
certain PSNR per channel is determined by the pre-delay SQNR required [45].
A set of simulations was carried out to determine the bit-number required for different
PSNR per channel. The simulation environment was setup according to Fig. 3.9 and
described in Section 3.2. A radio frequency (RF) signal consisting of a 0.6 fractional
bandwidth, 3.5MHz Gaussian pulse with -50dB white noise was used as the analog
input signal. The RF signal was digitized using a single-bit 2nd-order low-pass sigma-
delta modulator at 111MHz. Both 1st and 2nd reconstruction filters are 160-tap low-pass
FIR filters but the out-of-band attenuation of the 1st filter is adjustable. It was also found
in Chapter 4 that the maximum sample repetition rate of a dynamic focusing
beamformer is only related to the f-number of the system and when f-number is 2,
samples will be repeated at the maximum rate of every 64 samples.
The average maximum PSNR and the -3dB corner SQNR (at which the PSNR achieved
is -3dB below the maximum value) for 10 runs of the repeat-every-64-sample simulation
are plotted against the OSR as in Fig. 4.5. They are denoted as the achievable PSNR and
required pre-delay SQNR.
By extracting the results from Fig. 4.5 and plotting the required average pre-delay
SQNR against the corresponding achievable PSNR value (-3dB from the maximum
PSNR value), Fig. 5.1 was obtained. It was found that the relationship between the
achievable PSNR with the required pre-delay SQNR can be approximated to a linear
relation, as illustrated in Fig. 5.1.
ATTENTION: The Singapore Copyright Act applies to the use of this document. Nanyang Technological University Library

85
Fig. 5.1. The required SQNR to achieve at least -3dB of the maximum achievable PSNR value per channel under different OSR.
Based on Fig. 5.1, the number of bits required by the sigma-delta modulator will be
selected according to the SQNR value that it can provide. It has to fulfill the pre-delay
SQNR value required. The SQNR achieved by an Nb-bit 2nd-order sigma-delta
modulator can be expressed as
)1(02.6 −= bNSQNR (dB). (5. 3)
and it is comparable to the results obtained from simulation for 2- to 6-bit sigma-delta
modulator as shown in Table 5.1.
ATTENTION: The Singapore Copyright Act applies to the use of this document. Nanyang Technological University Library

86
Table 5.1. Theoretical and simulated pre-delay SQNR of the multi-bit 2nd order sigma-delta modulator.
No. of bits Theoretical SQNR (dB) Simulated SQNR (dB) 2 6.02 7.51 3 12.04 12.16 4 18.06 18.13 5 24.08 24.15 6 30.1 30.13
The simulated pre-delay SQNR was incorporated into Fig. 5.1 to indicate the upper
limits of PSNR achievable with 2- to 6-bit sigma-delta modulators. For example, if
40dB PSNR is required for each channel, 3-bit sigma-delta modulator should be utilized
to achieve the pre-delay SQNR of 10dB. After the selection of the number of bits, the
OSR of the system can be calculated by
DR = 6.02Nb + 1.76 – 12.9 + 50logOSR(dB), (5.4)
where DR is the dynamic range (which is also equal to the PSNR per channel). It should
be noted that the OSR obtained should also fulfill the delay resolution requirement
calculated by:
21
36.4
≈
chfpeak N
ENBWr
SLπ
, (5.5)
where peakSL is the peak random quantization sidelobe (voltage) level, ENBW is the
equivalent noise bandwidth which is 1 when rectangular window is used for apodization,
rf is the ratio of sampling frequency to signal frequency (which is equal to 2×OSR), and
Nch is the number of elements, under the condition that the error components are
ATTENTION: The Singapore Copyright Act applies to the use of this document. Nanyang Technological University Library

87
uncorrelated from channel to channel [49]. For example, to obtain a sidelobe level of
-30dB for a system with 128 channel array with rectangular windowing, rf needs to be at
least 11 from (4.7). Hence the sampling frequency needs to be at least 11 times higher
than the central frequency of the ultrasound signal, which is equivalent to an OSR of 5.5.
5.2 Beamformer structure
The structure of the multi-bit SDBF is shown in Fig. 5.2 which consists of multi-bit
sigma-delta modulators and multi-bit shift registers or first-in-first-out (FIFO)
memories.
Fig. 5.2. Multi-bit sigma-delta beamformer using N-bit modulators.
ATTENTION: The Singapore Copyright Act applies to the use of this document. Nanyang Technological University Library

88
Increasing the bit resolution not only corrects the dynamic focusing artifact problem, but
also reduces the beamforming frequency as long as the delay resolution is fulfilled.
Although the bit length is increased, the delay length is reduced because a lower
beamforming frequency is used.
For a multi-bit sigma-delta modulator, the internal DAC needs to be as linear as the
overall modulator in order to provide good noise suppression [59]. Nonlinearity in the
DAC will cause the increase of noise floor as well as harmonics. Thus, the resulting
image will be degraded [60]. However, several techniques like dual-quantization,
dynamic element matching (DEM), mismatch error shaping, digital correction can be
used to correct the linearity problem effectively [39]. One of these solutions, the DEM
technique, converts the internal DAC element errors to high frequency noise by
randomizing the DAC element switching activity. The method is able to provide
sufficient linearity for the implementation of more than 14 bits sigma-delta modulators
with bandwidth beyond 1MHz. The disadvantage of DEM technique is that additional
delay is introduced inside the feedback loop and causing higher operating frequency to
be applied on other circuit components.
Nevertheless, for a 3-bit sigma-delta modulator, it was found that linearity correction
techniques is not needed as sufficiently good element matching can be achieved by
simple layout techniques. Simulations have shown that the standard deviation of a 3-bit
DAC element mismatch of 0.05% is sufficient not to degrade the modulator
performance and a harmonic distortion 100dB below full scale can be achieved [61].
ATTENTION: The Singapore Copyright Act applies to the use of this document. Nanyang Technological University Library

89
5.3 Results
5.3.1 Image simulation results
The point phantom data acquired by Biomedical Ultrasonics Laboratory at University of
Michigan (available at http://bul.eecs.umich.edu), using Acuson, Mountain View, CA,
Model #V328, a 128 element, 3.5MHz commercial transducer for a wire target phantom
consisting of 6 wires in a water tank, was used for comparison of the proposed multi-bit
SDBF with pre-delay reconstruction, post-delay reconstruction, insert zero and cascaded
reconstruction methods.
For a 128 channel, rectangular windowed array, the apodization power gain can be
obtained by
dBw
wG N
nn
N
nn
SNR 21
1
2
2
1 =
=
∑
∑
=
= , (5.6)
where wn is the weighting of the nth channel. In order to obtain a total DR of 60dB, the
DR needed for each channel is 39dB. Hence, according to Fig. 5.1, the number of bits
for the sigma-delta modulator should be 3 bits. An OSR of 4.4 is required for the 3-bit
system as calculated using (5.4) and OSR of 11 is required for single-bit systems as
calculated by
OSRDR log509.1276.1 +−= (dB). (5.7)
ATTENTION: The Singapore Copyright Act applies to the use of this document. Nanyang Technological University Library

90
On the other hand, to achieve a maximum average sidelobe level of -30dB for both
transmission and reception (for 128 channel array with rectangular windowing) in order
to achieve a total sidelobe level of -60dB, the sampling frequency required calculated by
using (5.5) showed that the OSR needed is at least 5.5. As this value is higher than the
OSR required by the ADC DR, an OSR of 5.5 was selected for the 3-bit SDBF, which
provides 44dB of ADC DR per channel. An OSR of 11 was used for other single-bit
SDBF architectures in the following comparison.
Similarly, the various SDBF techniques were simulated using MATLAB 7.0 as
described in Section 4.3. An image formed by the point phantom data is shown in
Fig. 5.3. in 60dB dynamic range with dynamic aperture applied at f-number ≥2.
Fig. 5.3. Wire phantom image which shows the 3 areas of noise power that are used to calculate the PSNR.
The contrast resolution of the point phantom images obtained using pre-delay
reconstruction, post-delay reconstruction, insert zero, cascaded reconstruction (with 8-
1
2
3
ATTENTION: The Singapore Copyright Act applies to the use of this document. Nanyang Technological University Library

91
tap boxcar filters as pre-delay filters) and 3-bit SDBF was quantified by the PSNR
which is defined as the ratio of the peak signal to the average noise level in the 3 boxed
areas shown in Fig. 5.3. The results are presented in Table 5.2.
Table 5.2. PSNR values of 3 different depths for different beamforming techniques.
Frequency (MHz) 111 55
Area Pre-delay reconstruction
Post-delay reconstruction
Insert zero
Cascaded reconstruction
3-bit SDBF
PSNR1(dB) 62.68 51.74 58.79 60.77 60.24 PSNR2(dB) 62.56 54.48 58.55 60.53 60.88 PSNR3(dB) 62.62 55.68 58.76 60.79 61.06
Table 5.2. shows that the 3-bit SDBF achieves a PSNR of 60dB, which is similar to the
cascaded reconstruction method and is better than the insert zero method, with a lower
beamforming frequency at 55MHz. The PSNR of the 3-bit SDBF in this case is limited
by the delay resolution rather than the ADC resolution.
In addition, another cyst phantom acquired by Biomedical Ultrasonics Laboratory at
University of Michigan using the same machine was used for comparison amongst the 5
methods (proposed multi-bit SDBF, pre-delay reconstruction SDBF, post-delay
reconstruction SDBF, insert zero SDBF and proposed cascaded reconstruction SDBF).
The image formed by the data is shown in Fig. 5.4. with 60dB dynamic range.
ATTENTION: The Singapore Copyright Act applies to the use of this document. Nanyang Technological University Library

92
Fig. 5.4. Image of the cyst phantom data acquired by Biomedical Ultrasonics Laboratory at University of Michigan.
The contrast resolution of the images can be evaluated using the contrast-to-noise ratio
(CNR) metric which is defined as
s
csCNRσµµ || −
= , (5. 8)
where µs and µc denotes the mean values of the scatterers and of the cyst respectively,
and σs is the standard deviation of the scatterers [54]. The results of the CNR are
presented in Table 5.3.
ATTENTION: The Singapore Copyright Act applies to the use of this document. Nanyang Technological University Library
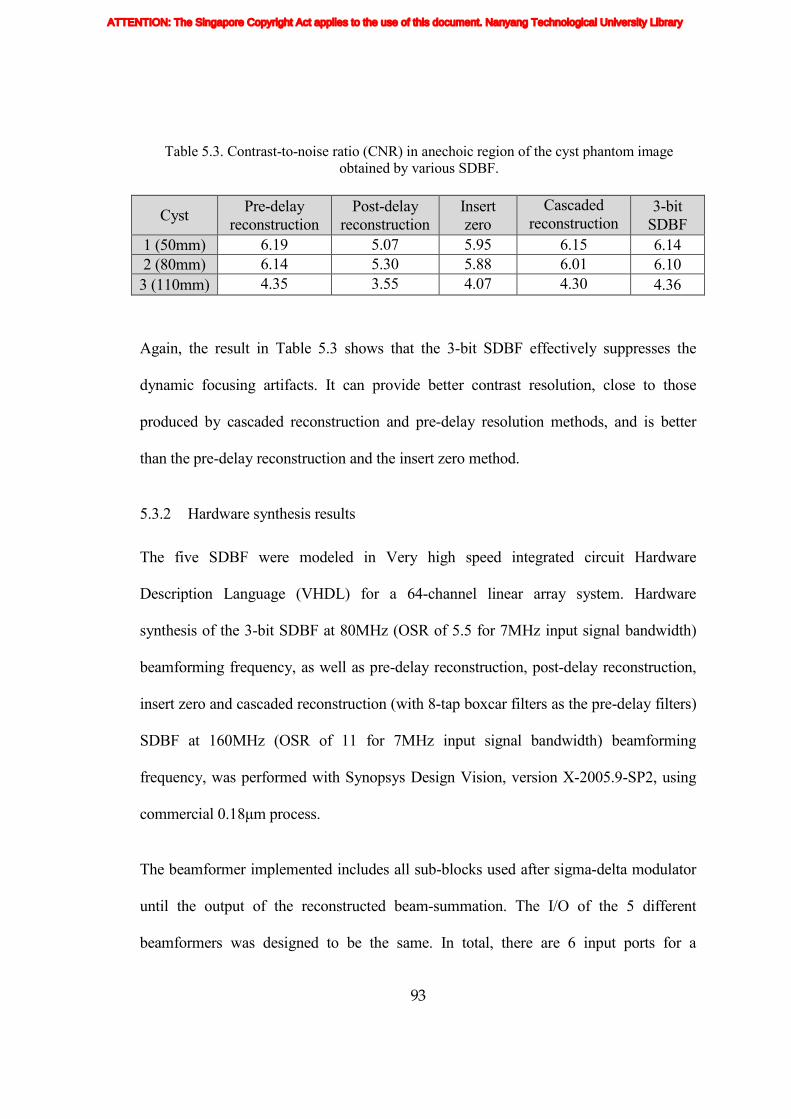
93
Table 5.3. Contrast-to-noise ratio (CNR) in anechoic region of the cyst phantom image obtained by various SDBF.
Cyst Pre-delay reconstruction
Post-delay reconstruction
Insert zero
Cascaded reconstruction
3-bit SDBF
1 (50mm) 6.19 5.07 5.95 6.15 6.14 2 (80mm) 6.14 5.30 5.88 6.01 6.10 3 (110mm) 4.35 3.55 4.07 4.30 4.36
Again, the result in Table 5.3 shows that the 3-bit SDBF effectively suppresses the
dynamic focusing artifacts. It can provide better contrast resolution, close to those
produced by cascaded reconstruction and pre-delay resolution methods, and is better
than the pre-delay reconstruction and the insert zero method.
5.3.2 Hardware synthesis results
The five SDBF were modeled in Very high speed integrated circuit Hardware
Description Language (VHDL) for a 64-channel linear array system. Hardware
synthesis of the 3-bit SDBF at 80MHz (OSR of 5.5 for 7MHz input signal bandwidth)
beamforming frequency, as well as pre-delay reconstruction, post-delay reconstruction,
insert zero and cascaded reconstruction (with 8-tap boxcar filters as the pre-delay filters)
SDBF at 160MHz (OSR of 11 for 7MHz input signal bandwidth) beamforming
frequency, was performed with Synopsys Design Vision, version X-2005.9-SP2, using
commercial 0.18µm process.
The beamformer implemented includes all sub-blocks used after sigma-delta modulator
until the output of the reconstructed beam-summation. The I/O of the 5 different
beamformers was designed to be the same. In total, there are 6 input ports for a
ATTENTION: The Singapore Copyright Act applies to the use of this document. Nanyang Technological University Library

94
beamformer. The system clock signal, the asynchronous reset signal, as well as the read
and write commands are the 4 control inputs to the entire beamformer. The read and
write commands were designed to provide external control ability when the beamformer
is used as a sub-module in the ultrasound system. For every beamforming channel, the
input data is received from the sigma-delta modulators. This input data is stored in the
memory before it is processed by the beamformer. There is another 8-bit (for single-bit
SDBF) or 7-bit (for 3-bit SDBF) delay profile input for each beamforming channel,
which is used to select the input data stored in the memory. Hence, for a 64-channel
beamformer, the processing input data is 64 bits (for single-bit SDBF) or 196 bits (for 3-
bit SDBF) and the delay profile data is 512 bits (for single-bit SDBF) or 448 bits (for 3-
bit SDBF) in total as shown in Fig. 5.5.
Fig. 5.5. System I/O configuration of the SDBFs (the figures in bracket are meant for 3-bit SDBF).
Read
Reset
Write
Clk
Output
Sigma-delta modulators
Delay generator
Beamformer
64-bit (or 196-bit) input data
512-bit (or 448-bit) delay profile
Memory
ATTENTION: The Singapore Copyright Act applies to the use of this document. Nanyang Technological University Library
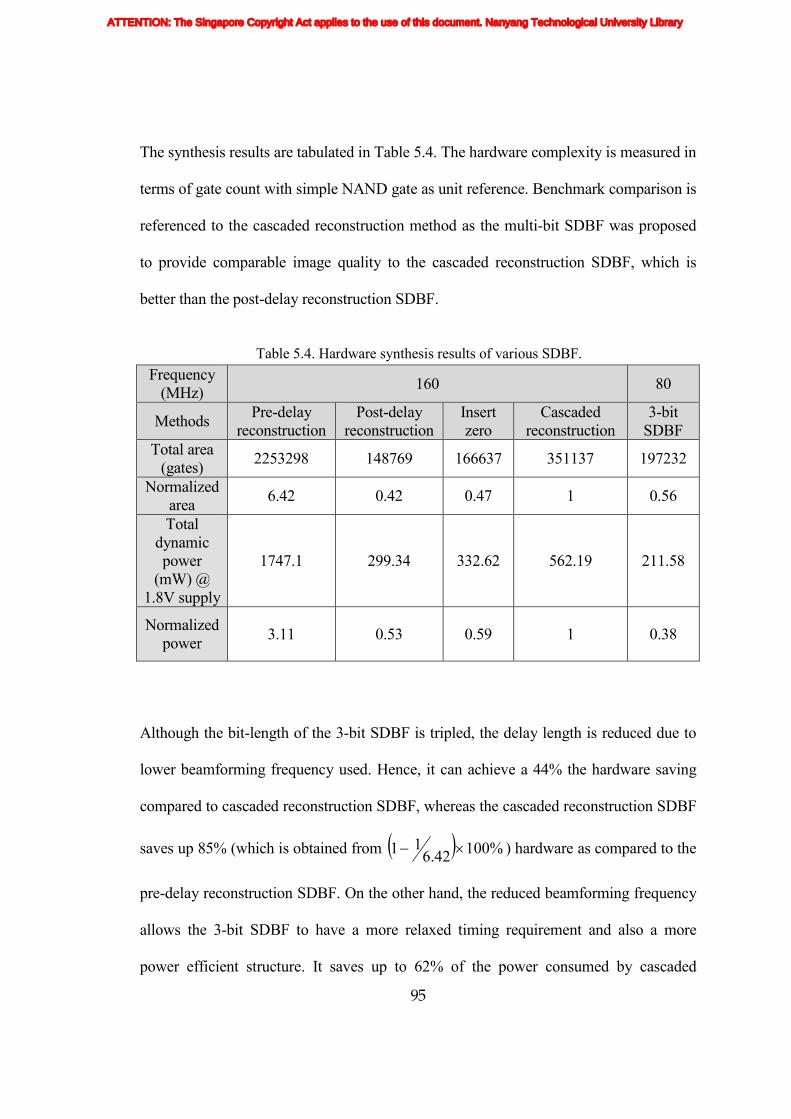
95
The synthesis results are tabulated in Table 5.4. The hardware complexity is measured in
terms of gate count with simple NAND gate as unit reference. Benchmark comparison is
referenced to the cascaded reconstruction method as the multi-bit SDBF was proposed
to provide comparable image quality to the cascaded reconstruction SDBF, which is
better than the post-delay reconstruction SDBF.
Table 5.4. Hardware synthesis results of various SDBF.
Although the bit-length of the 3-bit SDBF is tripled, the delay length is reduced due to
lower beamforming frequency used. Hence, it can achieve a 44% the hardware saving
compared to cascaded reconstruction SDBF, whereas the cascaded reconstruction SDBF
saves up 85% (which is obtained from ( ) %10042.611 ×− ) hardware as compared to the
pre-delay reconstruction SDBF. On the other hand, the reduced beamforming frequency
allows the 3-bit SDBF to have a more relaxed timing requirement and also a more
power efficient structure. It saves up to 62% of the power consumed by cascaded
Frequency (MHz) 160 80
Methods Pre-delay reconstruction
Post-delay reconstruction
Insert zero
Cascaded reconstruction
3-bit SDBF
Total area (gates) 2253298 148769 166637 351137 197232
Normalized area 6.42 0.42 0.47 1 0.56
Total dynamic power
(mW) @ 1.8V supply
1747.1 299.34 332.62 562.19 211.58
Normalized power 3.11 0.53 0.59 1 0.38
ATTENTION: The Singapore Copyright Act applies to the use of this document. Nanyang Technological University Library

96
reconstruction SDBF, whereas the cascaded reconstruction SDBF saves up 68% (which
is obtained from ( ) %10011.311 ×− ) power compared to the pre-delay reconstruction
SDBF.
The hardware comparison considers only the digital beamformer. It does not include the
single-bit and 3-bit sigma-delta modulators. It has been reported by R. Gaggl et al in
[61] that for a 3-bit sigma-delta modulator, good layout practice is sufficient to handle
the DAC linearity problem. There is no need for any additional correction techniques.
Hence the only difference between the 3-bit sigma-delta modulators and the single-bit
sigma-delta modulator is the internal quantizers used. The area of the 3-bit modulator in
[61] is dominated by the capacitors. The internal 3-bit quantizer, which is implemented
using flash converter, occupies only 15% of the entire area in Fig. 5.6, as reported in the
paper. The area of a single-bit quantizer can be estimated to be 71 of a 3-bit quantizer
as the area is mainly dominated by the comparators it used. Hence, the difference
between the area of a 3-bit modulator and single-bit modulator is about 13% of the
entire area of a 3-bit sigma-delta modulator. This area increment for using a 3-bit sigma-
delta modulator is not significant as compared to the saving that can be achieved in the
digital circuitry, which is around 44% of that of the cascaded reconstruction SDBF.
ATTENTION: The Singapore Copyright Act applies to the use of this document. Nanyang Technological University Library
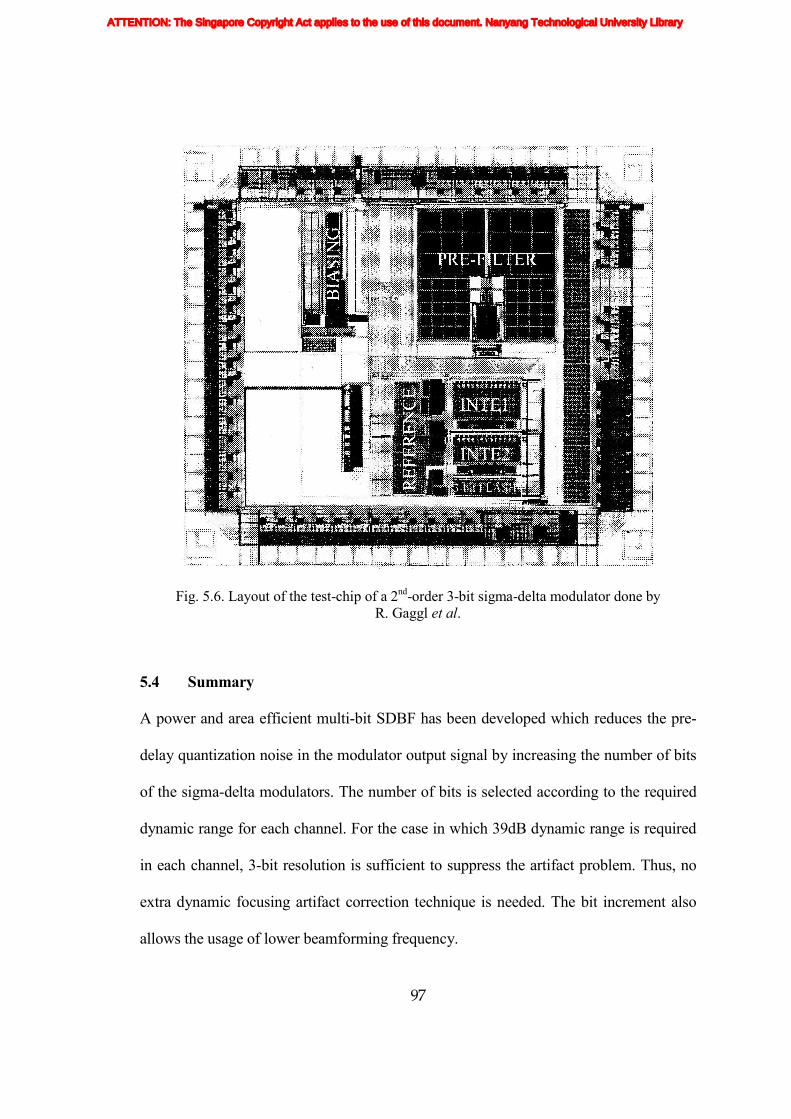
97
Fig. 5.6. Layout of the test-chip of a 2nd-order 3-bit sigma-delta modulator done by R. Gaggl et al.
5.4 Summary
A power and area efficient multi-bit SDBF has been developed which reduces the pre-
delay quantization noise in the modulator output signal by increasing the number of bits
of the sigma-delta modulators. The number of bits is selected according to the required
dynamic range for each channel. For the case in which 39dB dynamic range is required
in each channel, 3-bit resolution is sufficient to suppress the artifact problem. Thus, no
extra dynamic focusing artifact correction technique is needed. The bit increment also
allows the usage of lower beamforming frequency.
ATTENTION: The Singapore Copyright Act applies to the use of this document. Nanyang Technological University Library

98
Simulation results using real point and cyst phantom data show that the multi-bit SDBF
can effectively reduce the dynamic focusing artifacts. The image quality achieved is
comparable to the cascaded reconstruction SDBF.
The 3-bit SDBF developed also has 44% digital hardware saving and consumes 62%
less power compared to the cascaded reconstruction SDBF as shown by the synthesis
result.
ATTENTION: The Singapore Copyright Act applies to the use of this document. Nanyang Technological University Library

99
C h a p t e r 6
CONCLUSIONS AND FUTURE WORK
This thesis presented a detailed study on the cause of the artifact problem when dynamic
focusing is applied to a SDBF. This study was done in order to facilitate the
development of a SDBF with improved image quality. Based on the study, a cascaded
reconstruction SDBF was thus developed. Further investigation led to the development
of an efficient multi-bit SDBF structure, which can achieve a significant improvement in
terms of both hardware and power over the cascaded reconstruction SDBF. The works
in these 3 areas are summarized in Section 6.1 whereas the possible future work is
presented in Section 6.2.
6.1 Conclusions
The study of dynamic focusing artifacts shows that when the sequence of a sigma-delta
modulated bit-stream is disrupted during dynamic focusing, some amount of the high
frequency quantization noise would be shifted to the signal baseband and causes the
artifacts in the final image output. The degree of the artifact problem is found to be
proportional to the amount of quantization noise present in the sigma-delta modulated
bit-stream. It was concluded that a possible solution to the artifact problem is to reduce
the quantization noise level before the dynamic focusing is performed.
ATTENTION: The Singapore Copyright Act applies to the use of this document. Nanyang Technological University Library

100
Based on the study, a cascaded reconstruction SDBF was proposed and developed by
the author. It utilizes a multiplierless box-car filter to perform the pre-delay filtering in
each channel, thus, reducing the dynamic focusing artifact. The tap size of the box-car
filter is selected according to the pre-delay SQNR value required for each channel to
achieve a certain PSNR output. For a system with 128 channels, OSR of 11, an 8-tap
box-car filter is sufficient to provide a 60dB PSNR for the final image output, which is
typically used in ultrasound application. Real data simulation has shown that the
proposed method can provide comparable image quality compared to the pre-delay
reconstruction method while having 85% of hardware savings and 68% of power
savings.
Based on the same principle, the multi-bit SDBF was proposed as a better solution to the
cascaded reconstruction method. It utilizes multi-bit sigma-delta modulators to digitize
the received ultrasound echoes rather than the single-bit modulators. The bit increment
improves the pre-delay SQNR and hence, reduces the dynamic focusing artifacts. The
bit resolution is selected according to the required pre-delay SQNR for a certain PSNR
output. For a system with 128 channels, OSR of 11, 3 bit resolution is sufficient to
provide a 60dB PSNR for the final image output. Real image simulation has shown that
the proposed multi-bit SDBF can achieve good image quality as the cascaded
reconstruction SDBF. Besides, the bit increment can also reduce the beamforming
frequency of the system. As a result, multi-bit SDBF has a hardware complexity that is
44% less than the cascaded reconstruction SDBF and 62% lower in terms of power
consumption.
ATTENTION: The Singapore Copyright Act applies to the use of this document. Nanyang Technological University Library

101
By developing these low cost, low power SDBF structures, it allows the advancement of
ultrasound imaging systems in two directions: the portable handheld machine, and the
high-end, high quality machine. The simple hardware and low power structure permits
the integration of the whole beamformer into a single chip. When this single chip is
mounted onto the transducer side, it can eliminate the expensive cable needed to
transmit multiple channels of analog signal between the transducer and the console.
On the other hand, the low cost, low power SDBF proposed is also useful for the
development of the high-end large channel count system (e.g. 3D ultrasound imaging
system). It can significantly reduce the cost and power consumption when the channel
count is large without compromising the image quality.
Simulations have shown that the cascaded reconstruction SDBF and the multi-bit SDBF
developed can provide good performance in the B-mode imaging. However, further
works are still needed to verify the performance of the proposed SDBF in Doppler
imaging application. It would also be useful if the proposed method can be applied in
coded excitation ultrasound imaging to develop a more compact ultrasound imaging
system. These proposed future works are discussed in the following sections.
The works of this thesis have been published in various papers. The publication list can
be found in Section 1.6.
ATTENTION: The Singapore Copyright Act applies to the use of this document. Nanyang Technological University Library

102
6.2 Future work
This section suggests the possible future work that can be carried out based on the
cascaded reconstruction and multi-bit SDBF proposed.
6.2.1 Doppler mode imaging
Besides displaying B-mode images, current state-of-art ultrasound system also overlays
color flow images on top of the gray scale images to indicate the moving scatterers
within the tissues. The system usually employs the same beamformer for both B-mode
and color flow imaging.
Color flow images are generated by repeatedly firing an ensemble of pulses over a
region of interest and detecting the time difference between the consecutive reflected
echoes. The acquisition of color flow data are usually achieved by autocorrelation
method where the amplitude and phase information can be extracted [62].
Spectral Doppler is another mode that is commonly used to investigate blood flow in
ultrasound imaging system [63]. It has a higher signal-to-noise (SNR) requirement than
both B-mode and color flow imaging. The echoes reflected by blood are often lower
than those reflected by tissue by 30-50dB. As a result, the Spectral Doppler would
require at least 100-120dB system dynamic range to resolve the blood flow signal from
the tissue signal.
Hence, further works are needed to verify the sensitivity of the phase information to the
SNR level provided by the proposed SDBF. It is also important to design a SDBF
system that is efficient for Spectral Doppler application.
ATTENTION: The Singapore Copyright Act applies to the use of this document. Nanyang Technological University Library

103
6.2.2 Coded excitation
In order to increase the imaging depth of an ultrasound imaging system, high driving
voltage is used to excite the transducer elements to produce high power ultrasound
signal. Currently, the pulse amplitude generated by commercial scanners is already
approaching the regulatory Mechanical Index (MI) limit for the safety of patients [64].
An alternative to increase the transmitting power of ultrasound system is by increasing
the pulse duration of the ultrasound signal, but it compromises the resolution. In 1992,
O’Donnell developed a coded excitation system that is able to transmit a longer encoded
pulse without compromising the resolution [65].
It was also reported that it is feasible to provide similar signal-to-noise ratio (SNR) by
exciting the transducer elements with reduced voltage level (e.g. 10V) using coded
excitation technique compared to conventional ultrasound system with high excitation
voltage (e.g. 80V) [66]. Using such a low excitation voltage will ease the integration of
the transmitter with other front-end circuitries. Together with the SDBF architecture, the
coded excitation system can bring a new level of breakthrough to the compactness of an
ultrasound machine.
A coded excitation sigma-delta beamformer (CE-SDBF) was proposed [67], and it was
found that when dynamic focusing is applied, the post compression SDBF suffers not
only from the artifacts due to the disruption in sigma-delta modulated signal, but also
from the artifacts caused by the disruption of the coded signal. To mitigate the artifact
problem, a pre-compression structure can be utilized. However, it involves a complex
decoder in each beamforming channel and resulting in high hardware complexity.
ATTENTION: The Singapore Copyright Act applies to the use of this document. Nanyang Technological University Library

104
It is therefore desirable to have a more efficient CE-SDBF structure that can resolve the
artifacts problem. It would be reasonable to start the investigation by applying the
proposed cascaded reconstruction and multi-bit SDBF to the coded excitation system.
ATTENTION: The Singapore Copyright Act applies to the use of this document. Nanyang Technological University Library

105
REFERENCES
[1] L. F. Richardson, "Large Objects Wholly or Partly under Water," British Patent
11125, Mar. 27, 1913.
[2] D. Howry and W. Bliss, "Ultrasonic visualization of soft tissue structures of the
body," J. Lab. and Clin Med, vol. 40, pp. 579 - 592, Oct 1952.
[3] J. J. Wild and J. M. Reid, "Application of Echo-Ranging Techniques to the
Determination of Structure of Biological Tissues," Science, vol. 115, pp. 226 -
230, 1952.
[4] A. Fenster and D. B. Downey, "3-D ultrasound imaging: a review," IEEE
Engineering in Medicine and Biology Magazine, vol. 15, pp. 41-51, 1996.
[5] P. A. Lewin, "Diagnostic ultrasound - a glimpse into the next decade," in The
World Medical Association Business Briefing - Global Healthcare, 2000.
[6] R. Dilulio, "Portable ultrasound: small modality, big impact," in Imaging
Economics, July 2006.
[7] Y. M. Yoo, Y. Kim, D.-G. Sim, A. Agarwal, and F. K. Schneider, "Home
Ultrasound System," US Patent Application Publication 2006/0074320 A1, Aug.
26, 2005.
ATTENTION: The Singapore Copyright Act applies to the use of this document. Nanyang Technological University Library

106
[8] T. Fukuoka, F. K. Schneider, Y. Yang Mo, A. Anup, and K. Yongmin, "P2D-6
Ultrasound Color Doppler Imaging on a Fully Programmable Architecture," in
IEEE Ultrasonics Symposium, 2006, pp. 1639-1642.
[9] A. Agarwal, T. Fukuoka, F. K. Schneider, Y. Yang Mo, F. Baluyot, and K.
Yongmin, "P2B-17 Single-Chip Solution for Ultrasound Imaging Systems:
Initial Results," in IEEE Ultrasonics Symposium, 2007, pp. 1563-1566.
[10] V. S. Gierenz, R. Schwann, and T. G. Noll, "A low power digital beamformer
for handheld ultrasound systems," in Proceedings of the 27th European Solid-
State Circuits Conference, 2001, pp. 261-264.
[11] R. G. Pridham and R. A. Mucci, "Digital interpolation beamforming for low-
pass and bandpass signals," Proceedings of the IEEE, vol. 67, pp. 904-919,
1979.
[12] D. Lipschutz, "Delay interpolator for digital phased array ultrasound
beamformers," US Patent 5345426, Sept. 1994.
[13] M. O'Donnell, W. E. Engeler, J. T. Pedicone, A. M. Itani, S. E. Noujaim, R. J.
Dunki-Jacobs, W. M. Leue, C. L. Chalek, L. S. Smith, J. E. Piel, R. L. Harris, K.
B. Welles, and W. L. Hinrichs, "Real-time phased array imaging using digital
beam forming and autonomous channel control," in IEEE Ultrasonics
Symposium, 1990, pp. 1499-1502 vol.3.
[14] S. H. Maslak, P. Alto, and Calif, "Acousting Imaging Apparatus," US Patent
4140022, Feb. 20, 1979.
ATTENTION: The Singapore Copyright Act applies to the use of this document. Nanyang Technological University Library
107
[15] R. Mucci, "A comparison of efficient beamforming algorithms," IEEE
Transactions on Acoustics, Speech, and Signal Processing, vol. 32, pp. 548-558,
1984.
[16] S. E. Noujaim, S. L. Garverick, and M. O'Donnell, "Phased array ultrasonic
beam forming using oversampled A/D converters," U. S. Patent 5203335, April
20, 1993.
[17] S. R. Freeman, M. O'Donnell, T. E. Linnenbrink, M. A. Morin, M. K. Quick,
and C. S. Desilets, "Beamformed Ultrasonic Imager with Delta-Sigma Feedback
Control," U. S. Patent 5964708, Oct. 12, 1999.
[18] E. Brunner, Ultrasound system considerations and their imparct on front-end
components: Analog Devices, Inc., 2002.
[19] W. R. Hedrick, D. L. Hykes, and D. E. Starchman, Ultrasound Physics and
Instrumentation, 3rd ed.: Mosby, Inc., 1995.
[20] S. R. Freeman, G. A. Schwartz, R. L. J. Roovers, L. J. Breems, G. A. Brock-
Fisher, and T. P. Fazioli, "Ultrasonic signal acquisition in the digital
beamformer," US Patent 6937176 B2, Aug. 30, 2005.
[21] M. Karaman and M. Kozak, "An asynchronous oversampling beamformer,"
WIPO PCT WO 00/10638, 2 March, 2000.
ATTENTION: The Singapore Copyright Act applies to the use of this document. Nanyang Technological University Library
108
[22] D. G. Wildes, R. Y. Chiao, C. M. W. Daft, K. W. Rigby, L. S. Smith, and K. E.
Thomenius, "Elevation performance of 1.25D and 1.5D transducer arrays," IEEE
Transactions on Ultrasonics, Ferroelectrics and Frequency Control, vol. 44, pp.
1027-1037, 1997.
[23] B. G. Tomov and J. A. Jensen, "Compact FPGA-based beamformer using
oversampled 1-bit A/D converters," IEEE Transactions on Ultrasonics,
Ferroelectrics and Frequency Control, vol. 52, pp. 870-880, 2005.
[24] S. R. Freeman, M. K. Quick, M. A. Morin, R. C. Anderson, C. S. Desilets, T. E.
Linnenbrink, and M. O'Donnell, "Delta-sigma oversampled ultrasound
beamformer with dynamic delays," IEEE Transactions on Ultrasonics,
Ferroelectrics and Frequency Control, vol. 46, pp. 320-332, March 1999.
[25] V. S. Gierenz, R. Schwann, and T. G. Noll, "A low power digital beamformer
for handheld ultrasound systems," University of Technology RWTH Aachen,
Germany.
[26] R. Pridham and R. Mucci, "Shifted sideband beamformer," IEEE Transactions
on Acoustics, Speech and Signal Processing, vol. 27, pp. 713-722, 1979.
[27] B. Stefanelli, I. O'Connor, L. Quiquerez, A. Kaiser, and D. Billet, "An analog
beam-forming circuit for ultrasound imaging using switched-current delay
lines," IEEE Journal of Solid-State Circuits, vol. 35, pp. 202-211, 2000.
ATTENTION: The Singapore Copyright Act applies to the use of this document. Nanyang Technological University Library

109
[28] S. R. Freeman, M. K. Quick, M. A. Morin, R. C. Anderson, C. S. Desilets, T. E.
Linnenbrink, and M. O'Donnell, "An ultrasound beamformer using
oversampling," in IEEE Ultrasonics Symposium. vol. 2, 1997, pp. 1687-1690.
[29] K. W. Rigby, "Delta-sigma beamformers with minimal dynamic focusing
artifacts," US Patent 6366227 B1, Apr. 2, 2002.
[30] P.-C. Li, J.-J. Huang, H.-L. Liu, and M. O'Donnell, "A Dynamic Focusing
Technique for Delta-Sigma Based Beamformers," in Ultrasonic Imaging. vol.
22, 2000, pp. 197-205.
[31] M. Karaman and M. Kozak, "Digital beamforming using non-uniform
oversampling delta-sigma conversion," in IEEE Ultrasonics Symposium. vol. 2,
1999, pp. 1279-1282 vol.2.
[32] M. Kozak and M. Karaman, "Digital phased array beamforming using single-bit
delta-sigma conversion with non-uniform oversampling," Ultrasonics,
Ferroelectrics and Frequency Control, IEEE Transactions on, vol. 48, pp. 922-
931, 2001.
[33] H.-S. Han, H.-J. Park, and T.-K. Song, "A new architecture for ultrasound
sigma-delta modulation beamformer," in IEEE Ultrasonics Symposium. vol. 2,
2002, pp. 1631-1634.
[34] H.-S. Han, H.-J. Park, and T.-K. Song, "Sigma Delta beamformer and method
with reduced artifact," US Patent Application Publication 2004/0189499 A1,
Sep. 30, 2004.
ATTENTION: The Singapore Copyright Act applies to the use of this document. Nanyang Technological University Library

110
[35] H.-S. Han and T.-K. Song, "Multiplierless sigma-delta modulation beam
forming for ultrasound nondestructive testing," Key Engineering Materials, vol.
270 - 273, pp. 215 - 220, May 2004.
[36] B. E. Boser and B. A. Wooley, "The design of sigma-delta modulation analog-
to-digital converters," IEEE Journal of Solid-State Circuits, vol. 23, pp. 1298-
1308, 1988.
[37] P. M. Aziz, H. V. Sorensen, and J. vn der Spiegel, "An overview of sigma-delta
converters," IEEE Signal Processing Magazine, vol. 13, pp. 61-84, 1996.
[38] J. C. Candy and G. C. Temes, Oversampling Delta-Sigma Data Converters -
Theory, Design and Simulation: IEEE Press, IEEE Cat. No. PC0274-1, 1992.
[39] R. Schreier and G. C. Temes, Understanding delta-sigma data converters.
Piscataway, NJ,Hoboken, N.J., Chichester: IEEE Press,Wiley, 2005.
[40] R. M. Gray, "Quantization noise spectra," IEEE Transactions on Information
Theory, vol. 36, pp. 1220-1244, 1990.
[41] L. J. Breems, R. Rutten, and G. Wetzker, "A cascaded continuous-time SD
modulator with 67-dB dynamic range in 10-MHz bandwidth," IEEE Journal of
Solid-State CIrcuits, vol. 39, pp. 2152 - 2160, December 2004.
[42] Y. Geerts, M. S. J. Steyaert, and W. Sansen, "A high-performance multibit DS
CMOS ADC," IEEE Journal of Solid-State CIrcuits, vol. 35, pp. 1829 - 1840,
December 2000.
ATTENTION: The Singapore Copyright Act applies to the use of this document. Nanyang Technological University Library

111
[43] S. Patón, A. D. Giandomenico, L. Hernández, A. Wiesbauer, T. Pötscher, and M.
Clara, "A 70-mW 300MHz CMOS Continuous-Time SD ADC with 15-MHz
Bandwidth and 11 Bits of Resolution," IEEE Journal of Solid-State CIrcuits, vol.
39, pp. 1056 - 1063, July 2004.
[44] Y. C. Jenq, "Digital spectra of nonuniformly sampled signals: fundamentals and
high-speed waveform digitizers," IEEE Transactions on Instrumentation and
Measurement, vol. 37, pp. 245-251, 1988.
[45] S. I. Nikolov and J. A. Jensen, "Comparison between different encoding schemes
for synthetic aperture imaging," in SPIE Medical Imaging meeting, Ultrasound
Imaging and Signal Processing, 2002.
[46] J. H. Cheong, Y. Y. H. Lam, L. M. Koh, and K. T. Tiew, "Sigma-delta Receive
Beamformer Based on Cascaded Reconstruction for Ultrasound Imaging
Application," submitted for publication in the 3rd International Conference on
Bioinformatics and Biomedical Engineering, 2009.
[47] J. H. Cheong, Y. Y. H. Lam, K. T. Tiew, and L. M. Koh, "Sigma-delta receive
beamformer based on cascaded reconstruction for ultrasound imaging
application," IEEE Transactions on Ultrasonics, Ferroelectrics and Frequency
Control, vol. 55, pp. 1935-1946, 2008.
[48] P. Hoskins, A. Thrush, K. Martin, and T. Whittingam, Diagnostic Ultrasound:
Physics and Equipment: Cambridge University Press, 2003.
ATTENTION: The Singapore Copyright Act applies to the use of this document. Nanyang Technological University Library

112
[49] S. Holm and K. Kristoffersen, "Analysis of worst-case phase quantization
sidelobes in focused beamforming," IEEE Transactions on Ultrasonics,
Ferroelectrics and Frequency Control, vol. 39, pp. 593-599, 1992.
[50] J. Candy and O. Benjamin, "The Structure of Quantization Noise from Sigma-
Delta Modulation," IEEE Transactions on Communications, vol. 29, pp. 1316-
1323, 1981.
[51] E. Hogenauer, "An economical class of digital filters for decimation and
interpolation," IEEE Transactions on Acoustics, Speech and Signal Processing,
vol. 29, pp. 155-162, 1981.
[52] C. Shuni and C. Burrus, "Multirate filter designs using comb filters," IEEE
Transactions on Circuits and Systems, vol. 31, pp. 913-924, 1984.
[53] D. M. Zar and W. D. Richard, "A scan conversion engine for standard B-mode
ultrasonic imaging," in ASEE Conference, 1993.
[54] M. Karaman, P.-C. Li, and M. O'Donnell, "Synthetic aperture imaging for small
scale systems," IEEE Transactions on Ultrasonics, Ferroelectrics and
Frequency Control, vol. 42, pp. 429-442, 1995.
[55] B. Yang, J. H. Cheong, Y. Y. H. Lam, and L. S. Ng, "A Comparison of the
Lookup Table and On-The-Fly Calculation Methods for the Beamforming
Control Unit," in The 23rd International Technical Conference on
Circuits/Systems, Computers and Communications, 2008.
ATTENTION: The Singapore Copyright Act applies to the use of this document. Nanyang Technological University Library

113
[56] B. G. Tomov and J. A. Jensen, "Delay generation methods with reduced memory
requirements," in SPIE Conference on medical imaging, 2003.
[57] J. H. Cheong, Y. Y. H. Lam, L. M. Koh, and K. T. Tiew, "Delay-and-sum Multi-
bit Sigma-delta Beamformer with Minimal Dynamic Focusing Artifacts,"
submitted for publication in IEEE Transactions on Ultrasonics, Ferroelectrics
and Frequency Control, 2009.
[58] J. H. Cheong, Y. Y. H. Lam, L. M. Koh, and K. T. Tiew, "Multi-bit sigma-delta
beamformer with minimal dynamic focusing artifacts," in IEEE International
Conference on Electron Devices and Solid-State Circuit, 2008.
[59] T. Cataltepe, A. R. Kramer, L. E. Larson, G. C. Temes, and R. H. Walden,
"Digitally corrected multi-bit SD data converters," in IEEE International
Symposium on Circuits and Systems. vol. 1, 1989, pp. 647-650.
[60] D. R. Ucci and R. G. Petroit, "The effects of ADC nonlinearities on digital
beamformers," in IEEE Military Communications Conference. vol. 1, 1989, pp.
279-283.
[61] R. Gaggl, A. Wiesbauer, G. Fritz, C. Schranz, and P. Pessl, "A 85-dB dynamic
range multibit delta-sigma ADC for ADSL-CO applications in 0.18-µm CMOS,"
IEEE Journal of Solid-State Circuits, vol. 38, pp. 1105-1114, 2003.
[62] C. Kasai, K. Namekawa, A. Koyano, and R. Omoto, "Real-Time Two-
Dimensional Blood Flow Imaging Using an Autocorrelation Technique," IEEE
Transactions on Sonics and Ultrasonics, vol. 32, pp. 458-464, 1985.
ATTENTION: The Singapore Copyright Act applies to the use of this document. Nanyang Technological University Library
114
[63] H. F. Routh, "Doppler ultrasound," IEEE Engineering in Medicine and Biology
Magazine, vol. 15, pp. 31-40, 1996.
[64] R. Y. Chiao and H. Xiaohui, "Coded excitation for diagnostic ultrasound: a
system developer's perspective," IEEE Transactions on Ultrasonics,
Ferroelectrics and Frequency Control, vol. 52, pp. 160-170, 2005.
[65] M. O'Donnell, "Coded excitation system for improving the penetration of real-
time phased-array imaging systems," IEEE Transactions on Ultrasonics,
Ferroelectrics and Frequency Control, vol. 39, pp. 341-351, 1992.
[66] Y. M. Yoo, W.-Y. Lee, and T.-K. Song, "A low voltage portable system using
modified Golay sequences," in IEEE Ultrasonics Symposium. vol. 2, 2001, pp.
1469-1472
[67] Y. M. Yoo, J. Cao, L. M. Koh, and Y. Kim, "Coded excitation with sigma-delta
sampling for medical ultrasound imaging," in Progress in biomedical optics and
imaging. vol. 7, 2006.
ATTENTION: The Singapore Copyright Act applies to the use of this document. Nanyang Technological University Library

115
A p p e n d i x A
BEAMFORMING
In ultrasound imaging, different transducer elements are activated to receive the
reflected ultrasound echoes simultaneously. In order to extract the ultrasound echo from
a certain focal point out of those from other area, beamforming is applied. The
beamforming process is illustrated in Fig. A1.
Fig. A1. Beamforming process.
As shown in Fig. A1, the signal from the focal point arrives at different transducer
elements at different timing. To synchronize the signal, the beamformer provides the
ATTENTION: The Singapore Copyright Act applies to the use of this document. Nanyang Technological University Library

116
corresponding delay to each channel. Summation is then performed to amplify the
synchronized signal. As a result, the echoes from other areas will be suppressed.
ATTENTION: The Singapore Copyright Act applies to the use of this document. Nanyang Technological University Library

117
A p p e n d i x B
BEAMFORMER STRUCTURES
Sigma-delta beamformer (SDBF) was developed by replacing the multi-bit ADCs in
conventional beamformer with sigma-delta ADCs (including sigma-delta modulators
and reconstruction filters). Such a SDBF is known as pre-delay reconstruction SDBF
because the signal reconstruction is done before the delay focusing process. The
structure of pre-delay reconstruction SDBF is shown in Fig. B1.
Fig. B1. Pre-delay reconstruction SDBF structure.
Pre-delay reconstruction
filter
Pre-delay reconstruction
filter
ATTENTION: The Singapore Copyright Act applies to the use of this document. Nanyang Technological University Library

118
As shown in Fig. B1, each beamforming channel consists of a highly complex pre-delay
reconstruction filter to reconstruction the multi-bit signal from the sigma-delta
modulated signal.
In an attempt to reduce the hardware complexity of SDBF, Noujaim et al. developed a
post-delay reconstruction SDBF by moving the signal reconstruction process after delay
focusing process as shown in Fig. B2.
Fig. B2. Post-delay reconstruction SDBF structure.
The post-delay reconstruction SDBF needs only one reconstruction filter for the entire
beamformer and the depth of the memory device in each channel is reduced to single bit.
It significantly reduces the hardware complexity of the SDBF. However, post-delay
reconstruction SDBF suffers from artifact problem when dynamic focusing is applied.
Post-delay reconstruction
filter
ATTENTION: The Singapore Copyright Act applies to the use of this document. Nanyang Technological University Library

119
A p p e n d i x C
MULTI-BIT ADC SPECIFICATION
C.1 Doppler mode
For Doppler processing, a 100dB resolution ADCs are needed if digital processing is
applied because the ultrasound echoes reflected by blood flow is very weak. For a 128
channel array with rectangular windowing, the apodization power gain is
dBw
wG N
nn
N
nn
SNR 21
1
2
2
1 =
=
∑
∑
=
= (C1)
Hence, in order to obtain a total DR of 100dB, the DR needed for each channel is 79dB.
The DR of an N-bit ADC can be expressed in terms of dB as
76.102.6 −= NDR (dB) (C2)
N was found to be 13.4 in order to obtain a DR of 79dB. That means the ADC needs to
have at least 14 bits to fulfill the DR requirement for high resolution machine.
ATTENTION: The Singapore Copyright Act applies to the use of this document. Nanyang Technological University Library

120
C.2 High quality B-mode
In order to obtain high quality ultrasound image in 80dB dynamic range, the
transmission and reception sidelobe level cannot be higher than -40dB each.. To achieve
a maximum average sidelobe level of -40dB for both transmission and reception (for
128 channel array with rectangular windowing), the sampling frequency required to
achieve sufficient delay resolution can be calculated using the peak random quantization
sidelobe (voltage) level equation
21
36.4
≈
chfpeak N
ENBWr
SLπ
(C3)
where ENBW is the equivalent noise bandwidth which is 1 in this case when rectangular
window is used for apodization, rf is the ratio of sampling frequency to signal bandwidth
(which is equal to 2×OSR), and Nch is the number of elements, under the condition that
the error components are uncorrelated from channel to channel.
For a system with 128 channel array with rectangular windowing, rf is found to be 35
from (C3). Hence the sampling frequency needs to be at least 35 times higher than the
central frequency of the ultrasound signal, equivalent to an OSR of 17. For a signal with
5MHz bandwidth, the sampling frequency will be 175MHz.
ATTENTION: The Singapore Copyright Act applies to the use of this document. Nanyang Technological University Library