MRC Corporate Office, Nigdi MRC LOGISTICS (I) PVT. LTD. PRESENTATION OF.
This paper is included in the Proceedings of the 13th USENIX Conference on
File and Storage Technologies (FAST ’15).February 16–19, 2015 • Santa Clara, CA, USA
ISBN 978-1-931971-201
Open access to the Proceedings of the 13th USENIX Conference on
File and Storage Technologies is sponsored by USENIX
Efficient MRC Construction with SHARDSCarl A. Waldspurger, Nohhyun Park, Alexander Garthwaite,
and Irfan Ahmad, CloudPhysics, Inc.
https://www.usenix.org/conference/fast15/technical-sessions/presentation/waldspurger
USENIX Association 13th USENIX Conference on File and Storage Technologies (FAST ’15) 95
Efficient MRC Construction with SHARDS
Carl A. Waldspurger Nohhyun Park Alexander Garthwaite Irfan AhmadCloudPhysics, Inc.
AbstractReuse-distance analysis is a powerful technique for char-acterizing temporal locality of workloads, often visual-ized with miss ratio curves (MRCs). Unfortunately, eventhe most efficient exact implementations are too heavy-weight for practical online use in production systems.
We introduce a new approximation algorithm thatemploys uniform randomized spatial sampling, imple-mented by tracking references to representative loca-tions selected dynamically based on their hash values.A further refinement runs in constant space by lower-ing the sampling rate adaptively. Our approach, calledSHARDS (Spatially Hashed Approximate Reuse DistanceSampling), drastically reduces the space and time re-quirements of reuse-distance analysis, making continu-ous, online MRC generation practical to embed into pro-duction firmware or system software. SHARDS also en-ables the analysis of long traces that, due to memory con-straints, were resistant to such analysis in the past.
We evaluate SHARDS using trace data collected froma commercial I/O caching analytics service. MRCs gen-erated for more than a hundred traces demonstrate highaccuracy with very low resource usage. MRCs con-structed in a bounded 1 MB footprint, with effective sam-pling rates significantly lower than 1%, exhibit approxi-mate miss ratio errors averaging less than 0.01. For largetraces, this configuration reduces memory usage by a fac-tor of up to 10,800 and run time by a factor of up to 204.
1 Introduction
Caches designed to accelerate data access by exploitinglocality are pervasive in modern storage systems. Oper-ating systems and databases maintain in-memory buffercaches containing “hot” blocks considered likely to bereused. Server-side or networked storage caches usingflash memory are popular as a cost-effective way to re-duce application latency and offload work from rotatingdisks. Virtually all storage devices — ranging from indi-vidual disk drives to large storage arrays — include sig-nificant caches composed of RAM or flash memory.
Since cache space consists of relatively fast, expensivestorage, it is inherently a scarce resource, and is com-monly shared among multiple clients. As a result, op-timizing cache allocations is important, and approaches
for estimating workload performance as a function ofcache size are particularly valuable.
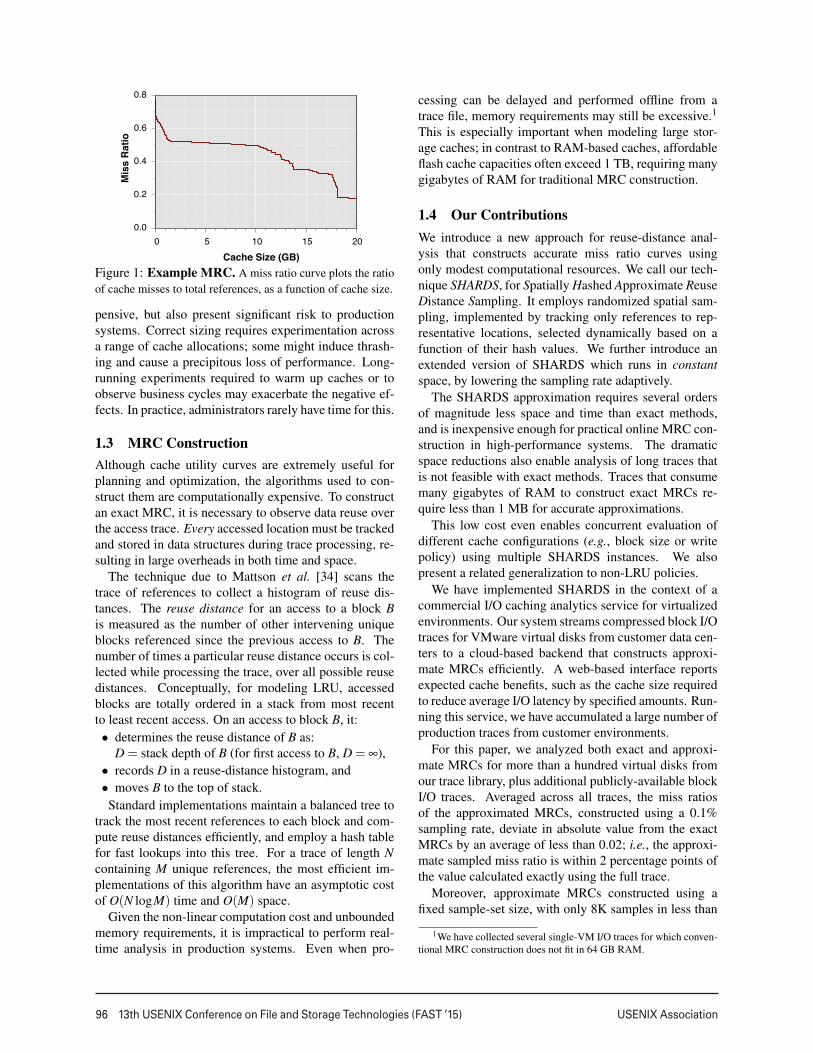
1.1 Cache Utility CurvesCache utility curves are effective tools for managingcache allocations. Such curves plot a performance metricas a function of cache size. Figure 1 shows an examplemiss-ratio curve (MRC), which plots the ratio of cachemisses to total references for a workload (y-axis) as afunction of cache size (x-axis). The higher the miss ra-tio, the worse the performance; the miss ratio decreasesas cache size increases. MRCs come in many shapesand sizes, and represent the historical cache behavior ofa particular workload.
Assuming some level of stationarity in the workloadpattern at the time scale of interest, its MRC can also beused to predict its future cache performance. An admin-istrator can use a system-wide miss ratio curve to helpdetermine the aggregate amount of cache space to pro-vision for a desired improvement in overall system per-formance. Similarly, an automated cache manager canutilize separate MRCs for multiple workloads of varyingimportance, optimizing cache allocations dynamically toachieve service-level objectives.
1.2 Weaker AlternativesThe concept of a working set — the set of data accessedduring the most recent sample interval [16] — is oftenused by online allocation algorithms in systems software[12, 54, 61]. While working-set estimation providesvaluable information, it doesn’t measure data reuse, nordoes it predict changes in performance as cache alloca-tions are varied. Without the type of information con-veyed in a cache utility curve, administrators or auto-mated systems seeking to optimize cache allocations areforced to resort to simple heuristics, or to engage in trial-and-error tests. Both approaches are problematic.
Heuristics simply don’t work well for cache sizing,since they cannot capture the temporal locality profile ofa workload. Without knowledge of marginal benefits, forexample, doubling (or halving) the cache size for a givenworkload may change its performance only slightly, orby a dramatic amount.
Trial-and-error tests that vary the size of a cache andmeasure the effect are not only time-consuming and ex-
96 13th USENIX Conference on File and Storage Technologies (FAST ’15) USENIX Association
0.0
0.2
0.4
0.6
0.8
0 5 10 15 20
Mis
s R
atio
Cache Size (GB)Figure 1: Example MRC. A miss ratio curve plots the ratioof cache misses to total references, as a function of cache size.
pensive, but also present significant risk to productionsystems. Correct sizing requires experimentation acrossa range of cache allocations; some might induce thrash-ing and cause a precipitous loss of performance. Long-running experiments required to warm up caches or toobserve business cycles may exacerbate the negative ef-fects. In practice, administrators rarely have time for this.
1.3 MRC ConstructionAlthough cache utility curves are extremely useful forplanning and optimization, the algorithms used to con-struct them are computationally expensive. To constructan exact MRC, it is necessary to observe data reuse overthe access trace. Every accessed location must be trackedand stored in data structures during trace processing, re-sulting in large overheads in both time and space.
The technique due to Mattson et al. [34] scans thetrace of references to collect a histogram of reuse dis-tances. The reuse distance for an access to a block Bis measured as the number of other intervening uniqueblocks referenced since the previous access to B. Thenumber of times a particular reuse distance occurs is col-lected while processing the trace, over all possible reusedistances. Conceptually, for modeling LRU, accessedblocks are totally ordered in a stack from most recentto least recent access. On an access to block B, it:• determines the reuse distance of B as:
D = stack depth of B (for first access to B, D = ∞),• records D in a reuse-distance histogram, and• moves B to the top of stack.
Standard implementations maintain a balanced tree totrack the most recent references to each block and com-pute reuse distances efficiently, and employ a hash tablefor fast lookups into this tree. For a trace of length Ncontaining M unique references, the most efficient im-plementations of this algorithm have an asymptotic costof O(N logM) time and O(M) space.
Given the non-linear computation cost and unboundedmemory requirements, it is impractical to perform real-time analysis in production systems. Even when pro-
cessing can be delayed and performed offline from atrace file, memory requirements may still be excessive.1
This is especially important when modeling large stor-age caches; in contrast to RAM-based caches, affordableflash cache capacities often exceed 1 TB, requiring manygigabytes of RAM for traditional MRC construction.
1.4 Our ContributionsWe introduce a new approach for reuse-distance anal-ysis that constructs accurate miss ratio curves usingonly modest computational resources. We call our tech-nique SHARDS, for Spatially Hashed Approximate ReuseDistance Sampling. It employs randomized spatial sam-pling, implemented by tracking only references to rep-resentative locations, selected dynamically based on afunction of their hash values. We further introduce anextended version of SHARDS which runs in constantspace, by lowering the sampling rate adaptively.
The SHARDS approximation requires several ordersof magnitude less space and time than exact methods,and is inexpensive enough for practical online MRC con-struction in high-performance systems. The dramaticspace reductions also enable analysis of long traces thatis not feasible with exact methods. Traces that consumemany gigabytes of RAM to construct exact MRCs re-quire less than 1 MB for accurate approximations.
This low cost even enables concurrent evaluation ofdifferent cache configurations (e.g., block size or writepolicy) using multiple SHARDS instances. We alsopresent a related generalization to non-LRU policies.
We have implemented SHARDS in the context of acommercial I/O caching analytics service for virtualizedenvironments. Our system streams compressed block I/Otraces for VMware virtual disks from customer data cen-ters to a cloud-based backend that constructs approxi-mate MRCs efficiently. A web-based interface reportsexpected cache benefits, such as the cache size requiredto reduce average I/O latency by specified amounts. Run-ning this service, we have accumulated a large number ofproduction traces from customer environments.
For this paper, we analyzed both exact and approxi-mate MRCs for more than a hundred virtual disks fromour trace library, plus additional publicly-available blockI/O traces. Averaged across all traces, the miss ratiosof the approximated MRCs, constructed using a 0.1%sampling rate, deviate in absolute value from the exactMRCs by an average of less than 0.02; i.e., the approxi-mate sampled miss ratio is within 2 percentage points ofthe value calculated exactly using the full trace.
Moreover, approximate MRCs constructed using afixed sample-set size, with only 8K samples in less than
1We have collected several single-VM I/O traces for which conven-tional MRC construction does not fit in 64 GB RAM.
USENIX Association 13th USENIX Conference on File and Storage Technologies (FAST ’15) 97
1 MB memory, deviate by an average of less than 0.01from the exact full trace values. This high accuracy isachieved despite dramatic memory savings by a factor ofup to 10,800× for large traces, and a median of 185×across all traces. The computation cost is also reducedup to 204× for large traces, with a median of 22×.
The next section presents the SHARDS algorithm,along with an extended version that runs in constantspace. Details of our MRC construction implementationare examined in Section 3. Section 4 evaluates SHARDSthrough quantitative experiments on more than a hundredreal-world I/O traces. Related work is discussed in Sec-tion 5. Finally, we summarize our conclusions and high-light opportunities for future work in Section 6.
2 SHARDS Sampling Algorithm
Our core idea is centered around a simple question: whatif we compute reuse distances for a randomly sampledsubset of the referenced blocks? The answer leads toSHARDS, a new algorithm based on spatially-hashedsampling. Despite the focus on storage MRCs, this ap-proach can be applied more generally to approximateother cache utility curves, with any stream of referencescontaining virtual or physical location identifiers.
2.1 Basic SHARDSSHARDS is conceptually simple — for each referencedlocation L, the decision of whether or not to sample L isbased on whether hash(L) satisfies some condition. Forexample, the condition hash(L) mod 100 < K samplesapproximately K percent of the entire location space. As-suming a reasonable hash function, this effectively im-plements uniform random spatial sampling.
This method has several desirable properties. As re-quired for reuse distance computations, it ensures that allaccesses to the same location will be sampled, since theywill have the same hash value. It does not require anyprior knowledge about the system, its workload, or thelocation address space. In particular, no information isneeded about the set of locations that may be accessedby the workload, nor the distribution of accesses to theselocations. As a result, SHARDS sampling is effectivelystateless. In contrast, explicitly pre-selecting a randomsubset of locations may require significant storage, espe-cially if the location address space is large. Often, only asmall fraction of this space is accessed by the workload,making such pre-selection especially inefficient.
More generally, using the sampling conditionhash(L) mod P < T , with modulus P and threshold T ,the effective sampling rate is R = T/P, and each samplerepresents 1/R locations, in a statistical sense. Thesampling rate may be varied by changing the threshold
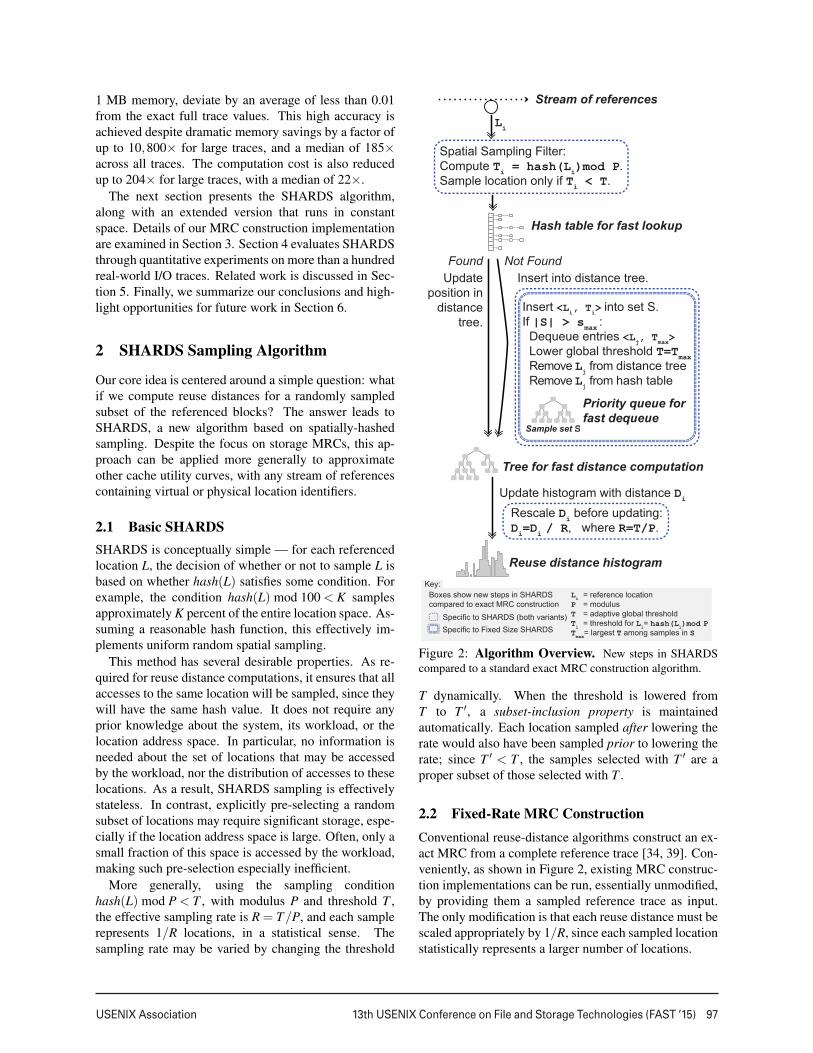
Hash table for fast lookup
Li
Sample set S
Reuse distance histogram
Tree for fast distance computation
Stream of references
Insert <Li, Ti> into set S.If |S| > smax : Dequeue entries <Lj, Tmax> Lower global threshold T=Tmax
Remove Lj from distance tree Remove Lj from hash table
Specific to SHARDS (both variants)
Boxes show new steps in SHARDScompared to exact MRC construction
Specific to Fixed Size SHARDS
Spatial Sampling Filter:Compute Ti = hash(Li)mod P.Sample location only if Ti < T.
Insert into distance tree.
Update histogram with distance Di
Updateposition in
distancetree.
Rescale Di before updating:Di=Di / R, where R=T/P.
Li = reference locationP = modulusT = adaptive global threshold
Ti = threshold for Li= hash(Li)mod PTmax= largest T among samples in S
Priority queue forfast dequeue
Not FoundFound
Key:
Figure 2: Algorithm Overview. New steps in SHARDScompared to a standard exact MRC construction algorithm.
T dynamically. When the threshold is lowered fromT to T ′, a subset-inclusion property is maintainedautomatically. Each location sampled after lowering therate would also have been sampled prior to lowering therate; since T ′ < T , the samples selected with T ′ are aproper subset of those selected with T .
2.2 Fixed-Rate MRC ConstructionConventional reuse-distance algorithms construct an ex-act MRC from a complete reference trace [34, 39]. Con-veniently, as shown in Figure 2, existing MRC construc-tion implementations can be run, essentially unmodified,by providing them a sampled reference trace as input.The only modification is that each reuse distance must bescaled appropriately by 1/R, since each sampled locationstatistically represents a larger number of locations.
98 13th USENIX Conference on File and Storage Technologies (FAST ’15) USENIX Association
Standard MRC construction algorithms are computa-tionally expensive. Consider a reference stream contain-ing N total references to M unique locations. Whilean optimized implementation using efficient data struc-tures requires only O(N logM) time, it still consumesO(M) space for the hash table and balanced tree usedto compute reuse distances. SHARDS can be used toconstruct an approximate MRC in dramatically less timeand space. With a fixed sampling rate R, the expectednumber of unique sampled locations becomes R ·M. As-suming the sampled locations are fairly representative,the total number of sampled references is reduced to ap-proximately R ·N. As we will see in Section 4, for mostworkloads, R = 0.001 yields very accurate MRCs, us-ing memory and processing resources that are orders ofmagnitude smaller than conventional approaches.
2.3 Fixed-Size MRC ConstructionFixed-rate MRC construction achieves a radical reduc-tion in computational resource requirements. Neverthe-less, even with a low, constant sampling rate, space re-quirements may still grow without bound, along with thetotal number of unique locations that must be tracked.For memory-constrained environments, such as produc-tion cache controller firmware where MRCs could in-form cache allocation decisions, it is desirable to placean upper bound on memory size.
An additional issue is the choice of an appropriatesampling rate, R, since the accuracy of MRC approxi-mation using spatial sampling also depends on N and M.When these values are small, it is preferable to use a rela-tively large value for R (such as 0.1) to improve accuracy.When these values are large, it is preferable to use a rela-tively small value of R (such as 0.001), to avoid wastingor exhausting available resources. Weighing these trade-offs is difficult, especially with incomplete information.
This suggests that accuracy may depend more on anadequate sample size than a particular sampling rate.This motivates an extended version of SHARDS thatconstructs an MRC in O(1) space and O(N) time, re-gardless of the size or other properties of its input trace.
2.3.1 Sampling Rate AdaptationAn appropriate sampling rate is determined automati-cally, and need not be specified. The basic idea is tolower the sampling rate adaptively, in order to maintaina fixed bound on the total number of sampled locationsthat are tracked at any given point in time. The samplingrate is initialized to a high value, and is lowered grad-ually as more unique locations are encountered. Thisapproach leverages the subset-inclusion property main-tained by SHARDS as the rate is reduced.
Initially, the sampling rate is set to a high value, suchas R0 = 1.0, the maximum possible value. This is im-
plemented by using a sampling condition of the formhash(L) mod P < T , and setting the initial threshold T =P, so that every location L will be selected. In practice,R0 = 0.1 is sufficiently high for nearly any workload.
The goal of operating in constant space implies thatwe cannot continue to track all sampled references. Asshown in Figure 2, a new auxiliary data structure is in-troduced to maintain a fixed-size set S with cardinality|S|. Each element of S is a tuple 〈Li, Ti〉, consisting of anactively-sampled location Li, and its associated thresholdvalue, Ti = hash(Li) mod P. Let smax denote the max-imum desired size |S| of set S; i.e., smax is a constantrepresenting an upper bound on the number of actively-sampled locations. S can be implemented efficiently as apriority queue, ordered by the tuple’s threshold value.
When the first reference to a location L that satisfiesthe current sampling condition is processed, it is a coldmiss, since it has never been resident in the cache. In thiscase, L is not already in S, so it must be added to the set.If, after adding L, the bound on the set of active locationswould be exceeded, such that |S| > smax, then the sizeof S must be reduced. The element
⟨L j, Tmax
⟩with the
largest threshold value Tmax is removed from the set, us-ing a priority-queue dequeue operation. The threshold Tused in the current sampling condition is reduced to Tmax,effectively reducing the sampling rate from Rold = T/Pto a new, strictly lower rate Rnew = Tmax/P, narrowingthe criteria used for future sample selection.
The corresponding location L j is also removed fromall other data structures, such as the hash table and treeused in standard implementations. If any additional el-ements of S have the same threshold Tmax, then they arealso removed from S in the same manner.
2.3.2 Histogram Count RescalingAs with fixed-rate sampling, reuse distances must bescaled by 1/R to reflect the sampling rate. An additionalconsideration for the fixed-size case is that R is adjusteddynamically. As the rate is reduced, the counts associ-ated with earlier updates to the reuse-distance histogramneed to be adjusted. Ideally, the effects of all updatesassociated with an evicted sample should be rescaled ex-actly. Since this would incur significant space and pro-cessing costs, we opt for a simple approximation.
When the threshold is reduced, the count associatedwith each histogram bucket is scaled by the ratio of thenew and old sampling rates, Rnew/Rold , which is equiva-lent to the ratio of the new and old thresholds, Tnew/Told .Rescaling makes the simplifying assumption that previ-ous references to an evicted sample contributed equallyto all existing buckets. While this is unlikely to be truefor any individual sample, it is nonetheless a reasonablestatistical approximation when viewed over many sam-ple evictions and rescaling operations. Rescaling ensures
USENIX Association 13th USENIX Conference on File and Storage Technologies (FAST ’15) 99
0.0
0.1
0.2
0.3
0.4
0.5
0.6
0.7
0.8
0.9
1.0
0 20 40 60 80Cache Size (GB)
Mis
s R
atio
Sampling Rate (R)Exact MRC0.10.010.0010.00010.00001
(a)
0.0
0.1
0.2
0.3
0.4
0.5
0.6
0.7
0.8
0.9
1.0
0 20 40 60 80Cache Size (GB)
Mis
s R
atio
Sample Size (smax)
Exact MRC32K8K2K512128
(b)
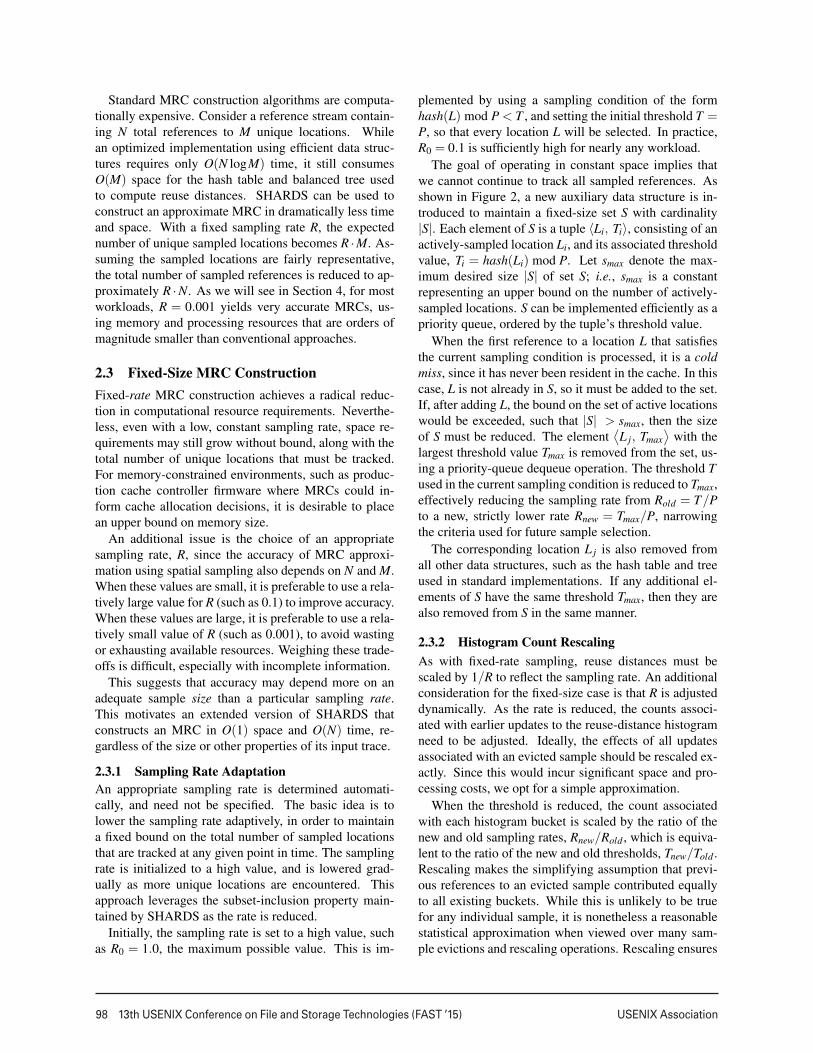
Figure 3: Example SHARDS MRCs. MRCs constructed for a block I/O trace containing 69.5M references to 5.2M uniqueblocks, using (a) fixed-rate SHARDS, varying R from 0.00001 to 0.1, and (b) fixed-size SHARDS, varying smax from 128 to 32K.
that subsequent references to the remaining samples in Shave the appropriate relative weight associated with theircorresponding histogram bucket increments.
Conceptually, rescaling occurs immediately each timethe current sampling threshold T is reduced. In practice,to avoid the expense of rescaling all histogram countson every threshold change, it is instead performed in-crementally. This is accomplished efficiently by storingTbucket with each histogram bucket, representing the sam-pling threshold in effect when the bucket was last up-dated. When incrementing a bucket count, if Tbucket �= T ,then the existing count is first rescaled by T/Tbucket , thecount is incremented, and Tbucket is set to T . During thefinal step in MRC construction, when histogram buck-ets are summed to generate miss ratios, any buckets forwhich Tbucket �= T need to be similarly rescaled.
3 Design and Implementation
We have developed several different implementations ofSHARDS. Although designed for flexible experimenta-tion, efficiency — especially space efficiency — was al-ways a key goal. This section describes important as-pects of both our fixed-rate and fixed-size MRC con-struction implementations, and discusses considerationsfor modeling various cache policies.
3.1 Fixed-Rate ImplementationTo facilitate comparison with a known baseline, we startwith the sequential version of the open-source C imple-mentation of PARDA [39, 38]. PARDA takes a tracefile as input, and performs offline reuse distance analysis,yielding an MRC. The implementation leverages two keydata structures: a hash table that maps a location to the
timestamp of its most recent reference, and a splay tree[48, 47] that is used to compute the number of distinctlocations referenced since this timestamp.
Only a few simple modifications to the PARDA codewere required to implement fixed-rate SHARDS, involv-ing less than 50 lines of code. First, each referencedlocation read from the trace file is hashed, and pro-cessed only if it meets the specified sampling conditionhash(L) mod P < T . For efficiency, the modulus P isset to a power of two2 and “mod P” is replaced withthe less expensive bitwise mask operation “& (P− 1)”.For a given sampling rate R, the threshold T is set toround(R ·P). For the hash function, we used the public-domain C implementation of MurmurHash3 [3]. We alsoexperimented with other hash functions, including a fastpseudo-random number generator [13], and found thatthey yielded nearly identical results.
Next, computed reuse distances are adjusted to re-flect the sampling rate. Each raw distance D is simplydivided by R to yield the appropriately scaled distanceD/R. Since R = T/P, the scaled distance (D ·P)/T iscomputed efficiently using an integer shift and division.
Figure 3(a) presents an example application of fixed-rate SHARDS, using a real-world storage block I/Otrace3. The exact MRC is constructed using the un-sampled, full-trace PARDA baseline. Five approximateMRCs are plotted for different fixed sampling rates,varying R between 0.00001 and 0.1, using powers of ten.The approximate curves for R ≥ 0.001 are nearly indis-tinguishable from the exact MRC.
2We use P = 224, providing sufficient resolution to represent verylow sampling rates, while still avoiding integer overflow when using64-bit arithmetic for scaling operations.
3Customer VM disk trace t04, which also appears later in Figure 5.
100 13th USENIX Conference on File and Storage Technologies (FAST ’15) USENIX Association
Data structure element smax < 64K smax < 4Ghash table chain pointer 2 4hash table entry 12 16reference splay tree node 14 20sample splay tree node 12 20total per-sample size 40 60
Table 1: Fixed-size SHARDS Data Structure Sizes.Size (in bytes) used to represent elements of key data struc-tures, for both 16-bit and 32-bit values of smax.
3.2 Fixed-Size Implementation
With a constant memory footprint, fixed-size SHARDSis suitable for online use in memory-constrained systems,such as device drivers in embedded systems. To exploresuch applications, we developed a new implementation,written in C, optimized for for space efficiency.
Since all data structure sizes are known up-front,memory is allocated only during initialization. In con-trast, other implementations perform a large number ofdynamic allocations for individual tree nodes and hashtable entries. A single, contiguous allocation is faster,and enables further space optimizations. For example,if the maximum number of samples smax is bounded by64K, “pointers” can be represented compactly as 16-bitindices instead of ordinary 64-bit addresses.
Like PARDA, our implementation leverages Sleator’spublic-domain splay tree code [47]. In addition to usinga splay tree for computing reuse distances, we employ asecond splay tree to maintain a priority queue represent-ing the sample set S, ordered by hash threshold value. Aconventional chained hash table maps locations to splaytree nodes. As an additional space optimization, refer-ences between data structures are encoded using smallindices instead of general-purpose pointers.
The combined effect of these space-saving optimiza-tions is summarized in Table 1, which reports the per-sample sizes for key data structures. Additional mem-ory is needed for the output histogram; each bucket con-sumes 12 bytes to store a count and the update thresh-old Tbucket used for rescaling. For example, with smax =8K, the aggregate overhead for samples is only 320 KB.Using 10K histogram buckets, providing high resolutionfor evaluating cache allocation sizes, consumes another120 KB. Even when code size, stack space, and all othermemory usage is considered, the entire measured run-time footprint remains smaller than 1 MB, making thisimplementation practical even for extremely memory-constrained execution environments.
Figure 3(b) presents an example application of fixed-size SHARDS, using the same trace as Figure 3(a). Fiveapproximate MRCs are plotted for different fixed samplesizes, varying smax between 128 and 32K, using factorsof four. The approximate curves for smax ≥ 2K are nearlyindistinguishable from the exact MRC.
3.3 Modeling Cache PolicyPARDA uses a simple binary trace format: a sequence of64-bit references, with no additional metadata. StorageI/O traces typically contain richer information for eachreference, including a timestamp, access type (read orwrite), and a location represented as an offset and length.
For the experiments in this paper, we converted I/Oblock traces to the simpler PARDA format, assumed afixed cache block size, and ignored the distinction be-tween reads and writes. This effectively models a simpleLRU policy with fixed access granularity, where the firstaccess to a block is counted as a miss.
We have also developed other SHARDS implemen-tations to simulate diverse caching policies. For exam-ple, on a write miss to a partial cache block, a write-through cache may first read the entire enclosing cache-block-sized region from storage. The extra read over-head caused by partial writes can be modeled by main-taining separate histograms for ordinary reads and readsinduced by partial writes. Other write-through cachesmanage partial writes at sub-block granularity, modeledusing known techniques [57]. In all cases, we foundhash-based spatial sampling to be extremely effective.
4 Experimental Evaluation
We conducted a series of experiments with over a hun-dred real-world I/O traces collected from our commercialcaching analytics service for virtualized environments.We first describe our data collection system and charac-terize the trace files used in this paper. Next, we evaluatethe accuracy of approximate MRCs. Finally, we presentresults of performance experiments that demonstrate thespace and time efficiency of our implementations.
4.1 Data CollectionOur SaaS caching analytics service is designed to collectblock I/O traces for VMware virtual disks in customerdata centers running the VMware ESXi hypervisor [60].A user-mode application, deployed on each ESXi host,coordinates with the standard VMware vscsiStats utility[1] to collect complete block I/O traces for VM virtualdisks. A web-based interface allows particular virtualdisks to be selected for tracing remotely.
Compressed traces are streamed to a cloud-basedbackend to perform various storage analyses, includingoffline MRC construction using SHARDS. If the traceis not needed for additional storage analysis, SHARDSsampling could be performed locally, obviating the needto stream full traces. Ideally, SHARDS should be inte-grated directly with the kernel-mode hypervisor compo-nent of vscsiStats for maximum efficiency, enabling con-tinuous, online reuse-distance analysis.
USENIX Association 13th USENIX Conference on File and Storage Technologies (FAST ’15) 101
Fixed Rate Fixed Size Adjusted Fixed Size
●
●
●
●
●
●
●
●●
●●
●
●●
●
●
●
●
●
●
●
●
●
●●
●
●
●
●
●●
●
●
●
●
●
●
●
●
●
●
●
●
●
●
●●
●
●●
●
●
●
●
●
●
●●
●
●
●
●
●
●
●
●●
●●
●
●
●
●
●
●
●●
● ●
●
●
●
●
●
●
●
●
●
●●
●
●●●●
●
●●●
●
●
●
●
●●
●●●
●
●
●●●
●
●
●
●
●●●●●●
●
●
●
●
●
●●
●
●
●
●
●
●
●
●
●
●●
●
●
●
●
●●●
●
●
●
●
●
●●●●●
●●
●●●●●●●●●●●●●●●●●●●●●●●●●●●●●●●●●
0.000
0.025
0.050
0.075
0.100
0.125
0.150
0.175
0.200
0.225
0.250
0.0001 0.001 0.01 0.1 128 256 512 1K 2K 4K 8K 16K 32K 128 512 2K 8K 32KSampling Rate (R) Sample Size (smax) Sample Size (smax)
Aver
age
Erro
rtwo points at 0.27, 0.33 one point at 0.35
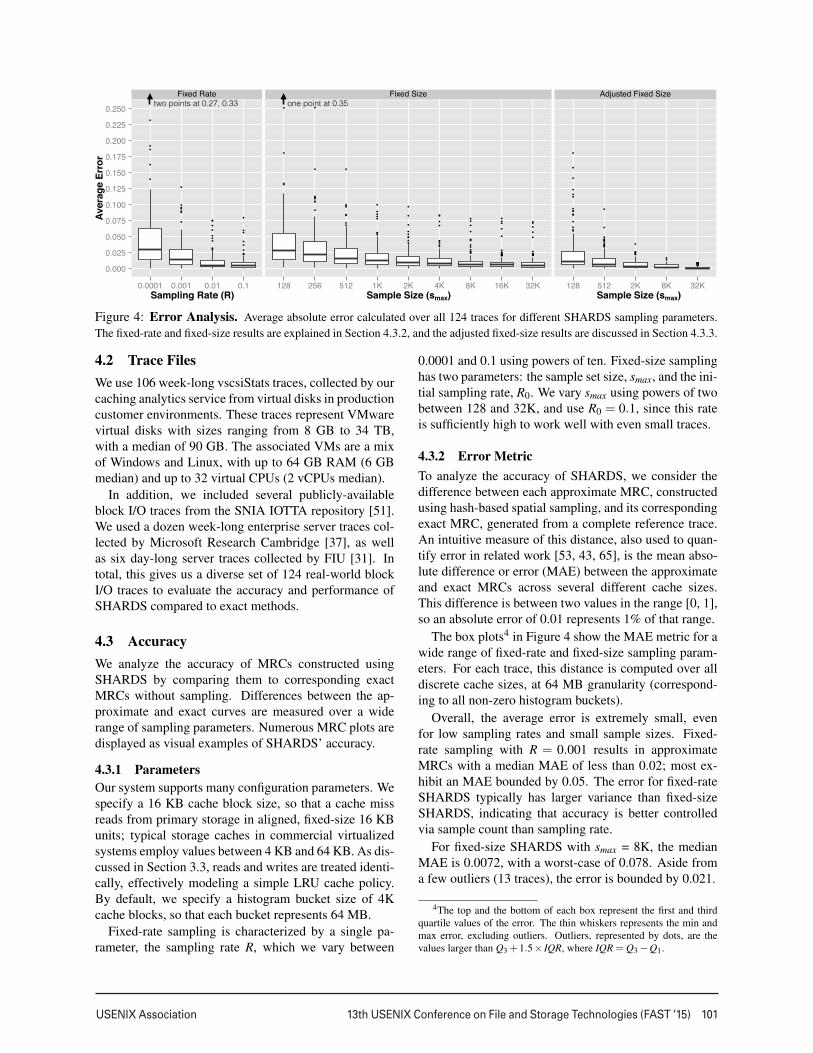
Figure 4: Error Analysis. Average absolute error calculated over all 124 traces for different SHARDS sampling parameters.The fixed-rate and fixed-size results are explained in Section 4.3.2, and the adjusted fixed-size results are discussed in Section 4.3.3.
4.2 Trace FilesWe use 106 week-long vscsiStats traces, collected by ourcaching analytics service from virtual disks in productioncustomer environments. These traces represent VMwarevirtual disks with sizes ranging from 8 GB to 34 TB,with a median of 90 GB. The associated VMs are a mixof Windows and Linux, with up to 64 GB RAM (6 GBmedian) and up to 32 virtual CPUs (2 vCPUs median).
In addition, we included several publicly-availableblock I/O traces from the SNIA IOTTA repository [51].We used a dozen week-long enterprise server traces col-lected by Microsoft Research Cambridge [37], as wellas six day-long server traces collected by FIU [31]. Intotal, this gives us a diverse set of 124 real-world blockI/O traces to evaluate the accuracy and performance ofSHARDS compared to exact methods.
4.3 AccuracyWe analyze the accuracy of MRCs constructed usingSHARDS by comparing them to corresponding exactMRCs without sampling. Differences between the ap-proximate and exact curves are measured over a widerange of sampling parameters. Numerous MRC plots aredisplayed as visual examples of SHARDS’ accuracy.
4.3.1 ParametersOur system supports many configuration parameters. Wespecify a 16 KB cache block size, so that a cache missreads from primary storage in aligned, fixed-size 16 KBunits; typical storage caches in commercial virtualizedsystems employ values between 4 KB and 64 KB. As dis-cussed in Section 3.3, reads and writes are treated identi-cally, effectively modeling a simple LRU cache policy.By default, we specify a histogram bucket size of 4Kcache blocks, so that each bucket represents 64 MB.
Fixed-rate sampling is characterized by a single pa-rameter, the sampling rate R, which we vary between
0.0001 and 0.1 using powers of ten. Fixed-size samplinghas two parameters: the sample set size, smax, and the ini-tial sampling rate, R0. We vary smax using powers of twobetween 128 and 32K, and use R0 = 0.1, since this rateis sufficiently high to work well with even small traces.
4.3.2 Error MetricTo analyze the accuracy of SHARDS, we consider thedifference between each approximate MRC, constructedusing hash-based spatial sampling, and its correspondingexact MRC, generated from a complete reference trace.An intuitive measure of this distance, also used to quan-tify error in related work [53, 43, 65], is the mean abso-lute difference or error (MAE) between the approximateand exact MRCs across several different cache sizes.This difference is between two values in the range [0, 1],so an absolute error of 0.01 represents 1% of that range.
The box plots4 in Figure 4 show the MAE metric for awide range of fixed-rate and fixed-size sampling param-eters. For each trace, this distance is computed over alldiscrete cache sizes, at 64 MB granularity (correspond-ing to all non-zero histogram buckets).
Overall, the average error is extremely small, evenfor low sampling rates and small sample sizes. Fixed-rate sampling with R = 0.001 results in approximateMRCs with a median MAE of less than 0.02; most ex-hibit an MAE bounded by 0.05. The error for fixed-rateSHARDS typically has larger variance than fixed-sizeSHARDS, indicating that accuracy is better controlledvia sample count than sampling rate.
For fixed-size SHARDS with smax = 8K, the medianMAE is 0.0072, with a worst-case of 0.078. Aside froma few outliers (13 traces), the error is bounded by 0.021.
4The top and the bottom of each box represent the first and thirdquartile values of the error. The thin whiskers represents the min andmax error, excluding outliers. Outliers, represented by dots, are thevalues larger than Q3 +1.5× IQR, where IQR = Q3 −Q1.
102 13th USENIX Conference on File and Storage Technologies (FAST ’15) USENIX Association
msr_mds (1.10%) msr_proj (0.06%) msr_src1 (0.06%) t00 (0.38%) t01 (0.05%) t02 (0.28%) t03 (0.65%)
t04 (0.28%) t05 (1.00%) t06 (0.33%) t07 (0.98%) t08 (0.04%) t09 (0.21%) t10 (0.61%)
t11 (0.65%) t12 (0.43%) t13 (0.46%) t14 (0.38%) t15 (0.10%) t16 (1.20%) t17 (0.54%)
t18 (0.08%) t19 (0.06%) t20 (0.03%) t21 (0.09%) t22 (0.04%) t23 (0.07%) t24 (0.65%)
t25 (1.20%) t26 (0.33%) t27 (0.50%) t28 (0.57%) t29 (0.12%) t30 (0.06%) t31 (0.95%)
0.00.51.0
0.00.51.0
0.00.51.0
0.00.51.0
0.00.51.0
0 40 80 0 500 1000 0 200 0 20 40 0 200 400 0 60 120 0 20
0 30 60 0 9 18 0 50 100 0 20 40 0 300 600 0 60 120 0 20 40
0 20 40 0 20 40 600 30 60 0 100 200 300 0 200 400 0 20 40 0 40 80
0 100 200 0 200 400 0 300 600 0 200 400 0 300 600 0 200 400 0 20 40
0 5 10 0 30 60 0 20 40 0 20 40 0 300 600 0 100 200 300 0 7 14Cache Size (GB)
Mis
s R
atio
Exact (unsampled) SHARDSadj (smax=8K) SHARDS (smax=8K)
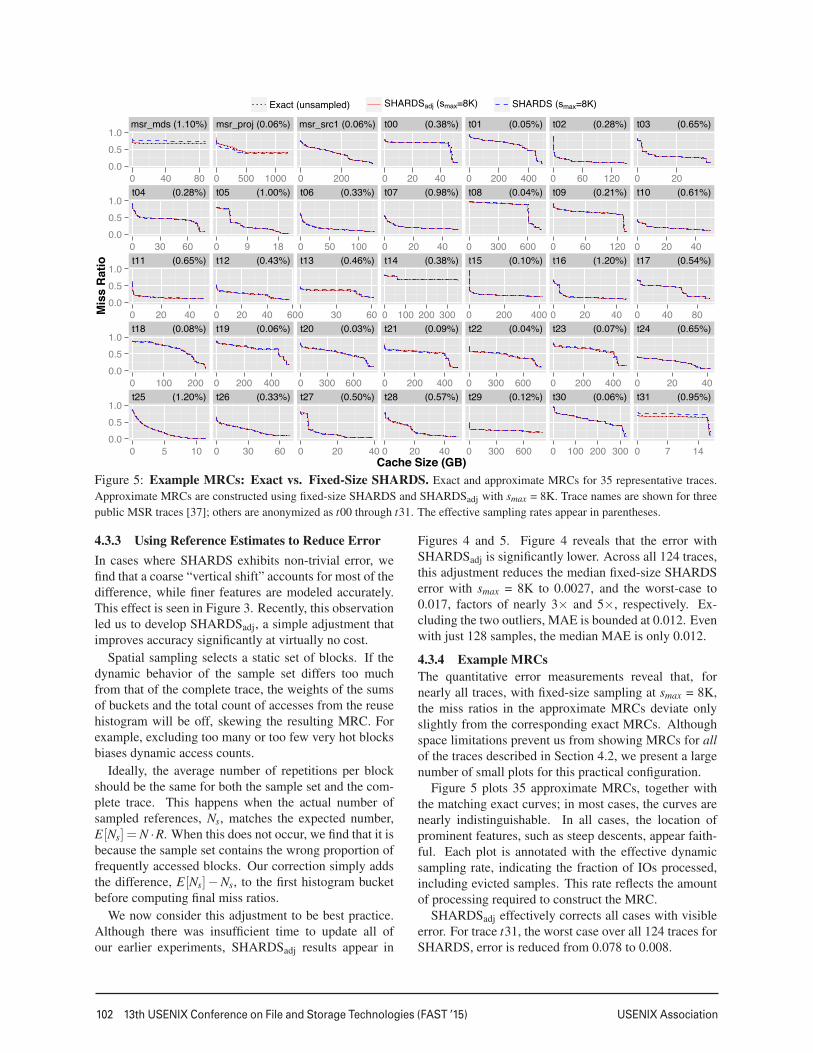
Figure 5: Example MRCs: Exact vs. Fixed-Size SHARDS. Exact and approximate MRCs for 35 representative traces.Approximate MRCs are constructed using fixed-size SHARDS and SHARDSadj with smax = 8K. Trace names are shown for threepublic MSR traces [37]; others are anonymized as t00 through t31. The effective sampling rates appear in parentheses.
4.3.3 Using Reference Estimates to Reduce ErrorIn cases where SHARDS exhibits non-trivial error, wefind that a coarse “vertical shift” accounts for most of thedifference, while finer features are modeled accurately.This effect is seen in Figure 3. Recently, this observationled us to develop SHARDSadj, a simple adjustment thatimproves accuracy significantly at virtually no cost.
Spatial sampling selects a static set of blocks. If thedynamic behavior of the sample set differs too muchfrom that of the complete trace, the weights of the sumsof buckets and the total count of accesses from the reusehistogram will be off, skewing the resulting MRC. Forexample, excluding too many or too few very hot blocksbiases dynamic access counts.
Ideally, the average number of repetitions per blockshould be the same for both the sample set and the com-plete trace. This happens when the actual number ofsampled references, Ns, matches the expected number,E[Ns] = N ·R. When this does not occur, we find that it isbecause the sample set contains the wrong proportion offrequently accessed blocks. Our correction simply addsthe difference, E[Ns]−Ns, to the first histogram bucketbefore computing final miss ratios.
We now consider this adjustment to be best practice.Although there was insufficient time to update all ofour earlier experiments, SHARDSadj results appear in
Figures 4 and 5. Figure 4 reveals that the error withSHARDSadj is significantly lower. Across all 124 traces,this adjustment reduces the median fixed-size SHARDSerror with smax = 8K to 0.0027, and the worst-case to0.017, factors of nearly 3× and 5×, respectively. Ex-cluding the two outliers, MAE is bounded at 0.012. Evenwith just 128 samples, the median MAE is only 0.012.
4.3.4 Example MRCsThe quantitative error measurements reveal that, fornearly all traces, with fixed-size sampling at smax = 8K,the miss ratios in the approximate MRCs deviate onlyslightly from the corresponding exact MRCs. Althoughspace limitations prevent us from showing MRCs for allof the traces described in Section 4.2, we present a largenumber of small plots for this practical configuration.
Figure 5 plots 35 approximate MRCs, together withthe matching exact curves; in most cases, the curves arenearly indistinguishable. In all cases, the location ofprominent features, such as steep descents, appear faith-ful. Each plot is annotated with the effective dynamicsampling rate, indicating the fraction of IOs processed,including evicted samples. This rate reflects the amountof processing required to construct the MRC.
SHARDSadj effectively corrects all cases with visibleerror. For trace t31, the worst case over all 124 traces forSHARDS, error is reduced from 0.078 to 0.008.
USENIX Association 13th USENIX Conference on File and Storage Technologies (FAST ’15) 103
0.0001
0.001
0.01
0.1
0 10 20 30 40 50
Sam
plin
g R
ate
(R)
References (Millions)
t08t04t27t25
Figure 6: Dynamic Rate Adaptation. Sampling rate R (onlog scale) for four traces over time. Each starts at R0 = 0.1, andis lowered dynamically as more unique references are sampled.
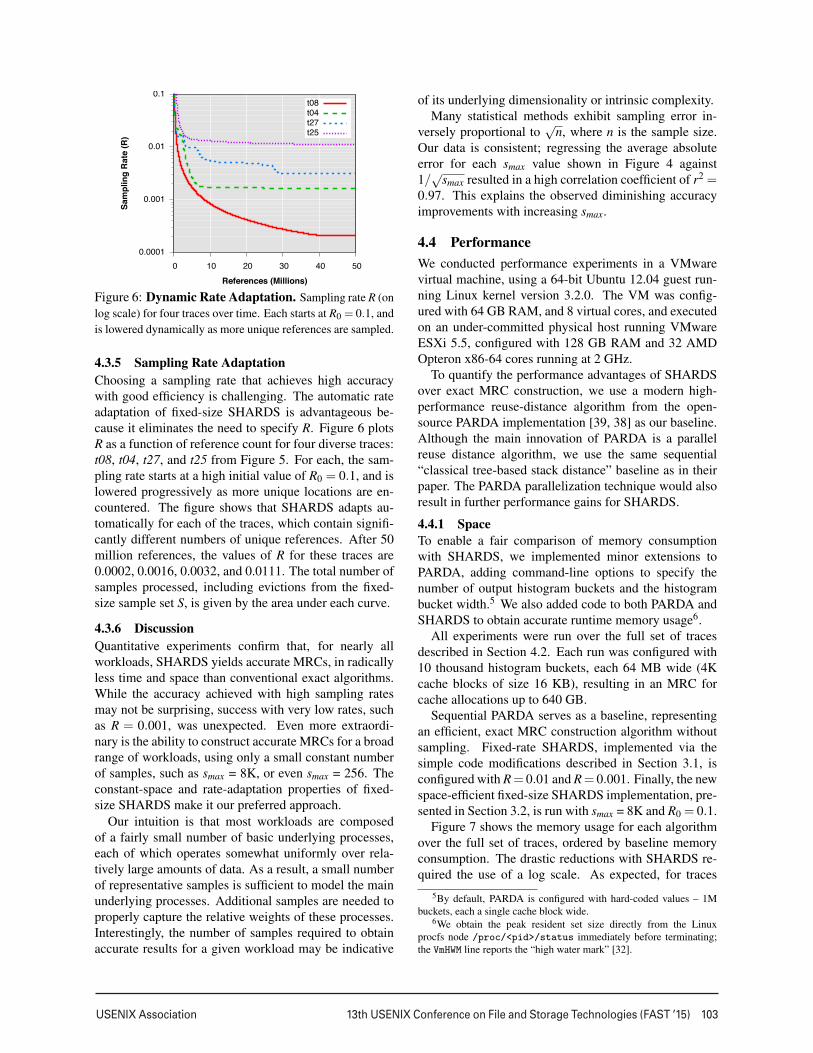
4.3.5 Sampling Rate AdaptationChoosing a sampling rate that achieves high accuracywith good efficiency is challenging. The automatic rateadaptation of fixed-size SHARDS is advantageous be-cause it eliminates the need to specify R. Figure 6 plotsR as a function of reference count for four diverse traces:t08, t04, t27, and t25 from Figure 5. For each, the sam-pling rate starts at a high initial value of R0 = 0.1, and islowered progressively as more unique locations are en-countered. The figure shows that SHARDS adapts au-tomatically for each of the traces, which contain signifi-cantly different numbers of unique references. After 50million references, the values of R for these traces are0.0002, 0.0016, 0.0032, and 0.0111. The total number ofsamples processed, including evictions from the fixed-size sample set S, is given by the area under each curve.
4.3.6 DiscussionQuantitative experiments confirm that, for nearly allworkloads, SHARDS yields accurate MRCs, in radicallyless time and space than conventional exact algorithms.While the accuracy achieved with high sampling ratesmay not be surprising, success with very low rates, suchas R = 0.001, was unexpected. Even more extraordi-nary is the ability to construct accurate MRCs for a broadrange of workloads, using only a small constant numberof samples, such as smax = 8K, or even smax = 256. Theconstant-space and rate-adaptation properties of fixed-size SHARDS make it our preferred approach.
Our intuition is that most workloads are composedof a fairly small number of basic underlying processes,each of which operates somewhat uniformly over rela-tively large amounts of data. As a result, a small numberof representative samples is sufficient to model the mainunderlying processes. Additional samples are needed toproperly capture the relative weights of these processes.Interestingly, the number of samples required to obtainaccurate results for a given workload may be indicative
of its underlying dimensionality or intrinsic complexity.Many statistical methods exhibit sampling error in-
versely proportional to√
n, where n is the sample size.Our data is consistent; regressing the average absoluteerror for each smax value shown in Figure 4 against1/√
smax resulted in a high correlation coefficient of r2 =0.97. This explains the observed diminishing accuracyimprovements with increasing smax.
4.4 PerformanceWe conducted performance experiments in a VMwarevirtual machine, using a 64-bit Ubuntu 12.04 guest run-ning Linux kernel version 3.2.0. The VM was config-ured with 64 GB RAM, and 8 virtual cores, and executedon an under-committed physical host running VMwareESXi 5.5, configured with 128 GB RAM and 32 AMDOpteron x86-64 cores running at 2 GHz.
To quantify the performance advantages of SHARDSover exact MRC construction, we use a modern high-performance reuse-distance algorithm from the open-source PARDA implementation [39, 38] as our baseline.Although the main innovation of PARDA is a parallelreuse distance algorithm, we use the same sequential“classical tree-based stack distance” baseline as in theirpaper. The PARDA parallelization technique would alsoresult in further performance gains for SHARDS.
4.4.1 SpaceTo enable a fair comparison of memory consumptionwith SHARDS, we implemented minor extensions toPARDA, adding command-line options to specify thenumber of output histogram buckets and the histogrambucket width.5 We also added code to both PARDA andSHARDS to obtain accurate runtime memory usage6.
All experiments were run over the full set of tracesdescribed in Section 4.2. Each run was configured with10 thousand histogram buckets, each 64 MB wide (4Kcache blocks of size 16 KB), resulting in an MRC forcache allocations up to 640 GB.
Sequential PARDA serves as a baseline, representingan efficient, exact MRC construction algorithm withoutsampling. Fixed-rate SHARDS, implemented via thesimple code modifications described in Section 3.1, isconfigured with R= 0.01 and R= 0.001. Finally, the newspace-efficient fixed-size SHARDS implementation, pre-sented in Section 3.2, is run with smax = 8K and R0 = 0.1.
Figure 7 shows the memory usage for each algorithmover the full set of traces, ordered by baseline memoryconsumption. The drastic reductions with SHARDS re-quired the use of a log scale. As expected, for traces
5By default, PARDA is configured with hard-coded values – 1Mbuckets, each a single cache block wide.
6We obtain the peak resident set size directly from the Linuxprocfs node /proc/<pid>/status immediately before terminating;the VmHWM line reports the “high water mark” [32].
104 13th USENIX Conference on File and Storage Technologies (FAST ’15) USENIX Association
0.1
1
10
100
1000
10000
100000
0 20 40 60 80 100 120
Mem
ory
Usa
ge (M
B)
Trace Number
Baseline (unsampled) SHARDS R = 0.010 SHARDS R = 0.001 SHARDS Smax = 8K
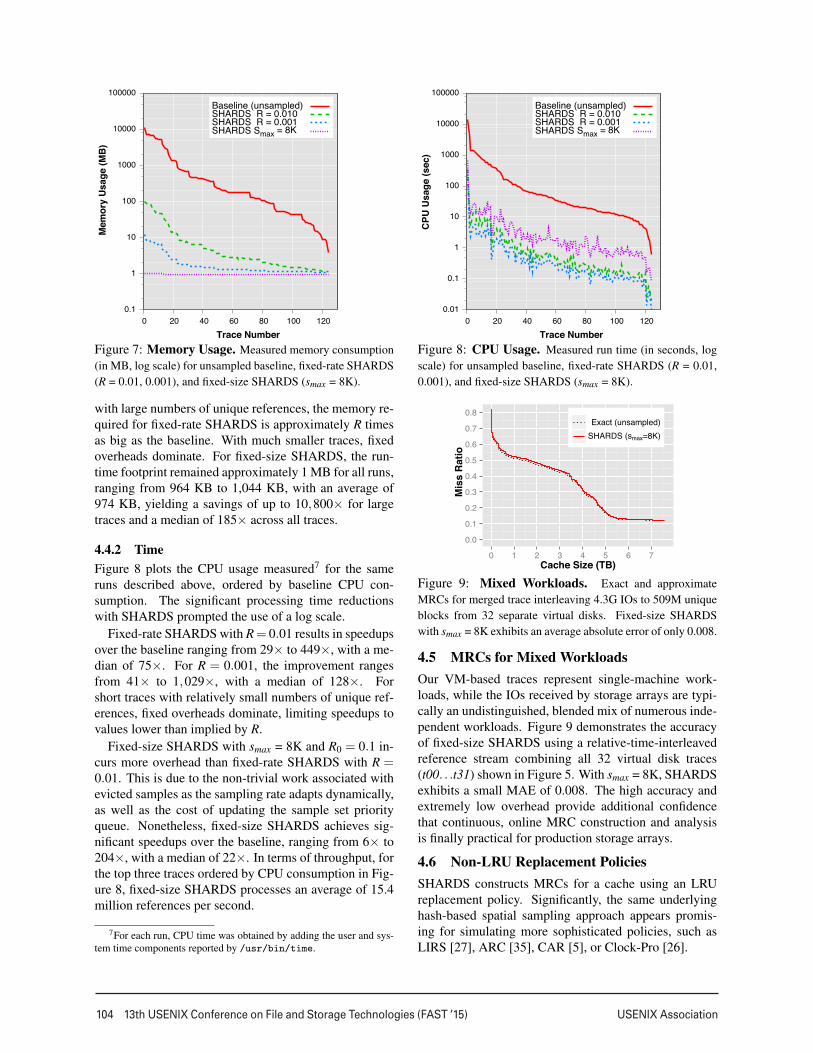
Figure 7: Memory Usage. Measured memory consumption(in MB, log scale) for unsampled baseline, fixed-rate SHARDS(R = 0.01, 0.001), and fixed-size SHARDS (smax = 8K).
with large numbers of unique references, the memory re-quired for fixed-rate SHARDS is approximately R timesas big as the baseline. With much smaller traces, fixedoverheads dominate. For fixed-size SHARDS, the run-time footprint remained approximately 1 MB for all runs,ranging from 964 KB to 1,044 KB, with an average of974 KB, yielding a savings of up to 10,800× for largetraces and a median of 185× across all traces.
4.4.2 TimeFigure 8 plots the CPU usage measured7 for the sameruns described above, ordered by baseline CPU con-sumption. The significant processing time reductionswith SHARDS prompted the use of a log scale.
Fixed-rate SHARDS with R= 0.01 results in speedupsover the baseline ranging from 29× to 449×, with a me-dian of 75×. For R = 0.001, the improvement rangesfrom 41× to 1,029×, with a median of 128×. Forshort traces with relatively small numbers of unique ref-erences, fixed overheads dominate, limiting speedups tovalues lower than implied by R.
Fixed-size SHARDS with smax = 8K and R0 = 0.1 in-curs more overhead than fixed-rate SHARDS with R =0.01. This is due to the non-trivial work associated withevicted samples as the sampling rate adapts dynamically,as well as the cost of updating the sample set priorityqueue. Nonetheless, fixed-size SHARDS achieves sig-nificant speedups over the baseline, ranging from 6× to204×, with a median of 22×. In terms of throughput, forthe top three traces ordered by CPU consumption in Fig-ure 8, fixed-size SHARDS processes an average of 15.4million references per second.
7For each run, CPU time was obtained by adding the user and sys-tem time components reported by /usr/bin/time.
0.01
0.1
1
10
100
1000
10000
100000
0 20 40 60 80 100 120
CPU
Usa
ge (s
ec)
Trace Number
Baseline (unsampled) SHARDS R = 0.010 SHARDS R = 0.001 SHARDS Smax = 8K
Figure 8: CPU Usage. Measured run time (in seconds, logscale) for unsampled baseline, fixed-rate SHARDS (R = 0.01,0.001), and fixed-size SHARDS (smax = 8K).
0.0
0.1
0.2
0.3
0.4
0.5
0.6
0.7
0.8
0 1 2 3 4 5 6 7Cache Size (TB)
Mis
s R
atio
Exact (unsampled)SHARDS (smax=8K)
Figure 9: Mixed Workloads. Exact and approximateMRCs for merged trace interleaving 4.3G IOs to 509M uniqueblocks from 32 separate virtual disks. Fixed-size SHARDSwith smax = 8K exhibits an average absolute error of only 0.008.
4.5 MRCs for Mixed WorkloadsOur VM-based traces represent single-machine work-loads, while the IOs received by storage arrays are typi-cally an undistinguished, blended mix of numerous inde-pendent workloads. Figure 9 demonstrates the accuracyof fixed-size SHARDS using a relative-time-interleavedreference stream combining all 32 virtual disk traces(t00. . .t31) shown in Figure 5. With smax = 8K, SHARDSexhibits a small MAE of 0.008. The high accuracy andextremely low overhead provide additional confidencethat continuous, online MRC construction and analysisis finally practical for production storage arrays.
4.6 Non-LRU Replacement PoliciesSHARDS constructs MRCs for a cache using an LRUreplacement policy. Significantly, the same underlyinghash-based spatial sampling approach appears promis-ing for simulating more sophisticated policies, such asLIRS [27], ARC [35], CAR [5], or Clock-Pro [26].
USENIX Association 13th USENIX Conference on File and Storage Technologies (FAST ’15) 105
��
����
����
����
����
����
����
����
����
�� ��� ��� ��� ��� ��� ��� ��� ���
����������
���������������
�����������������������������������������������������������
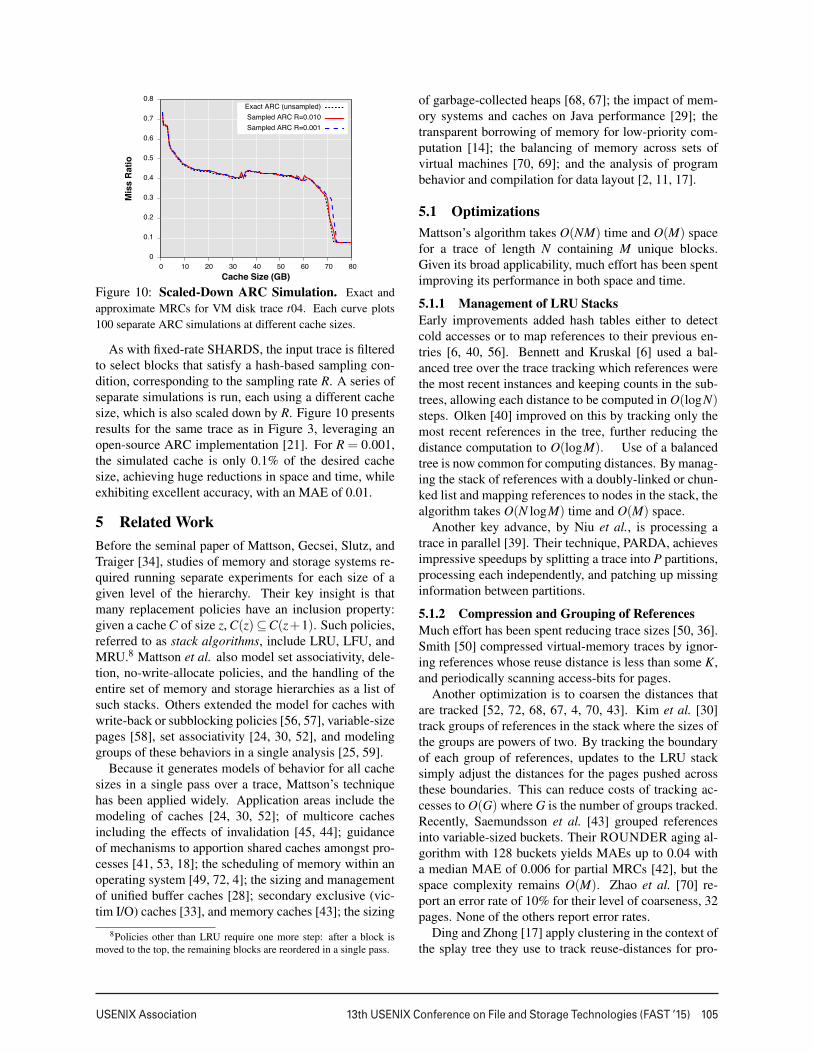
Figure 10: Scaled-Down ARC Simulation. Exact andapproximate MRCs for VM disk trace t04. Each curve plots100 separate ARC simulations at different cache sizes.
As with fixed-rate SHARDS, the input trace is filteredto select blocks that satisfy a hash-based sampling con-dition, corresponding to the sampling rate R. A series ofseparate simulations is run, each using a different cachesize, which is also scaled down by R. Figure 10 presentsresults for the same trace as in Figure 3, leveraging anopen-source ARC implementation [21]. For R = 0.001,the simulated cache is only 0.1% of the desired cachesize, achieving huge reductions in space and time, whileexhibiting excellent accuracy, with an MAE of 0.01.
5 Related WorkBefore the seminal paper of Mattson, Gecsei, Slutz, andTraiger [34], studies of memory and storage systems re-quired running separate experiments for each size of agiven level of the hierarchy. Their key insight is thatmany replacement policies have an inclusion property:given a cache C of size z, C(z)⊆C(z+1). Such policies,referred to as stack algorithms, include LRU, LFU, andMRU.8 Mattson et al. also model set associativity, dele-tion, no-write-allocate policies, and the handling of theentire set of memory and storage hierarchies as a list ofsuch stacks. Others extended the model for caches withwrite-back or subblocking policies [56, 57], variable-sizepages [58], set associativity [24, 30, 52], and modelinggroups of these behaviors in a single analysis [25, 59].
Because it generates models of behavior for all cachesizes in a single pass over a trace, Mattson’s techniquehas been applied widely. Application areas include themodeling of caches [24, 30, 52]; of multicore cachesincluding the effects of invalidation [45, 44]; guidanceof mechanisms to apportion shared caches amongst pro-cesses [41, 53, 18]; the scheduling of memory within anoperating system [49, 72, 4]; the sizing and managementof unified buffer caches [28]; secondary exclusive (vic-tim I/O) caches [33], and memory caches [43]; the sizing
8Policies other than LRU require one more step: after a block ismoved to the top, the remaining blocks are reordered in a single pass.
of garbage-collected heaps [68, 67]; the impact of mem-ory systems and caches on Java performance [29]; thetransparent borrowing of memory for low-priority com-putation [14]; the balancing of memory across sets ofvirtual machines [70, 69]; and the analysis of programbehavior and compilation for data layout [2, 11, 17].
5.1 OptimizationsMattson’s algorithm takes O(NM) time and O(M) spacefor a trace of length N containing M unique blocks.Given its broad applicability, much effort has been spentimproving its performance in both space and time.
5.1.1 Management of LRU StacksEarly improvements added hash tables either to detectcold accesses or to map references to their previous en-tries [6, 40, 56]. Bennett and Kruskal [6] used a bal-anced tree over the trace tracking which references werethe most recent instances and keeping counts in the sub-trees, allowing each distance to be computed in O(logN)steps. Olken [40] improved on this by tracking only themost recent references in the tree, further reducing thedistance computation to O(logM). Use of a balancedtree is now common for computing distances. By manag-ing the stack of references with a doubly-linked or chun-ked list and mapping references to nodes in the stack, thealgorithm takes O(N logM) time and O(M) space.
Another key advance, by Niu et al., is processing atrace in parallel [39]. Their technique, PARDA, achievesimpressive speedups by splitting a trace into P partitions,processing each independently, and patching up missinginformation between partitions.
5.1.2 Compression and Grouping of ReferencesMuch effort has been spent reducing trace sizes [50, 36].Smith [50] compressed virtual-memory traces by ignor-ing references whose reuse distance is less than some K,and periodically scanning access-bits for pages.
Another optimization is to coarsen the distances thatare tracked [52, 72, 68, 67, 4, 70, 43]. Kim et al. [30]track groups of references in the stack where the sizes ofthe groups are powers of two. By tracking the boundaryof each group of references, updates to the LRU stacksimply adjust the distances for the pages pushed acrossthese boundaries. This can reduce costs of tracking ac-cesses to O(G) where G is the number of groups tracked.Recently, Saemundsson et al. [43] grouped referencesinto variable-sized buckets. Their ROUNDER aging al-gorithm with 128 buckets yields MAEs up to 0.04 witha median MAE of 0.006 for partial MRCs [42], but thespace complexity remains O(M). Zhao et al. [70] re-port an error rate of 10% for their level of coarseness, 32pages. None of the others report error rates.
Ding and Zhong [17] apply clustering in the context ofthe splay tree they use to track reuse-distances for pro-
106 13th USENIX Conference on File and Storage Technologies (FAST ’15) USENIX Association
gram analysis. By dynamically compressing the tree,they bound the overall size and cost of their analysis,achieving a time bound of O(N log logM) and a spacebound of O(logM). The relative error is bounded by howthe nodes in the tree are merged and compressed and, so,factors in as the base of the log . For an error of 50%, thebase is 2; for smaller ones, the base quickly approaches1. For their purpose, they can tolerate large error bounds.
5.1.3 Temporal SamplingTemporal sampling — complementary to SHARDS —reduces reference-tracking costs by only doing so someof the time. Berg et al. [7, 8] sample every Nth refer-ence (1 in every 10K) to derive MRCs for caches. Bryanand Conte’s cluster sampling [10], RapidMRC [53], andwork on low-cost tracking for VMs [69], by contrast, di-vide the execution into periods in which references areeither sampled or are not. They also tackle how to de-tect phase changes that require regeneration of the reuse-distances. RapidMRC reports a mean average error rateof 1.02 misses per thousand instructions (MPKI) with amaximum of 6.57 MPKI observed. Zhao et al. [69] re-port mean relative errors of 3.9% to 12.6%. These errorsare significantly larger than what SHARDS achieves.
Use of sampling periods allows for accurate measure-ments of reuse distances within a sample period. How-ever, Zhong and Chang [71] and Schuff et al. [45, 44] ob-serve that naively sampling every Nth reference as Berget al. do or using simple sampling phases causes a biasagainst the tracking of longer reuse distances. Both ef-forts address this bias by sampling references during asampling period and then following their next accessesacross subsequent sampling and non-sampling phases.
5.1.4 Spatial and Content-Based SamplingA challenge when sampling references is that reuse-distance is a recurrent behavior. One solution is to extracta sample from the trace based on an identifying charac-teristic of its references. Spatial sampling uses addressesto select a sample set. Content-based sampling does soby using data contents. Both techniques can capture allevents for a set of references, even those that occur rarely.
Many analyses for set-associative caches have usedset-sampling [23, 41, 46]. For example, UMON-DSS [41] reduces the cost of collecting reuse-distancesby sampling the behavior of a subset of the sets in a pro-cessor cache. Kessler et al. [23] compare temporal sam-pling, set-sampling and constant-bit sampling of refer-ences and find that the last technique is most useful whenstudying set-associative caches of different dimensions.
Many techniques targeting hardware implementationsuse grouping or spatial sampling to constrain their use ofspace [72, 41, 4, 59, 46]. However, these tend to focus onnarrow problems such as limited set associativity [41] orlimited cache size ranges [4] for each MRC. Like these
approaches, SHARDS reduces and bounds space use, butunlike them, it models the full range of cache sizes. Inaddition, these techniques do not report error rates.
Inspired by processor hardware for cache sampling,Waldspurger et al. propose constructing an MRC by sam-pling a fixed set of pages from the guest-physical mem-ory of a VM [62]. Unfortunately, practical sampling re-quires using small (4 KB) pages, increasing the overheadof memory virtualization [9]. Choosing sampled loca-tions up-front is also inefficient, especially for workloadswith large, sparse address spaces. In contrast, SHARDSdoes not require any information about the address space.
Xie et al. address a different problem: estimation ofduplication among blocks in a storage system [66]. Theirsystem hashes the contents of blocks producing finger-prints. These are partitioned into sets with one set cho-sen as the sample. Their model has error proportional tothe sample-set size. This property is used to dynamicallyrepartition the sample so that the sample size is bounded.Like Xie et al., the SHARDS sampling rate can be ad-justed to ensure an upper bound on the space used. But,how the sample set is chosen, how the sampling rate isadjusted, and how the sampling ratio is used to adjust thesummary information are different. Most importantly,where their work looks at individual blocks’ hash valuesand how these collide, our technique accurately capturesthe relationship between pairs of accesses to the blocks.
5.2 Analytical ModelsMany analytical models have been proposed to approx-imate MRCs with reduced effort. By constraining theblock replacement policy, Tay and Zou [55] derive a uni-versal equation that models cache behavior from a smallset of sampled data points. He et al. propose modelingMRCs as fractals and claim error rates of 7-10% in manycases with low overhead [22]. Berg et al. [7, 8, 19, 18]use a closed-form equation of the miss rate. Through asequence of sampling, deriving local miss rates and com-bining these separate curves, they model caches with ran-dom or LRU replacement. Others model cache behaviorby tracking hardware performance counters [15, 63, 46].
Unlike the analytical approaches, SHARDS estimatesthe MRC directly from the sampled trace. We haveshown that SHARDS can be implemented using con-stant space and with high accuracy. Where the error ofSHARDS is small, the analytic techniques report errorsof a few percent to 50% with some outliers at 100-200%.Berg et al. simply offer graphs for comparison.
5.3 Counter StacksMattson et al. track distances as counts of unique refer-ences between reuses. Wires et al. extend this in threeways in their recent MRC approximation work, using acounter stack [65].
USENIX Association 13th USENIX Conference on File and Storage Technologies (FAST ’15) 107
0.00.10.20.30.40.50.60.70.80.91.0
0 1 2 3Cache Size (TB)
Mis
s R
atio
Exact (unsampled)SHARDSadj (smax=8K)SHARDS (smax=8K)
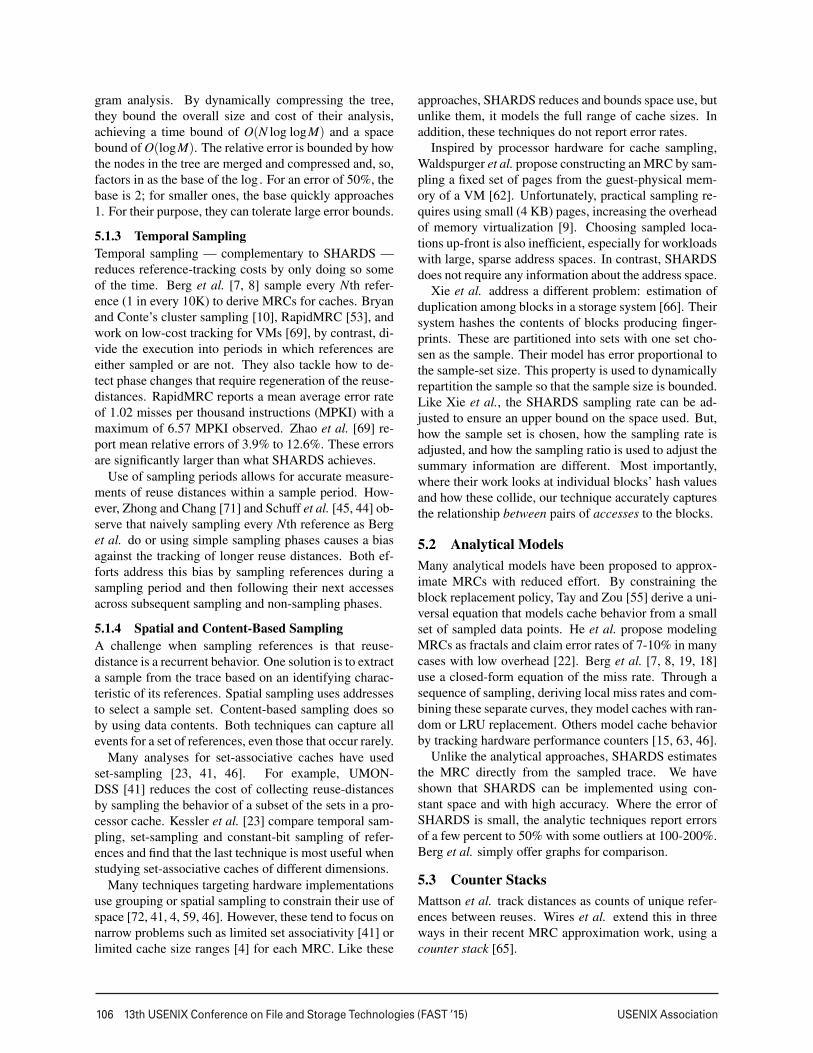
Figure 11: Merged MSR Trace. Exact, SHARDS andSHARDSadj MRCs for the merged “master” MSR trace usedin the Counter Stacks evaluation [65], with smax = 8K.
First, the counts of repetitions, themselves, can becomputed by comparing changes in the number of uniquereferences seen from different starting points in thestream. The sequence of locations observed by a newercounter is a proper suffix of the sequence recorded by anolder one. So, if the newer counter increases but the olderdoes not, then the older location must have repeated, andits reuse-distance is the older counter’s value.
Second, the repetitions and reuse-distances can be ap-proximated efficiently using a bounded set of counters.Instead of starting a new counter with every reference,one may downsample the set of counters, creating andtracking a new one periodically. The set can be furtherpruned since, over time, adjacent counters converge asthey observe the same set of elements. Using probabilis-tic counters based on the HyperLogLog algorithm [20]together with downsampling and pruning, the counterstack algorithm only uses O(logM) space.
Third, columns of counts in the counter stack can beperiodically written to a checkpoint together with times-tamps for subsequent analysis. Checkpointed counter-stack sequences can be spliced, shifted temporally, andcombined to model the behavior of combinations ofworkloads. Because the checkpoint only captures stacksof counts at each timestamp, such modeling assumes thatdifferent checkpoints access disjoint sets of blocks.
To provide a direct quantitative comparison withSHARDS, we generated the same merged “master” MSRtrace used by Wires et al. [65], configured identicallywith only read requests and a 4 KB cache block size.Figure 11 shows MRCs constructed using fixed-sizeSHARDS, with 48K histogram buckets of size 64 MB,supporting cache sizes up to 3 TB. For smax = 8K, theMAE is 0.006 with SHARDSadj (0.029 unadjusted). TheMRC is computed using only 1.3 MB of memory in137 seconds, processing 17.6M blocks/sec. Wires etal. report that Counter Stacks requires 80 MB of mem-ory, and 1,034 seconds to process this trace at a rate of2.3M blocks/sec. In this case, Counter Stacks is approx-
imately 7× slower and needs 62× as much memory asSHARDSadj, but is more accurate, with an MAE of only0.0025 [64]. Using smax = 32K, with 2 MB of memoryin 142 seconds, yields a comparable MAE of 0.0026.
While Counter Stacks uses O(logM) space, fixed-size SHARDS computes MRCs in small constant space.As a result, separate SHARDS instances can efficientlycompute multiple MRCs tracking different propertiesor time-scales for a given reference stream, somethingWires et al. claim is not practical.
One advantage of Counter Stacks is that every refer-ence affects the probabilistic counters and contributes tothe resulting MRC. By contrast, SHARDS assumes thathashing generates a uniformly distributed set of valuesfor a reference stream. While an adversarial trace couldyield an inaccurate MRC, we have not encountered one.
Unlike Counter Stacks, SHARDS maintains the iden-tity of each block in its sample set. This enables track-ing additional information, including access frequency,making it possible to directly implement other policiessuch as LFU, LIRS [27], ARC [35], CAR [5], or Clock-Pro [26], as discussed in Section 4.6.
6 Conclusions
We have introduced SHARDS, a new hash-based spa-tial sampling technique for reuse-distance analysis thatcomputes approximate miss ratio curves accurately us-ing only modest computational resources. The approachis so lightweight — operating in constant space, and re-quiring several orders of magnitude less processing thanconventional algorithms — that online MRC construc-tion becomes practical. Furthermore, SHARDS enablesoffline analysis for long traces that, due to memory con-straints, could not be studied using exact techniques.
Our experimental evaluation of SHARDS demon-strates its accuracy, robustness, and performance advan-tages, over a large collection of I/O traces from real-world production storage systems. Quantitative resultsshow that, for most workloads, an approximate sampledMRC that differs only slightly from an exact MRC can beconstructed in 1 MB of memory. Performance analysishighlights dramatic reductions in resource consumption,up to 10,800× in memory and up to 204× in CPU.
Encouraged by progress generalizing hash-based spa-tial sampling to model sophisticated replacement poli-cies, such as ARC, we are exploring similar techniquesfor other complex systems. We are also examining therich temporal dynamics of MRCs at different time scales.
Acknowledgments Thanks to the anonymous review-ers, our shepherd Arif Merchant, Jim Kleckner, XiaojunLiu, Guang Yang, John Blumenthal, and Jeff Hausmanfor their valuable feedback and support.
108 13th USENIX Conference on File and Storage Technologies (FAST ’15) USENIX Association
References[1] AHMAD, I. Easy and efficient disk I/O workload characterization
in VMware ESX Server. In Proceedings of the 2007 IEEE 10thInternational Symposium on Workload Characterization (Wash-ington, DC, USA, 2007), IISWC ’07, IEEE Computer Society,pp. 149–158.
[2] ALMASI, G., CASCAVAL, C., AND PADUA, D. A. Calculatingstack distances efficiently. SIGPLAN Not. 38, 2 supplement (June2002), 37–43.
[3] APPLEBY, A. SMHasher and MurmurHash. https://code.
google.com/p/smhasher/.
[4] AZIMI, R., SOARES, L., STUMM, M., WALSH, T., ANDBROWN, A. D. Path: Page access tracking to improve memorymanagement. In Proceedings of the 6th International Symposiumon Memory Management (New York, NY, USA, 2007), ISMM’07, ACM, pp. 31–42.
[5] BANSAL, S., AND MODHA, D. S. CAR: Clock with adaptivereplacement. In Proceedings of the 3rd USENIX Conference onFile and Storage Technologies (Berkeley, CA, USA, 2004), FAST’04, USENIX Association, pp. 187–200.
[6] BENNETT, B. T., AND KRUSKAL, V. J. LRU stack processing.IBM Journal of Research and Development 19 (1975), 353–357.
[7] BERG, E., AND HAGERSTEN, E. StatCache: A Probabilistic Ap-proach to Efficient and Accurate Data Locality Analysis. In Pro-ceedings of the 2004 IEEE International Symposium on Perfor-mance Analysis of Systems and Software (ISPASS-2004) (Austin,Texas, USA, Mar. 2004).
[8] BERG, E., AND HAGERSTEN, E. Fast Data-Locality Profilingof Native Execution. In Proceedings of ACM SIGMETRICS 2005(Banff, Canada, June 2005).
[9] BHARGAVA, R., SEREBRIN, B., SPADINI, F., AND MANNE,S. Accelerating two-dimensional page walks for virtualized sys-tems. In Proceedings of the 13th International Conference onArchitectural Support for Programming Languages and Operat-ing Systems (New York, NY, USA, 2008), ASPLOS XIII, ACM,pp. 26–35.
[10] BRYAN, P. D., AND CONTE, T. M. Combining cluster sam-pling with single pass methods for efficient sampling regimendesign. In 25th International Conference on Computer Design,ICCD 2007, 7-10 October 2007, Lake Tahoe, CA, USA, Proceed-ings (2007), IEEE, pp. 472–479.
[11] CASCAVAL, C., AND PADUA, D. A. Estimating cache missesand locality using stack distances. In Proceedings of the 17thAnnual International Conference on Supercomputing (New York,NY, USA, 2003), ICS ’03, ACM, pp. 150–159.
[12] CARR, R. W., AND HENNESSY, J. L. WSCLOCK–a simple andeffective algorithm for virtual memory management. In Proceed-ings of the Eighth ACM Symposium on Operating Systems Prin-ciples (New York, NY, USA, 1981), SOSP ’81, ACM, pp. 87–95.
[13] CARTA, D. F. Two fast implementations of the minimal standardrandom number generator. CACM 33, 1 (Jan. 1990), 87–88.
[14] CIPAR, J., CORNER, M. D., AND BERGER, E. D. Transpar-ent contribution of memory. In Proceedings of the Annual Con-ference on USENIX ’06 Annual Technical Conference (Berkeley,CA, USA, 2006), ATEC ’06, USENIX Association, pp. 11–11.
[15] CONTE, T. M., HIRSCH, M. A., AND HWU, W.-M. W. Com-bining trace sampling with single pass methods for efficient cachesimulation. IEEE Trans. Comput. 47, 6 (June 1998), 714–720.
[16] DENNING, P. J. The working set model for program behavior.Commun. ACM 11, 5 (May 1968), 323–333.
[17] DING, C., AND ZHONG, Y. Predicting whole-program localitythrough reuse distance analysis. SIGPLAN Not. 38, 5 (May 2003),245–257.
[18] EKLOV, D., BLACK-SCHAFFER, D., AND HAGERSTEN, E. Fastmodeling of shared caches in multicore systems. In Proceedingsof the 6th International Conference on High Performance andEmbedded Architectures and Compilers (New York, NY, USA,2011), HiPEAC ’11, ACM, pp. 147–157.
[19] EKLOV, D., AND HAGERSTEN, E. StatStack: Efficient modelingof LRU caches. In Performance Analysis of Systems Software(ISPASS), 2010 IEEE International Symposium on (March 2010),pp. 55–65.
[20] FLAJOLET, P., FUSY, E., GANDOUET, O., AND MEUNIER, F.HyperLogLog: The analysis of a near-optimal cardinality estima-tion algorithm. In Proceedings of the 2007 International Confer-ence on Analysis of Algorithms (AOFA ’07) (2007), pp. 127–146.
[21] GRYSKI, D. go-arc git repository. https://github.com/
dgryski/go-arc/.
[22] HE, L., YU, Z., AND JIN, H. FractalMRC: Online cachemiss rate curve prediction on commodity systems. In IPDPS’12(2012), pp. 1341–1351.
[23] HILL, K. M., KESSLER, R. E., HILL, M. D., AND WOOD,D. A. A comparison of trace-sampling techniques for multi-megabyte caches. IEEE Transactions on Computers 43 (1994),664–675.
[24] HILL, M. D., AND SMITH, A. J. Evaluating associativity in CPUcaches. IEEE Trans. Comput. 38, 12 (Dec. 1989), 1612–1630.
[25] JANAPSATYA, A., IGNJATOVIC, A., AND PARAMESWARAN, S.Finding optimal L1 cache configuration for embedded systems.In Proceedings of the 2006 Asia and South Pacific Design Au-tomation Conference (Piscataway, NJ, USA, 2006), ASP-DAC’06, IEEE Press, pp. 796–801.
[26] JIANG, S., CHEN, F., AND ZHANG, X. Clock-pro: An effec-tive improvement of the clock replacement. In Proceedings ofthe Annual Conference on USENIX Annual Technical Conference(Berkeley, CA, USA, 2005), ATEC ’05, USENIX Association,pp. 35–35.
[27] JIANG, S., AND ZHANG, X. Lirs: An efficient low inter-reference recency set replacement policy to improve buffer cacheperformance. In Proceedings of the 2002 ACM SIGMETRICS In-ternational Conference on Measurement and Modeling of Com-puter Systems (New York, NY, USA, 2002), SIGMETRICS ’02,ACM, pp. 31–42.
[28] KIM, J. M., CHOI, J., KIM, J., NOH, S. H., MIN, S. L., CHO,Y., AND KIM, C. S. A low-overhead high-performance unifiedbuffer management scheme that exploits sequential and loopingreferences. In Proceedings of the 4th Symposium on OperatingSystem Design and Implementation – Volume 4 (Berkeley, CA,USA, 2000), OSDI’00, USENIX Association, pp. 9–9.
[29] KIM, J.-S., AND HSU, Y. Memory system behavior of Java pro-grams: Methodology and analysis. In Proceedings of the 2000ACM SIGMETRICS International Conference on Measurementand Modeling of Computer Systems (New York, NY, USA, 2000),SIGMETRICS ’00, ACM, pp. 264–274.
[30] KIM, Y. H., HILL, M. D., AND WOOD, D. A. Implementingstack simulation for highly-associative memories. In Proceed-ings of the 1991 ACM SIGMETRICS Conference on Measurementand Modeling of Computer Systems (New York, NY, USA, 1991),SIGMETRICS ’91, ACM, pp. 212–213.
[31] KOLLER, R., AND RANGASWAMI, R. I/O deduplication: Utiliz-ing content similarity to improve I/O performance. Trans. Storage6, 3 (Sept. 2010), 13:1–13:26.
USENIX Association 13th USENIX Conference on File and Storage Technologies (FAST ’15) 109
[32] LINUX PROGRAMMER’S MANUAL. proc(5) Linux manual page.http://man7.org/linux/man-pages/man5/proc.5.html.
[33] LU, P., AND SHEN, K. Multi-layer event trace analysis for paral-lel I/O performance tuning. 2013 42nd International Conferenceon Parallel Processing (2007), 12.
[34] MATTSON, R. L., GECSEI, J., SLUTZ, D. R., AND TRAIGER,I. L. Evaluation techniques for storage hierarchies. IBM Syst. J.9, 2 (June 1970), 78–117.
[35] MEGIDDO, N., AND MODHA, D. S. ARC: A self-tuning, lowoverhead replacement cache. In Proceedings of the 2nd USENIXConference on File and Storage Technologies (Berkeley, CA,USA, 2003), FAST ’03, USENIX Association, pp. 115–130.
[36] MICHAUD, P. Online compression of cache-filtered addresstraces. In Performance Analysis of Systems and Software, 2009.ISPASS 2009. IEEE International Symposium on (April 2009),pp. 185–194.
[37] NARAYANAN, D., DONNELLY, A., AND ROWSTRON, A. Writeoff-loading: Practical power management for enterprise storage.Trans. Storage 4, 3 (Nov. 2008), 10:1–10:23.
[38] NIU, Q. PARDA git repository. https://bitbucket.org/
niuqingpeng/file_parda/.
[39] NIU, Q., DINAN, J., LU, Q., AND SADAYAPPAN, P. PARDA: Afast parallel reuse distance analysis algorithm. In Proceedings ofthe 2012 IEEE 26th International Parallel and Distributed Pro-cessing Symposium (Washington, DC, USA, 2012), IPDPS ’12,IEEE Computer Society, pp. 1284–1294.
[40] OLKEN, F. Efficient methods for calculating the success functionof fixed space replacement policies. Perform. Eval. 3, 2 (1983),153–154.
[41] QURESHI, M. K., AND PATT, Y. N. Utility-based cache par-titioning: A low-overhead, high-performance, runtime mecha-nism to partition shared caches. In Proceedings of the 39th An-nual IEEE/ACM International Symposium on Microarchitecture(Washington, DC, USA, 2006), MICRO 39, IEEE Computer So-ciety, pp. 423–432.
[42] SAEMUNDSSON, T. Private communication, Jan 2015.
[43] SAEMUNDSSON, T., BJORNSSON, H., CHOCKLER, G., ANDVIGFUSSON, Y. Dynamic performance profiling of cloud caches.In Proceedings of the ACM Symposium on Cloud Computing(New York, NY, USA, 2014), SOCC ’14, ACM, pp. 28:1–28:14.
[44] SCHUFF, D. L., KULKARNI, M., AND PAI, V. S. Acceleratingmulticore reuse distance analysis with sampling and paralleliza-tion. In Proceedings of the 19th International Conference on Par-allel Architectures and Compilation Techniques (New York, NY,USA, 2010), PACT ’10, ACM, pp. 53–64.
[45] SCHUFF, D. L., PARSONS, B. S., AND PAI, V. S. Multicore-aware reuse distance analysis. Tech. Rep. ECE-TR-388, PurdueUniversity, Sep 2009.
[46] SEN, R., AND WOOD, D. A. Reuse-based online models forcaches. In Proceedings of the ACM SIGMETRICS/InternationalConference on Measurement and Modeling of Computer Systems(New York, NY, USA, 2013), SIGMETRICS ’13, ACM, pp. 279–292.
[47] SLEATOR, D. An implementation of top-down splaying withsizes. ftp://ftp.cs.cmu.edu/usr/ftp/usr/sleator/
splaying.
[48] SLEATOR, D. D., AND TARJAN, R. E. Self-adjusting binarysearch trees. J. ACM 32, 3 (July 1985), 652–686.
[49] SMARAGDAKIS, Y., KAPLAN, S. F., AND WILSON, P. R. TheEELRU adaptive replacement algorithm. Perform. Eval. 53, 2(2003), 93–123.
[50] SMITH, A. Two methods for the efficient analysis of memoryaddress trace data. Software Engineering, IEEE Transactions onSE-3, 1 (Jan 1977), 94–101.
[51] SNIA. SNIA iotta repository block I/O traces. http://iotta.snia.org/tracetypes/3.
[52] SUGUMAR, R. A., AND ABRAHAM, S. G. Efficient simulationof caches under optimal replacement with applications to misscharacterization. In Proceedings of the 1993 ACM SIGMETRICSConference on Measurement and Modeling of Computer Systems(New York, NY, USA, 1993), SIGMETRICS ’93, ACM, pp. 24–35.
[53] TAM, D. K., AZIMI, R., SOARES, L. B., AND STUMM, M.RapidMRC: Approximating L2 miss rate curves on commoditysystems for online optimizations. In Proceedings of the 14thInternational Conference on Architectural Support for Program-ming Languages and Operating Systems (New York, NY, USA,2009), ASPLOS XIV, ACM, pp. 121–132.
[54] TANENBAUM, A. S. Modern Operating Systems, 3rd ed. PrenticeHall Press, Upper Saddle River, NJ, USA, 2007.
[55] TAY, Y. C., AND ZOU, M. A page fault equation for modelingthe effect of memory size. Perform. Eval. 63, 2 (Feb. 2006), 99–130.
[56] THOMPSON, J. G. Efficient Analysis of Caching Systems. PhDthesis, EECS Department, University of California, Berkeley, Sep1987.
[57] THOMPSON, J. G., AND SMITH, A. J. Efficient (stack) al-gorithms for analysis of writeback and sector memories. ACMTrans. Comput. Syst. 7, 1 (Jan. 1989), 78–117.
[58] TRAIGER, I., AND SLUTZ, D. One-pass Techniques for theEvaluation of Memory Hierarchies. IBM research report. IBMResearch Division, 1971.
[59] VIANA, P., GORDON-ROSS, A., BARROS, E., AND VAHID, F.A table-based method for single-pass cache optimization. In Pro-ceedings of the 18th ACM Great Lakes Symposium on VLSI (NewYork, NY, USA, 2008), GLSVLSI ’08, ACM, pp. 71–76.
[60] VMWARE, INC. VMware vSphere Hypervisor (ESXi). http:
//www.vmware.com/products/vsphere-hypervisor/
overview.html.[61] WALDSPURGER, C. A. Memory resource management in
VMware ESX Server. In Proceedings of the 5th Symposium onOperating Systems Design and Implementation (New York, NY,USA, 2002), OSDI ’02, ACM, pp. 181–194.
[62] WALDSPURGER, C. A., VENKATASUBRAMANIAN, R.,GARTHWAITE, A. T., AND BASKAKOV, Y. Efficient online con-struction of miss rate curves, Apr. 2014. U.S. Patent #8,694,728.Filed Nov. 2010. Assigned to VMware, Inc.
[63] WEST, R., ZAROO, P., WALDSPURGER, C. A., AND ZHANG,X. Online cache modeling for commodity multicore processors.SIGOPS Oper. Syst. Rev. 44, 4 (Dec. 2010), 19–29.
[64] WIRES, J. Private communication, Jan 2015.[65] WIRES, J., INGRAM, S., DRUDI, Z., HARVEY, N. J. A., AND
WARFIELD, A. Characterizing storage workloads with counterstacks. In Proceedings of the 11th USENIX Conference on Oper-ating Systems Design and Implementation (Berkeley, CA, USA,2014), OSDI’14, USENIX Association, pp. 335–349.
[66] XIE, F., CONDICT, M., AND SHETE, S. Estimating duplica-tion by content-based sampling. In Presented as part of the 2013USENIX Annual Technical Conference (USENIX ATC 13) (SanJose, CA, 2013), USENIX, pp. 181–186.
[67] YANG, T., BERGER, E. D., KAPLAN, S. F., AND MOSS, J.E. B. CRAMM: Virtual memory support for garbage-collectedapplications. In Proceedings of the 7th Symposium on OperatingSystems Design and Implementation (Berkeley, CA, USA, 2006),OSDI ’06, USENIX Association, pp. 103–116.
110 13th USENIX Conference on File and Storage Technologies (FAST ’15) USENIX Association
[68] YANG, T., HERTZ, M., BERGER, E. D., KAPLAN, S. F., ANDMOSS, J. E. B. Automatic heap sizing: Taking real memory intoaccount. In Proceedings of the 4th International Symposium onMemory Management (New York, NY, USA, 2004), ISMM ’04,ACM, pp. 61–72.
[69] ZHAO, W., JIN, X., WANG, Z., WANG, X., LUO, Y., AND LI,X. Low cost working set size tracking. In Proceedings of the2011 USENIX Conference on USENIX Annual Technical Con-ference (Berkeley, CA, USA, 2011), USENIXATC’11, USENIXAssociation, pp. 17–17.
[70] ZHAO, W., AND WANG, Z. Dynamic memory balancingfor virtual machines. In Proceedings of the 2009 ACM SIG-PLAN/SIGOPS International Conference on Virtual ExecutionEnvironments (New York, NY, USA, 2009), VEE ’09, ACM,pp. 21–30.
[71] ZHONG, Y., AND CHANG, W. Sampling-based program local-ity approximation. In Proceedings of the 7th International Sym-posium on Memory Management (New York, NY, USA, 2008),ISMM ’08, ACM, pp. 91–100.
[72] ZHOU, P., PANDEY, V., SUNDARESAN, J., RAGHURAMAN, A.,ZHOU, Y., AND KUMAR, S. Dynamic tracking of page miss ratiocurve for memory management. SIGOPS Oper. Syst. Rev. 38, 5(Oct. 2004), 177–188.


![C-MRC it gb de Ed01 2007reducta-im.hr/katalozi/zupcasti_reduktori_rc.pdfSELEZIONE RIDUTTORE - MRC 1400 [min-1] SPEED REDUCER SELECTION - MRC GETRIEBEAUSWAHL - MRC 0.09 kW (0.12 HP)](https://static.fdocuments.in/doc/165x107/6108c986e8f90f642023ce89/c-mrc-it-gb-de-ed01-2007reducta-imhrkatalozizupcastireduktorircpdf-selezione.jpg)