Efficient Evaluation and Management of Temperature and ... · Temperature and Reliability for...
33
Efficient Evaluation and Management of Temperature and Reliability for Multiprocessor Systems Ayse K. Coskun Electrical and Computer Engineering Department Boston University http://people.bu.edu/acoskun Feb 15, 2012
Transcript of Efficient Evaluation and Management of Temperature and ... · Temperature and Reliability for...
Efficient Evaluation and Management of Temperature and Reliability for
Multiprocessor Systems
Ayse K. Coskun
Electrical and Computer Engineering Department
Boston University http://people.bu.edu/acoskun
Feb 15, 2012
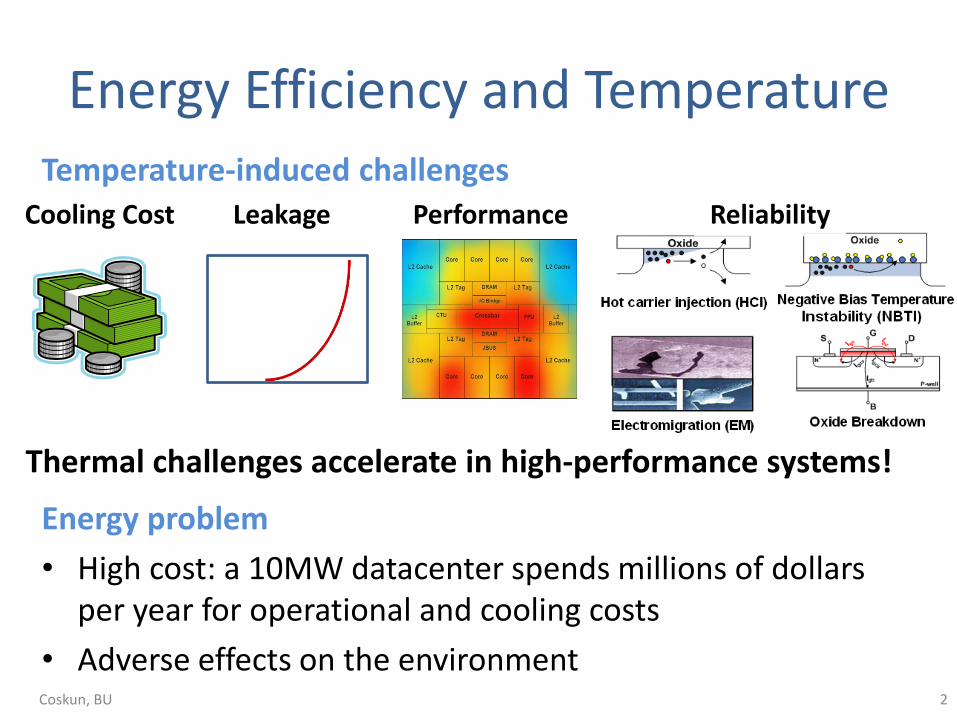
Energy Efficiency and Temperature Temperature-induced challenges
Energy problem
• High cost: a 10MW datacenter spends millions of dollars per year for operational and cooling costs
• Adverse effects on the environment
Leakage Cooling Cost Performance Reliability
Thermal challenges accelerate in high-performance systems!
2 Coskun, BU
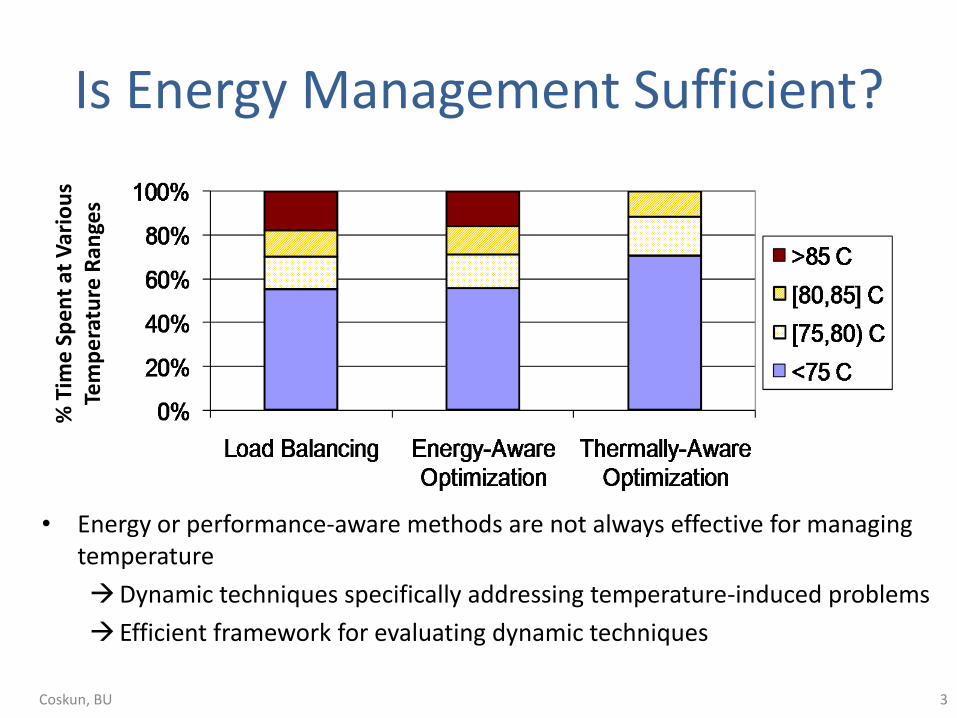
Is Energy Management Sufficient?
• Energy or performance-aware methods are not always effective for managing temperature
Dynamic techniques specifically addressing temperature-induced problems
Efficient framework for evaluating dynamic techniques
% T
ime
Sp
en
t at
Var
iou
s Te
mp
era
ture
Ran
ges
3 Coskun, BU
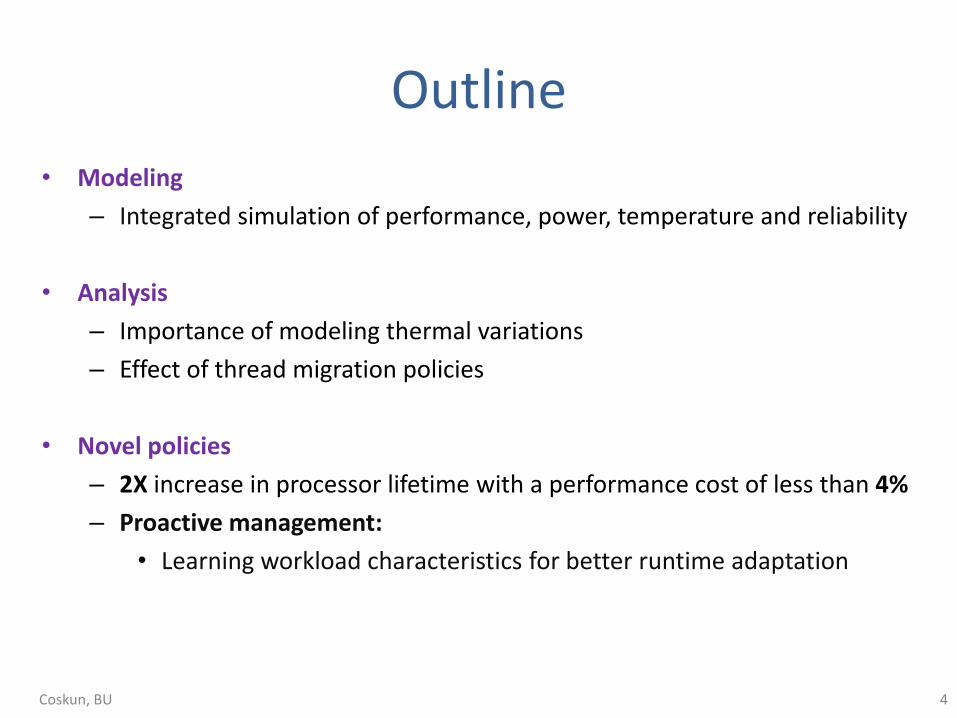
Outline
• Modeling
– Integrated simulation of performance, power, temperature and reliability
• Analysis
– Importance of modeling thermal variations
– Effect of thread migration policies
• Novel policies
– 2X increase in processor lifetime with a performance cost of less than 4%
– Proactive management:
• Learning workload characteristics for better runtime adaptation
4 Coskun, BU
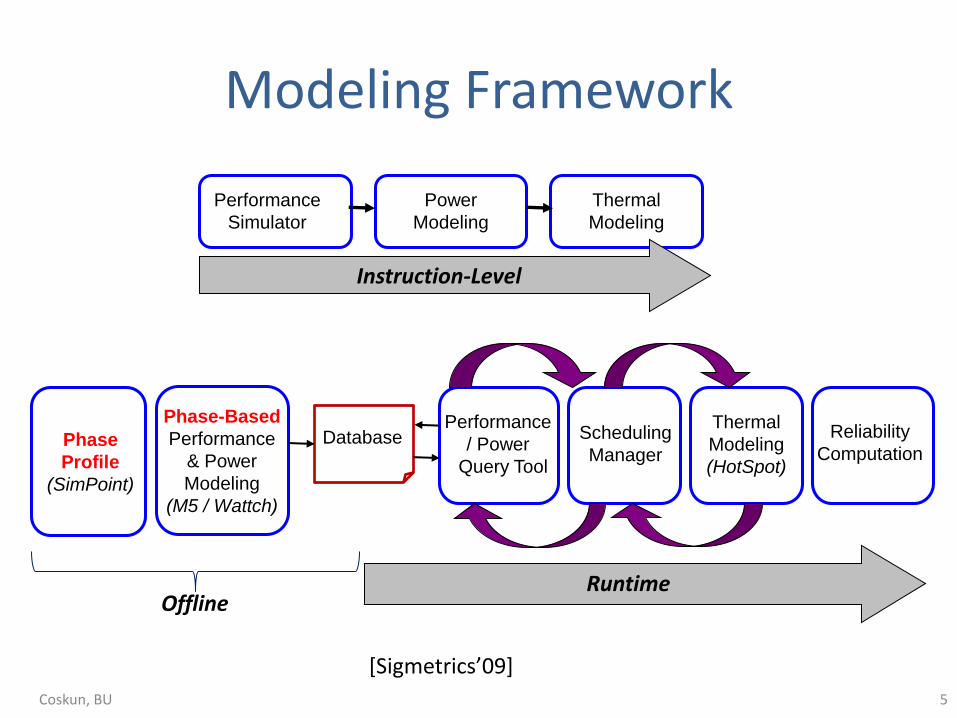
Modeling Framework
Phase
Profile
(SimPoint)
Phase-Based
Performance
& Power
Modeling
(M5 / Wattch)
Database
Performance
/ Power
Query Tool
Scheduling
Manager
Thermal
Modeling
(HotSpot)
Runtime
Reliability
Computation
Offline
Performance
Simulator
Power
Modeling
Thermal
Modeling
Instruction-Level
5 Coskun, BU
[Sigmetrics’09]
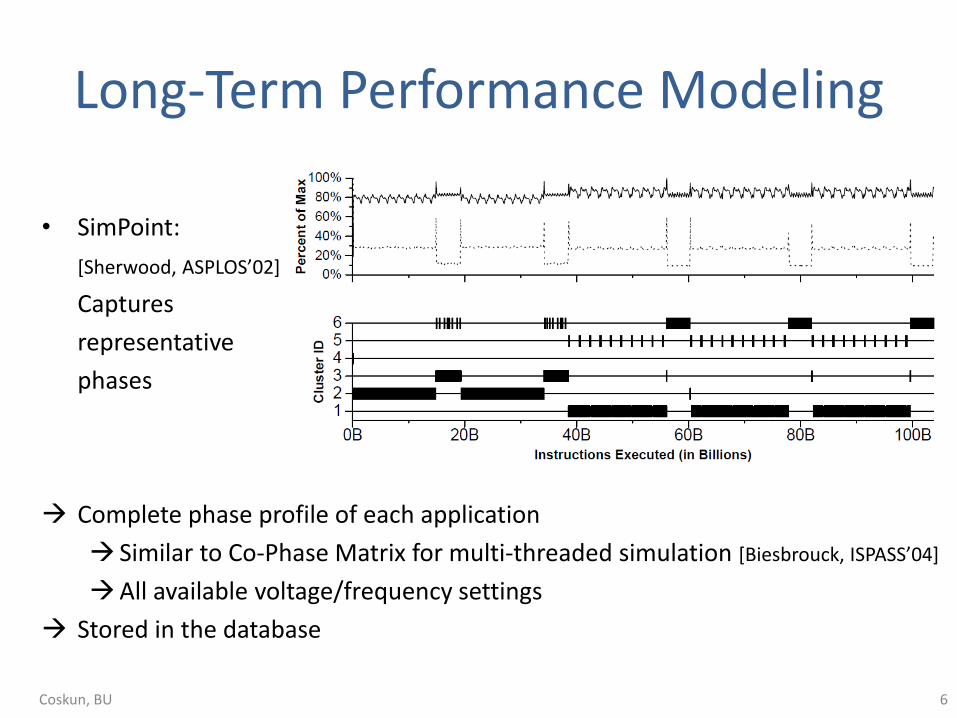
Long-Term Performance Modeling
• SimPoint:
[Sherwood, ASPLOS’02]
Captures
representative
phases
Complete phase profile of each application
Similar to Co-Phase Matrix for multi-threaded simulation [Biesbrouck, ISPASS’04]
All available voltage/frequency settings
Stored in the database
6 Coskun, BU
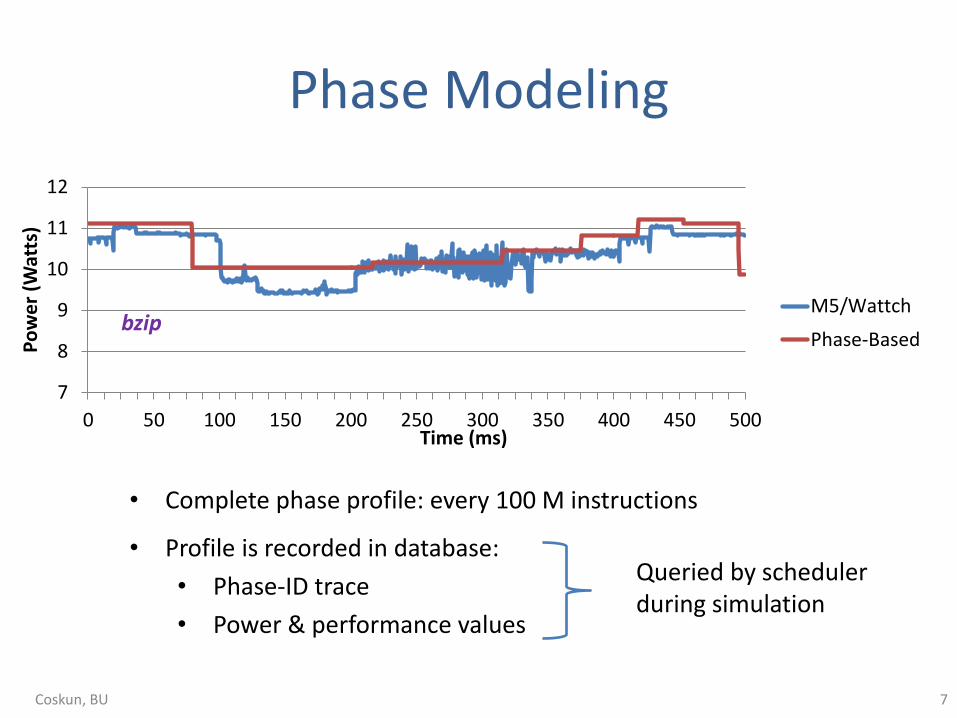
Phase Modeling
• Complete phase profile: every 100 M instructions
bzip
• Profile is recorded in database:
• Phase-ID trace
• Power & performance values
Queried by scheduler during simulation
7
8
9
10
11
12
0 50 100 150 200 250 300 350 400 450 500
Po
we
r (W
atts
)
Time (ms)
M5/Wattch
Phase-Based
7 Coskun, BU
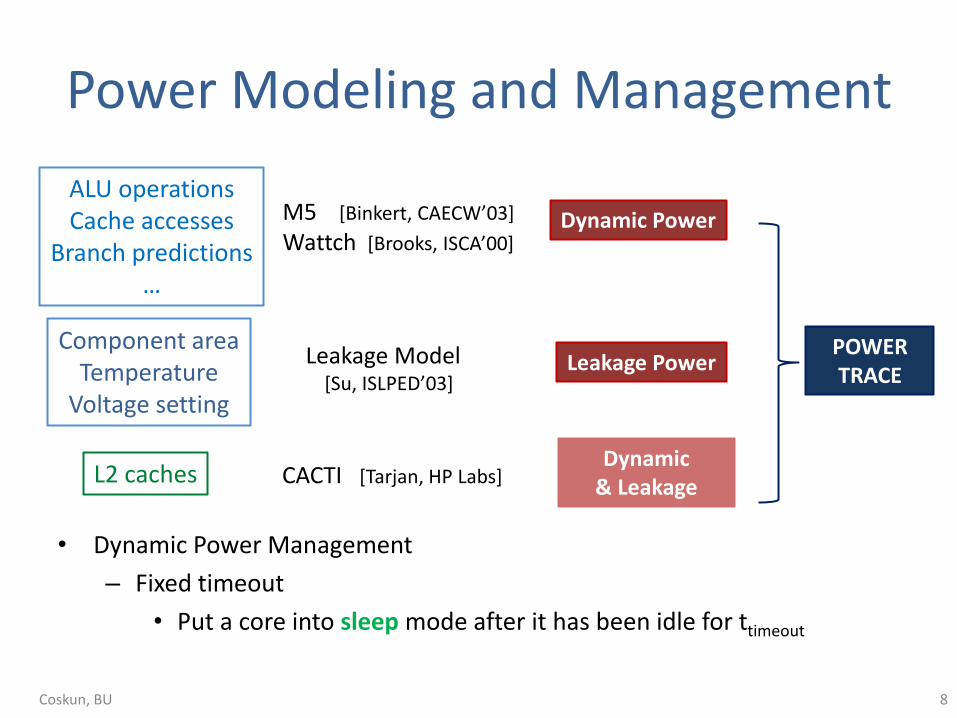
Power Modeling and Management
• Dynamic Power Management
– Fixed timeout
• Put a core into sleep mode after it has been idle for ttimeout
ALU operations Cache accesses
Branch predictions …
Dynamic Power
Component area Temperature
Voltage setting
Leakage Power
M5 [Binkert, CAECW’03]
Wattch [Brooks, ISCA’00]
Leakage Model [Su, ISLPED’03]
POWER TRACE
L2 caches CACTI [Tarjan, HP Labs] Dynamic
& Leakage
8 Coskun, BU
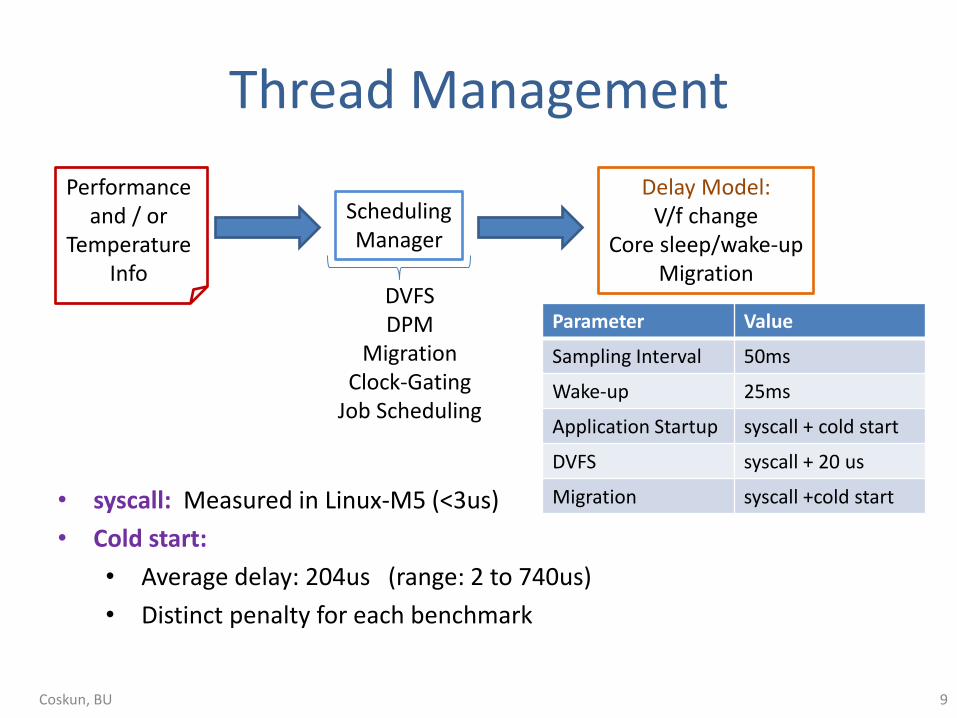
Thread Management
Parameter Value
Sampling Interval 50ms
Wake-up 25ms
Application Startup syscall + cold start
DVFS syscall + 20 us
Migration syscall +cold start
Scheduling Manager
Performance and / or
Temperature Info
DVFS DPM
Migration Clock-Gating
Job Scheduling
Delay Model: V/f change
Core sleep/wake-up Migration
• syscall: Measured in Linux-M5 (<3us)
• Cold start:
• Average delay: 204us (range: 2 to 740us)
• Distinct penalty for each benchmark
9 Coskun, BU
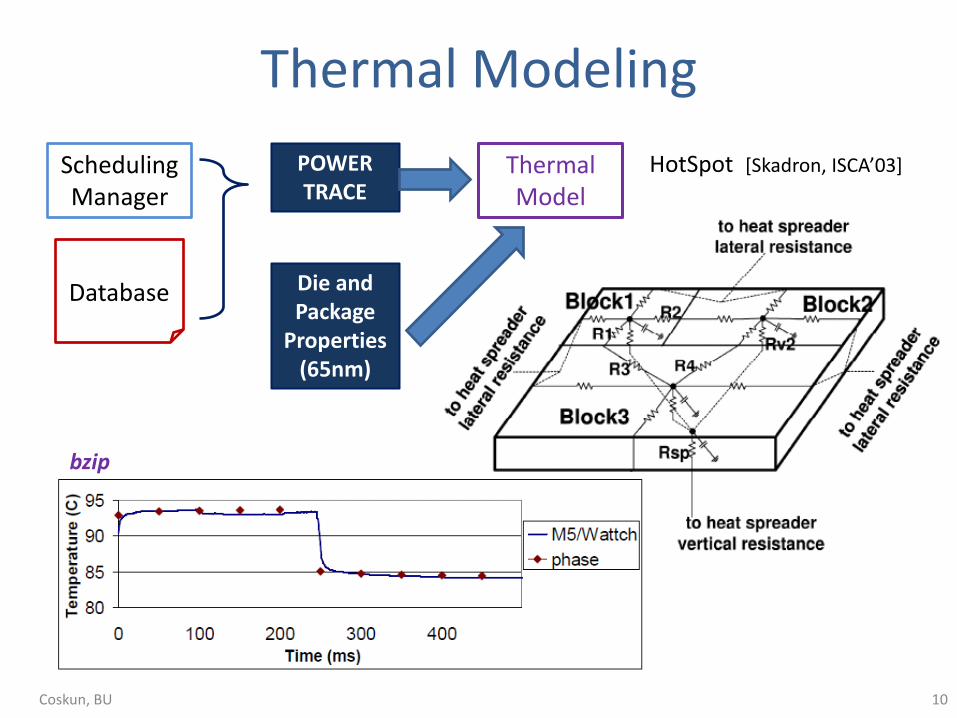
Thermal Modeling
POWER TRACE
Scheduling Manager
Database
Thermal Model
Die and Package
Properties (65nm)
HotSpot [Skadron, ISCA’03]
10 Coskun, BU
bzip
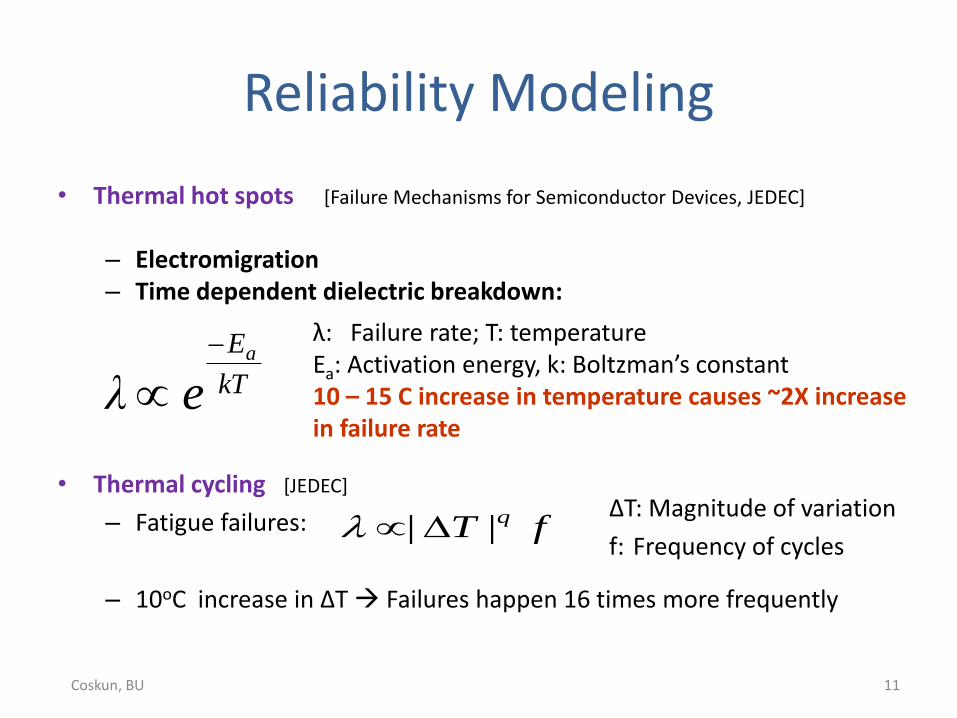
Reliability Modeling
• Thermal hot spots [Failure Mechanisms for Semiconductor Devices, JEDEC]
– Electromigration – Time dependent dielectric breakdown:
kT
Ea
eλ
λ: Failure rate; T: temperature Ea: Activation energy, k: Boltzman’s constant 10 – 15 C increase in temperature causes ~2X increase in failure rate
• Thermal cycling [JEDEC]
– Fatigue failures:
– 10oC increase in ΔT Failures happen 16 times more frequently
fT q||∆T: Magnitude of variation
f: Frequency of cycles
11 Coskun, BU
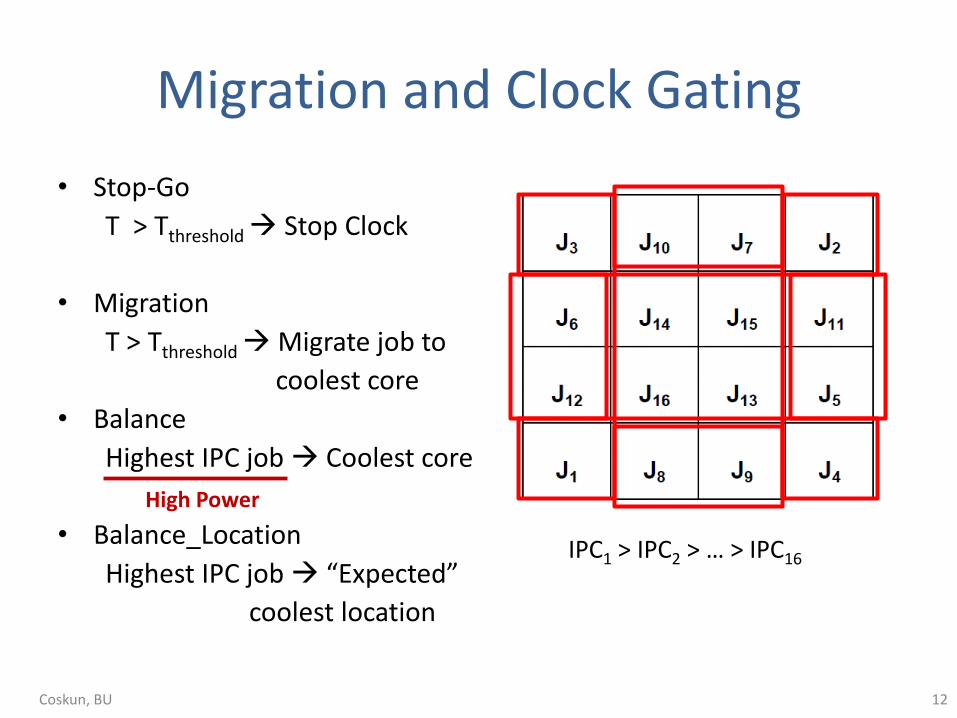
Migration and Clock Gating
• Stop-Go
T > Tthreshold Stop Clock
• Migration
T > Tthreshold Migrate job to
coolest core
• Balance
Highest IPC job Coolest core
• Balance_Location
Highest IPC job “Expected”
coolest location
IPC1 > IPC2 > … > IPC16
High Power
12 Coskun, BU
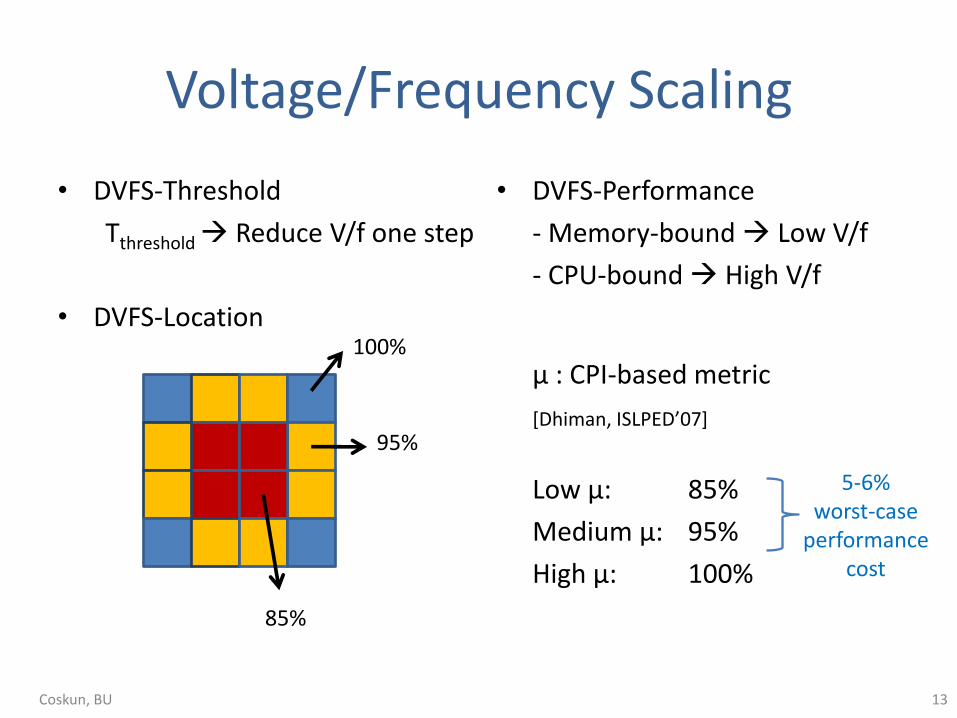
Voltage/Frequency Scaling
• DVFS-Threshold
Tthreshold Reduce V/f one step
• DVFS-Location
100%
95%
85%
• DVFS-Performance
- Memory-bound Low V/f
- CPU-bound High V/f
µ : CPI-based metric
[Dhiman, ISLPED’07]
Low µ: 85%
Medium µ: 95%
High µ: 100%
5-6% worst-case
performance cost
13 Coskun, BU
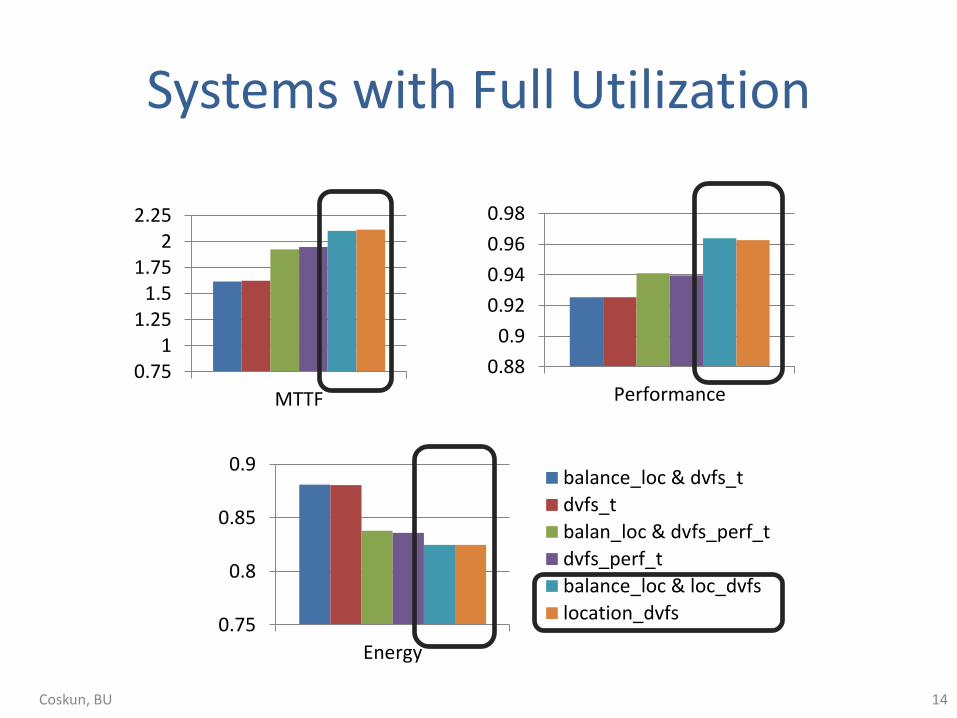
Systems with Full Utilization
0.751
1.251.5
1.752
2.25
MTTF
0.88
0.9
0.92
0.94
0.96
0.98
Performance
0.75
0.8
0.85
0.9
Energy
balance_loc & dvfs_t
dvfs_t
balan_loc & dvfs_perf_t
dvfs_perf_t
balance_loc & loc_dvfs
location_dvfs
14 Coskun, BU
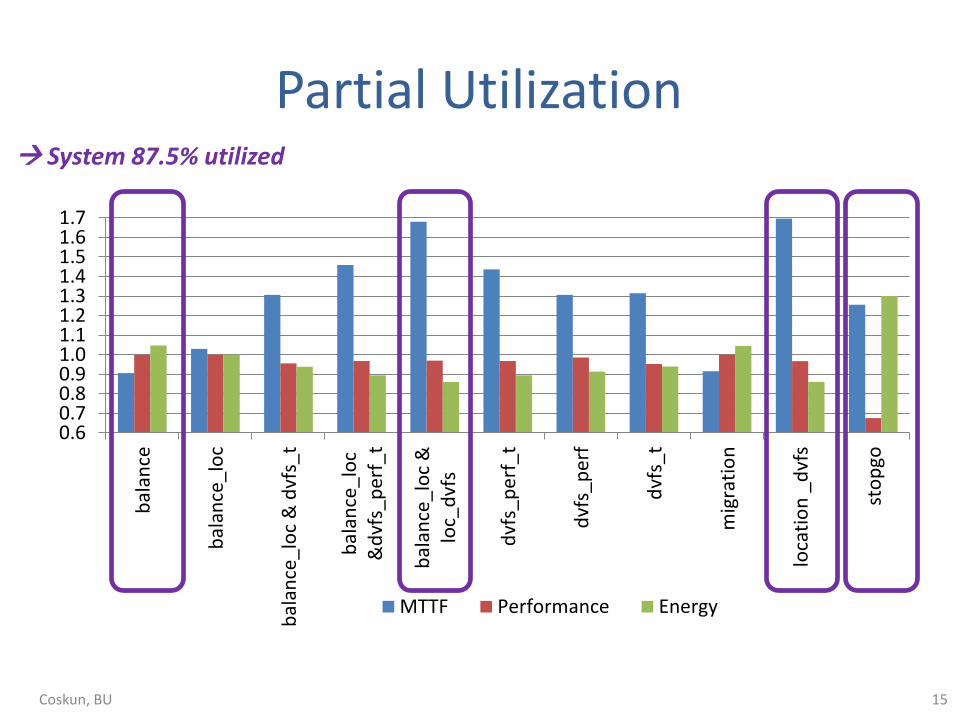
Partial Utilization
0.60.70.80.91.01.11.21.31.41.51.61.7
bal
ance
bal
ance
_lo
c
bal
ance
_lo
c &
dvf
s_t
bal
ance
_lo
c&
dvf
s_p
erf_
t
bal
ance
_lo
c &
loc_
dvf
s
dvf
s_p
erf_
t
dvf
s_p
erf
dvf
s_t
mig
rati
on
loca
tio
n _
dvf
s
sto
pgo
MTTF Performance Energy
15 Coskun, BU
System 87.5% utilized
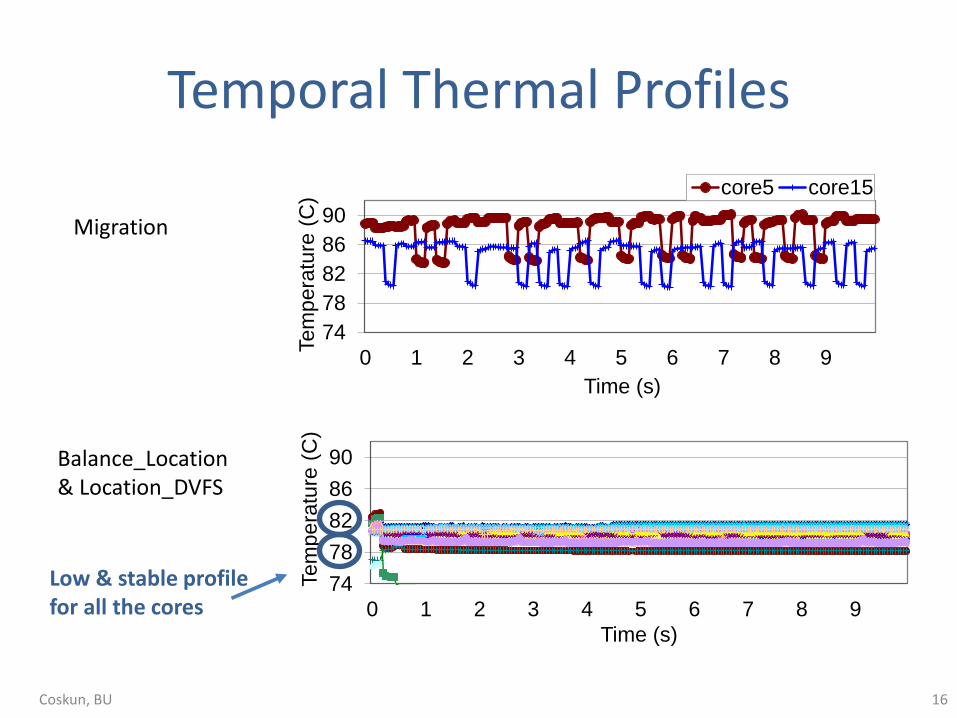
Temporal Thermal Profiles
74
78
82
86
90
0 1 2 3 4 5 6 7 8 9
Tem
pera
ture
(C
)
Time (s)
core5 core15
74
78
82
86
90
0 1 2 3 4 5 6 7 8 9
Tem
pe
ratu
re (
C)
Time (s)
Migration
Balance_Location & Location_DVFS
Low & stable profile for all the cores
16 Coskun, BU
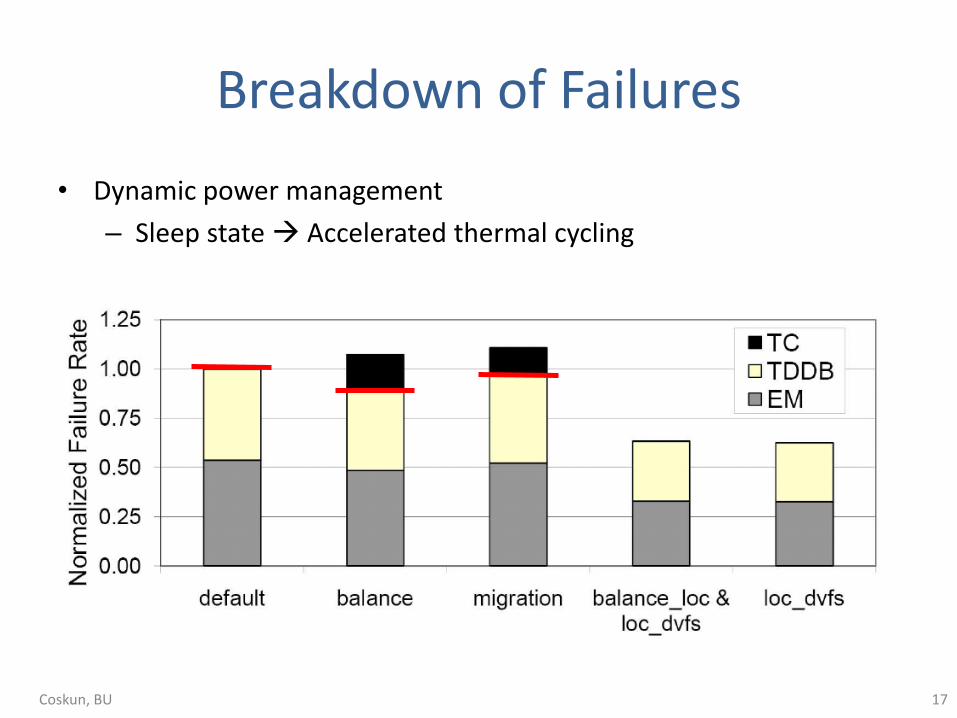
Breakdown of Failures
• Dynamic power management
– Sleep state Accelerated thermal cycling
17 Coskun, BU
Guidelines for Runtime Management
• Modeling thermal cycling is critical, especially for partially utilized systems.
• Policies that minimize # of migrations help with both performance and reliability.
• Thermal asymmetries should be considered for effective thermal management.
• Proactive techniques can raise the performance of the entire system.
18 Coskun, BU
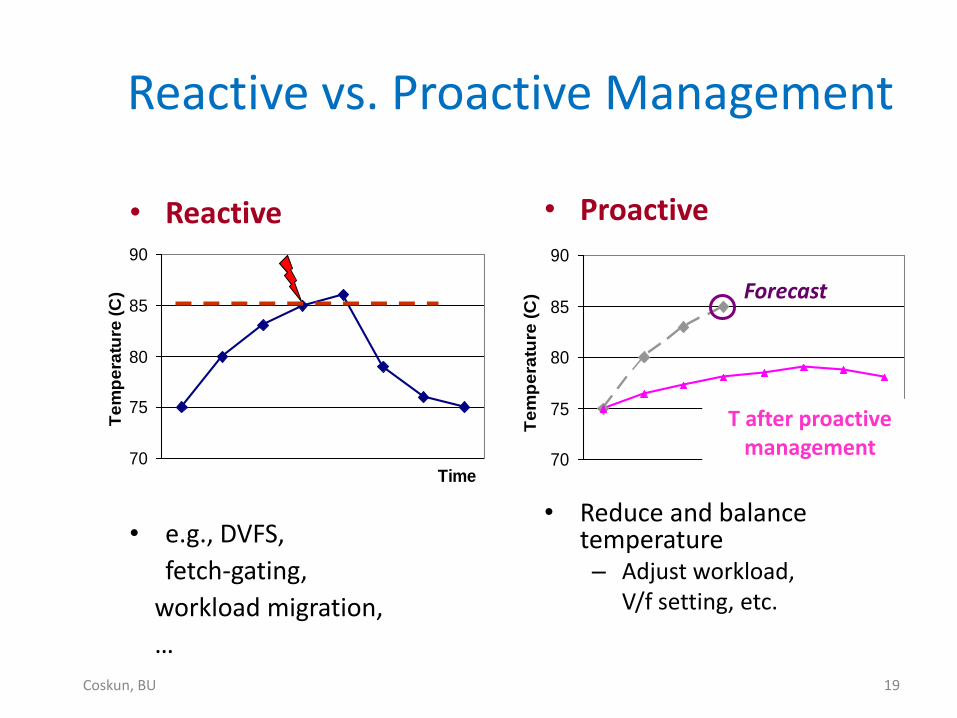
• Proactive
• Reduce and balance temperature – Adjust workload, V/f setting, etc.
70
75
80
85
90
Time
Te
mp
era
ture
(C
) .
70
75
80
85
90
Time
Te
mp
era
ture
(C
) .
T after proactive management
Reactive vs. Proactive Management
Forecast
• Reactive
• e.g., DVFS,
fetch-gating,
workload migration,
…
19 Coskun, BU
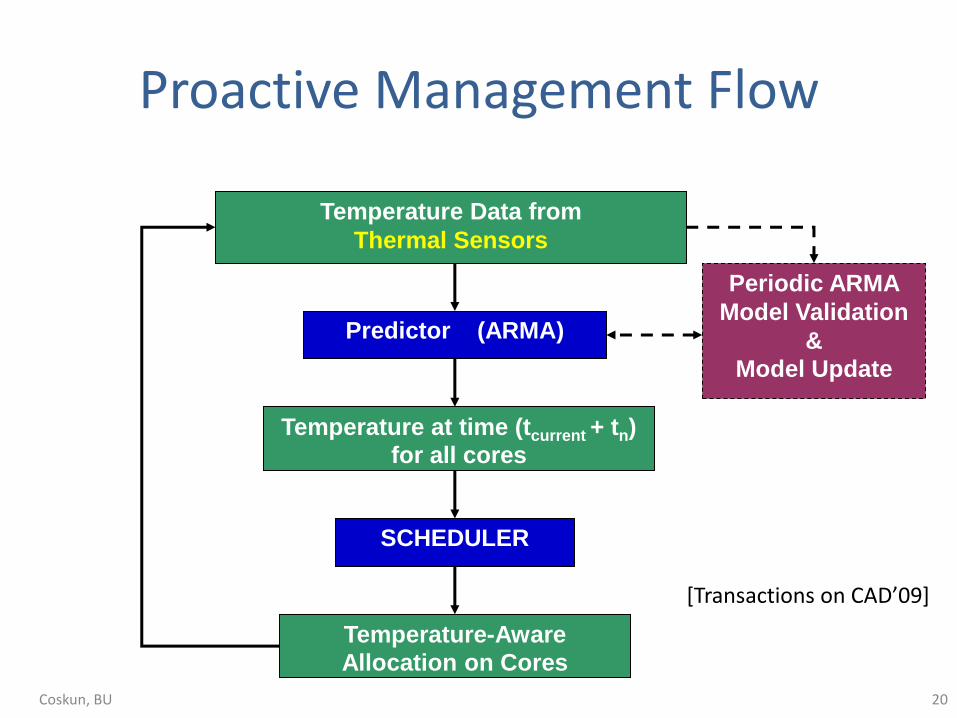
Proactive Management Flow
Temperature Data from
Thermal Sensors
Predictor (ARMA)
Periodic ARMA
Model Validation
&
Model Update
Temperature at time (tcurrent + tn)
for all cores
SCHEDULER
Temperature-Aware
Allocation on Cores
20 Coskun, BU
[Transactions on CAD’09]
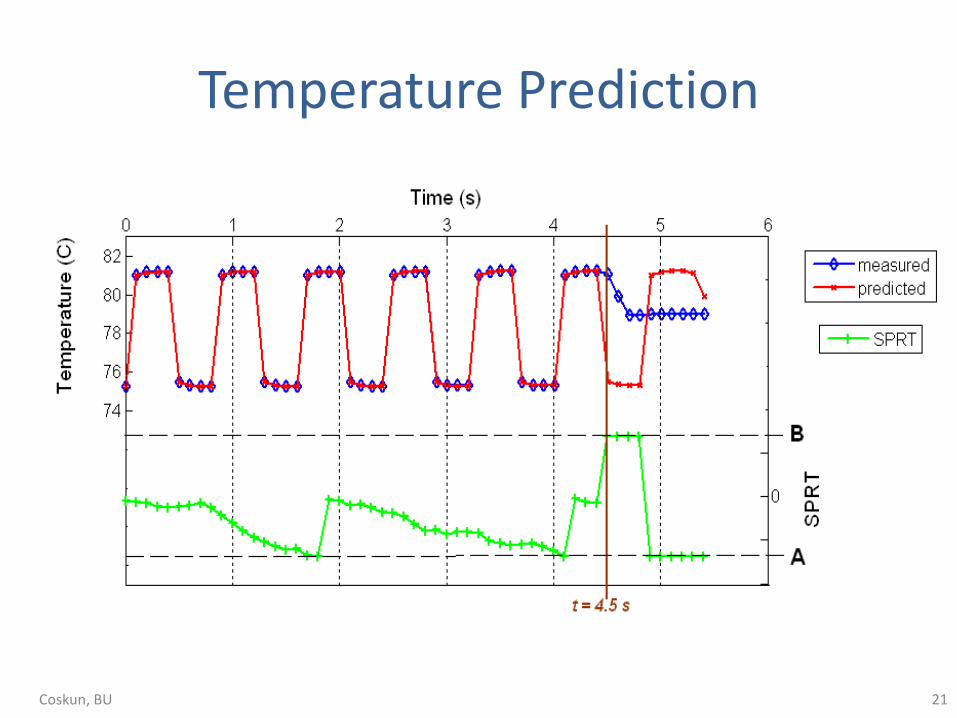
Temperature Prediction
21 Coskun, BU
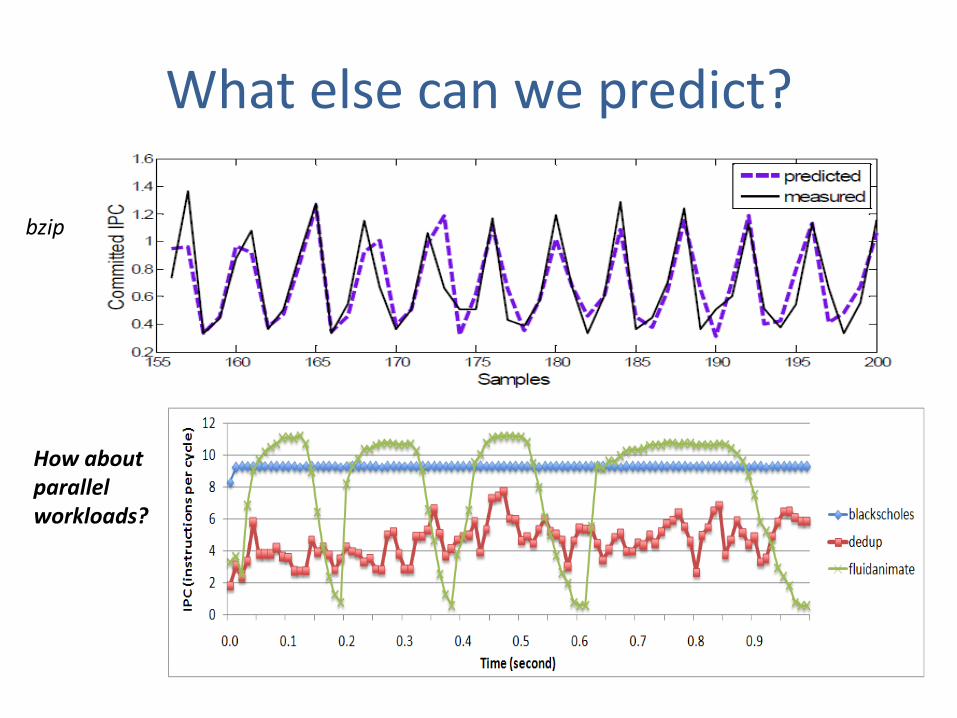
What else can we predict?
bzip
How about parallel workloads?
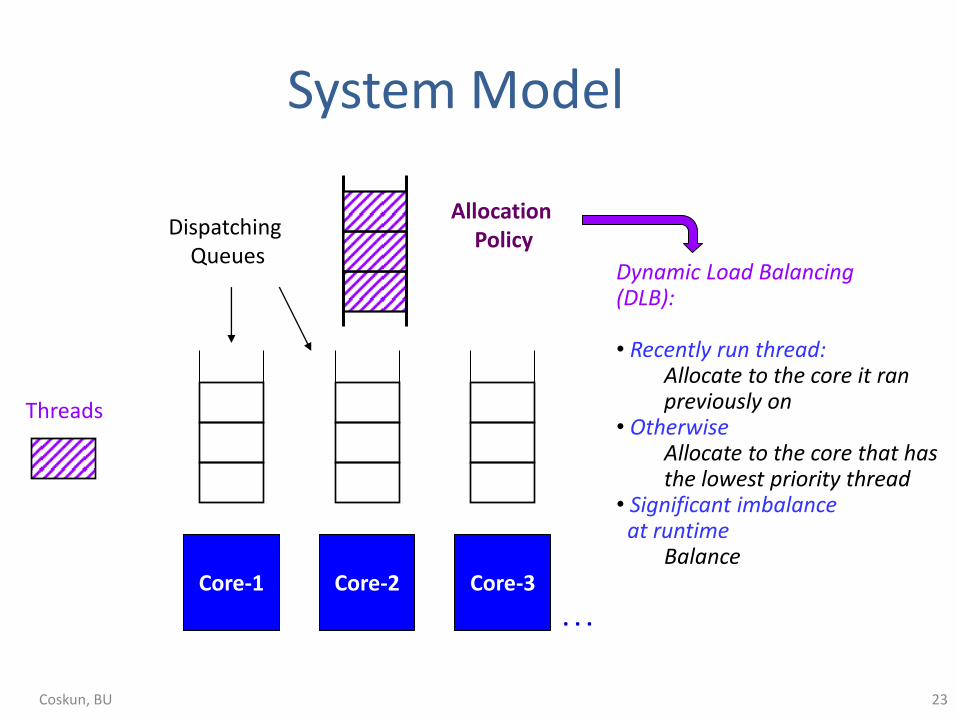
System Model
Core-1 Core-2 Core-3
. . .
Threads
Dispatching Queues
Allocation Policy
Dynamic Load Balancing (DLB): • Recently run thread:
Allocate to the core it ran previously on
• Otherwise Allocate to the core that has the lowest priority thread
• Significant imbalance at runtime
Balance
23 Coskun, BU
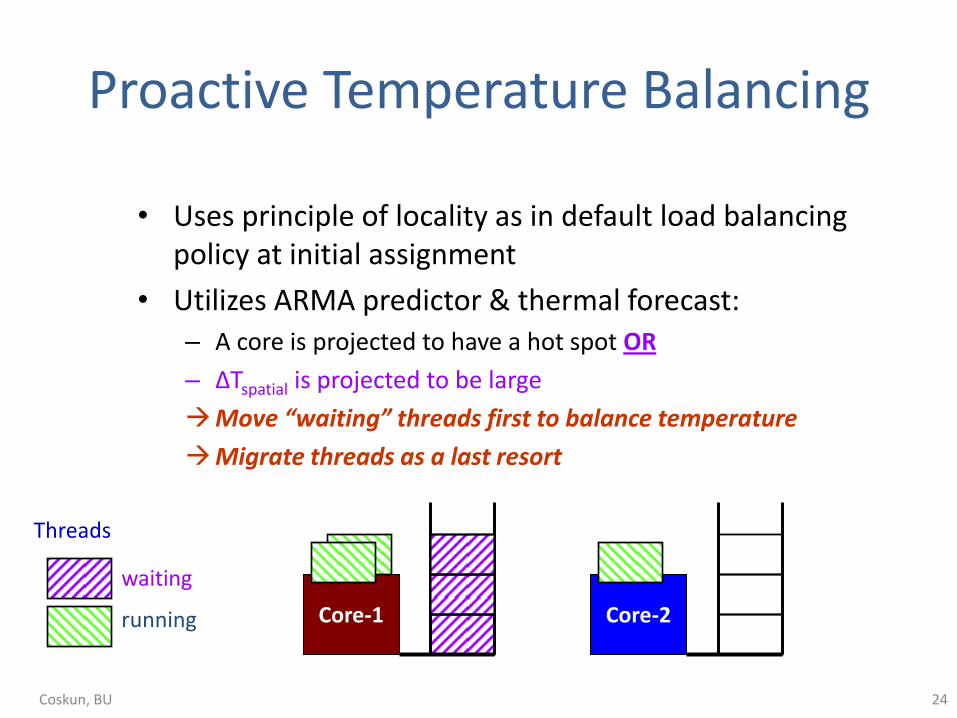
Proactive Temperature Balancing
• Uses principle of locality as in default load balancing policy at initial assignment
• Utilizes ARMA predictor & thermal forecast: – A core is projected to have a hot spot OR
– ΔTspatial is projected to be large
Move “waiting” threads first to balance temperature
Migrate threads as a last resort
Core-1
Threads
waiting
running Core-2
24 Coskun, BU
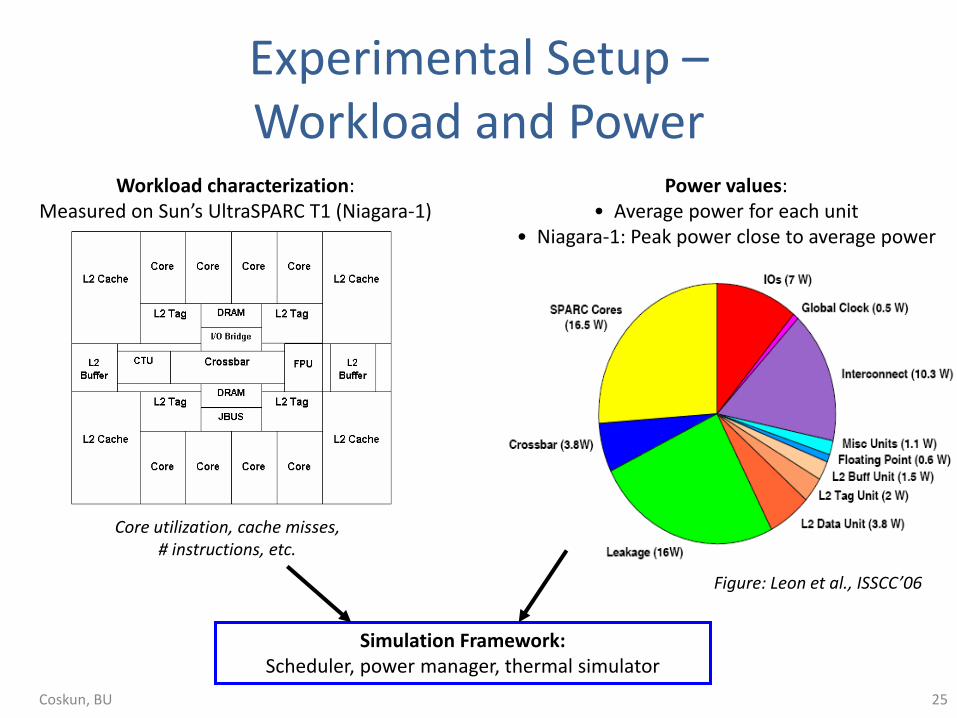
Experimental Setup – Workload and Power
Workload characterization: Measured on Sun’s UltraSPARC T1 (Niagara-1)
Power values: • Average power for each unit
• Niagara-1: Peak power close to average power
Figure: Leon et al., ISSCC’06
Simulation Framework: Scheduler, power manager, thermal simulator
Core utilization, cache misses, # instructions, etc.
25 Coskun, BU
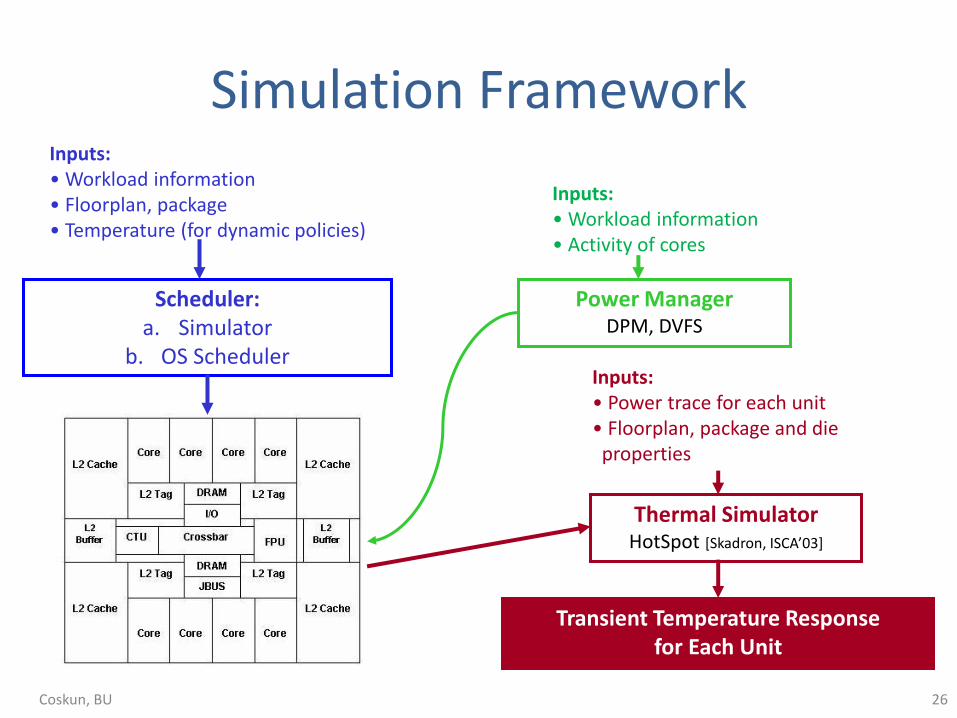
Simulation Framework
Scheduler: a. Simulator
b. OS Scheduler
Inputs: • Workload information • Floorplan, package • Temperature (for dynamic policies)
Power Manager DPM, DVFS
Inputs: • Workload information • Activity of cores
Thermal Simulator HotSpot [Skadron, ISCA’03]
Inputs: • Power trace for each unit • Floorplan, package and die properties
Transient Temperature Response for Each Unit
26 Coskun, BU
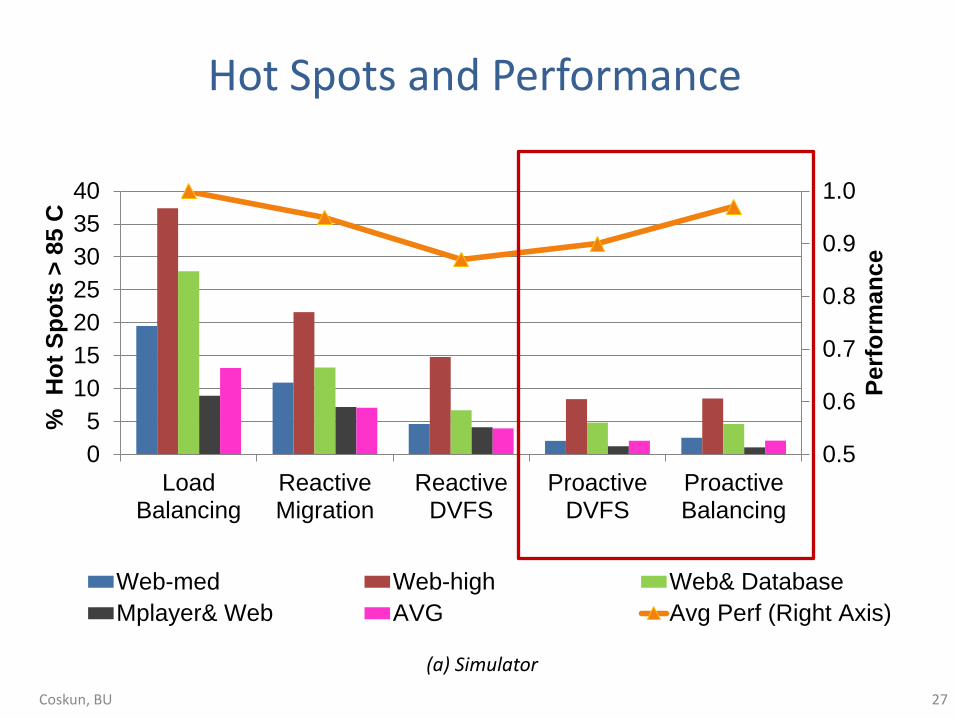
Hot Spots and Performance
0.5
0.6
0.7
0.8
0.9
1.0
0
5
10
15
20
25
30
35
40
LoadBalancing
ReactiveMigration
ReactiveDVFS
ProactiveDVFS
ProactiveBalancing
Perf
orm
an
ce
%
Ho
t S
po
ts >
85 C
Web-med Web-high Web& Database
Mplayer& Web AVG Avg Perf (Right Axis)
(a) Simulator
27 Coskun, BU
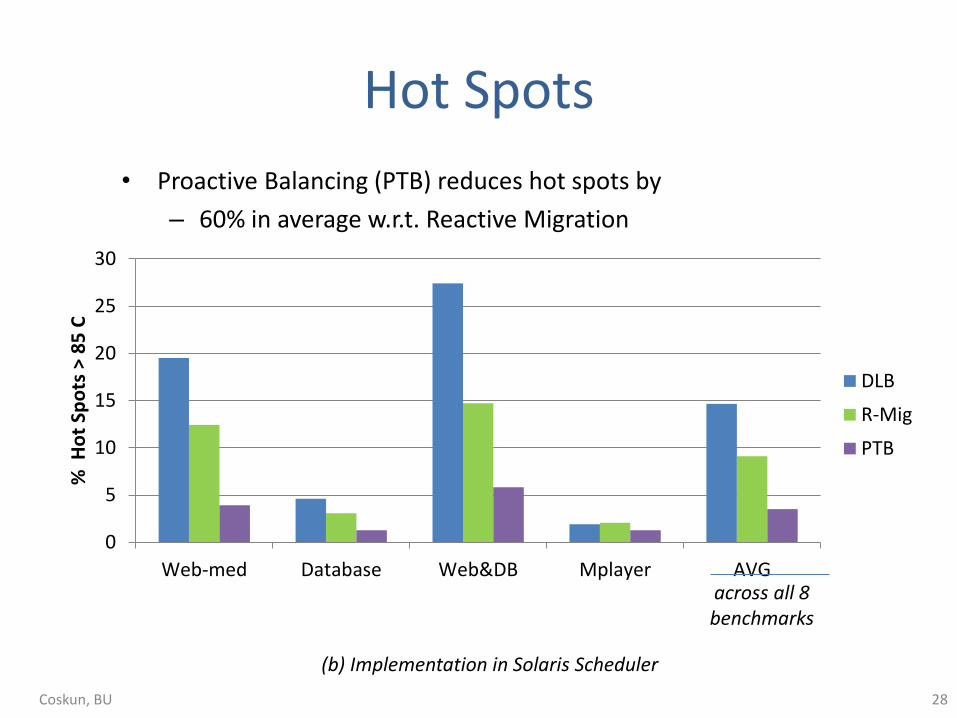
Hot Spots
• Proactive Balancing (PTB) reduces hot spots by
– 60% in average w.r.t. Reactive Migration
0
5
10
15
20
25
30
Web-med Database Web&DB Mplayer AVG
% H
ot
Spo
ts >
85
C
DLB
R-Mig
PTB
across all 8 benchmarks
(b) Implementation in Solaris Scheduler
28 Coskun, BU
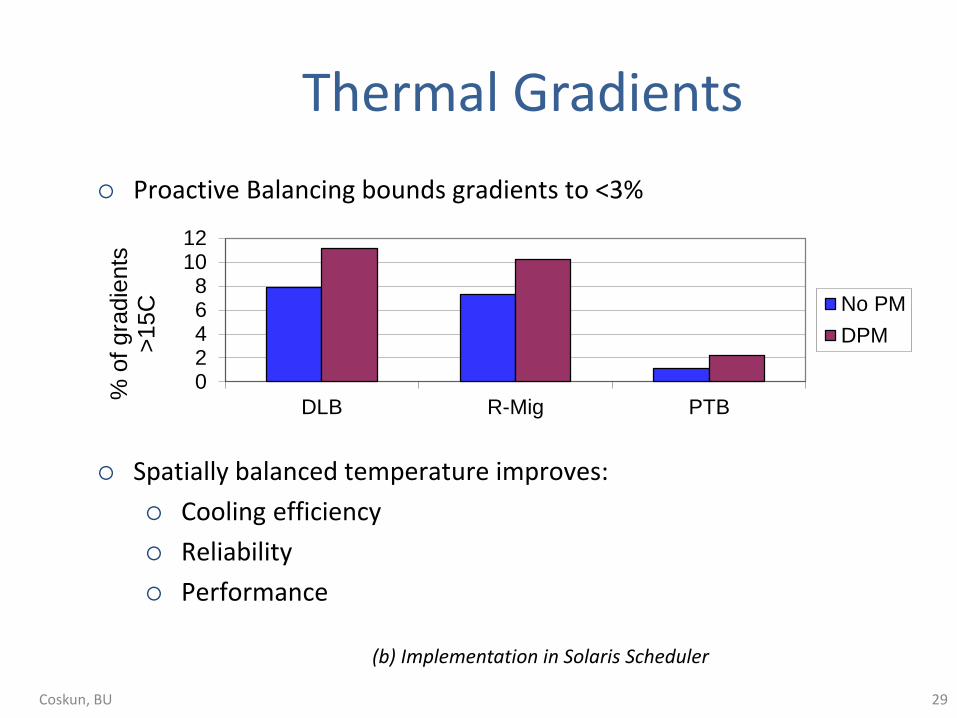
Thermal Gradients
Proactive Balancing bounds gradients to <3%
Spatially balanced temperature improves:
Cooling efficiency
Reliability
Performance
(b) Implementation in Solaris Scheduler
02468
1012
DLB R-Mig PTB
% o
f gra
die
nts
>
15C
No PM
DPM
29 Coskun, BU
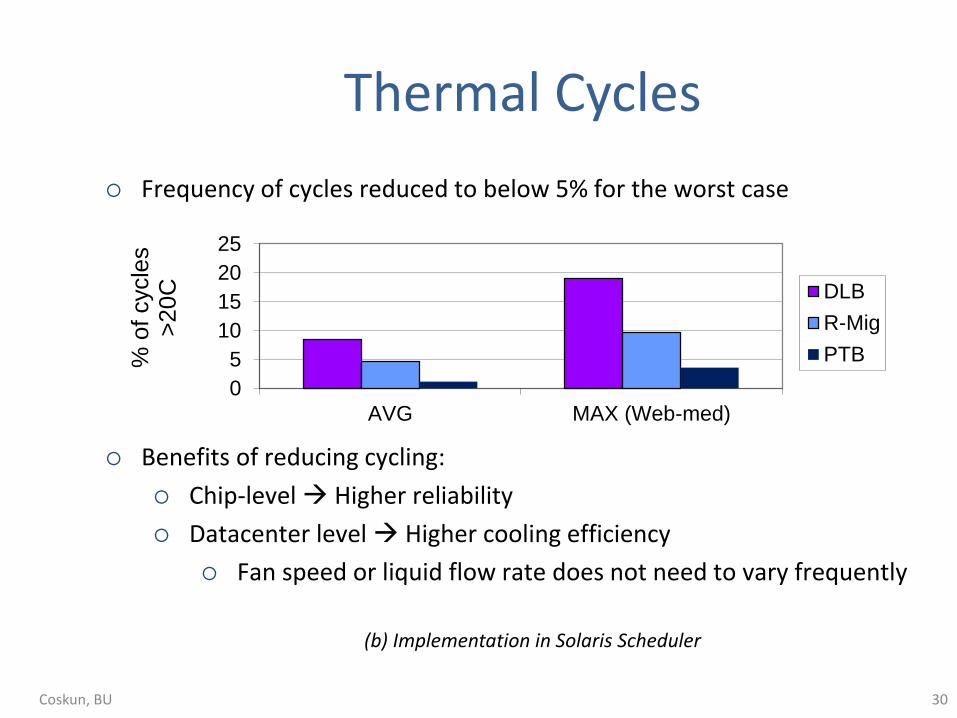
Thermal Cycles
Frequency of cycles reduced to below 5% for the worst case
Benefits of reducing cycling:
Chip-level Higher reliability
Datacenter level Higher cooling efficiency
Fan speed or liquid flow rate does not need to vary frequently
(b) Implementation in Solaris Scheduler
0
5
10
15
20
25
AVG MAX (Web-med)
% o
f cycle
s
>20C
DLB
R-Mig
PTB
30 Coskun, BU
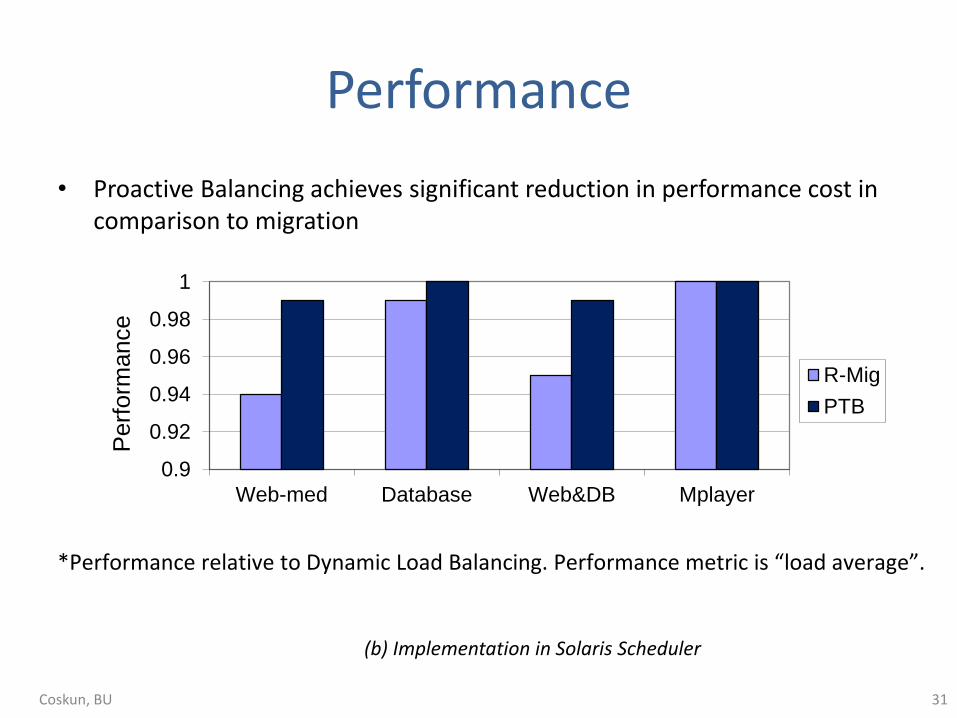
Performance
• Proactive Balancing achieves significant reduction in performance cost in comparison to migration
*Performance relative to Dynamic Load Balancing. Performance metric is “load average”.
(b) Implementation in Solaris Scheduler
0.9
0.92
0.94
0.96
0.98
1
Web-med Database Web&DB Mplayer
Perf
orm
ance
R-Mig
PTB
31 Coskun, BU
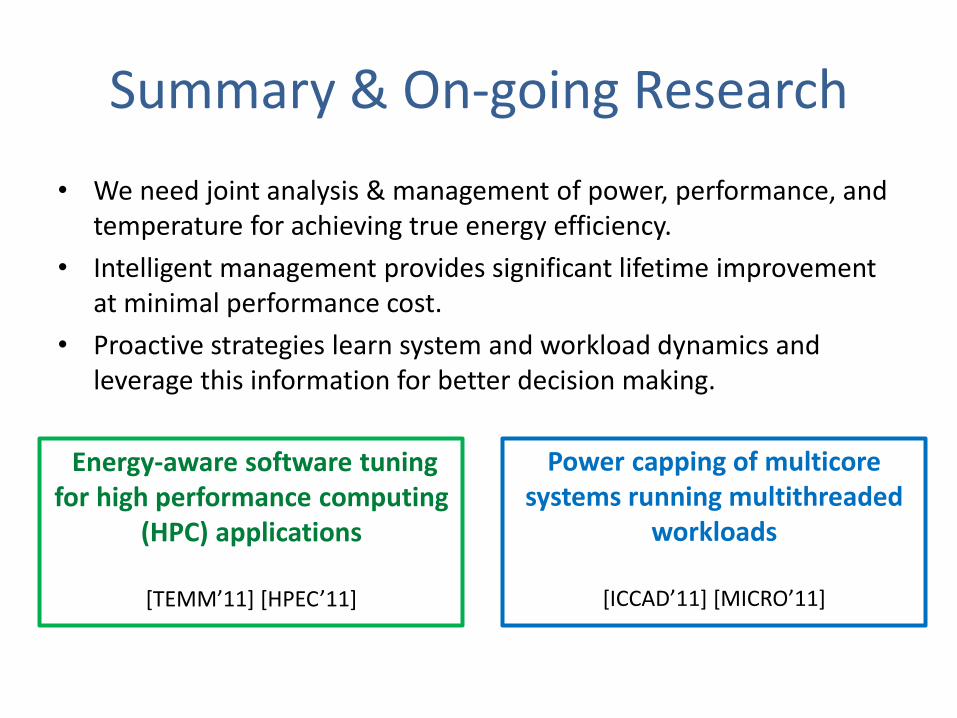
Summary & On-going Research
• We need joint analysis & management of power, performance, and temperature for achieving true energy efficiency.
• Intelligent management provides significant lifetime improvement at minimal performance cost.
• Proactive strategies learn system and workload dynamics and leverage this information for better decision making.
Energy-aware software tuning for high performance computing
(HPC) applications
[TEMM’11] [HPEC’11]
Power capping of multicore systems running multithreaded
workloads
[ICCAD’11] [MICRO’11]
Performance and Energy Aware Computing Laboratory
Funding
For more information: http://www.bu.edu/peaclab [email protected]