Efficient C/C++ Tracing with Eclipse - LTTng Project
26
Efficient C/C++ Tracing with Eclipse dominique <dot> toupin <at> ericsson <dot> com
Transcript of Efficient C/C++ Tracing with Eclipse - LTTng Project

Efficient C/C++ Tracing
with Eclipse
dominique <dot> toupin <at> ericsson <dot> com

About me
› Developer Tool Manager at Ericsson, helping Ericsson sites to develop better software efficiently
› Telecommunication systems
– Open, standards-based common platform
– High availability, 99.999 % – Broad range of support for
both infrastructure and value-added applications
– Multimedia, network and application processing capabilities

About me
› GDB improvements, non-stop, multi-process, global breakpoint, dynamic tracepoint, core awareness, OS awareness, PTC set, …
› LTTng improvements, user space, common trace format, multicore association, CEWG, ...
› Eclipse GDB and LTTng integration, analysis
› Linux tracing research project with EcolePolytechnique
› Linux Tracing Summit Organization
› CDT Summit Organization

EclipseCon Europe, November 2011
Tracing concepts
Static Tracepoints (e.g. linux kernel trace event, LTTng UST)– Inserted at compile time, enable/disable at run-time– Low overhead– Represent the wisdom of developers who are most familiar with the
code– Rest of the world can use them to extract a great deal of useful
information without having to know the code
Dynamic Tracepoint (e.g. Linux kernel kprobes, GDB tracepoint)– Inserted at run-time, enable/disable at run-time– Big overhead compared to static tracepoint– Use it when a static tracepoint is missing– If used a lot over a long period of time, think about converting them to
static

EclipseCon Europe, November 2011
Tracing usefulness
Very efficient compared to logging
Performance tuning
Diagnose multicore programming bug
Monitoring a live system

EclipseCon Europe, November 2011
lttng
› Linux Tracing Toolkit next generation (LTTng)
› Included in several Linux Distros, more than 90 contributors from 20 different organizations
› System-wide tracing across:– Kernel– Hypervisor– VM– Library– Application
› Precise and fast clock sources with near cycle-level timestamps, i.e. 1-100 ns

EclipseCon Europe, November 2011
LTTng distinctive features
› Efficient trace data transport– Compact Binary format with Common Trace Format– Per-core buffers ensures scalability– Fast-paths in caller context, amortized synchronization– Zero-copy using splice and mmap system calls, over disk, network
or consumed in-place
› Low-intrusiveness instrumentation and control– Per-process control thread with low footprint– Fast user-space process registration– Static Tracepoints enabled with static jump patching

EclipseCon Europe, November 2011
› Multi-session support with per host or per user daemon› Algorithms based on RCU verified by model checking› Designed to meet real-time constraints› Supports live streaming of the trace data
LTTng distinctive features

EclipseCon Europe, November 2011
Common Trace Format
Ericsson and Linux Foundation CE Linux Workgroup
Reviewed by Linux kernel developers and SystemTAP communities
In collaboration with Multi-Core Association Tool Infrastructure Workgroup
Freescale, Mentor Graphics, IBM, IMEC, National Instruments, Nokia Siemens Networks, Samsung, Texas Instruments, Tilera, Wind River, University of Houston, Polytechnique Montréal, University of Utah, …
Requirement, specification, reference implementation http://www.efficios.com/ctf

EclipseCon Europe, November 2011
Common Trace Format
Self describing
Very compact binary trace format
System-wide and multi-system trace representation in a common format, for integrated analysis:
− Software tracesAcross multiple CPUsAcross the software stack, e.g. hypervisor, kernel, library, applications
− Hardware tracesDSPs, device-specific tracing components.GPUs.

EclipseCon Europe, November 2011
Eclipse Tracing monitoring framework (TMF)
› Eclipse Linux Tools Project
› Framework to build trace visualization and analysis tool
› Scalability allows to handle traces exceeding memory
› Enable trace analysis from different sources
› LTTng Eclipse integration is an implementation on top of TMF

EclipseCon Europe, November 2011
Lttng perspective

EclipseCon Europe, November 2011
project explorer view
› Tracing projects integrate into Project Explorer view using Common Navigator Framework (CNF)
› Tracing projects are used to group traces you are interested in
› Traces folder contains the traces of interest
› Experiments are the way to group and correlate traces
EclipseCon Europe, November 2011
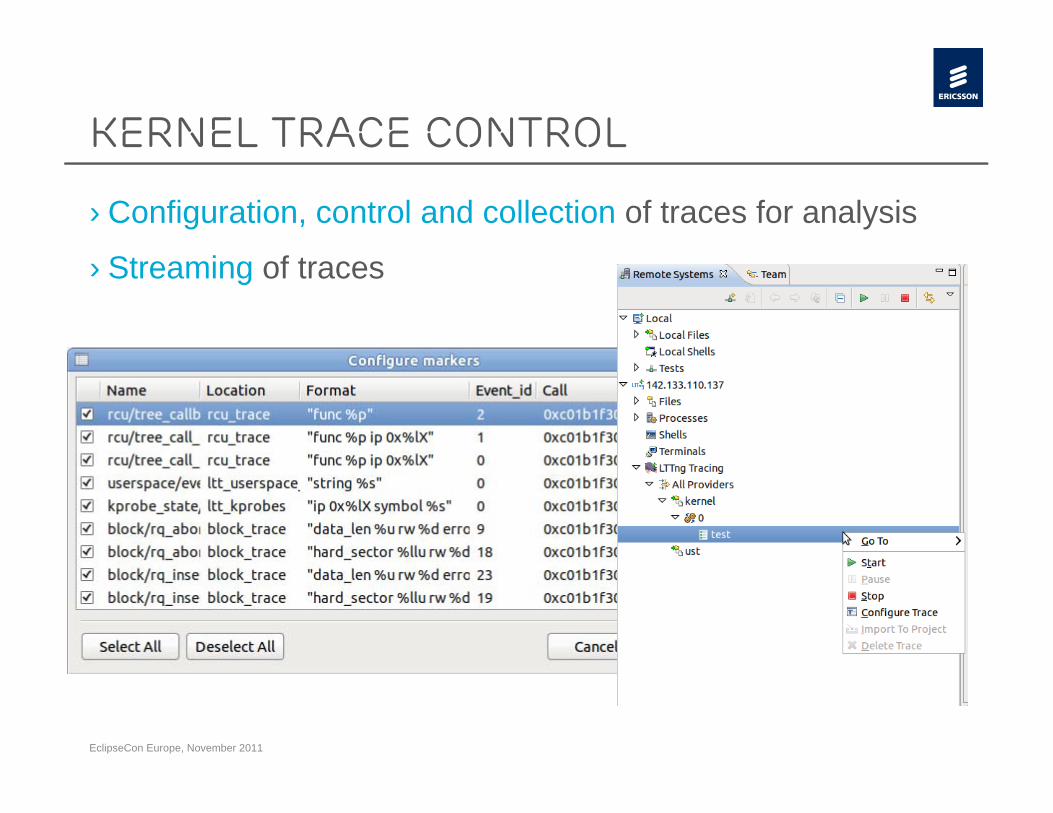
Kernel trace control
› Configuration, control and collection of traces for analysis
› Streaming of traces

EclipseCon Europe, November 2011
events view
› ‘Raw’ merged events in chronological order
› Supports following functionalities– Searching– Filtering– Highlighting

EclipseCon Europe, November 2011
Histogram view
› Event distribution over full traceset and selected window
› Controls to modify current event and event window
› Zoom in/out using mouse scroll

EclipseCon Europe, November 2011
Control flow view
› Displays processes state changes (color-coded) over time› State 'tooltips'› Zooming and filtering› Quick navigation between processes, states
EclipseCon Europe, November 2011
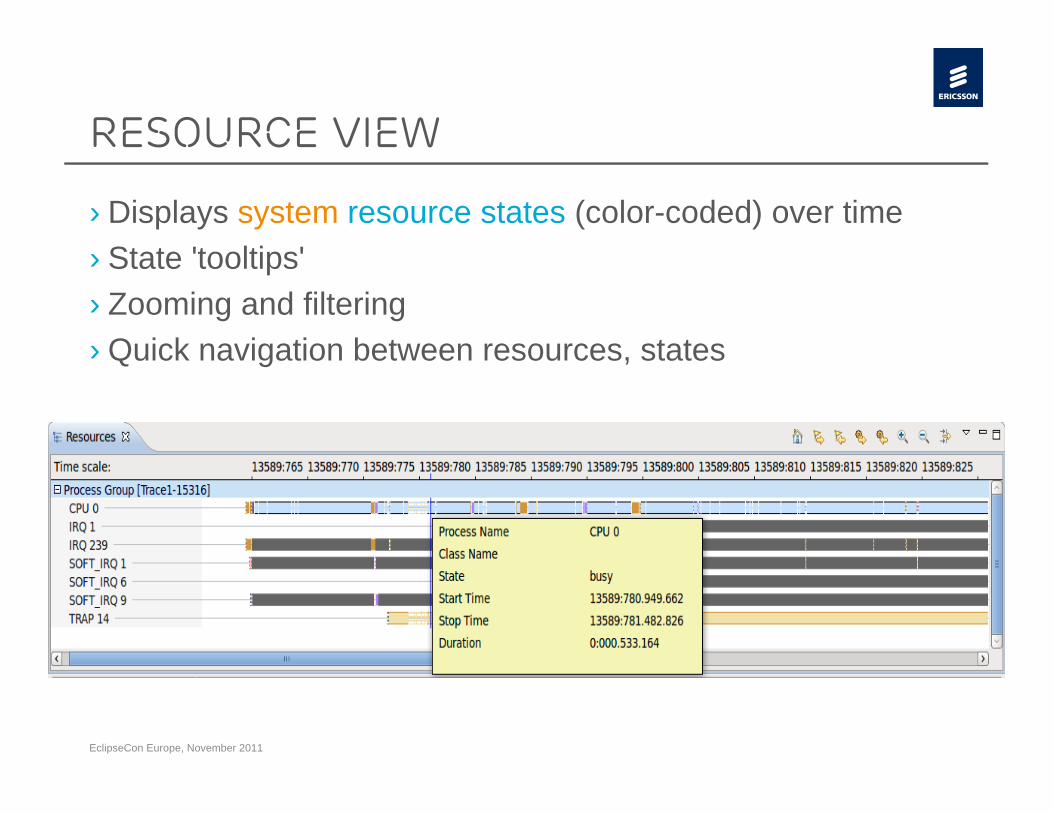
Resource view
› Displays system resource states (color-coded) over time› State 'tooltips'› Zooming and filtering› Quick navigation between resources, states

EclipseCon Europe, November 2011
Statistics view
› Displays basic trace statistics– Per process, event type– Per CPU, mode

EclipseCon Europe, November 2011
Gdb tracepoint integration
EclipseCon Europe, November 2011
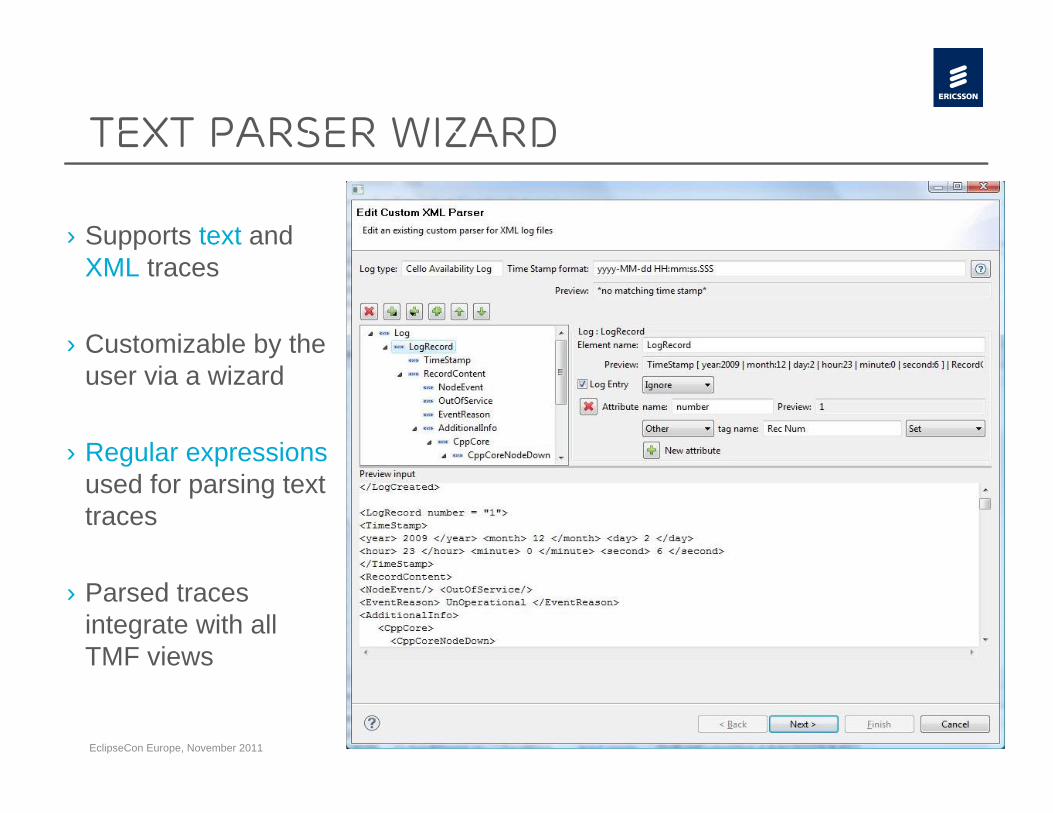
Text parser wizard
› Supports text and XML traces
› Customizable by the user via a wizard
› Regular expressionsused for parsing text traces
› Parsed traces integrate with all TMF views

EclipseCon Europe, November 2011
Sequence diagram framework
Supports any trace type
Provides all tooling for sequence diagram handling
Extendable for user specific sequence diagrams

EclipseCon Europe, November 2011
Current development
› Support for LTTng 2.0– CTF-based Kernel and UST traces– Trace control– Session management– Support for multiple trace sessions– Streaming
› Juno– Project graduation work (Linux Tools 1.0)– Uplift to Eclipse 4.X
› More analysis tools– Latency analysis, clock adjustment, trace comparison, etc.

EclipseCon Europe, November 2011
Eclipse Tracing Monitoring Framework architecture
EclipseCon Europe, November 2011
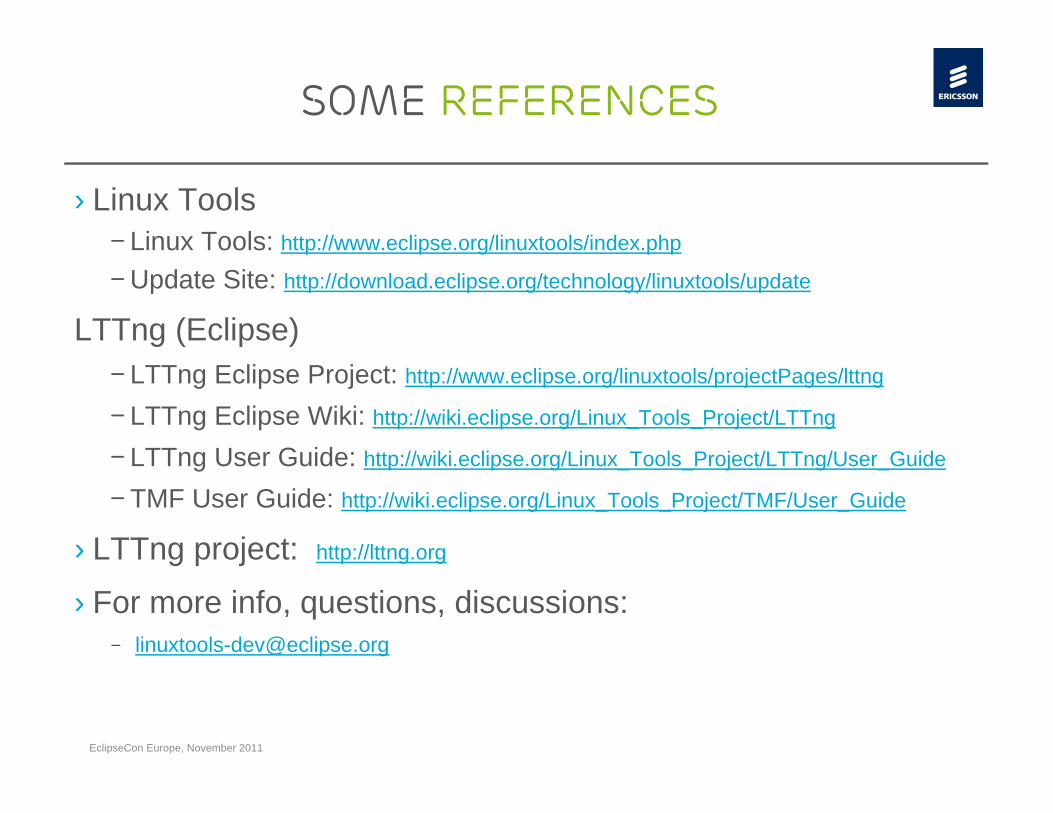
Some References
› Linux Tools– Linux Tools: http://www.eclipse.org/linuxtools/index.php
– Update Site: http://download.eclipse.org/technology/linuxtools/update
LTTng (Eclipse)– LTTng Eclipse Project: http://www.eclipse.org/linuxtools/projectPages/lttng
– LTTng Eclipse Wiki: http://wiki.eclipse.org/Linux_Tools_Project/LTTng
– LTTng User Guide: http://wiki.eclipse.org/Linux_Tools_Project/LTTng/User_Guide
– TMF User Guide: http://wiki.eclipse.org/Linux_Tools_Project/TMF/User_Guide
› LTTng project: http://lttng.org
› For more info, questions, discussions:– [email protected]

EclipseCon Europe, November 2011
Q&A