efficiency targets for 2020 and towards the implementation ... progress report - CSWD... · EE)...
44
EN EN EUROPEAN COMMISSION Brussels, 18.11.2015 SWD(2015) 245 final PART 2/2 COMMISSION STAFF WORKING DOCUMENT Accompanying the document REPORT FROM THE COMMISSION TO THE EUROPEAN PARLIAMENT AND THE COUNCIL Assessment of the progress made by Member States towards the national energy efficiency targets for 2020 and towards the implementation of the Energy Efficiency Directive 2012/27/EU as required by Article 24 (3) of Energy Efficiency Directive 2012/27/EU {COM(2015) 574 final}
Transcript of efficiency targets for 2020 and towards the implementation ... progress report - CSWD... · EE)...
EN EN
EUROPEAN COMMISSION
Brussels, 18.11.2015
SWD(2015) 245 final
PART 2/2
COMMISSION STAFF WORKING DOCUMENT
Accompanying the document
REPORT FROM THE COMMISSION TO THE EUROPEAN PARLIAMENT AND
THE COUNCIL
Assessment of the progress made by Member States towards the national energy
efficiency targets for 2020 and towards the implementation of the Energy Efficiency
Directive 2012/27/EU as required by Article 24 (3) of Energy Efficiency Directive
2012/27/EU
{COM(2015) 574 final}

46
TABLE OF CONTENTS
Annex II – Indicators of the Annual Reports ......................................................................................... 32
8. Estonia ........................................................................................................................... 47
9. Finland ........................................................................................................................... 49
10. France ........................................................................................................................ 51
11. Germany .................................................................................................................... 53
12. Greece ....................................................................................................................... 55
13. Hungary ..................................................................................................................... 57
14. Ireland ........................................................................................................................ 59
15. Italy ............................................................................................................................ 61
16. Latvia ......................................................................................................................... 63
17. Lithuania .................................................................................................................... 65
18. Luxembourg ............................................................................................................... 67
19. Malta ......................................................................................................................... 69
20. Netherlands ............................................................................................................... 71
21. Poland ........................................................................................................................ 73
22. Portugal ..................................................................................................................... 75
23. Romania ..................................................................................................................... 77
24. Slovakia ...................................................................................................................... 79
25. Slovenia ..................................................................................................................... 81
26. Spain .......................................................................................................................... 83
27. Sweden ...................................................................................................................... 85
28. UK .............................................................................................................................. 87

47
8. Estonia
0.0
0.2
0.4
0.6
0.8
1.0
20
05
20
06
20
07
20
08
20
09
20
10
20
11
20
12
20
13
[Mill
ions T
OE
]
EE) Industry: final energy breakdown
Mining and quarrying Iron and steel Non-ferrous metals
Non-metallic minerals Chemical and petrochemical Paper, pulp and print
Textile and leather Wood and wood products Food and tobacco
Transport equipment Machinery Construction
Non-specified FEC of energy-intensive industry
60%
80%
100%
120%
140%
20
05
20
06
20
07
20
08
20
09
20
10
20
11
20
12
20
13
EE) Transport: final energy consumption vs tonne-kilometers
National final energy of transport (pipeline transport excl.) (2005 =100%)
National tonne-kilometers by road, rail and waterway (2005 = 100%)
EU28 final energy of transport (pipeline transport excl.) (2005 = 100%)
0.0
0.2
0.4
0.6
0.8
1.0
20
05
20
06
20
07
20
08
20
09
20
10
20
11
20
12
20
13
[Mill
ions T
OE
]
EE) Transport: final energy breakdown
Road Rail Domestic aviation
International aviation Domestic navigation Non-specified
0
5
10
15
20
0
5
10
15
2020
05
20
06
20
07
20
08
20
09
20
10
20
11
20
12
20
13
20
14
20
15
20
16
20
17
20
18
20
19
20
20
Energ
y [
Mill
ions T
OE
]
GD
P [
Bill
ions E
UR
O]
EE) Primary and final energy consumption vs GDP
GDP, 2005 chain-linked volumes + ECFIN forecast Final energy consumption
Primary energy consumption Final energy linear target path 2005-2020
Primary energy linear target path 2005-2020 Final energy 2020 target
Primary energy 2020 target
0
50
100
150
200
250
300
20
05
20
06
20
07
20
08
20
09
20
10
20
11
20
12
20
13
[TO
E/M
illio
ns E
UR
O]
EE) Final energy intensity (FEC / GDP)
National final energy intensity EU28 final energy intensity
0
50
100
150
200
250
300
20
05
20
06
20
07
20
08
20
09
20
10
20
11
20
12
20
13
[TO
E/M
illio
ns E
UR
O]
EE) Industry: final energy intensity (FEC / value added)
National final energy intensity of industry
EU28 final energy intensity of industry

48
40%
60%
80%
100%
120%
140%
160%20
05
20
06
20
07
20
08
20
09
20
10
20
11
20
12
20
13
EE) Residential: final energy consumption, HDD normalized vs disposable income of households
National final energy, HDD normalized (2005 = 100%)
National disposable income of households (2005 = 100%)
EU28 final energy, HDD normalized (2005 = 100%)
EU28 disposable income of households (2005 = 100%)
0
1
2
3
4
20
05
20
06
20
07
20
08
20
09
20
10
20
11
20
12
20
13
[Mill
ions T
OE
]
EE) Energy generation from thermal power and CHP
Electricity from thermal power (CHP included)
Electricity from CHP
Heat from thermal power (CHP included)
Heat from CHP
Input to thermal power (CHP included)
0.0
0.3
0.6
0.9
1.2
20
05
20
06
20
07
20
08
20
09
20
10
20
11
20
12
20
13
[Mill
ions T
OE
]
EE) Electricity generation breakdown
Nuclear power stations (CHP excluded)
Autoproducer conventional thermal power stations (CHP excluded)
Main activity conventional thermal power stations (CHP exluded)
Autoproducer CHP
Main activity CHP
0
100
200
300
20
05
20
06
20
07
20
08
20
09
20
10
20
11
20
12
20
13
[TO
E/M
illio
ns o
f P
ers
ons/H
DD
]
EE) Residential: final energy consumption per capita, HDD normalized
National final energy per capita, HDD normalized
EU28 final energy per capita, HDD normalized
0
50
100
150
20
05
20
06
20
07
20
08
20
09
20
10
20
11
20
12
20
13
[TO
E/M
illio
ns o
f P
ers
ons/H
DD
]
EE) Services: final energy consumption per capita, HDD normalized
National final energy per capita, HDD normalized
EU28 final energy per capita, HDD normalized
60%
80%
100%
120%
140%
20
05
20
06
20
07
20
08
20
09
20
10
20
11
20
12
20
13
EE) Services: final energy intensity (FEC / value added), HDD normalized
National final energy intensity, HDD normalized (2005 = 100%)
EU28 final energy intensity, HDD normalized (2005 = 100%)

49
9. Finland
0
3
6
9
12
15
20
05
20
06
20
07
20
08
20
09
20
10
20
11
20
12
20
13
[Mill
ions T
OE
]
FI) Industry: final energy breakdown
Mining and quarrying Iron and steel Non-ferrous metals
Non-metallic minerals Chemical and petrochemical Paper, pulp and print
Textile and leather Wood and wood products Food and tobacco
Transport equipment Machinery Construction
Non-specified FEC of energy-intensive industry
80%
100%
120%
20
05
20
06
20
07
20
08
20
09
20
10
20
11
20
12
20
13
FI) Transport: final energy consumption vs passenger-kilometers and tonne-kilometers
National final energy of transport (pipeline transport excl.) (2005 =100%)
National passenger-kilometers by road and rail (2005 = 100%)
National tonne-kilometers by road, rail and waterway (2005 = 100%)
0
1
2
3
4
5
6
20
05
20
06
20
07
20
08
20
09
20
10
20
11
20
12
20
13
[Mill
ions T
OE
]
FI) Transport: final energy breakdown
Road Rail Domestic aviation
International aviation Domestic navigation Non-specified
0
25
50
75
100
0
50
100
150
20020
05
20
06
20
07
20
08
20
09
20
10
20
11
20
12
20
13
20
14
20
15
20
16
20
17
20
18
20
19
20
20
Energ
y [
Mill
ions T
OE
]
GD
P [
Bill
ions E
UR
O]
FI) Primary and final energy consumption vs GDP
GDP, 2005 chain-linked volumes + ECFIN forecast Final energy consumption
Primary energy consumption Final energy linear target path 2005-2020
Primary energy linear target path 2005-2020 Final energy 2020 target
Primary energy 2020 target
0
25
50
75
100
125
150
175
20
05
20
06
20
07
20
08
20
09
20
10
20
11
20
12
20
13
[TO
E/M
illio
ns E
UR
O]
FI) Final energy intensity (FEC / GDP)
National final energy intensity EU28 final energy intensity
0
50
100
150
200
250
300
20
05
20
06
20
07
20
08
20
09
20
10
20
11
20
12
20
13
[TO
E/M
illio
ns E
UR
O]
FI) Industry: final energy intensity (FEC / value added)
National final energy intensity of industry
EU28 final energy intensity of industry

50
60%
80%
100%
120%
140%20
05
20
06
20
07
20
08
20
09
20
10
20
11
20
12
20
13
FI) Residential: final energy consumption, HDD normalized vs disposable income of households
National final energy, HDD normalized (2005 = 100%)
National disposable income of households (2005 = 100%)
EU28 final energy, HDD normalized (2005 = 100%)
EU28 disposable income of households (2005 = 100%)
0
5
10
15
20
20
05
20
06
20
07
20
08
20
09
20
10
20
11
20
12
20
13
[Mill
ions T
OE
]
FI) Energy generation from thermal power and CHP
Electricity from thermal power (CHP included)
Electricity from CHP
Heat from thermal power (CHP included)
Heat from CHP
Input to thermal power (CHP included)
0
2
4
6
8
20
05
20
06
20
07
20
08
20
09
20
10
20
11
20
12
20
13
[Mill
ions T
OE
]
FI) Electricity generation breakdown
Nuclear power stations (CHP excluded)
Autoproducer conventional thermal power stations (CHP excluded)
Main activity conventional thermal power stations (CHP exluded)
Autoproducer CHP
Main activity CHP
0
100
200
300
20
05
20
06
20
07
20
08
20
09
20
10
20
11
20
12
20
13
[TO
E/M
illio
ns o
f P
ers
ons/H
DD
]
FI) Residential: final energy consumption per capita, HDD normalized
National final energy per capita, HDD normalized
EU28 final energy per capita, HDD normalized
0
50
100
150
20
05
20
06
20
07
20
08
20
09
20
10
20
11
20
12
20
13
[TO
E/M
illio
ns o
f P
ers
ons/H
DD
]FI) Services: final energy consumption per capita,
HDD normalized
National final energy per capita, HDD normalized
EU28 final energy per capita, HDD normalized
60%
80%
100%
120%
140%
20
05
20
06
20
07
20
08
20
09
20
10
20
11
20
12
20
13
FI) Services: final energy intensity (FEC / value added), HDD normalized
National final energy intensity, HDD normalized (2005 = 100%)
EU28 final energy intensity, HDD normalized (2005 = 100%)

51
10. France
0
10
20
30
40
20
05
20
06
20
07
20
08
20
09
20
10
20
11
20
12
20
13
[Mill
ions T
OE
]
FR) Industry: final energy breakdown
Mining and quarrying Iron and steel Non-ferrous metals
Non-metallic minerals Chemical and petrochemical Paper, pulp and print
Textile and leather Wood and wood products Food and tobacco
Transport equipment Machinery Construction
Non-specified FEC of energy-intensive industry
80%
100%
120%
20
05
20
06
20
07
20
08
20
09
20
10
20
11
20
12
20
13
FR) Transport: final energy consumption vs tonne-kilometers
National final energy of transport (pipeline transport excl.) (2005 =100%)
National tonne-kilometers by road, rail and waterway (2005 = 100%)
EU28 final energy of transport (pipeline transport excl.) (2005 = 100%)
0
10
20
30
40
50
60
20
05
20
06
20
07
20
08
20
09
20
10
20
11
20
12
20
13
[Mill
ions T
OE
]
FR) Transport: final energy breakdown
Road Rail Domestic aviation
International aviation Domestic navigation Non-specified
0
100
200
300
400
500
0
500
1,000
1,500
2,000
2,500
20
05
20
06
20
07
20
08
20
09
20
10
20
11
20
12
20
13
20
14
20
15
20
16
20
17
20
18
20
19
20
20
Energ
y [
Mill
ions T
OE
]
GD
P [
Bill
ions E
UR
O]
FR) Primary and final energy consumption vs GDP
GDP, 2005 chain-linked volumes + ECFIN forecast Final energy consumption
Primary energy consumption Final energy linear target path 2005-2020
Primary energy linear target path 2005-2020 Final energy 2020 target
Primary energy 2020 target
0
25
50
75
100
125
150
20
05
20
06
20
07
20
08
20
09
20
10
20
11
20
12
20
13
[TO
E/M
illio
ns E
UR
O]
FR) Final energy intensity (FEC / GDP)
National final energy intensity EU28 final energy intensity
0
50
100
150
20
05
20
06
20
07
20
08
20
09
20
10
20
11
20
12
20
13
[TO
E/M
illio
ns E
UR
O]
FR) Industry: final energy intensity (FEC / value added)
National final energy intensity of industry
EU28 final energy intensity of industry

52
60%
80%
100%
120%
140%
20
05
20
06
20
07
20
08
20
09
20
10
20
11
20
12
20
13
FR) Residential: final energy consumption, HDD normalized vs disposable income of households
National final energy, HDD normalized (2005 = 100%)
National disposable income of households (2005 = 100%)
EU28 final energy, HDD normalized (2005 = 100%)
EU28 disposable income of households (2005 = 100%)
0
25
50
75
100
125
150
20
05
20
06
20
07
20
08
20
09
20
10
20
11
20
12
20
13
[Mill
ions T
OE
]
FR) Energy generation from thermal power and CHP
Electricity from thermal power (CHP included)
Electricity from CHP
Heat from thermal power (CHP included)
Heat from CHP
Input to thermal power (CHP included)
0
10
20
30
40
50
20
05
20
06
20
07
20
08
20
09
20
10
20
11
20
12
20
13
[Mill
ions T
OE
]
FR) Electricity generation breakdown
Nuclear power stations (CHP excluded)
Autoproducer conventional thermal power stations (CHP excluded)
Main activity conventional thermal power stations (CHP exluded)
Autoproducer CHP
Main activity CHP
0
100
200
300
400
20
05
20
06
20
07
20
08
20
09
20
10
20
11
20
12
20
13
[TO
E/M
illio
ns o
f P
ers
ons/H
DD
]
FR) Residential: final energy consumption per capita, HDD normalized
National final energy per capita, HDD normalized
EU28 final energy per capita, HDD normalized
0
50
100
150
20020
05
20
06
20
07
20
08
20
09
20
10
20
11
20
12
20
13
[TO
E/M
illio
ns o
f P
ers
ons/H
DD
]
FR) Services: final energy consumption per capita, HDD normalized
National final energy per capita, HDD normalized
EU28 final energy per capita, HDD normalized
60%
80%
100%
120%
140%
20
05
20
06
20
07
20
08
20
09
20
10
20
11
20
12
20
13
FR) Services: final energy intensity (FEC / value added), HDD normalized
National final energy intensity, HDD normalized (2005 = 100%)
EU28 final energy intensity, HDD normalized (2005 = 100%)

53
11. Germany
80%
100%
120%
20
05
20
06
20
07
20
08
20
09
20
10
20
11
20
12
20
13
DE) Transport: final energy consumption vs tonne-kilometers
National final energy of transport (pipeline transport excl.) (2005 =100%)
National tonne-kilometers by road, rail and waterway (2005 = 100%)
EU28 final energy of transport (pipeline transport excl.) (2005 = 100%)
0
10
20
30
40
50
60
70
20
05
20
06
20
07
20
08
20
09
20
10
20
11
20
12
20
13
[Mill
ions T
OE
]
DE) Transport: final energy breakdown
Road Rail Domestic aviation
International aviation Domestic navigation Non-specified
0
100
200
300
400
500
600
0
500
1,000
1,500
2,000
2,500
3,00020
05
20
06
20
07
20
08
20
09
20
10
20
11
20
12
20
13
20
14
20
15
20
16
20
17
20
18
20
19
20
20
Energ
y [
Mill
ions T
OE
]
GD
P [
Bill
ions E
UR
O]
DE) Primary and final energy consumption vs GDP
GDP, 2005 chain-linked volumes + ECFIN forecast Final energy consumption
Primary energy consumption Final energy linear target path 2005-2020
Primary energy linear target path 2005-2020 Final energy 2020 target
Primary energy 2020 target
0
25
50
75
100
125
150
20
05
20
06
20
07
20
08
20
09
20
10
20
11
20
12
20
13
[TO
E/M
illio
ns E
UR
O]
DE) Final energy intensity (FEC / GDP)
National final energy intensity EU28 final energy intensity
0
50
100
150
20
05
20
06
20
07
20
08
20
09
20
10
20
11
20
12
20
13
[TO
E/M
illio
ns E
UR
O]
DE) Industry: final energy intensity (FEC / value added)
National final energy intensity of industry
EU28 final energy intensity of industry
0
10
20
30
40
50
60
70
20
05
20
06
20
07
20
08
20
09
20
10
20
11
20
12
20
13
[Mill
ions T
OE
]
DE) Industry: final energy breakdown
Mining and quarrying Iron and steel Non-ferrous metals
Non-metallic minerals Chemical and petrochemical Paper, pulp and print
Textile and leather Wood and wood products Food and tobacco
Transport equipment Machinery Construction
Non-specified FEC of energy-intensive industry

54
60%
80%
100%
120%
140%
20
05
20
06
20
07
20
08
20
09
20
10
20
11
20
12
20
13
DE) Residential: final energy consumption, HDD normalized vs disposable income of households
National final energy, HDD normalized (2005 = 100%)
National disposable income of households (2005 = 100%)
EU28 final energy, HDD normalized (2005 = 100%)
EU28 disposable income of households (2005 = 100%)
0
25
50
75
100
125
150
20
05
20
06
20
07
20
08
20
09
20
10
20
11
20
12
20
13
[Mill
ions T
OE
]
DE) Energy generation from thermal power and CHP
Electricity from thermal power (CHP included)
Electricity from CHP
Heat from thermal power (CHP included)
Heat from CHP
Input to thermal power (CHP included)
0
10
20
30
40
50
60
20
05
20
06
20
07
20
08
20
09
20
10
20
11
20
12
20
13
[Mill
ions T
OE
]
DE) Electricity generation breakdown
Nuclear power stations (CHP excluded)
Autoproducer conventional thermal power stations (CHP excluded)
Main activity conventional thermal power stations (CHP exluded)
Autoproducer CHP
Main activity CHP
0
100
200
300
20
05
20
06
20
07
20
08
20
09
20
10
20
11
20
12
20
13
[TO
E/M
illio
ns o
f P
ers
ons/H
DD
]
DE) Residential: final energy consumption per capita, HDD normalized
National final energy per capita, HDD normalized
EU28 final energy per capita, HDD normalized
0
50
100
150
20020
05
20
06
20
07
20
08
20
09
20
10
20
11
20
12
20
13
[TO
E/M
illio
ns o
f P
ers
ons/H
DD
]
DE) Services: final energy consumption per capita, HDD normalized
National final energy per capita, HDD normalized
EU28 final energy per capita, HDD normalized
60%
80%
100%
120%
140%
20
05
20
06
20
07
20
08
20
09
20
10
20
11
20
12
20
13
DE) Services: final energy intensity (FEC / value added), HDD normalized
National final energy intensity, HDD normalized (2005 = 100%)
EU28 final energy intensity, HDD normalized (2005 = 100%)
55
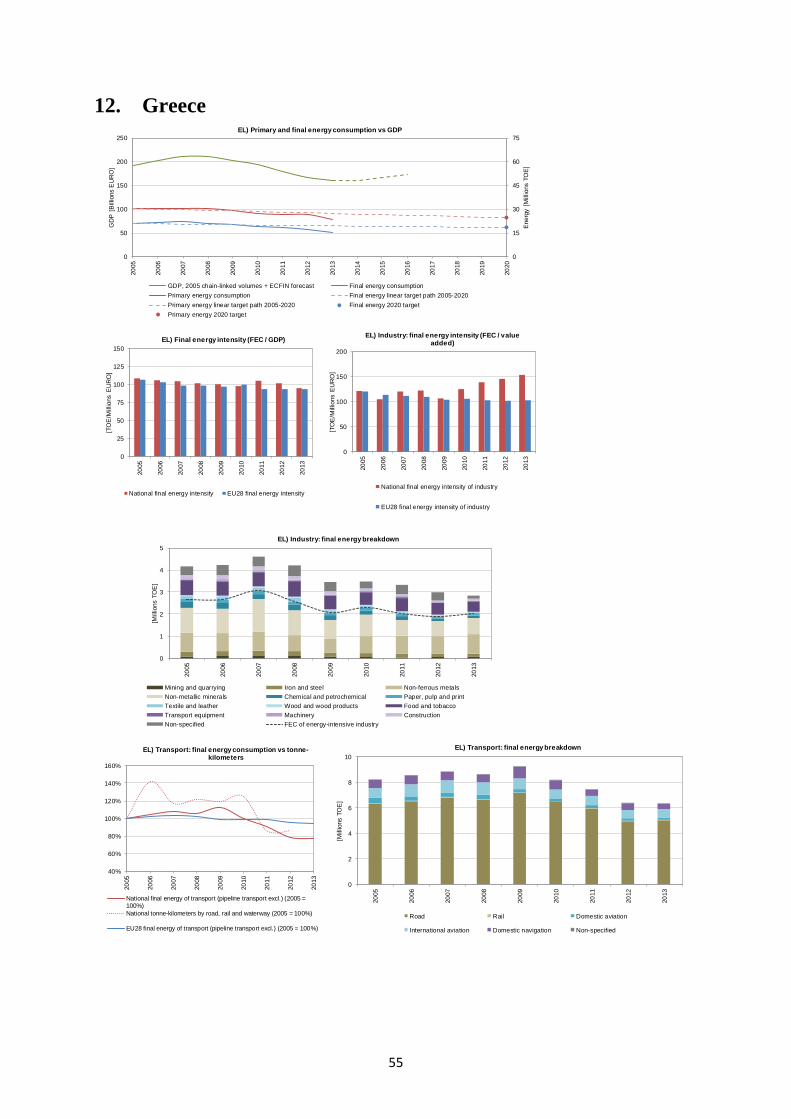
12. Greece
0
1
2
3
4
5
20
05
20
06
20
07
20
08
20
09
20
10
20
11
20
12
20
13
[Mill
ions T
OE
]
EL) Industry: final energy breakdown
Mining and quarrying Iron and steel Non-ferrous metals
Non-metallic minerals Chemical and petrochemical Paper, pulp and print
Textile and leather Wood and wood products Food and tobacco
Transport equipment Machinery Construction
Non-specified FEC of energy-intensive industry
40%
60%
80%
100%
120%
140%
160%
20
05
20
06
20
07
20
08
20
09
20
10
20
11
20
12
20
13
EL) Transport: final energy consumption vs tonne-kilometers
National final energy of transport (pipeline transport excl.) (2005 =100%)
National tonne-kilometers by road, rail and waterway (2005 = 100%)
EU28 final energy of transport (pipeline transport excl.) (2005 = 100%)
0
2
4
6
8
10
20
05
20
06
20
07
20
08
20
09
20
10
20
11
20
12
20
13
[Mill
ions T
OE
]
EL) Transport: final energy breakdown
Road Rail Domestic aviation
International aviation Domestic navigation Non-specified
0
15
30
45
60
75
0
50
100
150
200
25020
05
20
06
20
07
20
08
20
09
20
10
20
11
20
12
20
13
20
14
20
15
20
16
20
17
20
18
20
19
20
20
Energ
y [
Mill
ions T
OE
]
GD
P [
Bill
ions E
UR
O]
EL) Primary and final energy consumption vs GDP
GDP, 2005 chain-linked volumes + ECFIN forecast Final energy consumption
Primary energy consumption Final energy linear target path 2005-2020
Primary energy linear target path 2005-2020 Final energy 2020 target
Primary energy 2020 target
0
25
50
75
100
125
150
20
05
20
06
20
07
20
08
20
09
20
10
20
11
20
12
20
13
[TO
E/M
illio
ns E
UR
O]
EL) Final energy intensity (FEC / GDP)
National final energy intensity EU28 final energy intensity
0
50
100
150
200
20
05
20
06
20
07
20
08
20
09
20
10
20
11
20
12
20
13
[TO
E/M
illio
ns E
UR
O]
EL) Industry: final energy intensity (FEC / value added)
National final energy intensity of industry
EU28 final energy intensity of industry

56
60%
80%
100%
120%
140%20
05
20
06
20
07
20
08
20
09
20
10
20
11
20
12
20
13
EL) Residential: final energy consumption, HDD normalized vs disposable income of households
National final energy, HDD normalized (2005 = 100%)
National disposable income of households (2005 = 100%)
EU28 final energy, HDD normalized (2005 = 100%)
EU28 disposable income of households (2005 = 100%)
0
3
6
9
12
15
20
05
20
06
20
07
20
08
20
09
20
10
20
11
20
12
20
13
[Mill
ions T
OE
]
EL) Energy generation from thermal power and CHP
Electricity from thermal power (CHP included)
Electricity from CHP
Heat from thermal power (CHP included)
Heat from CHP
Input to thermal power (CHP included)
0
1
2
3
4
5
6
20
05
20
06
20
07
20
08
20
09
20
10
20
11
20
12
20
13
[Mill
ions T
OE
]
EL) Electricity generation breakdown
Nuclear power stations (CHP excluded)
Autoproducer conventional thermal power stations (CHP excluded)
Main activity conventional thermal power stations (CHP exluded)
Autoproducer CHP
Main activity CHP
0
100
200
300
400
20
05
20
06
20
07
20
08
20
09
20
10
20
11
20
12
20
13
[TO
E/M
illio
ns o
f P
ers
ons/H
DD
]
EL) Residential: final energy consumption per capita, HDD normalized
National final energy per capita, HDD normalized
EU28 final energy per capita, HDD normalized
0
50
100
150
20
05
20
06
20
07
20
08
20
09
20
10
20
11
20
12
20
13
[TO
E/M
illio
ns o
f P
ers
ons/H
DD
]
EL) Services: final energy consumption per capita, HDD normalized
National final energy per capita, HDD normalized
EU28 final energy per capita, HDD normalized
60%
80%
100%
120%
140%
20
05
20
06
20
07
20
08
20
09
20
10
20
11
20
12
20
13
EL) Services: final energy intensity (FEC / value added), HDD normalized
National final energy intensity, HDD normalized (2005 = 100%)
EU28 final energy intensity, HDD normalized (2005 = 100%)

57
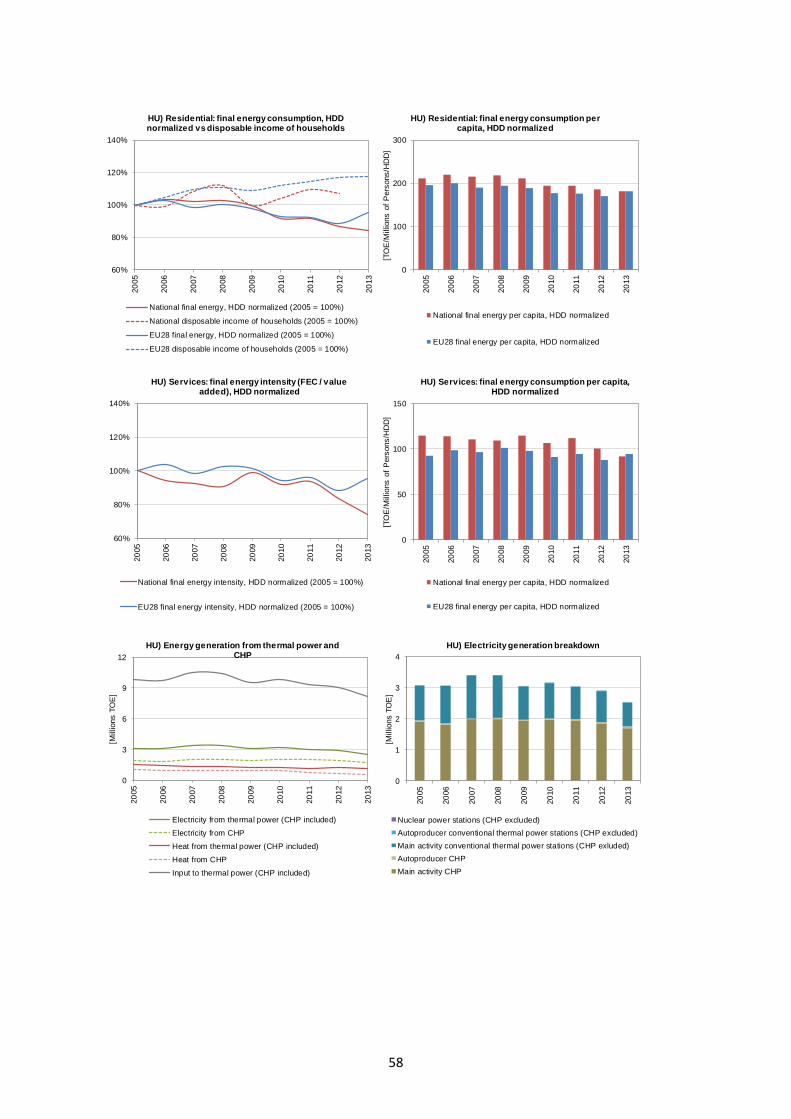
13. Hungary
0
1
2
3
4
20
05
20
06
20
07
20
08
20
09
20
10
20
11
20
12
20
13
[Mill
ions T
OE
]
HU) Industry: final energy breakdown
Mining and quarrying Iron and steel Non-ferrous metals
Non-metallic minerals Chemical and petrochemical Paper, pulp and print
Textile and leather Wood and wood products Food and tobacco
Transport equipment Machinery Construction
Non-specified FEC of energy-intensive industry
60%
80%
100%
120%
140%
20
05
20
06
20
07
20
08
20
09
20
10
20
11
20
12
20
13
HU) Transport: final energy consumption vs tonne-kilometers
National final energy of transport (pipeline transport excl.) (2005 =100%)
National tonne-kilometers by road, rail and waterway (2005 = 100%)
EU28 final energy of transport (pipeline transport excl.) (2005 = 100%)
0
1
2
3
4
5
20
05
20
06
20
07
20
08
20
09
20
10
20
11
20
12
20
13
[Mill
ions T
OE
]
HU) Transport: final energy breakdown
Road Rail Domestic aviation
International aviation Domestic navigation Non-specified
0
15
30
45
60
75
0
25
50
75
100
125
20
05
20
06
20
07
20
08
20
09
20
10
20
11
20
12
20
13
20
14
20
15
20
16
20
17
20
18
20
19
20
20
Energ
y [
Mill
ions T
OE
]
GD
P [
Bill
ions E
UR
O]
HU) Primary and final energy consumption vs GDP
GDP, 2005 chain-linked volumes + ECFIN forecast Final energy consumption
Primary energy consumption Final energy linear target path 2005-2020
Primary energy linear target path 2005-2020 Final energy 2020 target
Primary energy 2020 target
0
50
100
150
200
250
20
05
20
06
20
07
20
08
20
09
20
10
20
11
20
12
20
13
[TO
E/M
illio
ns E
UR
O]
HU) Final energy intensity (FEC / GDP)
National final energy intensity EU28 final energy intensity
0
50
100
150
200
20
05
20
06
20
07
20
08
20
09
20
10
20
11
20
12
20
13
[TO
E/M
illio
ns E
UR
O]
HU) Industry: final energy intensity (FEC / value added)
National final energy intensity of industry
EU28 final energy intensity of industry
58
60%
80%
100%
120%
140%20
05
20
06
20
07
20
08
20
09
20
10
20
11
20
12
20
13
HU) Residential: final energy consumption, HDD normalized vs disposable income of households
National final energy, HDD normalized (2005 = 100%)
National disposable income of households (2005 = 100%)
EU28 final energy, HDD normalized (2005 = 100%)
EU28 disposable income of households (2005 = 100%)
International aviation Domestic navigation Non-specified
0
3
6
9
12
20
05
20
06
20
07
20
08
20
09
20
10
20
11
20
12
20
13
[Mill
ions T
OE
]
HU) Energy generation from thermal power and CHP
Electricity from thermal power (CHP included)
Electricity from CHP
Heat from thermal power (CHP included)
Heat from CHP
Input to thermal power (CHP included)
0
1
2
3
4
20
05
20
06
20
07
20
08
20
09
20
10
20
11
20
12
20
13
[Mill
ions T
OE
]
HU) Electricity generation breakdown
Nuclear power stations (CHP excluded)
Autoproducer conventional thermal power stations (CHP excluded)
Main activity conventional thermal power stations (CHP exluded)
Autoproducer CHP
Main activity CHP
0
100
200
300
20
05
20
06
20
07
20
08
20
09
20
10
20
11
20
12
20
13
[TO
E/M
illio
ns o
f P
ers
ons/H
DD
]
HU) Residential: final energy consumption per capita, HDD normalized
National final energy per capita, HDD normalized
EU28 final energy per capita, HDD normalized
0
50
100
150
20
05
20
06
20
07
20
08
20
09
20
10
20
11
20
12
20
13
[TO
E/M
illio
ns o
f P
ers
ons/H
DD
]HU) Services: final energy consumption per capita,
HDD normalized
National final energy per capita, HDD normalized
EU28 final energy per capita, HDD normalized
60%
80%
100%
120%
140%
20
05
20
06
20
07
20
08
20
09
20
10
20
11
20
12
20
13
HU) Services: final energy intensity (FEC / value added), HDD normalized
National final energy intensity, HDD normalized (2005 = 100%)
EU28 final energy intensity, HDD normalized (2005 = 100%)

59
14. Ireland
0
1
2
3
20
05
20
06
20
07
20
08
20
09
20
10
20
11
20
12
20
13
[Mill
ions T
OE
]
IE) Industry: final energy breakdown
Mining and quarrying Iron and steel Non-ferrous metals
Non-metallic minerals Chemical and petrochemical Paper, pulp and print
Textile and leather Wood and wood products Food and tobacco
Transport equipment Machinery Construction
Non-specified FEC of energy-intensive industry
40%
60%
80%
100%
120%
140%
160%
20
05
20
06
20
07
20
08
20
09
20
10
20
11
20
12
20
13
IE) Transport: final energy consumption vs tonne-kilometers
National final energy of transport (pipeline transport excl.) (2005 =100%)
National tonne-kilometers by road, rail and waterway (2005 = 100%)
EU28 final energy of transport (pipeline transport excl.) (2005 = 100%)
0
1
2
3
4
5
6
20
05
20
06
20
07
20
08
20
09
20
10
20
11
20
12
20
13
[Mill
ions T
OE
]
IE) Transport: final energy breakdown
Road Rail Domestic aviation
International aviation Domestic navigation Non-specified
0
10
20
30
40
50
0
50
100
150
200
25020
05
20
06
20
07
20
08
20
09
20
10
20
11
20
12
20
13
20
14
20
15
20
16
20
17
20
18
20
19
20
20
Energ
y [
Mill
ions T
OE
]
GD
P [
Bill
ions E
UR
O]
IE) Primary and final energy consumption vs GDP
GDP, 2005 chain-linked volumes + ECFIN forecast Final energy consumption
Primary energy consumption Final energy linear target path 2005-2020
Primary energy linear target path 2005-2020 Final energy 2020 target
Primary energy 2020 target
0
25
50
75
100
125
150
20
05
20
06
20
07
20
08
20
09
20
10
20
11
20
12
20
13
[TO
E/M
illio
ns E
UR
O]
IE) Final energy intensity (FEC / GDP)
National final energy intensity EU28 final energy intensity
0
50
100
150
20
05
20
06
20
07
20
08
20
09
20
10
20
11
20
12
20
13
[TO
E/M
illio
ns E
UR
O]
IE) Industry: final energy intensity (FEC / value added)
National final energy intensity of industry
EU28 final energy intensity of industry

60
60%
80%
100%
120%
140%20
05
20
06
20
07
20
08
20
09
20
10
20
11
20
12
20
13
IE) Residential: final energy consumption, HDD normalized vs disposable income of households
National final energy, HDD normalized (2005 = 100%)
National disposable income of households (2005 = 100%)
EU28 final energy, HDD normalized (2005 = 100%)
EU28 disposable income of households (2005 = 100%)
0
1
2
3
4
5
6
20
05
20
06
20
07
20
08
20
09
20
10
20
11
20
12
20
13
[Mill
ions T
OE
]
IE) Energy generation from thermal power and CHP
Electricity from thermal power (CHP included)
Electricity from CHP
Heat from thermal power (CHP included)
Heat from CHP
Input to thermal power (CHP included)
0
1
2
3
20
05
20
06
20
07
20
08
20
09
20
10
20
11
20
12
20
13
[Mill
ions T
OE
]
IE) Electricity generation breakdown
Nuclear power stations (CHP excluded)
Autoproducer conventional thermal power stations (CHP excluded)
Main activity conventional thermal power stations (CHP exluded)
Autoproducer CHP
Main activity CHP
0
100
200
300
20
05
20
06
20
07
20
08
20
09
20
10
20
11
20
12
20
13
[TO
E/M
illio
ns o
f P
ers
ons/H
DD
]
IE) Residential: final energy consumption per capita, HDD normalized
National final energy per capita, HDD normalized
EU28 final energy per capita, HDD normalized
0
50
100
150
200
20
05
20
06
20
07
20
08
20
09
20
10
20
11
20
12
20
13
[TO
E/M
illio
ns o
f P
ers
ons/H
DD
]IE) Services: final energy consumption per capita,
HDD normalized
National final energy per capita, HDD normalized
EU28 final energy per capita, HDD normalized
60%
80%
100%
120%
140%
20
05
20
06
20
07
20
08
20
09
20
10
20
11
20
12
20
13
IE) Services: final energy intensity (FEC / value added), HDD normalized
National final energy intensity, HDD normalized (2005 = 100%)
EU28 final energy intensity, HDD normalized (2005 = 100%)
61
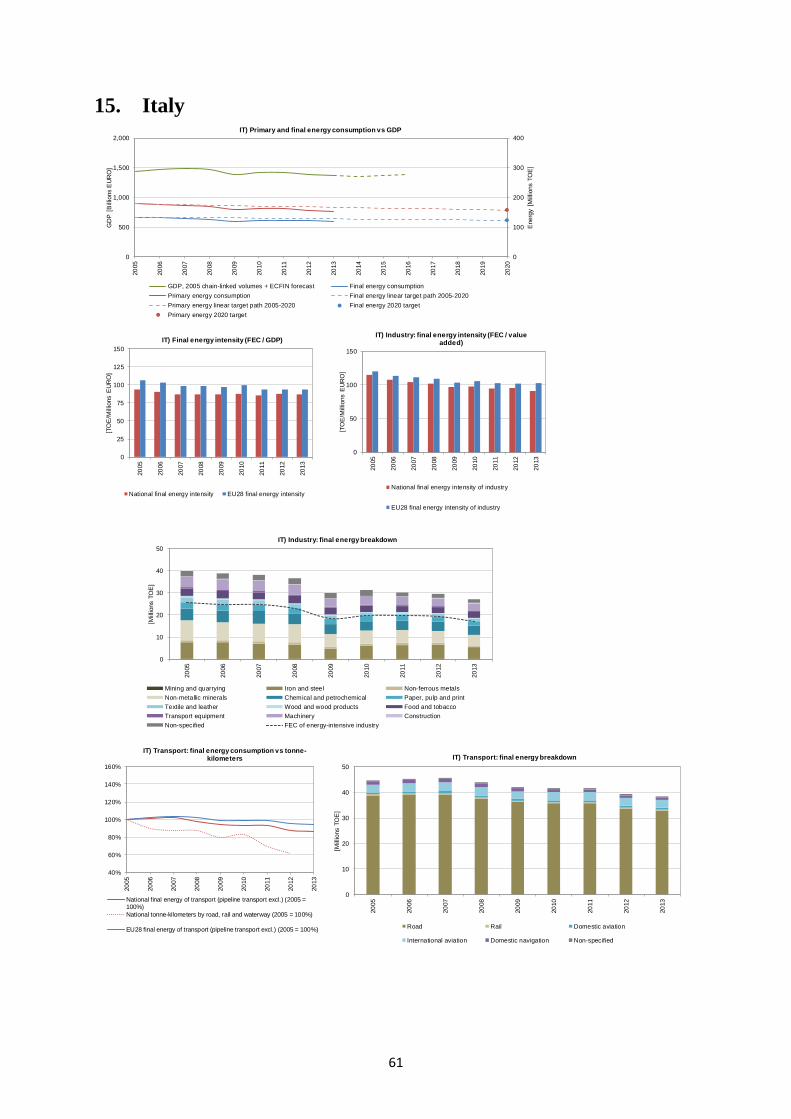
15. Italy
0
10
20
30
40
50
20
05
20
06
20
07
20
08
20
09
20
10
20
11
20
12
20
13
[Mill
ions T
OE
]
IT) Industry: final energy breakdown
Mining and quarrying Iron and steel Non-ferrous metals
Non-metallic minerals Chemical and petrochemical Paper, pulp and print
Textile and leather Wood and wood products Food and tobacco
Transport equipment Machinery Construction
Non-specified FEC of energy-intensive industry
40%
60%
80%
100%
120%
140%
160%
20
05
20
06
20
07
20
08
20
09
20
10
20
11
20
12
20
13
IT) Transport: final energy consumption vs tonne-kilometers
National final energy of transport (pipeline transport excl.) (2005 =100%)
National tonne-kilometers by road, rail and waterway (2005 = 100%)
EU28 final energy of transport (pipeline transport excl.) (2005 = 100%)
0
10
20
30
40
50
20
05
20
06
20
07
20
08
20
09
20
10
20
11
20
12
20
13
[Mill
ions T
OE
]
IT) Transport: final energy breakdown
Road Rail Domestic aviation
International aviation Domestic navigation Non-specified
0
100
200
300
400
0
500
1,000
1,500
2,00020
05
20
06
20
07
20
08
20
09
20
10
20
11
20
12
20
13
20
14
20
15
20
16
20
17
20
18
20
19
20
20
Energ
y [
Mill
ions T
OE
]
GD
P [
Bill
ions E
UR
O]
IT) Primary and final energy consumption vs GDP
GDP, 2005 chain-linked volumes + ECFIN forecast Final energy consumption
Primary energy consumption Final energy linear target path 2005-2020
Primary energy linear target path 2005-2020 Final energy 2020 target
Primary energy 2020 target
0
25
50
75
100
125
150
20
05
20
06
20
07
20
08
20
09
20
10
20
11
20
12
20
13
[TO
E/M
illio
ns E
UR
O]
IT) Final energy intensity (FEC / GDP)
National final energy intensity EU28 final energy intensity
0
50
100
150
20
05
20
06
20
07
20
08
20
09
20
10
20
11
20
12
20
13
[TO
E/M
illio
ns E
UR
O]
IT) Industry: final energy intensity (FEC / value added)
National final energy intensity of industry
EU28 final energy intensity of industry

62
60%
80%
100%
120%
140%20
05
20
06
20
07
20
08
20
09
20
10
20
11
20
12
20
13
IT) Residential: final energy consumption, HDD normalized vs disposable income of households
National final energy, HDD normalized (2005 = 100%)
National disposable income of households (2005 = 100%)
EU28 final energy, HDD normalized (2005 = 100%)
EU28 disposable income of households (2005 = 100%)
0
10
20
30
40
50
60
70
20
05
20
06
20
07
20
08
20
09
20
10
20
11
20
12
20
13
[Mill
ions T
OE
]
IT) Energy generation from thermal power and CHP
Electricity from thermal power (CHP included)
Electricity from CHP
Heat from thermal power (CHP included)
Heat from CHP
Input to thermal power (CHP included)
0
5
10
15
20
25
20
05
20
06
20
07
20
08
20
09
20
10
20
11
20
12
20
13
[Mill
ions T
OE
]
IT) Electricity generation breakdown
Nuclear power stations (CHP excluded)
Autoproducer conventional thermal power stations (CHP excluded)
Main activity conventional thermal power stations (CHP exluded)
Autoproducer CHP
Main activity CHP
0
100
200
300
400
20
05
20
06
20
07
20
08
20
09
20
10
20
11
20
12
20
13
[TO
E/M
illio
ns o
f P
ers
ons/H
DD
]
IT) Residential: final energy consumption per capita, HDD normalized
National final energy per capita, HDD normalized
EU28 final energy per capita, HDD normalized
0
50
100
150
200
20
05
20
06
20
07
20
08
20
09
20
10
20
11
20
12
20
13
[TO
E/M
illio
ns o
f P
ers
ons/H
DD
]
IT) Services: final energy consumption per capita, HDD normalized
National final energy per capita, HDD normalized
EU28 final energy per capita, HDD normalized
60%
80%
100%
120%
140%
20
05
20
06
20
07
20
08
20
09
20
10
20
11
20
12
20
13
IT) Services: final energy intensity (FEC / value added), HDD normalized
National final energy intensity, HDD normalized (2005 = 100%)
EU28 final energy intensity, HDD normalized (2005 = 100%)

63
16. Latvia
0.0
0.2
0.4
0.6
0.8
1.0
20
05
20
06
20
07
20
08
20
09
20
10
20
11
20
12
20
13
[Mill
ions T
OE
]
LV) Industry: final energy breakdown
Mining and quarrying Iron and steel Non-ferrous metals
Non-metallic minerals Chemical and petrochemical Paper, pulp and print
Textile and leather Wood and wood products Food and tobacco
Transport equipment Machinery Construction
Non-specified FEC of energy-intensive industry
60%
80%
100%
120%
140%
20
05
20
06
20
07
20
08
20
09
20
10
20
11
20
12
20
13
LV) Transport: final energy consumption vs passenger-kilometers and tonne-kilometers
National final energy of transport (pipeline transport excl.) (2005 =100%)
National passenger-kilometers by road and rail (2005 = 100%)
National tonne-kilometers by road, rail and waterway (2005 = 100%)
0.0
0.5
1.0
1.5
20
05
20
06
20
07
20
08
20
09
20
10
20
11
20
12
20
13
[Mill
ions T
OE
]
LV) Transport: final energy breakdown
Road Rail Domestic aviation
International aviation Domestic navigation Non-specified
0
3
6
9
12
0
5
10
15
2020
05
20
06
20
07
20
08
20
09
20
10
20
11
20
12
20
13
20
14
20
15
20
16
20
17
20
18
20
19
20
20
Energ
y [
Mill
ions T
OE
]
GD
P [
Bill
ions E
UR
O]
LV) Primary and final energy consumption vs GDP
GDP, 2005 chain-linked volumes + ECFIN forecast Final energy consumption
Primary energy consumption Final energy linear target path 2005-2020
Primary energy linear target path 2005-2020 Final energy 2020 target
Primary energy 2020 target
0
50
100
150
200
250
300
350
20
05
20
06
20
07
20
08
20
09
20
10
20
11
20
12
20
13
[TO
E/M
illio
ns E
UR
O]
LV) Final energy intensity (FEC / GDP)
National final energy intensity EU28 final energy intensity
0
50
100
150
200
250
300
350
20
05
20
06
20
07
20
08
20
09
20
10
20
11
20
12
20
13
[TO
E/M
illio
ns E
UR
O]
LV) Industry: final energy intensity (FEC / value added)
National final energy intensity of industry
EU28 final energy intensity of industry

64
0%
20%
40%
60%
80%
100%
120%
140%
160%
180%
200%20
05
20
06
20
07
20
08
20
09
20
10
20
11
20
12
20
13
LV) Residential: final energy consumption, HDD normalized vs disposable income of households
National final energy, HDD normalized (2005 = 100%)
National disposable income of households (2005 = 100%)
EU28 final energy, HDD normalized (2005 = 100%)
EU28 disposable income of households (2005 = 100%)
0.0
0.5
1.0
1.5
20
05
20
06
20
07
20
08
20
09
20
10
20
11
20
12
20
13
[Mill
ions T
OE
]
LV) Energy generation from thermal power and CHP
Electricity from thermal power (CHP included)
Electricity from CHP
Heat from thermal power (CHP included)
Heat from CHP
Input to thermal power (CHP included)
0.0
0.1
0.2
0.3
20
05
20
06
20
07
20
08
20
09
20
10
20
11
20
12
20
13
[Mill
ions T
OE
]
LV) Electricity generation breakdown
Nuclear power stations (CHP excluded)
Autoproducer conventional thermal power stations (CHP excluded)
Main activity conventional thermal power stations (CHP exluded)
Autoproducer CHP
Main activity CHP
0
100
200
300
20
05
20
06
20
07
20
08
20
09
20
10
20
11
20
12
20
13
[TO
E/M
illio
ns o
f P
ers
ons/H
DD
]
LV) Residential: final energy consumption per capita, HDD normalized
National final energy per capita, HDD normalized
EU28 final energy per capita, HDD normalized
0
50
100
150
20
05
20
06
20
07
20
08
20
09
20
10
20
11
20
12
20
13
[TO
E/M
illio
ns o
f P
ers
ons/H
DD
]LV) Services: final energy consumption per capita,
HDD normalized
National final energy per capita, HDD normalized
EU28 final energy per capita, HDD normalized
60%
80%
100%
120%
140%
20
05
20
06
20
07
20
08
20
09
20
10
20
11
20
12
20
13
LV) Services: final energy intensity (FEC / value added), HDD normalized
National final energy intensity, HDD normalized (2005 = 100%)
EU28 final energy intensity, HDD normalized (2005 = 100%)

65
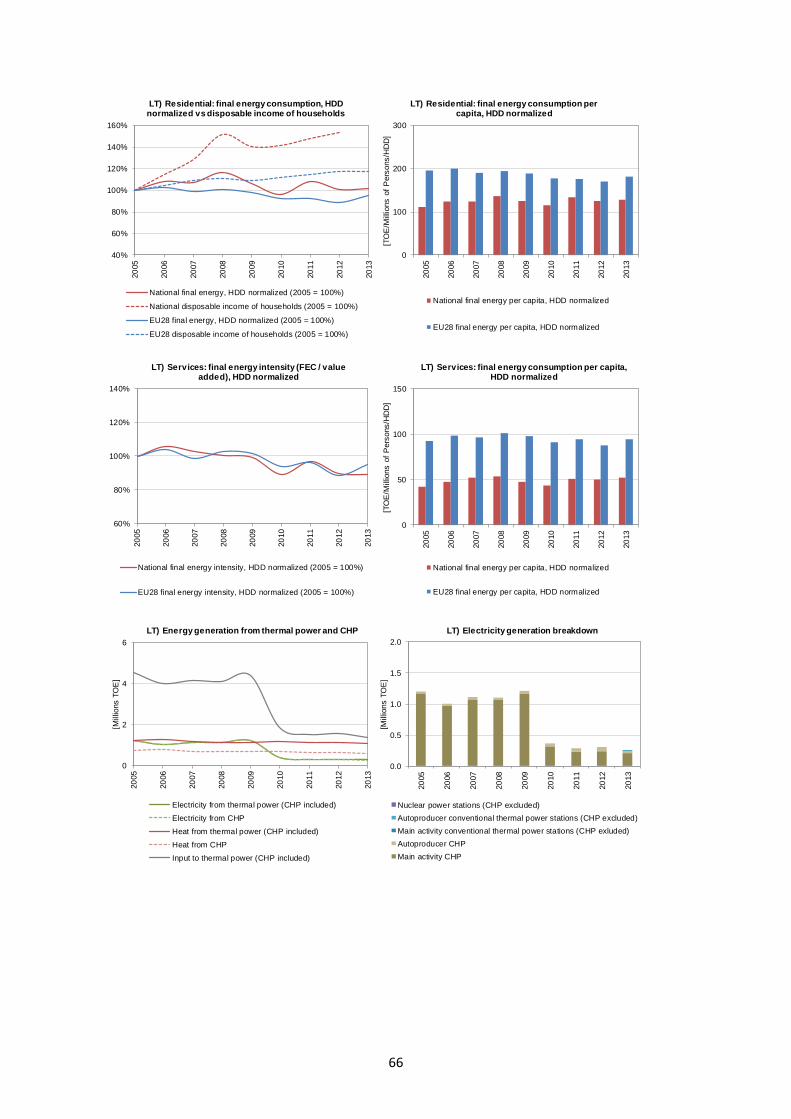
17. Lithuania
0.0
0.2
0.4
0.6
0.8
1.0
1.2
20
05
20
06
20
07
20
08
20
09
20
10
20
11
20
12
20
13
[Mill
ions T
OE
]
LT) Industry: final energy breakdown
Mining and quarrying Iron and steel Non-ferrous metals
Non-metallic minerals Chemical and petrochemical Paper, pulp and print
Textile and leather Wood and wood products Food and tobacco
Transport equipment Machinery Construction
Non-specified FEC of energy-intensive industry
60%
80%
100%
120%
140%
20
05
20
06
20
07
20
08
20
09
20
10
20
11
20
12
20
13
LT) Transport: final energy consumption vs tonne-kilometers
National final energy of transport (pipeline transport excl.) (2005 =100%)
National tonne-kilometers by road, rail and waterway (2005 = 100%)
EU28 final energy of transport (pipeline transport excl.) (2005 = 100%)
0.0
0.5
1.0
1.5
2.0
20
05
20
06
20
07
20
08
20
09
20
10
20
11
20
12
20
13
[Mill
ions T
OE
]
LT) Transport: final energy breakdown
Road Rail Domestic aviation
International aviation Domestic navigation Non-specified
0
2
4
6
8
10
12
0
5
10
15
20
25
30
20
05
20
06
20
07
20
08
20
09
20
10
20
11
20
12
20
13
20
14
20
15
20
16
20
17
20
18
20
19
20
20
Energ
y [
Mill
ions T
OE
]
GD
P [
Bill
ions E
UR
O]
LT) Primary and final energy consumption vs GDP
GDP, 2005 chain-linked volumes + ECFIN forecast Final energy consumption
Primary energy consumption Final energy linear target path 2005-2020
Primary energy linear target path 2005-2020 Final energy 2020 target
Primary energy 2020 target
0
50
100
150
200
250
20
05
20
06
20
07
20
08
20
09
20
10
20
11
20
12
20
13
[TO
E/M
illio
ns E
UR
O]
LT) Final energy intensity (FEC / GDP)
National final energy intensity EU28 final energy intensity
0
50
100
150
20020
05
20
06
20
07
20
08
20
09
20
10
20
11
20
12
20
13
[TO
E/M
illio
ns E
UR
O]
LT) Industry: final energy intensity (FEC / value added)
National final energy intensity of industry
EU28 final energy intensity of industry
66
40%
60%
80%
100%
120%
140%
160%20
05
20
06
20
07
20
08
20
09
20
10
20
11
20
12
20
13
LT) Residential: final energy consumption, HDD normalized vs disposable income of households
National final energy, HDD normalized (2005 = 100%)
National disposable income of households (2005 = 100%)
EU28 final energy, HDD normalized (2005 = 100%)
EU28 disposable income of households (2005 = 100%)
0
2
4
6
20
05
20
06
20
07
20
08
20
09
20
10
20
11
20
12
20
13
[Mill
ions T
OE
]
LT) Energy generation from thermal power and CHP
Electricity from thermal power (CHP included)
Electricity from CHP
Heat from thermal power (CHP included)
Heat from CHP
Input to thermal power (CHP included)
0.0
0.5
1.0
1.5
2.0
20
05
20
06
20
07
20
08
20
09
20
10
20
11
20
12
20
13
[Mill
ions T
OE
]
LT) Electricity generation breakdown
Nuclear power stations (CHP excluded)
Autoproducer conventional thermal power stations (CHP excluded)
Main activity conventional thermal power stations (CHP exluded)
Autoproducer CHP
Main activity CHP
0
100
200
300
20
05
20
06
20
07
20
08
20
09
20
10
20
11
20
12
20
13
[TO
E/M
illio
ns o
f P
ers
ons/H
DD
]
LT) Residential: final energy consumption per capita, HDD normalized
National final energy per capita, HDD normalized
EU28 final energy per capita, HDD normalized
0
50
100
150
20
05
20
06
20
07
20
08
20
09
20
10
20
11
20
12
20
13
[TO
E/M
illio
ns o
f P
ers
ons/H
DD
]
LT) Services: final energy consumption per capita, HDD normalized
National final energy per capita, HDD normalized
EU28 final energy per capita, HDD normalized
60%
80%
100%
120%
140%
20
05
20
06
20
07
20
08
20
09
20
10
20
11
20
12
20
13
LT) Services: final energy intensity (FEC / value added), HDD normalized
National final energy intensity, HDD normalized (2005 = 100%)
EU28 final energy intensity, HDD normalized (2005 = 100%)

67
18. Luxembourg
0.0
0.2
0.4
0.6
0.8
1.0
20
05
20
06
20
07
20
08
20
09
20
10
20
11
20
12
20
13
[Mill
ions T
OE
]
LU) Industry: final energy breakdown
Mining and quarrying Iron and steel Non-ferrous metals
Non-metallic minerals Chemical and petrochemical Paper, pulp and print
Textile and leather Wood and wood products Food and tobacco
Transport equipment Machinery Construction
Non-specified FEC of energy-intensive industry
80%
100%
120%
20
05
20
06
20
07
20
08
20
09
20
10
20
11
20
12
20
13
LU) Transport: final energy consumption vs tonne-kilometers
National final energy of transport (pipeline transport excl.) (2005 =100%)
National tonne-kilometers by road, rail and waterway (2005 = 100%)
EU28 final energy of transport (pipeline transport excl.) (2005 = 100%)
0.0
0.5
1.0
1.5
2.0
2.5
3.0
20
05
20
06
20
07
20
08
20
09
20
10
20
11
20
12
20
13
[Mill
ions T
OE
]
LU) Transport: final energy breakdown
Road Rail Domestic aviation
International aviation Domestic navigation Non-specified
0
2
4
6
8
10
0
10
20
30
40
5020
05
20
06
20
07
20
08
20
09
20
10
20
11
20
12
20
13
20
14
20
15
20
16
20
17
20
18
20
19
20
20
Energ
y [
Mill
ions T
OE
]
GD
P [
Bill
ions E
UR
O]
LU) Primary and final energy consumption vs GDP
GDP, 2005 chain-linked volumes + ECFIN forecast Final energy consumption
Primary energy consumption Final energy linear target path 2005-2020
Primary energy linear target path 2005-2020 Final energy 2020 target
Primary energy 2020 target
0
25
50
75
100
125
150
175
20
05
20
06
20
07
20
08
20
09
20
10
20
11
20
12
20
13
[TO
E/M
illio
ns E
UR
O]
LU) Final energy intensity (FEC / GDP)
National final energy intensity EU28 final energy intensity
0
50
100
150
200
250
20
05
20
06
20
07
20
08
20
09
20
10
20
11
20
12
20
13
[TO
E/M
illio
ns E
UR
O]
LU) Industry: final energy intensity (FEC / value added)
National final energy intensity of industry
EU28 final energy intensity of industry

68
60%
80%
100%
120%
140%20
05
20
06
20
07
20
08
20
09
20
10
20
11
20
12
20
13
LU) Residential: final energy consumption, HDD normalized vs disposable income of households
National final energy, HDD normalized (2005 = 100%)
National disposable income of households (2005 = 100%)
EU28 final energy, HDD normalized (2005 = 100%)
EU28 disposable income of households (2005 = 100%)
0.0
0.2
0.4
0.6
0.8
20
05
20
06
20
07
20
08
20
09
20
10
20
11
20
12
20
13
[Mill
ions T
OE
]
LU) Energy generation from thermal power and CHP
Electricity from thermal power (CHP included)
Electricity from CHP
Heat from thermal power (CHP included)
Heat from CHP
Input to thermal power (CHP included)
0.0
0.1
0.2
0.3
0.4
20
05
20
06
20
07
20
08
20
09
20
10
20
11
20
12
20
13
[Mill
ions T
OE
]
LU) Electricity generation breakdown
Nuclear power stations (CHP excluded)
Autoproducer conventional thermal power stations (CHP excluded)
Main activity conventional thermal power stations (CHP exluded)
Autoproducer CHP
Main activity CHP
0
100
200
300
400
500
20
05
20
06
20
07
20
08
20
09
20
10
20
11
20
12
20
13
[TO
E/M
illio
ns o
f P
ers
ons/H
DD
]
LU) Residential: final energy consumption per capita, HDD normalized
National final energy per capita, HDD normalized
EU28 final energy per capita, HDD normalized
0
50
100
150
200
250
300
350
400
20
05
20
06
20
07
20
08
20
09
20
10
20
11
20
12
20
13
[TO
E/M
illio
ns o
f P
ers
ons/H
DD
]
LU) Services: final energy consumption per capita, HDD normalized
National final energy per capita, HDD normalized
EU28 final energy per capita, HDD normalized
60%
80%
100%
120%
140%
20
05
20
06
20
07
20
08
20
09
20
10
20
11
20
12
20
13
LU) Services: final energy intensity (FEC / value added), HDD normalized
National final energy intensity, HDD normalized (2005 = 100%)
EU28 final energy intensity, HDD normalized (2005 = 100%)

69
19. Malta
0.00
0.02
0.04
0.06
0.08
0.10
20
05
20
06
20
07
20
08
20
09
20
10
20
11
20
12
20
13
[Mill
ions T
OE
]
MT) Industry: final energy breakdown
Mining and quarrying Iron and steel Non-ferrous metals
Non-metallic minerals Chemical and petrochemical Paper, pulp and print
Textile and leather Wood and wood products Food and tobacco
Transport equipment Machinery Construction
Non-specified FEC of energy-intensive industry
40%
60%
80%
100%
120%
140%
160%
20
05
20
06
20
07
20
08
20
09
20
10
20
11
20
12
20
13
MT) Transport: final energy consumption
National final energy of transport (pipeline transport excl.) (2005 = 100%)
EU28 final energy of transport (pipeline transport excl.) (2005 = 100%)
0.0
0.1
0.2
0.3
0.4
0.5
20
05
20
06
20
07
20
08
20
09
20
10
20
11
20
12
20
13
[Mill
ions T
OE
]
MT) Transport: final energy breakdown
Road Rail Domestic aviation
International aviation Domestic navigation Non-specified
0
1
2
3
4
0
2
4
6
8
20
05
20
06
20
07
20
08
20
09
20
10
20
11
20
12
20
13
20
14
20
15
20
16
20
17
20
18
20
19
20
20
Energ
y [
Mill
ions T
OE
]
GD
P [
Bill
ions E
UR
O]
MT) Primary and final energy consumption vs GDP
GDP, 2005 chain-linked volumes + ECFIN forecast Final energy consumption
Primary energy consumption Final energy linear target path 2005-2020
Primary energy linear target path 2005-2020 Final energy 2020 target
Primary energy 2020 target
0
25
50
75
100
125
150
20
05
20
06
20
07
20
08
20
09
20
10
20
11
20
12
20
13
[TO
E/M
illio
ns E
UR
O]
MT) Final energy intensity (FEC / GDP)
National final energy intensity EU28 final energy intensity

70
0%
20%
40%
60%
80%
100%
120%
140%
160%
180%
200%
220%
240%
20
05
20
06
20
07
20
08
20
09
20
10
20
11
20
12
20
13
MT) Residential: final energy consumption, HDD normalized
National final energy, HDD normalized (2005 = 100%)
EU28 final energy, HDD normalized (2005 = 100%)
0.0
0.2
0.4
0.6
0.8
20
05
20
06
20
07
20
08
20
09
20
10
20
11
20
12
20
13
[Millions T
OE
]
MT) Energy generation from thermal power and CHP
Electricity from thermal power (CHP included)
Electricity from CHP
Heat from thermal power (CHP included)
Heat from CHP
Input to thermal power (CHP included)
0.0
0.1
0.2
0.3
20
05
20
06
20
07
20
08
20
09
20
10
20
11
20
12
20
13
[Millions T
OE
]
MT) Electricity generation breakdown
Nuclear power stations (CHP excluded)
Autoproducer conventional thermal power stations (CHP excluded)
Main activity conventional thermal power stations (CHP exluded)
Autoproducer CHP
Main activity CHP
0
100
200
300
400
500
600
700
20
05
20
06
20
07
20
08
20
09
20
10
20
11
20
12
20
13
[TO
E/M
illions o
f P
ers
ons/H
DD
]
MT) Residential: final energy consumption per capita, HDD normalized
National final energy per capita, HDD normalized
EU28 final energy per capita, HDD normalized
0
50
100
150
200
250
300
350
400
450
500
20
05
20
06
20
07
20
08
20
09
20
10
20
11
20
12
20
13
[TO
E/M
illions o
f P
ers
ons/H
DD
]
MT) Services: final energy consumption per capita, HDD normalized
National final energy per capita, HDD normalized
EU28 final energy per capita, HDD normalized

71
20. Netherlands
0
5
10
15
20
20
05
20
06
20
07
20
08
20
09
20
10
20
11
20
12
20
13
[Mill
ions T
OE
]
NL) Industry: final energy breakdown
Mining and quarrying Iron and steel Non-ferrous metals
Non-metallic minerals Chemical and petrochemical Paper, pulp and print
Textile and leather Wood and wood products Food and tobacco
Transport equipment Machinery Construction
Non-specified FEC of energy-intensive industry
80%
100%
120%
20
05
20
06
20
07
20
08
20
09
20
10
20
11
20
12
20
13
NL) Transport: final energy consumption vs tonne-kilometers
National final energy of transport (pipeline transport excl.) (2005 =100%)
National tonne-kilometers by road, rail and waterway (2005 = 100%)
EU28 final energy of transport (pipeline transport excl.) (2005 = 100%)
0
5
10
15
20
20
05
20
06
20
07
20
08
20
09
20
10
20
11
20
12
20
13
[Mill
ions T
OE
]
NL) Transport: final energy breakdown
Road Rail Domestic aviation
International aviation Domestic navigation Non-specified
0
50
100
150
200
0
200
400
600
80020
05
20
06
20
07
20
08
20
09
20
10
20
11
20
12
20
13
20
14
20
15
20
16
20
17
20
18
20
19
20
20
Energ
y [
Mill
ions T
OE
]
GD
P [
Bill
ions E
UR
O]
NL) Primary and final energy consumption vs GDP
GDP, 2005 chain-linked volumes + ECFIN forecast Final energy consumption
Primary energy consumption Final energy linear target path 2005-2020
Primary energy linear target path 2005-2020 Final energy 2020 target
Primary energy 2020 target
0
25
50
75
100
125
150
20
05
20
06
20
07
20
08
20
09
20
10
20
11
20
12
20
13
[TO
E/M
illio
ns E
UR
O]
NL) Final energy intensity (FEC / GDP)
National final energy intensity EU28 final energy intensity
0
50
100
150
20
05
20
06
20
07
20
08
20
09
20
10
20
11
20
12
20
13
[TO
E/M
illio
ns E
UR
O]
NL) Industry: final energy intensity (FEC / value added)
National final energy intensity of industry
EU28 final energy intensity of industry

72
60%
80%
100%
120%
140%20
05
20
06
20
07
20
08
20
09
20
10
20
11
20
12
20
13
NL) Residential: final energy consumption, HDD normalized vs disposable income of households
National final energy, HDD normalized (2005 = 100%)
National disposable income of households (2005 = 100%)
EU28 final energy, HDD normalized (2005 = 100%)
EU28 disposable income of households (2005 = 100%)
0
5
10
15
20
25
20
05
20
06
20
07
20
08
20
09
20
10
20
11
20
12
20
13
[Mill
ions T
OE
]
NL) Energy generation from thermal power and CHP
Electricity from thermal power (CHP included)
Electricity from CHP
Heat from thermal power (CHP included)
Heat from CHP
Input to thermal power (CHP included)
0
3
6
9
12
20
05
20
06
20
07
20
08
20
09
20
10
20
11
20
12
20
13
[Mill
ions T
OE
]
NL) Electricity generation breakdown
Nuclear power stations (CHP excluded)
Autoproducer conventional thermal power stations (CHP excluded)
Main activity conventional thermal power stations (CHP exluded)
Autoproducer CHP
Main activity CHP
0
100
200
300
20
05
20
06
20
07
20
08
20
09
20
10
20
11
20
12
20
13
[TO
E/M
illio
ns o
f P
ers
ons/H
DD
]
NL) Residential: final energy consumption per capita, HDD normalized
National final energy per capita, HDD normalized
EU28 final energy per capita, HDD normalized
0
50
100
150
200
250
20
05
20
06
20
07
20
08
20
09
20
10
20
11
20
12
20
13
[TO
E/M
illio
ns o
f P
ers
ons/H
DD
]NL) Services: final energy consumption per capita,
HDD normalized
National final energy per capita, HDD normalized
EU28 final energy per capita, HDD normalized
60%
80%
100%
120%
140%
20
05
20
06
20
07
20
08
20
09
20
10
20
11
20
12
20
13
NL) Services: final energy intensity (FEC / value added), HDD normalized
National final energy intensity, HDD normalized (2005 = 100%)
EU28 final energy intensity, HDD normalized (2005 = 100%)

73
21. Poland
0
5
10
15
20
20
05
20
06
20
07
20
08
20
09
20
10
20
11
20
12
20
13
[Mill
ions T
OE
]
PL) Industry: final energy breakdown
Mining and quarrying Iron and steel Non-ferrous metals
Non-metallic minerals Chemical and petrochemical Paper, pulp and print
Textile and leather Wood and wood products Food and tobacco
Transport equipment Machinery Construction
Non-specified FEC of energy-intensive industry
0%
20%
40%
60%
80%
100%
120%
140%
160%
180%
200%
20
05
20
06
20
07
20
08
20
09
20
10
20
11
20
12
20
13
PL) Transport: final energy consumption vs passenger-kilometers and tonne-kilometers
National final energy of transport (pipeline transport excl.) (2005 =100%)
National passenger-kilometers by road and rail (2005 = 100%)
National tonne-kilometers by road, rail and waterway (2005 = 100%)
0
5
10
15
20
20
05
20
06
20
07
20
08
20
09
20
10
20
11
20
12
20
13
[Mill
ions T
OE
]
PL) Transport: final energy breakdown
Road Rail Domestic aviation
International aviation Domestic navigation Non-specified
0
50
100
150
200
0
100
200
300
40020
05
20
06
20
07
20
08
20
09
20
10
20
11
20
12
20
13
20
14
20
15
20
16
20
17
20
18
20
19
20
20
Energ
y [
Mill
ions T
OE
]
GD
P [
Bill
ions E
UR
O]
PL) Primary and final energy consumption vs GDP
GDP, 2005 chain-linked volumes + ECFIN forecast Final energy consumption
Primary energy consumption Final energy linear target path 2005-2020
Primary energy linear target path 2005-2020 Final energy 2020 target
Primary energy 2020 target
0
50
100
150
200
250
300
20
05
20
06
20
07
20
08
20
09
20
10
20
11
20
12
20
13
[TO
E/M
illio
ns E
UR
O]
PL) Final energy intensity (FEC / GDP)
National final energy intensity EU28 final energy intensity
0
50
100
150
200
250
20
05
20
06
20
07
20
08
20
09
20
10
20
11
20
12
20
13
[TO
E/M
illio
ns E
UR
O]
PL) Industry: final energy intensity (FEC / value added)
National final energy intensity of industry
EU28 final energy intensity of industry

74
40%
60%
80%
100%
120%
140%
160%20
05
20
06
20
07
20
08
20
09
20
10
20
11
20
12
20
13
PL) Residential: final energy consumption, HDD normalized vs disposable income of households
National final energy, HDD normalized (2005 = 100%)
National disposable income of households (2005 = 100%)
EU28 final energy, HDD normalized (2005 = 100%)
EU28 disposable income of households (2005 = 100%)
0
10
20
30
40
50
20
05
20
06
20
07
20
08
20
09
20
10
20
11
20
12
20
13
[Mill
ions T
OE
]
PL) Energy generation from thermal power and CHP
Electricity from thermal power (CHP included)
Electricity from CHP
Heat from thermal power (CHP included)
Heat from CHP
Input to thermal power (CHP included)
0
3
6
9
12
15
20
05
20
06
20
07
20
08
20
09
20
10
20
11
20
12
20
13
[Mill
ions T
OE
]
PL) Electricity generation breakdown
Nuclear power stations (CHP excluded)
Autoproducer conventional thermal power stations (CHP excluded)
Main activity conventional thermal power stations (CHP exluded)
Autoproducer CHP
Main activity CHP
0
100
200
300
20
05
20
06
20
07
20
08
20
09
20
10
20
11
20
12
20
13
[TO
E/M
illio
ns o
f P
ers
ons/H
DD
]
PL) Residential: final energy consumption per capita, HDD normalized
National final energy per capita, HDD normalized
EU28 final energy per capita, HDD normalized
0
50
100
150
20
05
20
06
20
07
20
08
20
09
20
10
20
11
20
12
20
13
[TO
E/M
illio
ns o
f P
ers
ons/H
DD
]
PL) Services: final energy consumption per capita, HDD normalized
National final energy per capita, HDD normalized
EU28 final energy per capita, HDD normalized
60%
80%
100%
120%
140%
20
05
20
06
20
07
20
08
20
09
20
10
20
11
20
12
20
13
PL) Services: final energy intensity (FEC / value added), HDD normalized
National final energy intensity, HDD normalized (2005 = 100%)
EU28 final energy intensity, HDD normalized (2005 = 100%)

75
22. Portugal
0
2
4
6
20
05
20
06
20
07
20
08
20
09
20
10
20
11
20
12
20
13
[Mill
ions T
OE
]
PT) Industry: final energy breakdown
Mining and quarrying Iron and steel Non-ferrous metals
Non-metallic minerals Chemical and petrochemical Paper, pulp and print
Textile and leather Wood and wood products Food and tobacco
Transport equipment Machinery Construction
Non-specified FEC of energy-intensive industry
60%
80%
100%
120%
140%
20
05
20
06
20
07
20
08
20
09
20
10
20
11
20
12
20
13
PT) Transport: final energy consumption vs tonne-kilometers
National final energy of transport (pipeline transport excl.) (2005 =100%)
National tonne-kilometers by road, rail and waterway (2005 = 100%)
EU28 final energy of transport (pipeline transport excl.) (2005 = 100%)
0
2
4
6
8
20
05
20
06
20
07
20
08
20
09
20
10
20
11
20
12
20
13
[Mill
ions T
OE
]
PT) Transport: final energy breakdown
Road Rail Domestic aviation
International aviation Domestic navigation Non-specified
0
10
20
30
40
0
50
100
150
200
20
05
20
06
20
07
20
08
20
09
20
10
20
11
20
12
20
13
20
14
20
15
20
16
20
17
20
18
20
19
20
20
Energ
y [
Mill
ions T
OE
]
GD
P [
Bill
ions E
UR
O]
PT) Primary and final energy consumption vs GDP
GDP, 2005 chain-linked volumes + ECFIN forecast Final energy consumption
Primary energy consumption Final energy linear target path 2005-2020
Primary energy linear target path 2005-2020 Final energy 2020 target
Primary energy 2020 target
0
25
50
75
100
125
150
20
05
20
06
20
07
20
08
20
09
20
10
20
11
20
12
20
13
[TO
E/M
illio
ns E
UR
O]
PT) Final energy intensity (FEC / GDP)
National final energy intensity EU28 final energy intensity
0
50
100
150
200
20
05
20
06
20
07
20
08
20
09
20
10
20
11
20
12
20
13
[TO
E/M
illio
ns E
UR
O]
PT) Industry: final energy intensity (FEC / value added)
National final energy intensity of industry
EU28 final energy intensity of industry

76
60%
80%
100%
120%
140%20
05
20
06
20
07
20
08
20
09
20
10
20
11
20
12
20
13
PT) Residential: final energy consumption, HDD normalized vs disposable income of households
National final energy, HDD normalized (2005 = 100%)
National disposable income of households (2005 = 100%)
EU28 final energy, HDD normalized (2005 = 100%)
EU28 disposable income of households (2005 = 100%)
0
2
4
6
8
10
20
05
20
06
20
07
20
08
20
09
20
10
20
11
20
12
20
13
[Mill
ions T
OE
]
PT) Energy generation from thermal power and CHP
Electricity from thermal power (CHP included)
Electricity from CHP
Heat from thermal power (CHP included)
Heat from CHP
Input to thermal power (CHP included)
0
1
2
3
4
20
05
20
06
20
07
20
08
20
09
20
10
20
11
20
12
20
13
[Mill
ions T
OE
]
PT) Electricity generation breakdown
Nuclear power stations (CHP excluded)
Autoproducer conventional thermal power stations (CHP excluded)
Main activity conventional thermal power stations (CHP exluded)
Autoproducer CHP
Main activity CHP
0
100
200
300
20
05
20
06
20
07
20
08
20
09
20
10
20
11
20
12
20
13
[TO
E/M
illio
ns o
f P
ers
ons/H
DD
]
PT) Residential: final energy consumption per capita, HDD normalized
National final energy per capita, HDD normalized
EU28 final energy per capita, HDD normalized
0
50
100
150
200
20
05
20
06
20
07
20
08
20
09
20
10
20
11
20
12
20
13
[TO
E/M
illio
ns o
f P
ers
ons/H
DD
]PT) Services: final energy consumption per capita,
HDD normalized
National final energy per capita, HDD normalized
EU28 final energy per capita, HDD normalized
60%
80%
100%
120%
140%
20
05
20
06
20
07
20
08
20
09
20
10
20
11
20
12
20
13
PT) Services: final energy intensity (FEC / value added), HDD normalized
National final energy intensity, HDD normalized (2005 = 100%)
EU28 final energy intensity, HDD normalized (2005 = 100%)

77
23. Romania
0
2
4
6
8
10
12
20
05
20
06
20
07
20
08
20
09
20
10
20
11
20
12
20
13
[Mill
ions T
OE
]
RO) Industry: final energy breakdown
Mining and quarrying Iron and steel Non-ferrous metals
Non-metallic minerals Chemical and petrochemical Paper, pulp and print
Textile and leather Wood and wood products Food and tobacco
Transport equipment Machinery Construction
Non-specified FEC of energy-intensive industry
60%
80%
100%
120%
140%
20
05
20
06
20
07
20
08
20
09
20
10
20
11
20
12
20
13
RO) Transport: final energy consumption vs passenger-kilometers
National final energy of transport (pipeline transport excl.) (2005 =100%)
National passenger-kilometers by road and rail (2005 = 100%)
EU28 final energy of transport (pipeline transport excl.) (2005 = 100%)
0
1
2
3
4
5
6
20
05
20
06
20
07
20
08
20
09
20
10
20
11
20
12
20
13
[Mill
ions T
OE
]
RO) Transport: final energy breakdown
Road Rail Domestic aviation
International aviation Domestic navigation Non-specified
0
20
40
60
80
100
0
25
50
75
100
125
20
05
20
06
20
07
20
08
20
09
20
10
20
11
20
12
20
13
20
14
20
15
20
16
20
17
20
18
20
19
20
20
Energ
y [
Mill
ions T
OE
]
GD
P [
Bill
ions E
UR
O]
RO) Primary and final energy consumption vs GDP
GDP, 2005 chain-linked volumes + ECFIN forecast Final energy consumption
Primary energy consumption Final energy linear target path 2005-2020
Primary energy linear target path 2005-2020 Final energy 2020 target
Primary energy 2020 target
0
50
100
150
200
250
300
350
20
05
20
06
20
07
20
08
20
09
20
10
20
11
20
12
20
13
[TO
E/M
illio
ns E
UR
O]
RO) Final energy intensity (FEC / GDP)
National final energy intensity EU28 final energy intensity
0
50
100
150
200
250
300
350
400
450
20
05
20
06
20
07
20
08
20
09
20
10
20
11
20
12
20
13
[TO
E/M
illio
ns E
UR
O]
RO) Industry: final energy intensity (FEC / value added)
National final energy intensity of industry
EU28 final energy intensity of industry

78
20%
40%
60%
80%
100%
120%
140%
160%
180%20
05
20
06
20
07
20
08
20
09
20
10
20
11
20
12
20
13
RO) Residential: final energy consumption, HDD normalized vs disposable income of households
National final energy, HDD normalized (2005 = 100%)
National disposable income of households (2005 = 100%)
EU28 final energy, HDD normalized (2005 = 100%)
EU28 disposable income of households (2005 = 100%)
0
3
6
9
12
15
20
05
20
06
20
07
20
08
20
09
20
10
20
11
20
12
20
13
[Mill
ions T
OE
]
RO) Energy generation from thermal power and CHP
Electricity from thermal power (CHP included)
Electricity from CHP
Heat from thermal power (CHP included)
Heat from CHP
Input to thermal power (CHP included)
0
1
2
3
4
5
20
05
20
06
20
07
20
08
20
09
20
10
20
11
20
12
20
13
[Mill
ions T
OE
]
RO) Electricity generation breakdown
Nuclear power stations (CHP excluded)
Autoproducer conventional thermal power stations (CHP excluded)
Main activity conventional thermal power stations (CHP exluded)
Autoproducer CHP
Main activity CHP
0
100
200
300
20
05
20
06
20
07
20
08
20
09
20
10
20
11
20
12
20
13
[TO
E/M
illio
ns o
f P
ers
ons/H
DD
]
RO) Residential: final energy consumption per capita, HDD normalized
National final energy per capita, HDD normalized
EU28 final energy per capita, HDD normalized
0
50
100
150
20
05
20
06
20
07
20
08
20
09
20
10
20
11
20
12
20
13
[TO
E/M
illio
ns o
f P
ers
ons/H
DD
]RO) Services: final energy consumption per capita,
HDD normalized
National final energy per capita, HDD normalized
EU28 final energy per capita, HDD normalized
60%
80%
100%
120%
140%
20
05
20
06
20
07
20
08
20
09
20
10
20
11
20
12
20
13
RO) Services: final energy intensity (FEC / value added), HDD normalized
National final energy intensity, HDD normalized (2005 = 100%)
EU28 final energy intensity, HDD normalized (2005 = 100%)

79
24. Slovakia
0
1
2
3
4
5
20
05
20
06
20
07
20
08
20
09
20
10
20
11
20
12
20
13
[Mill
ions T
OE
]
SK) Industry: final energy breakdown
Mining and quarrying Iron and steel Non-ferrous metals
Non-metallic minerals Chemical and petrochemical Paper, pulp and print
Textile and leather Wood and wood products Food and tobacco
Transport equipment Machinery Construction
Non-specified FEC of energy-intensive industry
60%
80%
100%
120%
140%
20
05
20
06
20
07
20
08
20
09
20
10
20
11
20
12
20
13
SK) Transport: final energy consumption vs passenger-kilometers and tonne-kilometers
National final energy of transport (pipeline transport excl.) (2005 =100%)
National passenger-kilometers by road and rail (2005 = 100%)
National tonne-kilometers by road, rail and waterway (2005 = 100%)
0
1
2
3
20
05
20
06
20
07
20
08
20
09
20
10
20
11
20
12
20
13
[Mill
ions T
OE
]
SK) Transport: final energy breakdown
Road Rail Domestic aviation
International aviation Domestic navigation Non-specified
0
10
20
30
40
50
60
0
10
20
30
40
50
60
20
05
20
06
20
07
20
08
20
09
20
10
20
11
20
12
20
13
20
14
20
15
20
16
20
17
20
18
20
19
20
20
Energ
y [
Mill
ions T
OE
]
GD
P [
Bill
ions E
UR
O]
SK) Primary and final energy consumption vs GDP
GDP, 2005 chain-linked volumes + ECFIN forecast Final energy consumption
Primary energy consumption Final energy linear target path 2005-2020
Primary energy linear target path 2005-2020 Final energy 2020 target
Primary energy 2020 target
0
50
100
150
200
250
300
350
20
05
20
06
20
07
20
08
20
09
20
10
20
11
20
12
20
13
[TO
E/M
illio
ns E
UR
O]
SK) Final energy intensity (FEC / GDP)
National final energy intensity EU28 final energy intensity
0
50
100
150
200
250
300
350
400
20
05
20
06
20
07
20
08
20
09
20
10
20
11
20
12
20
13
[TO
E/M
illio
ns E
UR
O]
SK) Industry: final energy intensity (FEC / value added)
National final energy intensity of industry
EU28 final energy intensity of industry

80
0%
20%
40%
60%
80%
100%
120%
140%
160%
180%
200%20
05
20
06
20
07
20
08
20
09
20
10
20
11
20
12
20
13
SK) Residential: final energy consumption, HDD normalized vs disposable income of households
National final energy, HDD normalized (2005 = 100%)
National disposable income of households (2005 = 100%)
EU28 final energy, HDD normalized (2005 = 100%)
EU28 disposable income of households (2005 = 100%)
0
2
4
6
8
10
20
05
20
06
20
07
20
08
20
09
20
10
20
11
20
12
20
13
[Mill
ions T
OE
]
SK) Energy generation from thermal power and CHP
Electricity from thermal power (CHP included)
Electricity from CHP
Heat from thermal power (CHP included)
Heat from CHP
Input to thermal power (CHP included)
0
1
2
3
20
05
20
06
20
07
20
08
20
09
20
10
20
11
20
12
20
13
[Mill
ions T
OE
]
SK) Electricity generation breakdown
Nuclear power stations (CHP excluded)
Autoproducer conventional thermal power stations (CHP excluded)
Main activity conventional thermal power stations (CHP exluded)
Autoproducer CHP
Main activity CHP
0
100
200
300
20
05
20
06
20
07
20
08
20
09
20
10
20
11
20
12
20
13
[TO
E/M
illio
ns o
f P
ers
ons/H
DD
]
SK) Residential: final energy consumption per capita, HDD normalized
National final energy per capita, HDD normalized
EU28 final energy per capita, HDD normalized
0
50
100
150
20
05
20
06
20
07
20
08
20
09
20
10
20
11
20
12
20
13
[TO
E/M
illio
ns o
f P
ers
ons/H
DD
]SK) Services: final energy consumption per capita,
HDD normalized
National final energy per capita, HDD normalized
EU28 final energy per capita, HDD normalized
60%
80%
100%
120%
140%
20
05
20
06
20
07
20
08
20
09
20
10
20
11
20
12
20
13
SK) Services: final energy intensity (FEC / value added), HDD normalized
National final energy intensity, HDD normalized (2005 = 100%)
EU28 final energy intensity, HDD normalized (2005 = 100%)

81
25. Slovenia
0.0
0.5
1.0
1.5
2.0
20
05
20
06
20
07
20
08
20
09
20
10
20
11
20
12
20
13
[Mill
ions T
OE
]
SI) Industry: final energy breakdown
Mining and quarrying Iron and steel Non-ferrous metals
Non-metallic minerals Chemical and petrochemical Paper, pulp and print
Textile and leather Wood and wood products Food and tobacco
Transport equipment Machinery Construction
Non-specified FEC of energy-intensive industry
40%
60%
80%
100%
120%
140%
160%
20
05
20
06
20
07
20
08
20
09
20
10
20
11
20
12
20
13
SI) Transport: final energy consumption vs passenger-kilometers and tonne-kilometers
National final energy of transport (pipeline transport excl.) (2005 =100%)
National passenger-kilometers by road and rail (2005 = 100%)
National tonne-kilometers by road, rail and waterway (2005 = 100%)
0.0
0.5
1.0
1.5
2.0
2.5
20
05
20
06
20
07
20
08
20
09
20
10
20
11
20
12
20
13
[Mill
ions T
OE
]
SI) Transport: final energy breakdown
Road Rail Domestic aviation
International aviation Domestic navigation Non-specified
0
5
10
15
20
25
0
10
20
30
40
5020
05
20
06
20
07
20
08
20
09
20
10
20
11
20
12
20
13
20
14
20
15
20
16
20
17
20
18
20
19
20
20
Energ
y [
Mill
ions T
OE
]
GD
P [
Bill
ions E
UR
O]
SI) Primary and final energy consumption vs GDP
GDP, 2005 chain-linked volumes + ECFIN forecast Final energy consumption
Primary energy consumption Final energy linear target path 2005-2020
Primary energy linear target path 2005-2020 Final energy 2020 target
Primary energy 2020 target
0
25
50
75
100
125
150
175
200
20
05
20
06
20
07
20
08
20
09
20
10
20
11
20
12
20
13
[TO
E/M
illio
ns E
UR
O]
SI) Final energy intensity (FEC / GDP)
National final energy intensity EU28 final energy intensity
0
50
100
150
200
20
05
20
06
20
07
20
08
20
09
20
10
20
11
20
12
20
13
[TO
E/M
illio
ns E
UR
O]
SI) Industry: final energy intensity (FEC / value added)
National final energy intensity of industry
EU28 final energy intensity of industry

82
60%
80%
100%
120%
140%20
05
20
06
20
07
20
08
20
09
20
10
20
11
20
12
20
13
SI) Residential: final energy consumption, HDD normalized vs disposable income of households
National final energy, HDD normalized (2005 = 100%)
National disposable income of households (2005 = 100%)
EU28 final energy, HDD normalized (2005 = 100%)
EU28 disposable income of households (2005 = 100%)
0
1
2
3
4
20
05
20
06
20
07
20
08
20
09
20
10
20
11
20
12
20
13
[Mill
ions T
OE
]
SI) Energy generation from thermal power and CHP
Electricity from thermal power (CHP included)
Electricity from CHP
Heat from thermal power (CHP included)
Heat from CHP
Input to thermal power (CHP included)
0.0
0.5
1.0
1.5
20
05
20
06
20
07
20
08
20
09
20
10
20
11
20
12
20
13
[Mill
ions T
OE
]
SI) Electricity generation breakdown
Nuclear power stations (CHP excluded)
Autoproducer conventional thermal power stations (CHP excluded)
Main activity conventional thermal power stations (CHP exluded)
Autoproducer CHP
Main activity CHP
0
100
200
300
20
05
20
06
20
07
20
08
20
09
20
10
20
11
20
12
20
13
[TO
E/M
illio
ns o
f P
ers
ons/H
DD
]
SI) Residential: final energy consumption per capita, HDD normalized
National final energy per capita, HDD normalized
EU28 final energy per capita, HDD normalized
0
50
100
150
20
05
20
06
20
07
20
08
20
09
20
10
20
11
20
12
20
13
[TO
E/M
illio
ns o
f P
ers
ons/H
DD
]SI) Services: final energy consumption per capita,
HDD normalized
National final energy per capita, HDD normalized
EU28 final energy per capita, HDD normalized
60%
80%
100%
120%
140%
20
05
20
06
20
07
20
08
20
09
20
10
20
11
20
12
20
13
SI) Services: final energy intensity (FEC / value added), HDD normalized
National final energy intensity, HDD normalized (2005 = 100%)
EU28 final energy intensity, HDD normalized (2005 = 100%)

83
26. Spain
0
10
20
30
40
20
05
20
06
20
07
20
08
20
09
20
10
20
11
20
12
20
13
[Mill
ions T
OE
]
ES) Industry: final energy breakdown
Mining and quarrying Iron and steel Non-ferrous metals
Non-metallic minerals Chemical and petrochemical Paper, pulp and print
Textile and leather Wood and wood products Food and tobacco
Transport equipment Machinery Construction
Non-specified FEC of energy-intensive industry
60%
80%
100%
120%
140%
20
05
20
06
20
07
20
08
20
09
20
10
20
11
20
12
20
13
ES) Transport: final energy consumption vs passenger-kilometers and tonne-kilometers
National final energy of transport (pipeline transport excl.) (2005 =100%)
National passenger-kilometers by road and rail (2005 = 100%)
National tonne-kilometers by road, rail and waterway (2005 = 100%)
0
10
20
30
40
50
20
05
20
06
20
07
20
08
20
09
20
10
20
11
20
12
20
13
[Mill
ions T
OE
]
ES) Transport: final energy breakdown
Road Rail Domestic aviation
International aviation Domestic navigation Non-specified
0
50
100
150
200
250
0
250
500
750
1,000
1,250
20
05
20
06
20
07
20
08
20
09
20
10
20
11
20
12
20
13
20
14
20
15
20
16
20
17
20
18
20
19
20
20
Energ
y [
Mill
ions T
OE
]
GD
P [
Bill
ions E
UR
O]
ES) Primary and final energy consumption vs GDP
GDP, 2005 chain-linked volumes + ECFIN forecast Final energy consumption
Primary energy consumption Final energy linear target path 2005-2020
Primary energy linear target path 2005-2020 Final energy 2020 target
Primary energy 2020 target
0
25
50
75
100
125
150
20
05
20
06
20
07
20
08
20
09
20
10
20
11
20
12
20
13
[TO
E/M
illio
ns E
UR
O]
ES) Final energy intensity (FEC / GDP)
National final energy intensity EU28 final energy intensity
0
50
100
150
20
05
20
06
20
07
20
08
20
09
20
10
20
11
20
12
20
13
[TO
E/M
illio
ns E
UR
O]
ES) Industry: final energy intensity (FEC / value added)
National final energy intensity of industry
EU28 final energy intensity of industry

84
60%
80%
100%
120%
140%20
05
20
06
20
07
20
08
20
09
20
10
20
11
20
12
20
13
ES) Residential: final energy consumption, HDD normalized vs disposable income of households
National final energy, HDD normalized (2005 = 100%)
National disposable income of households (2005 = 100%)
EU28 final energy, HDD normalized (2005 = 100%)
EU28 disposable income of households (2005 = 100%)
0
10
20
30
40
50
60
20
05
20
06
20
07
20
08
20
09
20
10
20
11
20
12
20
13
[Mill
ions T
OE
]
ES) Energy generation from thermal power and CHP
Electricity from thermal power (CHP included)
Electricity from CHP
Heat from thermal power (CHP included)
Heat from CHP
Input to thermal power (CHP included)
0
5
10
15
20
25
20
05
20
06
20
07
20
08
20
09
20
10
20
11
20
12
20
13
[Mill
ions T
OE
]
ES) Electricity generation breakdown
Nuclear power stations (CHP excluded)
Autoproducer conventional thermal power stations (CHP excluded)
Main activity conventional thermal power stations (CHP exluded)
Autoproducer CHP
Main activity CHP
0
100
200
300
20
05
20
06
20
07
20
08
20
09
20
10
20
11
20
12
20
13
[TO
E/M
illio
ns o
f P
ers
ons/H
DD
]
ES) Residential: final energy consumption per capita, HDD normalized
National final energy per capita, HDD normalized
EU28 final energy per capita, HDD normalized
0
50
100
150
20
05
20
06
20
07
20
08
20
09
20
10
20
11
20
12
20
13
[TO
E/M
illio
ns o
f P
ers
ons/H
DD
]
ES) Services: final energy consumption per capita, HDD normalized
National final energy per capita, HDD normalized
EU28 final energy per capita, HDD normalized
60%
80%
100%
120%
140%
20
05
20
06
20
07
20
08
20
09
20
10
20
11
20
12
20
13
ES) Services: final energy intensity (FEC / value added), HDD normalized
National final energy intensity, HDD normalized (2005 = 100%)
EU28 final energy intensity, HDD normalized (2005 = 100%)

85
27. Sweden
0
3
6
9
12
15
20
05
20
06
20
07
20
08
20
09
20
10
20
11
20
12
20
13
[Mill
ions T
OE
]
SE) Industry: final energy breakdown
Mining and quarrying Iron and steel Non-ferrous metals
Non-metallic minerals Chemical and petrochemical Paper, pulp and print
Textile and leather Wood and wood products Food and tobacco
Transport equipment Machinery Construction
Non-specified FEC of energy-intensive industry
80%
100%
120%
20
05
20
06
20
07
20
08
20
09
20
10
20
11
20
12
20
13
SE) Transport: final energy consumption vs passenger-kilometers and tonne-kilometers
National final energy of transport (pipeline transport excl.) (2005 =100%)
National passenger-kilometers by road and rail (2005 = 100%)
National tonne-kilometers by road, rail and waterway (2005 = 100%)
0
2
4
6
8
10
20
05
20
06
20
07
20
08
20
09
20
10
20
11
20
12
20
13
[Mill
ions T
OE
]
SE) Transport: final energy breakdown
Road Rail Domestic aviation
International aviation Domestic navigation Non-specified
0
25
50
75
100
0
100
200
300
400
20
05
20
06
20
07
20
08
20
09
20
10
20
11
20
12
20
13
20
14
20
15
20
16
20
17
20
18
20
19
20
20
Energ
y [
Mill
ions T
OE
]
GD
P [
Bill
ions E
UR
O]
SE) Primary and final energy consumption vs GDP
GDP, 2005 chain-linked volumes + ECFIN forecast Final energy consumption
Primary energy consumption Final energy linear target path 2005-2020
Primary energy linear target path 2005-2020 Final energy 2020 target
Primary energy 2020 target
0
25
50
75
100
125
150
20
05
20
06
20
07
20
08
20
09
20
10
20
11
20
12
20
13
[TO
E/M
illio
ns E
UR
O]
SE) Final energy intensity (FEC / GDP)
National final energy intensity EU28 final energy intensity
0
50
100
150
200
20
05
20
06
20
07
20
08
20
09
20
10
20
11
20
12
20
13
[TO
E/M
illio
ns E
UR
O]
SE) Industry: final energy intensity (FEC / value added)
National final energy intensity of industry
EU28 final energy intensity of industry

86
40%
60%
80%
100%
120%
140%
160%20
05
20
06
20
07
20
08
20
09
20
10
20
11
20
12
20
13
SE) Residential: final energy consumption, HDD normalized vs disposable income of households
National final energy, HDD normalized (2005 = 100%)
National disposable income of households (2005 = 100%)
EU28 final energy, HDD normalized (2005 = 100%)
EU28 disposable income of households (2005 = 100%)
0
5
10
15
20
25
30
20
05
20
06
20
07
20
08
20
09
20
10
20
11
20
12
20
13
[Mill
ions T
OE
]
SE) Energy generation from thermal power and CHP
Electricity from thermal power (CHP included)
Electricity from CHP
Heat from thermal power (CHP included)
Heat from CHP
Input to thermal power (CHP included)
0
2
4
6
8
20
05
20
06
20
07
20
08
20
09
20
10
20
11
20
12
20
13
[Mill
ions T
OE
]
SE) Electricity generation breakdown
Nuclear power stations (CHP excluded)
Autoproducer conventional thermal power stations (CHP excluded)
Main activity conventional thermal power stations (CHP exluded)
Autoproducer CHP
Main activity CHP
0
100
200
300
20
05
20
06
20
07
20
08
20
09
20
10
20
11
20
12
20
13
[TO
E/M
illio
ns o
f P
ers
ons/H
DD
]
SE) Residential: final energy consumption per capita, HDD normalized
National final energy per capita, HDD normalized
EU28 final energy per capita, HDD normalized
0
50
100
150
20
05
20
06
20
07
20
08
20
09
20
10
20
11
20
12
20
13
[TO
E/M
illio
ns o
f P
ers
ons/H
DD
]SE) Services: final energy consumption per capita,
HDD normalized
National final energy per capita, HDD normalized
EU28 final energy per capita, HDD normalized
60%
80%
100%
120%
140%
20
05
20
06
20
07
20
08
20
09
20
10
20
11
20
12
20
13
SE) Services: final energy intensity (FEC / value added), HDD normalized
National final energy intensity, HDD normalized (2005 = 100%)
EU28 final energy intensity, HDD normalized (2005 = 100%)

87
28. UK
0
10
20
30
40
20
05
20
06
20
07
20
08
20
09
20
10
20
11
20
12
20
13
[Mill
ions T
OE
]
UK) Industry: final energy breakdown
Mining and quarrying Iron and steel Non-ferrous metals
Non-metallic minerals Chemical and petrochemical Paper, pulp and print
Textile and leather Wood and wood products Food and tobacco
Transport equipment Machinery Construction
Non-specified FEC of energy-intensive industry
80%
100%
120%
20
05
20
06
20
07
20
08
20
09
20
10
20
11
20
12
20
13
UK) Transport: final energy consumption vs tonne-kilometers
National final energy of transport (pipeline transport excl.) (2005 =100%)
National tonne-kilometers by road, rail and waterway (2005 = 100%)
EU28 final energy of transport (pipeline transport excl.) (2005 = 100%)
0
10
20
30
40
50
60
20
05
20
06
20
07
20
08
20
09
20
10
20
11
20
12
20
13
[Mill
ions T
OE
]
UK) Transport: final energy breakdown
Road Rail Domestic aviation
International aviation Domestic navigation Non-specified
0
100
200
300
400
500
0
500
1,000
1,500
2,000
2,50020
05
20
06
20
07
20
08
20
09
20
10
20
11
20
12
20
13
20
14
20
15
20
16
20
17
20
18
20
19
20
20
Energ
y [
Mill
ions T
OE
]
GD
P [
Bill
ions E
UR
O]
UK) Primary and final energy consumption vs GDP
GDP, 2005 chain-linked volumes + ECFIN forecast Final energy consumption
Primary energy consumption Final energy linear target path 2005-2020
Primary energy linear target path 2005-2020 Final energy 2020 target
Primary energy 2020 target
0
25
50
75
100
125
150
20
05
20
06
20
07
20
08
20
09
20
10
20
11
20
12
20
13
[TO
E/M
illio
ns E
UR
O]
UK) Final energy intensity (FEC / GDP)
National final energy intensity EU28 final energy intensity
0
50
100
150
20
05
20
06
20
07
20
08
20
09
20
10
20
11
20
12
20
13
[TO
E/M
illio
ns E
UR
O]
UK) Industry: final energy intensity (FEC / value added)
National final energy intensity of industry
EU28 final energy intensity of industry

88
60%
80%
100%
120%
140%20
05
20
06
20
07
20
08
20
09
20
10
20
11
20
12
20
13
UK) Residential: final energy consumption, HDD normalized vs disposable income of households
National final energy, HDD normalized (2005 = 100%)
National disposable income of households (2005 = 100%)
EU28 final energy, HDD normalized (2005 = 100%)
EU28 disposable income of households (2005 = 100%)
0
20
40
60
80
100
20
05
20
06
20
07
20
08
20
09
20
10
20
11
20
12
20
13
[Mill
ions T
OE
]
UK) Energy generation from thermal power and CHP
Electricity from thermal power (CHP included)
Electricity from CHP
Heat from thermal power (CHP included)
Heat from CHP
Input to thermal power (CHP included)
0
10
20
30
40
20
05
20
06
20
07
20
08
20
09
20
10
20
11
20
12
20
13
[Mill
ions T
OE
]
UK) Electricity generation breakdown
Nuclear power stations (CHP excluded)
Autoproducer conventional thermal power stations (CHP excluded)
Main activity conventional thermal power stations (CHP exluded)
Autoproducer CHP
Main activity CHP
0
100
200
300
20
05
20
06
20
07
20
08
20
09
20
10
20
11
20
12
20
13
[TO
E/M
illio
ns o
f P
ers
ons/H
DD
]
UK) Residential: final energy consumption per capita, HDD normalized
National final energy per capita, HDD normalized
EU28 final energy per capita, HDD normalized
0
50
100
150
20
05
20
06
20
07
20
08
20
09
20
10
20
11
20
12
20
13
[TO
E/M
illio
ns o
f P
ers
ons/H
DD
]
UK) Services: final energy consumption per capita, HDD normalized
National final energy per capita, HDD normalized
EU28 final energy per capita, HDD normalized
60%
80%
100%
120%
140%
20
05
20
06
20
07
20
08
20
09
20
10
20
11
20
12
20
13
UK) Services: final energy intensity (FEC / value added), HDD normalized
National final energy intensity, HDD normalized (2005 = 100%)
EU28 final energy intensity, HDD normalized (2005 = 100%)