Efficiency Evaluation of Ultrasonic Impact Treatment … · Efficiency Evaluation of Ultrasonic...
30
APPLIED ULTRASONICS Confidential Page 1 Proprietary Information TECHNICAL REPORT Efficiency Evaluation of Ultrasonic Impact Treatment (UIT) of Welded Joints in Weldox 420 Steel in accordance with the IIW Program E.S. Statnikov, V.O. Muktepavel Applied Ultrasonics, P.O. Box 100422, Birmingham, Alabama, 35210, USA Northern Scientific & Technology Company, NSTC 6 Voronin St., Severodvinsk, Arkhangelsk Region, 164500, Russia V.I. Trufyakov, P.P. Mikheev, A.Z. Kuzmenko The E.O. Paton Electric Welding Institute 11 Bozhenko St., Kiev, 252650, Ukraine A. Blomqvist SSAB Oxelosund AB, S-613 80 Oxelosund, Sweden IIW/IIS - DOCUMENT XIII - 1817 - 00
Transcript of Efficiency Evaluation of Ultrasonic Impact Treatment … · Efficiency Evaluation of Ultrasonic...
APPLIED ULTRASONICS
Confidential Page 1 Proprietary Information
TECHNICAL REPORT
Efficiency Evaluation of Ultrasonic Impact Treatment (UIT) of Welded Joints in Weldox 420 Steel in accordance with the IIW Program
E.S. Statnikov, V.O. Muktepavel
Applied Ultrasonics, P.O. Box 100422, Birmingham, Alabama, 35210, USA
Northern Scientific & Technology Company, NSTC 6 Voronin St., Severodvinsk, Arkhangelsk Region, 164500, Russia
V.I. Trufyakov, P.P. Mikheev, A.Z. Kuzmenko
The E.O. Paton Electric Welding Institute 11 Bozhenko St., Kiev, 252650, Ukraine
A. Blomqvist
SSAB Oxelosund AB, S-613 80 Oxelosund, Sweden
IIW/IIS - DOCUMENT XIII - 1817 - 00
APPLIED ULTRASONICS
Confidential Page 2 Proprietary Information
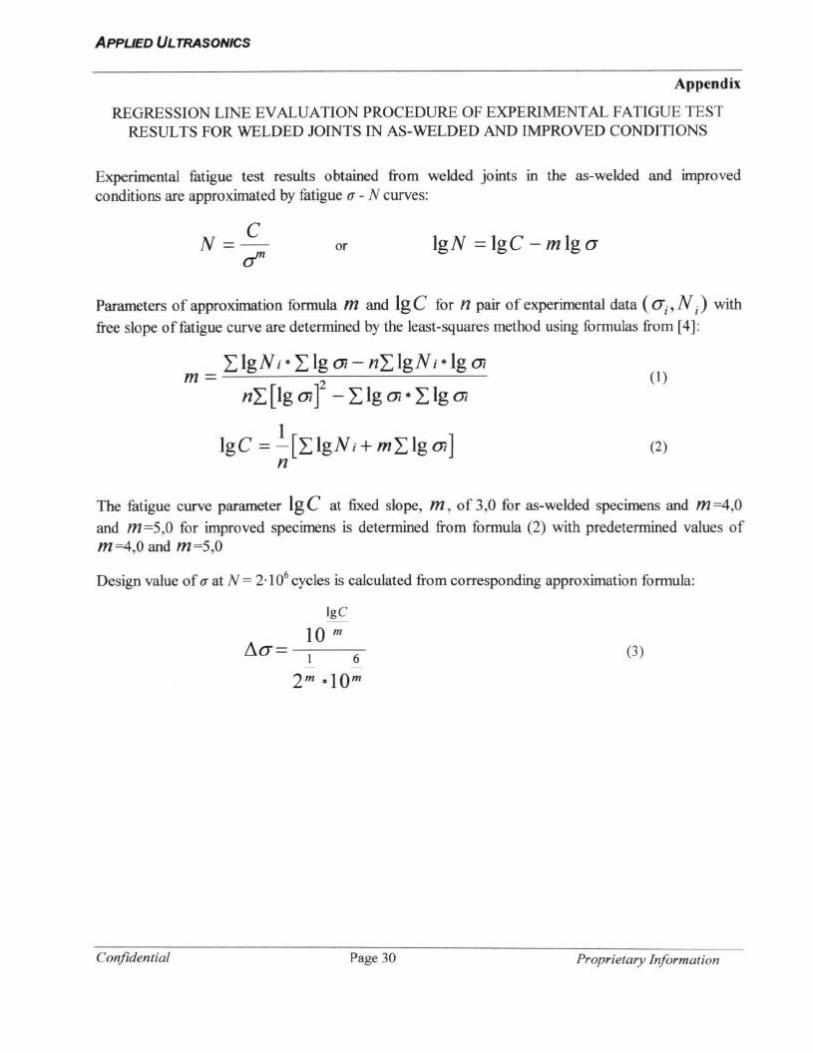
ABSTRACT
Considerable recent attention has been focused on efficiency investigation of ultrasonic impact treatment being one of the post–weld treatments improving reliability and life of welded joints.
Investigations were carried out at different times in Russia, Ukraine, France, Japan, Norway, Sweden and USA.
In each specific case independent problems were solved by these investigations which were performed in accordance with various appropriate procedures.
The work under review is intended to determine and study UIT efficiency according to IIW Collaborative Test Program on Improvement Methods, Doc. XIII-WG2-30-94, by comparison with well-known methods for increasing fatigue strength of welded joints.
The paper presents comparative fatigue test results for specimens in the as-welded condition and specimens treated by hammer peening, shot peening, TIG dressing, ultrasonic impact treatment and a combination of TIG dressing and ultrasonic impact treatment. Welded specimens were fabricated from WELDOX 420 steel at SSAB.
Also, the advisability of applying UIT to improve fatigue limit and life of welded joints is shown.
Key words: Welded joint, ultrasonic impact treatment, hammer peening, shot peening, TIG dressing, TIG dressing and subsequent ultrasonic impact treatment, fatigue strength, test results.
APPLIED ULTRASONICS
Confidential Page 3 Proprietary Information
1. INTRODUCTION
Presented here are the fatigue test results of welded joints from steel WELDOX 420 made at SSAB, Sweden. The results were obtained at the E.O. Paton Electric Welding Institute of the NAS of Ukraine in accordance with IIW Collaborative Test Program on Improvement Methods (Doc. XIII-WG2-30-94) using specimens with transverse non-load carrying fillet welds in the as-welded condition and improved by ultrasonic impact treatment, hammer peening, shot peening, TIG dressing and a combination of TIG dressing and ultrasonic impact treatment of weld toes.
2. OBJECTIVE OF WORK
The work was intended to obtain the initial data to compare the efficiency of the above-mentioned post-weld treatment techniques in terms of increasing fatigue strength of welded joints and develop ultrasonic impact treatment technique that ensures rather high efficiency of the method.
3. MATERIAL AND SPECIMEN FABRICATION
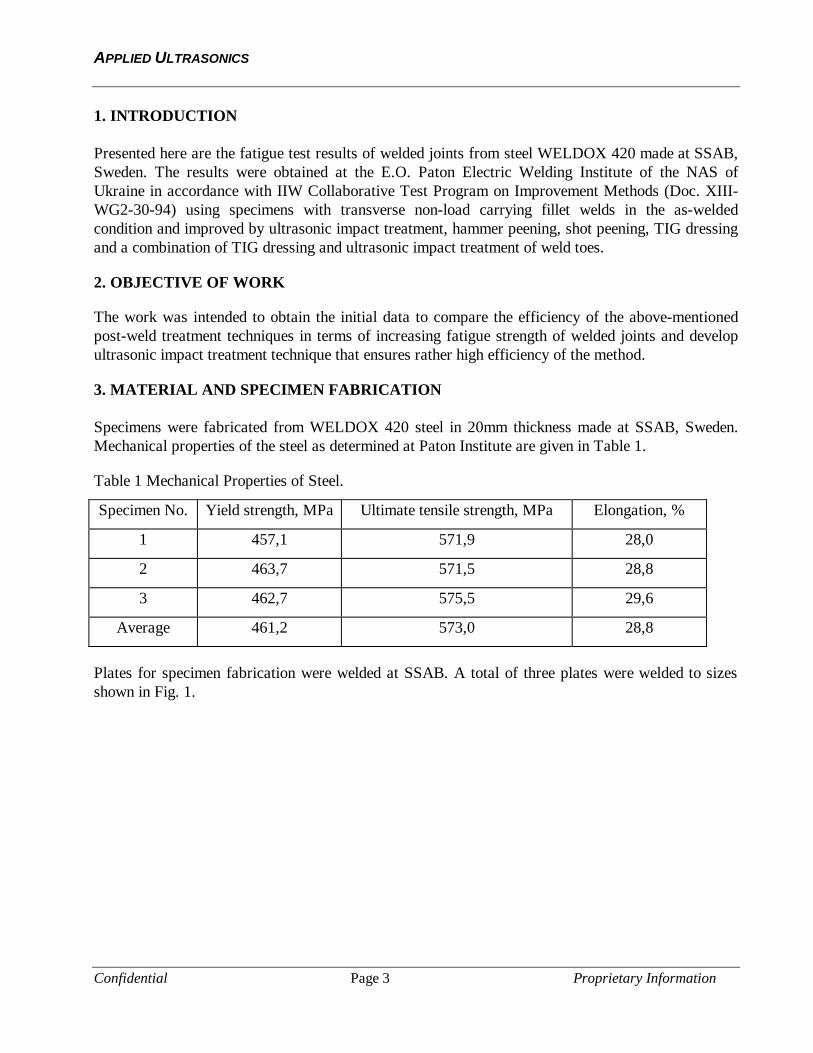
Specimens were fabricated from WELDOX 420 steel in 20mm thickness made at SSAB, Sweden. Mechanical properties of the steel as determined at Paton Institute are given in Table 1.
Table 1 Mechanical Properties of Steel.
Specimen No. Yield strength, MPa Ultimate tensile strength, MPa Elongation, %
1 457,1 571,9 28,0
2 463,7 571,5 28,8
3 462,7 575,5 29,6
Average 461,2 573,0 28,8
Plates for specimen fabrication were welded at SSAB. A total of three plates were welded to sizes shown in Fig. 1.
APPLIED ULTRASONICS
Confidential Page 4 Proprietary Information
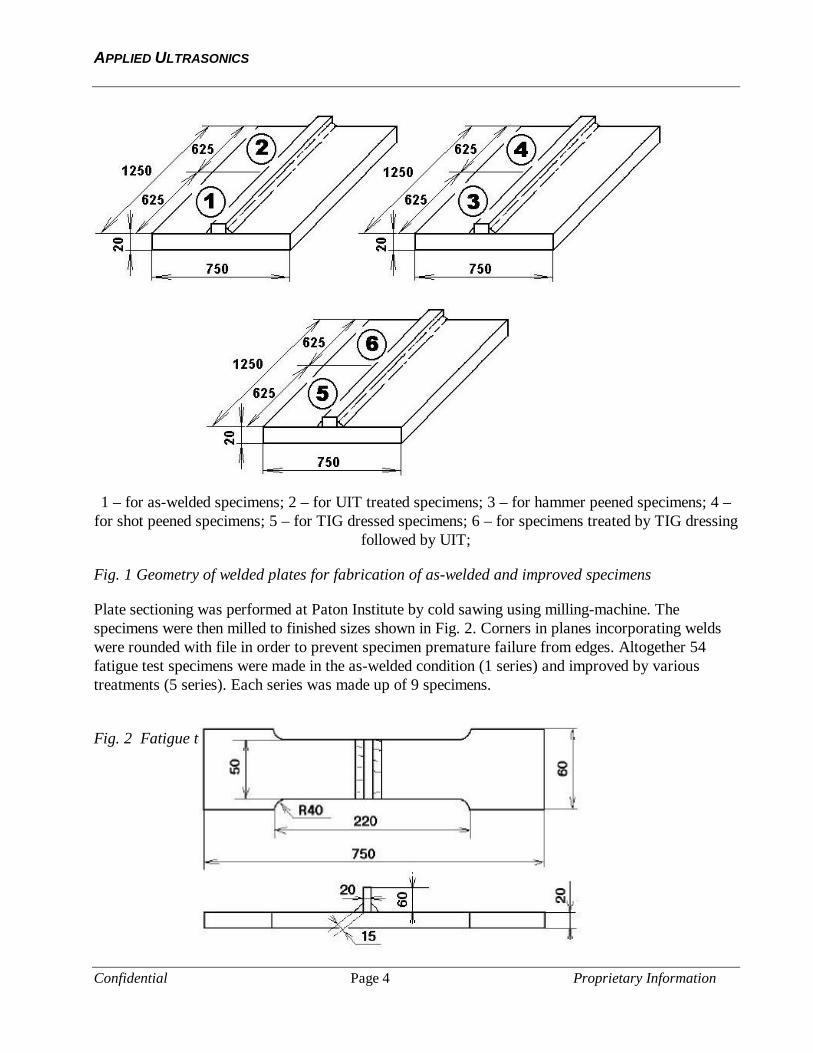
1 – for as-welded specimens; 2 – for UIT treated specimens; 3 – for hammer peened specimens; 4 – for shot peened specimens; 5 – for TIG dressed specimens; 6 – for specimens treated by TIG dressing
followed by UIT;
Fig. 1 Geometry of welded plates for fabrication of as-welded and improved specimens
Plate sectioning was performed at Paton Institute by cold sawing using milling-machine. The specimens were then milled to finished sizes shown in Fig. 2. Corners in planes incorporating welds were rounded with file in order to prevent specimen premature failure from edges. Altogether 54 fatigue test specimens were made in the as-welded condition (1 series) and improved by various treatments (5 series). Each series was made up of 9 specimens.
Fig. 2 Fatigue test specimen geometry

APPLIED ULTRASONICS
Confidential Page 5 Proprietary Information
4. IMPROVEMENT TREATMENTS
UIT of welded plate, used for fabrication of specimens of series 2, was performed using multi-pin tool with pin diameter of 5mm. Some specimens of this series were retreated by UIT using multi-pin tool with pin diameter of 3mm.
Hammer peening and shot peening of welded plates, used for fabrication of specimens of series 3 and series 4, were done to technique accepted at NSTC. Plates for series 5 and series 6 specimens were TIG dressed at SSAB. TIG dressed plate, used for fabrication of specimens of series 6, was then UIT treated using multi-pin tool with pin diameter of 5mm.
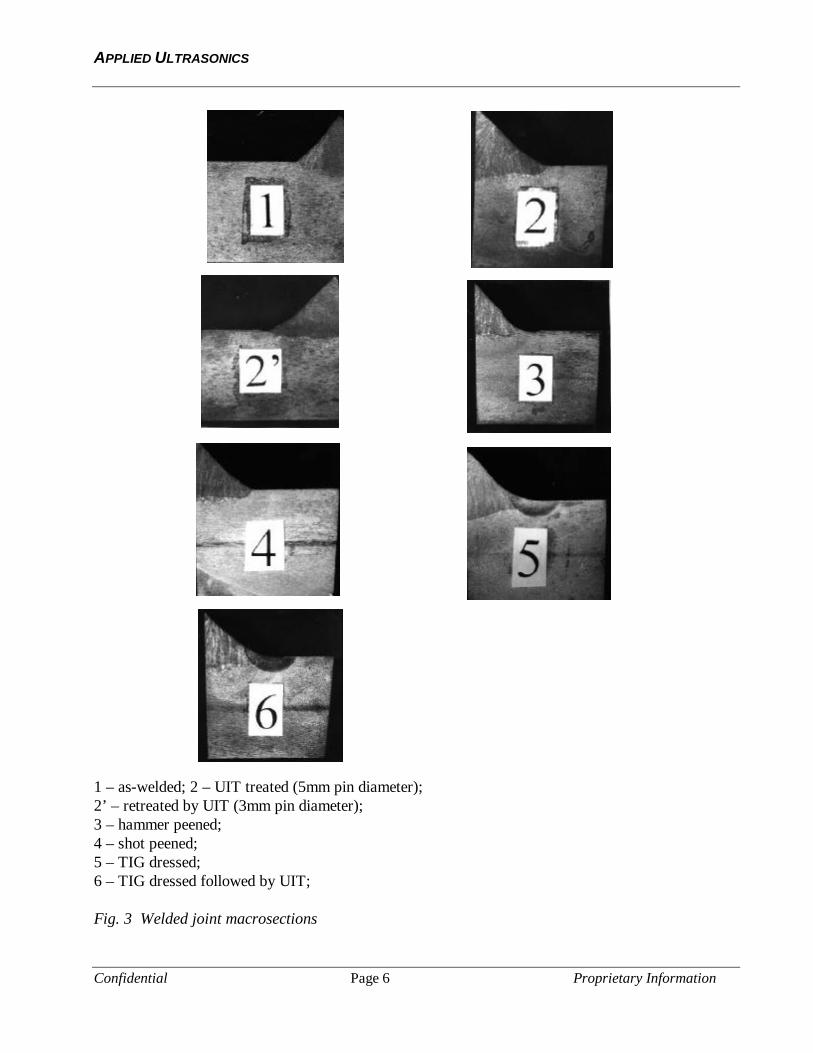
Fig. 3 illustrates macrosection photos of welded joints in the as-welded and improved conditions. Cuts for macrosections were taken from fatigue tested welded specimens. 5. FATIGUE TESTING PROCEDURE Fatigue tests were carried out with regard to requirements [1, 2] using hydropulsator CDM-10 under 4-point bending with a local span of 250mm and a support span of 500mm. Actual varying stresses in specimens were measured with wire strain gages using strain gage equipment 4 ANCh. Specimens were loaded at frequency of 7Hz and stress ratio, R, of 0.1. The ambient air temperature varied in the range 20 to 28º Celsius.
APPLIED ULTRASONICS
Confidential Page 6 Proprietary Information
1 – as-welded; 2 – UIT treated (5mm pin diameter); 2’ – retreated by UIT (3mm pin diameter); 3 – hammer peened; 4 – shot peened; 5 – TIG dressed; 6 – TIG dressed followed by UIT; Fig. 3 Welded joint macrosections
APPLIED ULTRASONICS
Confidential Page 7 Proprietary Information
6. FATIGUE TEST RESULTS AND ANALYSIS
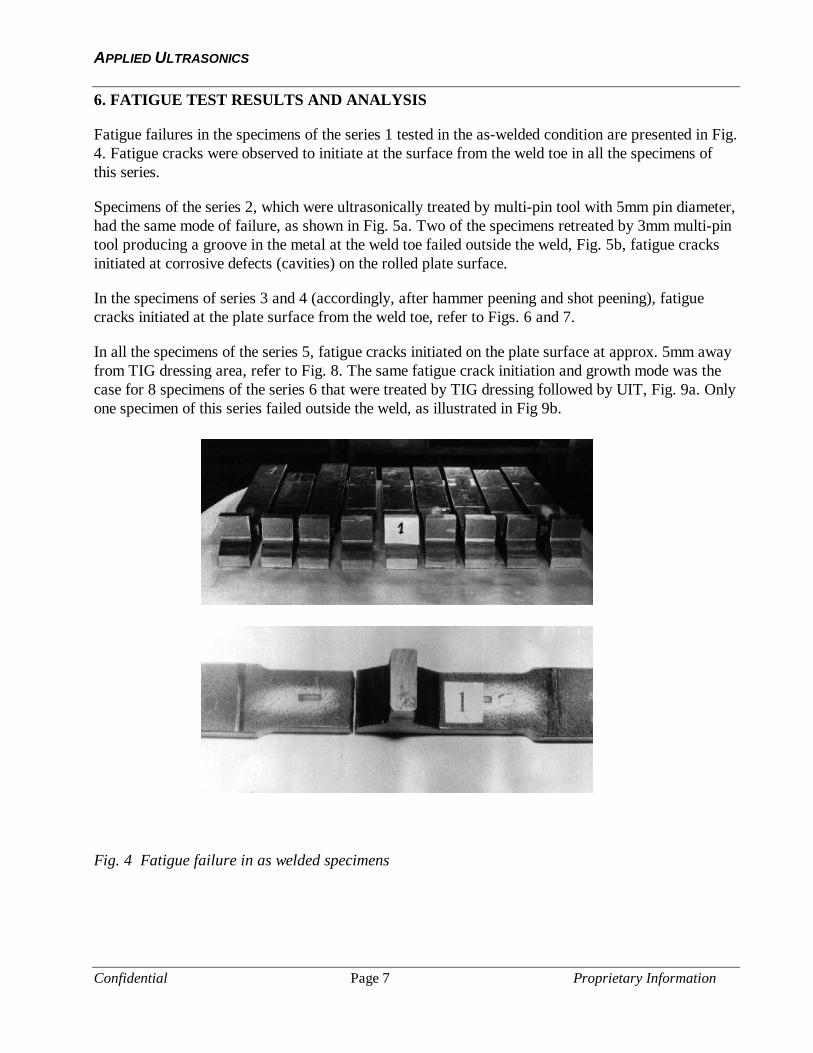
Fatigue failures in the specimens of the series 1 tested in the as-welded condition are presented in Fig. 4. Fatigue cracks were observed to initiate at the surface from the weld toe in all the specimens of this series.
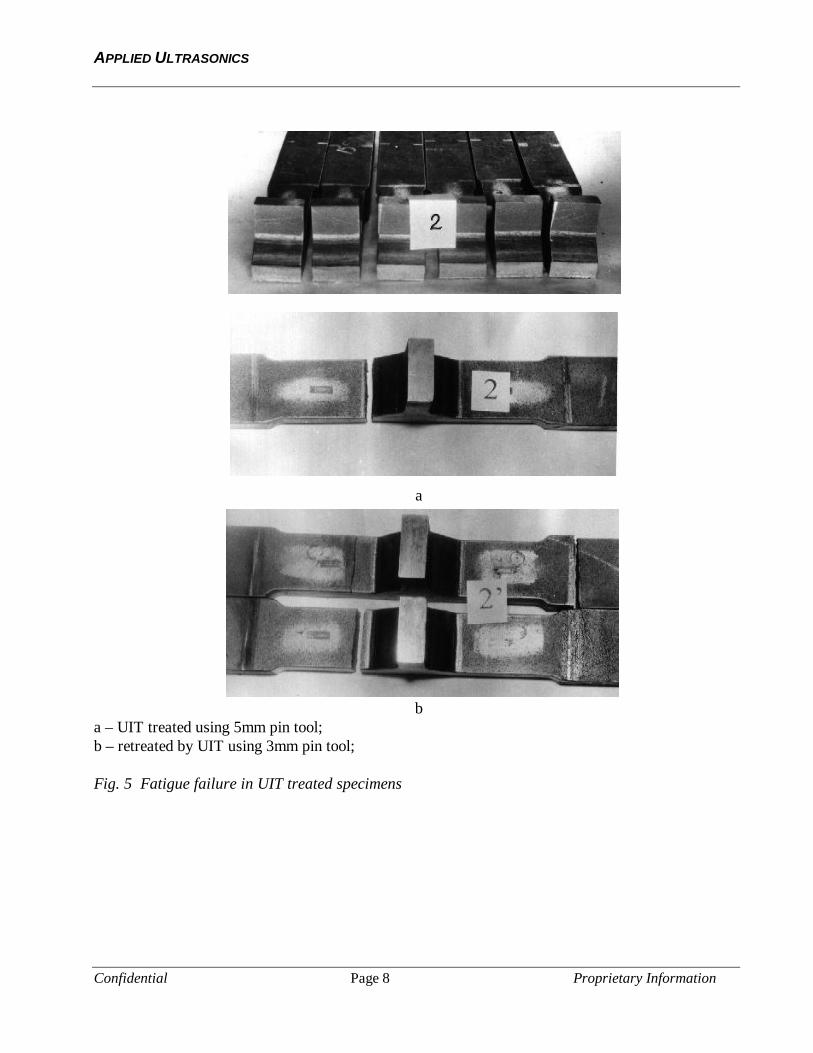
Specimens of the series 2, which were ultrasonically treated by multi-pin tool with 5mm pin diameter, had the same mode of failure, as shown in Fig. 5a. Two of the specimens retreated by 3mm multi-pin tool producing a groove in the metal at the weld toe failed outside the weld, Fig. 5b, fatigue cracks initiated at corrosive defects (cavities) on the rolled plate surface.
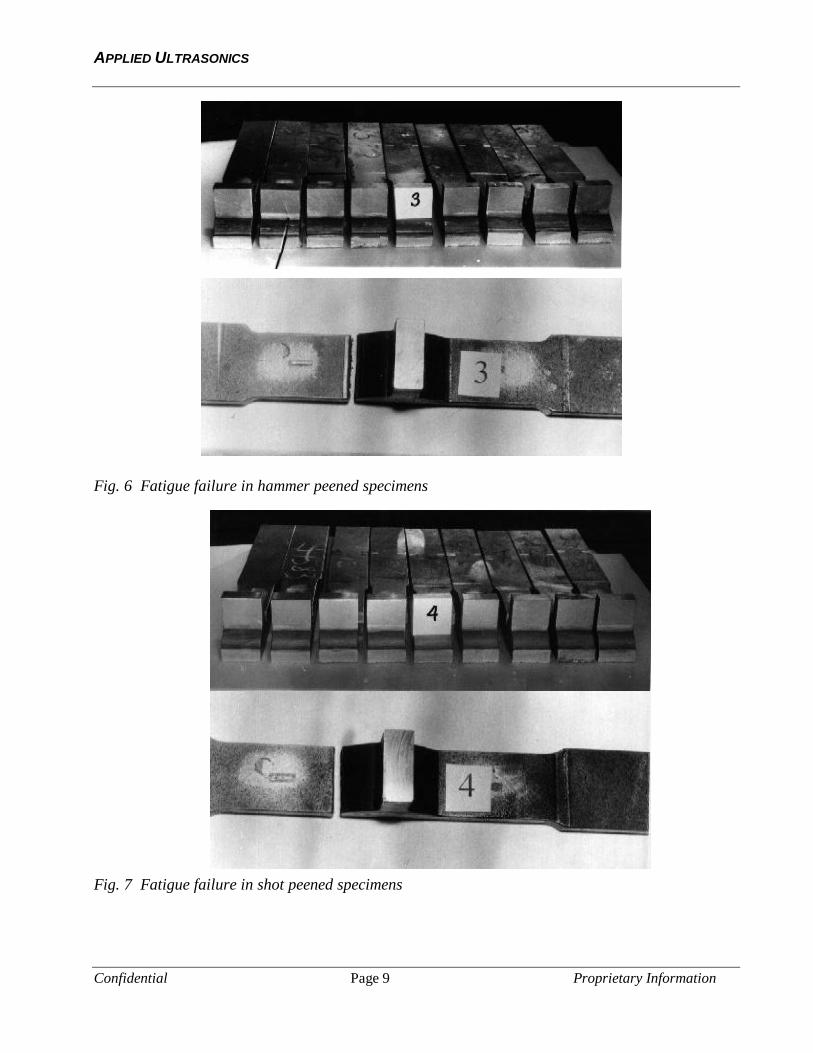
In the specimens of series 3 and 4 (accordingly, after hammer peening and shot peening), fatigue cracks initiated at the plate surface from the weld toe, refer to Figs. 6 and 7.
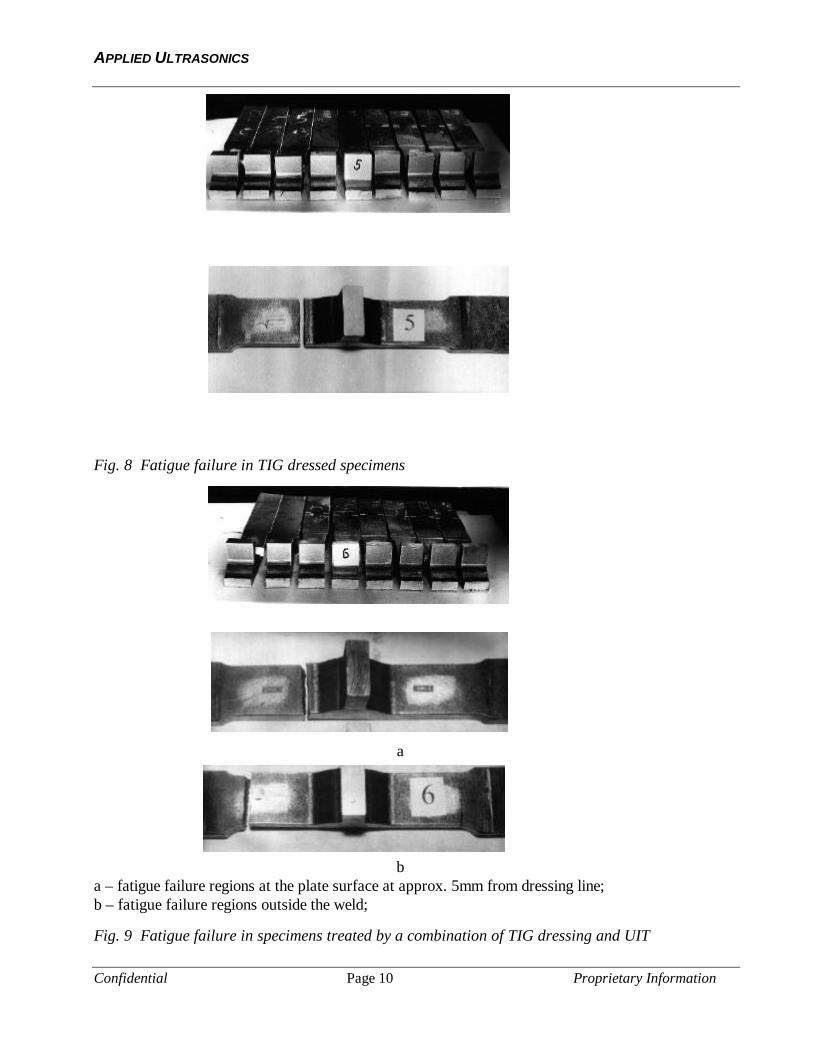
In all the specimens of the series 5, fatigue cracks initiated on the plate surface at approx. 5mm away from TIG dressing area, refer to Fig. 8. The same fatigue crack initiation and growth mode was the case for 8 specimens of the series 6 that were treated by TIG dressing followed by UIT, Fig. 9a. Only one specimen of this series failed outside the weld, as illustrated in Fig 9b.
Fig. 4 Fatigue failure in as welded specimens
APPLIED ULTRASONICS
Confidential Page 8 Proprietary Information
a
b a – UIT treated using 5mm pin tool; b – retreated by UIT using 3mm pin tool; Fig. 5 Fatigue failure in UIT treated specimens
APPLIED ULTRASONICS
Confidential Page 9 Proprietary Information
Fig. 6 Fatigue failure in hammer peened specimens
Fig. 7 Fatigue failure in shot peened specimens
APPLIED ULTRASONICS
Confidential Page 10 Proprietary Information
Fig. 8 Fatigue failure in TIG dressed specimens
a
b a – fatigue failure regions at the plate surface at approx. 5mm from dressing line; b – fatigue failure regions outside the weld;
Fig. 9 Fatigue failure in specimens treated by a combination of TIG dressing and UIT
APPLIED ULTRASONICS
Confidential Page 11 Proprietary Information
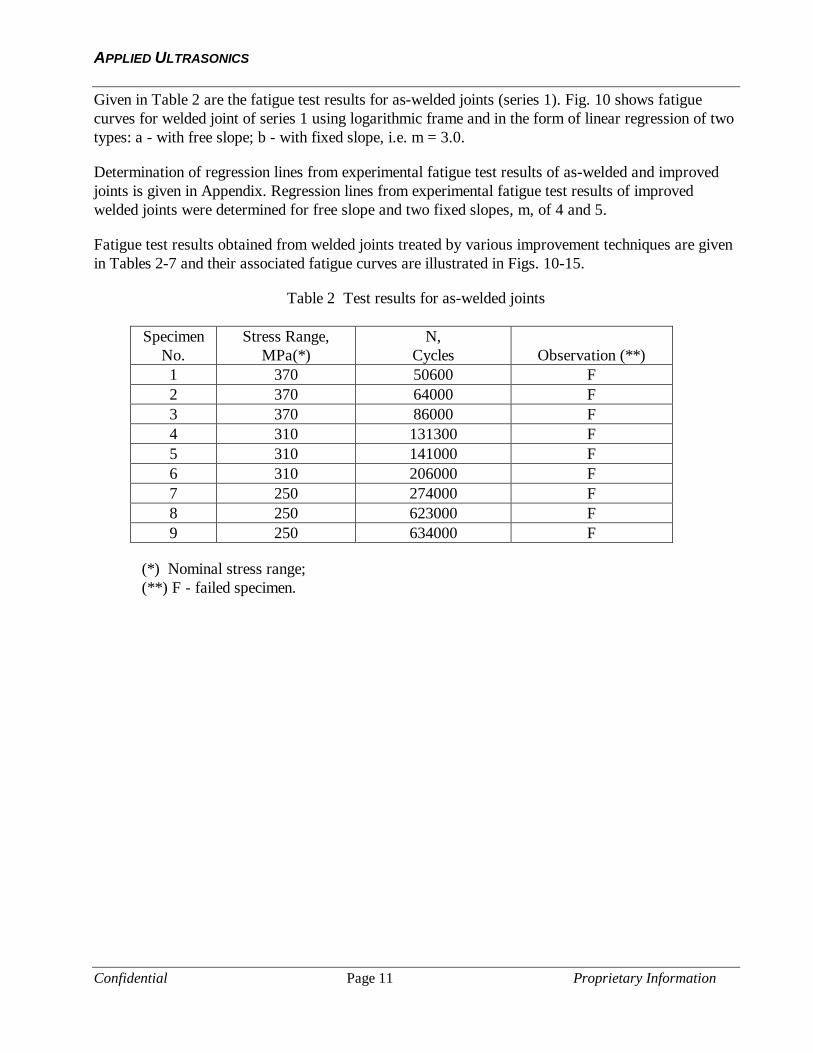
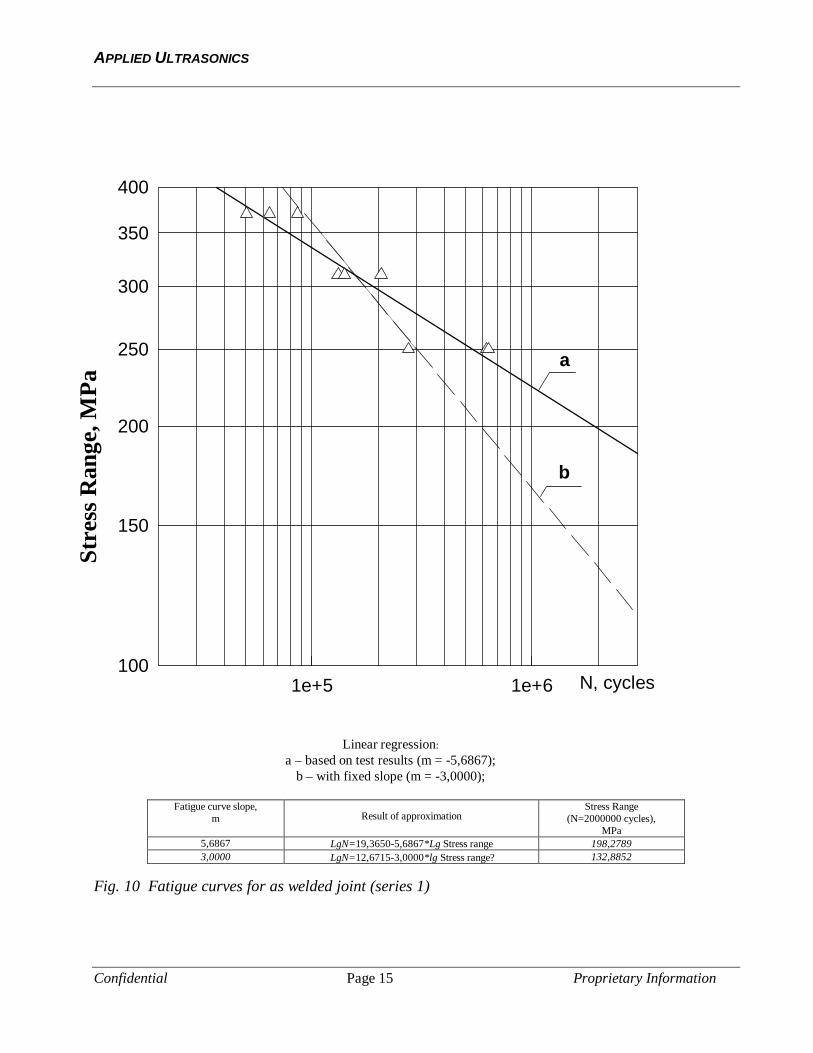
Given in Table 2 are the fatigue test results for as-welded joints (series 1). Fig. 10 shows fatigue curves for welded joint of series 1 using logarithmic frame and in the form of linear regression of two types: a - with free slope; b - with fixed slope, i.e. m = 3.0.
Determination of regression lines from experimental fatigue test results of as-welded and improved joints is given in Appendix. Regression lines from experimental fatigue test results of improved welded joints were determined for free slope and two fixed slopes, m, of 4 and 5.
Fatigue test results obtained from welded joints treated by various improvement techniques are given in Tables 2-7 and their associated fatigue curves are illustrated in Figs. 10-15.
Table 2 Test results for as-welded joints
Specimen No.
Stress Range, MPa(*)
N, Cycles
Observation (**)
1 370 50600 F 2 370 64000 F 3 370 86000 F 4 310 131300 F 5 310 141000 F 6 310 206000 F 7 250 274000 F 8 250 623000 F 9 250 634000 F
(*) Nominal stress range; (**) F - failed specimen.
APPLIED ULTRASONICS
Confidential Page 12 Proprietary Information
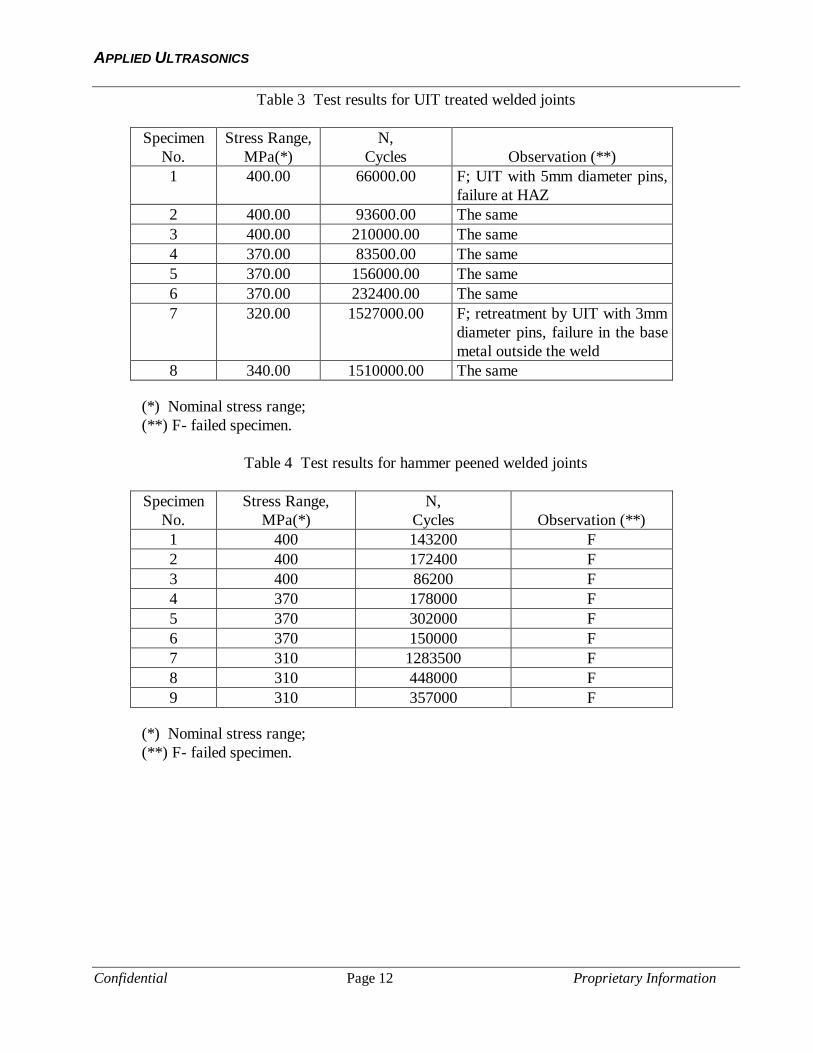
Table 3 Test results for UIT treated welded joints
Specimen No.
Stress Range, MPa(*)
N, Cycles
Observation (**)
1 400.00 66000.00 F; UIT with 5mm diameter pins, failure at HAZ
2 400.00 93600.00 The same 3 400.00 210000.00 The same 4 370.00 83500.00 The same 5 370.00 156000.00 The same 6 370.00 232400.00 The same 7 320.00 1527000.00 F; retreatment by UIT with 3mm
diameter pins, failure in the base metal outside the weld
8 340.00 1510000.00 The same
(*) Nominal stress range; (**) F- failed specimen.
Table 4 Test results for hammer peened welded joints
Specimen
No. Stress Range,
MPa(*) N,
Cycles
Observation (**) 1 400 143200 F 2 400 172400 F 3 400 86200 F 4 370 178000 F 5 370 302000 F 6 370 150000 F 7 310 1283500 F 8 310 448000 F 9 310 357000 F
(*) Nominal stress range; (**) F- failed specimen.
APPLIED ULTRASONICS
Confidential Page 13 Proprietary Information
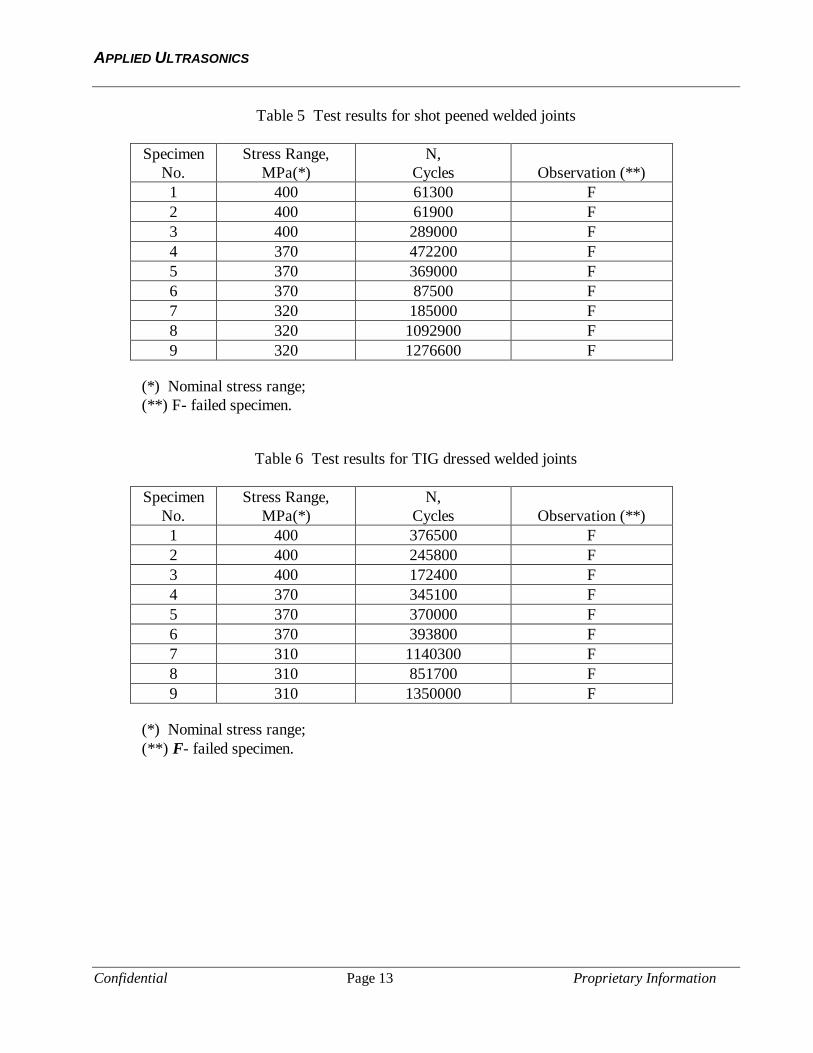
Table 5 Test results for shot peened welded joints
Specimen No.
Stress Range, MPa(*)
N, Cycles
Observation (**)
1 400 61300 F 2 400 61900 F 3 400 289000 F 4 370 472200 F 5 370 369000 F 6 370 87500 F 7 320 185000 F 8 320 1092900 F 9 320 1276600 F
(*) Nominal stress range; (**) F- failed specimen.
Table 6 Test results for TIG dressed welded joints
Specimen
No. Stress Range,
MPa(*) N,
Cycles
Observation (**) 1 400 376500 F 2 400 245800 F 3 400 172400 F 4 370 345100 F 5 370 370000 F 6 370 393800 F 7 310 1140300 F 8 310 851700 F 9 310 1350000 F
(*) Nominal stress range; (**) F- failed specimen.
APPLIED ULTRASONICS
Confidential Page 14 Proprietary Information
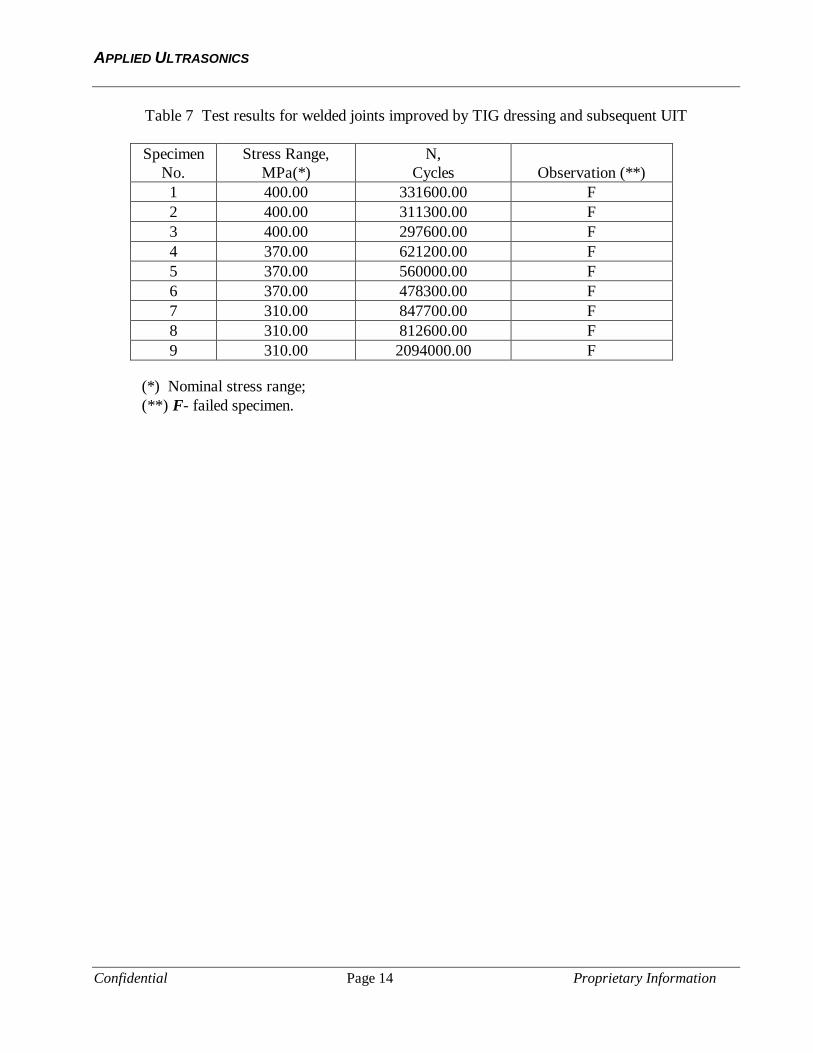
Table 7 Test results for welded joints improved by TIG dressing and subsequent UIT
Specimen No.
Stress Range, MPa(*)
N, Cycles
Observation (**)
1 400.00 331600.00 F 2 400.00 311300.00 F 3 400.00 297600.00 F 4 370.00 621200.00 F 5 370.00 560000.00 F 6 370.00 478300.00 F 7 310.00 847700.00 F 8 310.00 812600.00 F 9 310.00 2094000.00 F
(*) Nominal stress range; (**) F- failed specimen.
APPLIED ULTRASONICS
Confidential Page 15 Proprietary Information
Linear regression:
a – based on test results (m = -5,6867); b – with fixed slope (m = -3,0000);
Fatigue curve slope,
m
Result of approximation Stress Range
(N=2000000 cycles), MPa
5,6867 LgN=19,3650-5,6867*Lg Stress range 198,2789 3,0000 LgN=12,6715-3,0000*lg Stress range? 132,8852
Fig. 10 Fatigue curves for as welded joint (series 1)
N, cycles1e+5 1e+6
? ? , MPa
150
200
250
300
350
400
100
a
b
Stre
ss R
ange
, MPa
APPLIED ULTRASONICS
Confidential Page 16 Proprietary Information
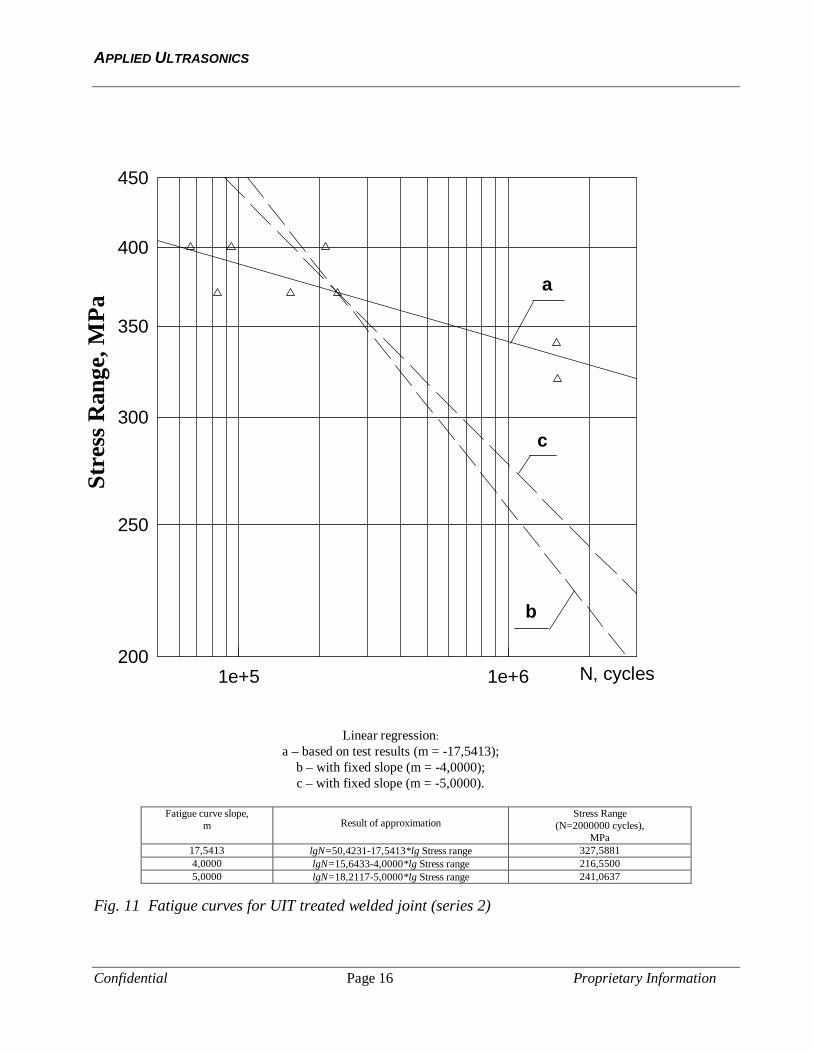
Linear regression:
a – based on test results (m = -17,5413); b – with fixed slope (m = -4,0000); c – with fixed slope (m = -5,0000).
Fatigue curve slope,
m
Result of approximation Stress Range
(N=2000000 cycles), MPa
17,5413 lgN=50,4231-17,5413*lg Stress range 327,5881 4,0000 lgN=15,6433-4,0000*lg Stress range 216,5500 5,0000 lgN=18,2117-5,0000*lg Stress range 241,0637
Fig. 11 Fatigue curves for UIT treated welded joint (series 2)
N, cycles1e+5 1e+6
? ? , MPa
200
250
300
350
400
450
a
b
c
Stre
ss R
ange
, MPa
APPLIED ULTRASONICS
Confidential Page 17 Proprietary Information
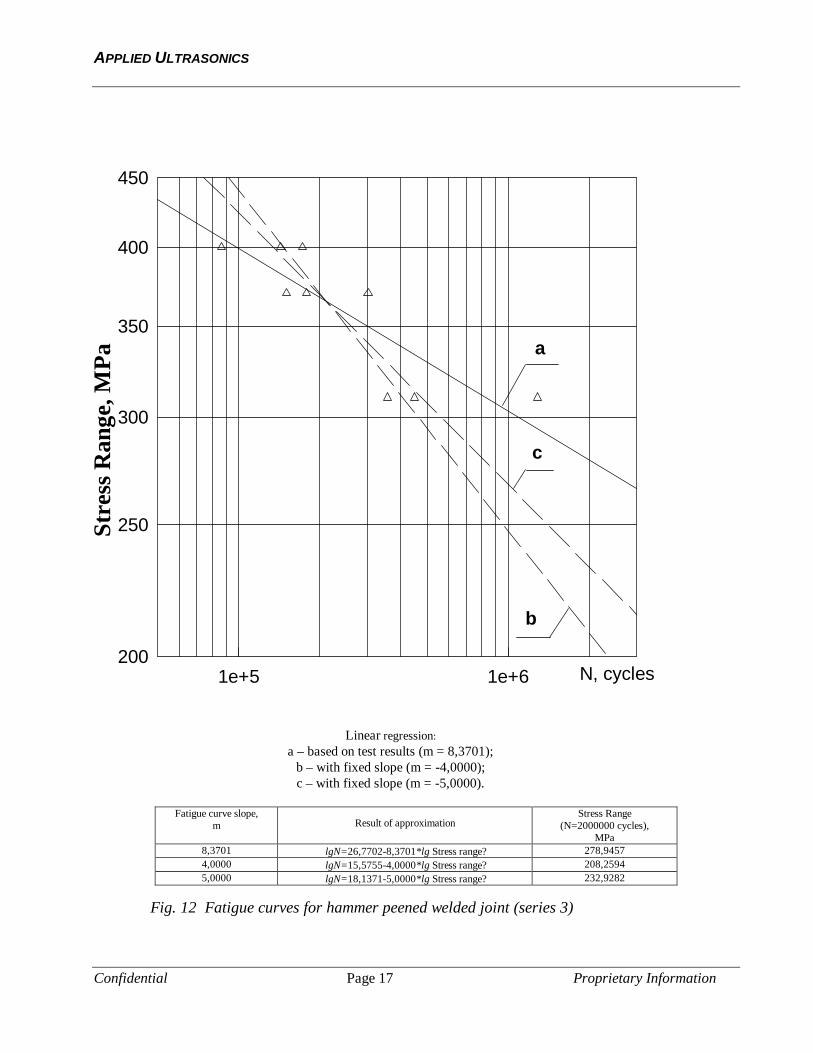
Linear regression:
a – based on test results (m = 8,3701); b – with fixed slope (m = -4,0000); c – with fixed slope (m = -5,0000).
Fatigue curve slope,
m
Result of approximation Stress Range
(N=2000000 cycles), MPa
8,3701 lgN=26,7702-8,3701*lg Stress range? 278,9457 4,0000 lgN=15,5755-4,0000*lg Stress range? 208,2594 5,0000 lgN=18,1371-5,0000*lg Stress range? 232,9282
Fig. 12 Fatigue curves for hammer peened welded joint (series 3)
N, cycles1e+5 1e+6
? ? , MPa
200
250
300
350
400
450
a
b
c
Stre
ss R
ange
, MPa
APPLIED ULTRASONICS
Confidential Page 18 Proprietary Information
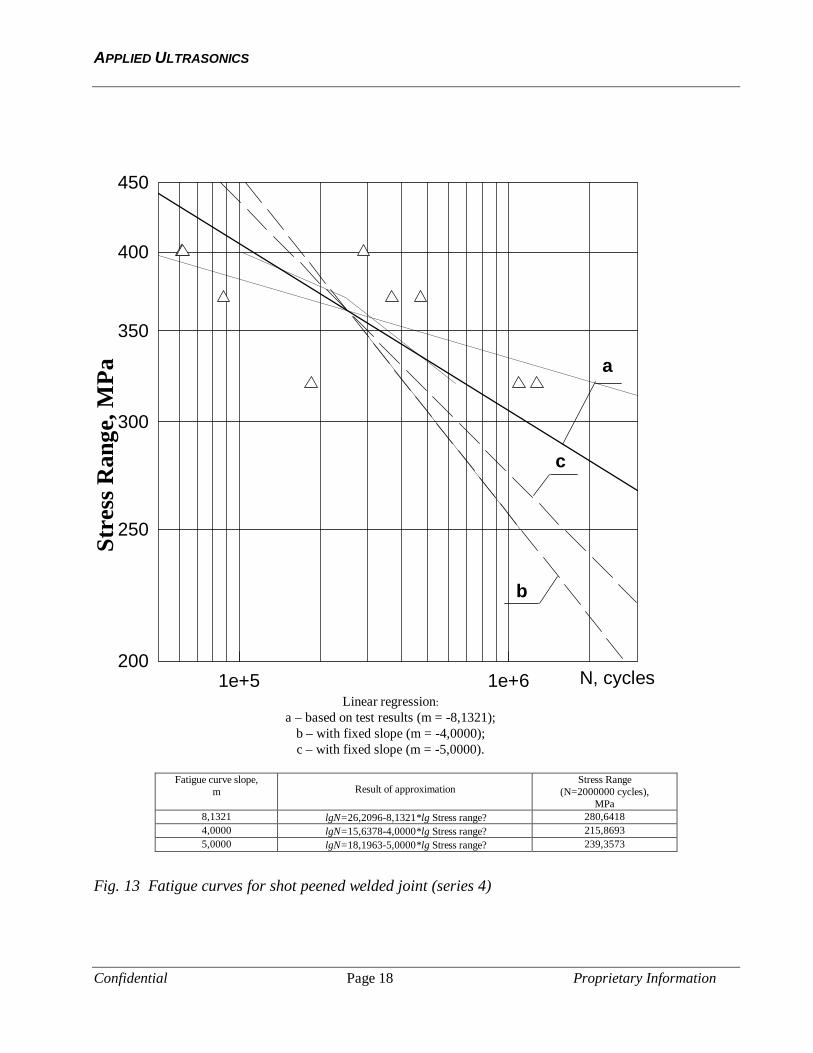
Linear regression: a – based on test results (m = -8,1321);
b – with fixed slope (m = -4,0000); c – with fixed slope (m = -5,0000).
Fatigue curve slope,
m
Result of approximation Stress Range
(N=2000000 cycles), MPa
8,1321 lgN=26,2096-8,1321*lg Stress range? 280,6418 4,0000 lgN=15,6378-4,0000*lg Stress range? 215,8693 5,0000 lgN=18,1963-5,0000*lg Stress range? 239,3573
Fig. 13 Fatigue curves for shot peened welded joint (series 4)
N, cycles1e+5 1e+6
? ? , MPa
200
250
300
350
400
450
a
b
c
Stre
ss R
ange
, MPa
APPLIED ULTRASONICS
Confidential Page 19 Proprietary Information
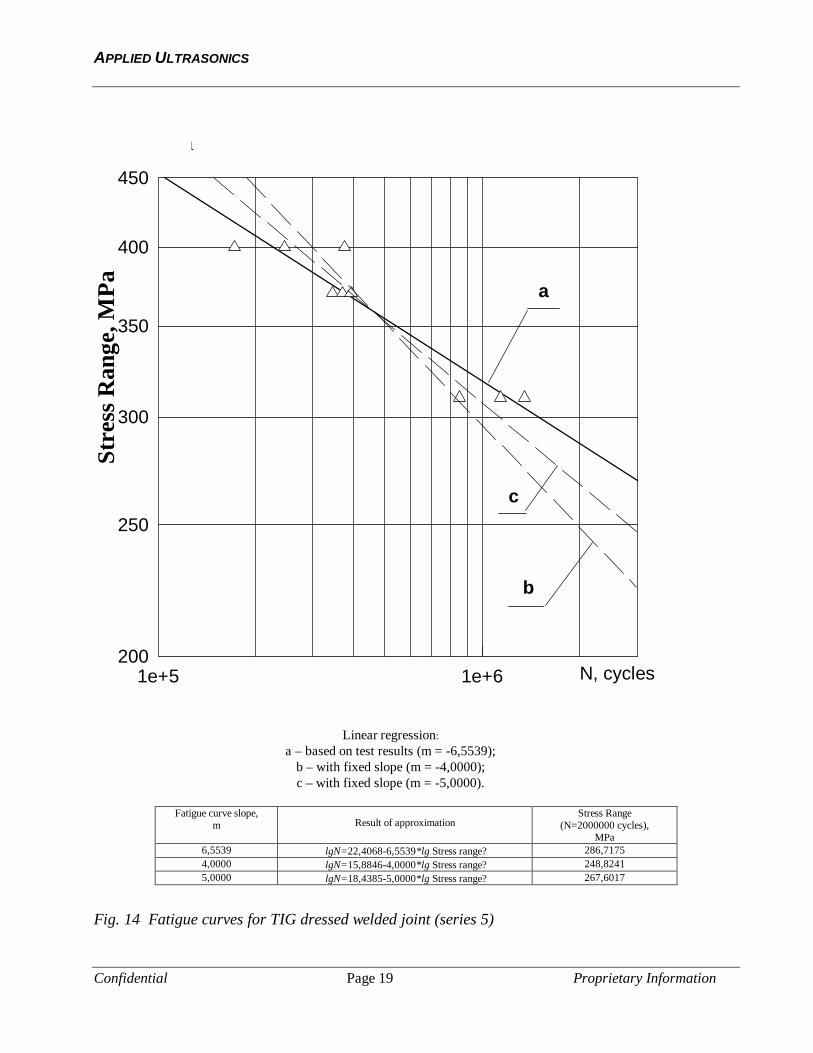
Linear regression:
a – based on test results (m = -6,5539); b – with fixed slope (m = -4,0000); c – with fixed slope (m = -5,0000).
Fatigue curve slope,
m
Result of approximation Stress Range
(N=2000000 cycles), MPa
6,5539 lgN=22,4068-6,5539*lg Stress range? 286,7175 4,0000 lgN=15,8846-4,0000*lg Stress range? 248,8241 5,0000 lgN=18,4385-5,0000*lg Stress range? 267,6017
Fig. 14 Fatigue curves for TIG dressed welded joint (series 5)
N, cycles1e+5 1e+6
? ? , MPa
200
250
300
350
400
450
a
b
c
Stre
ss R
ange
, MPa
APPLIED ULTRASONICS
Confidential Page 20 Proprietary Information
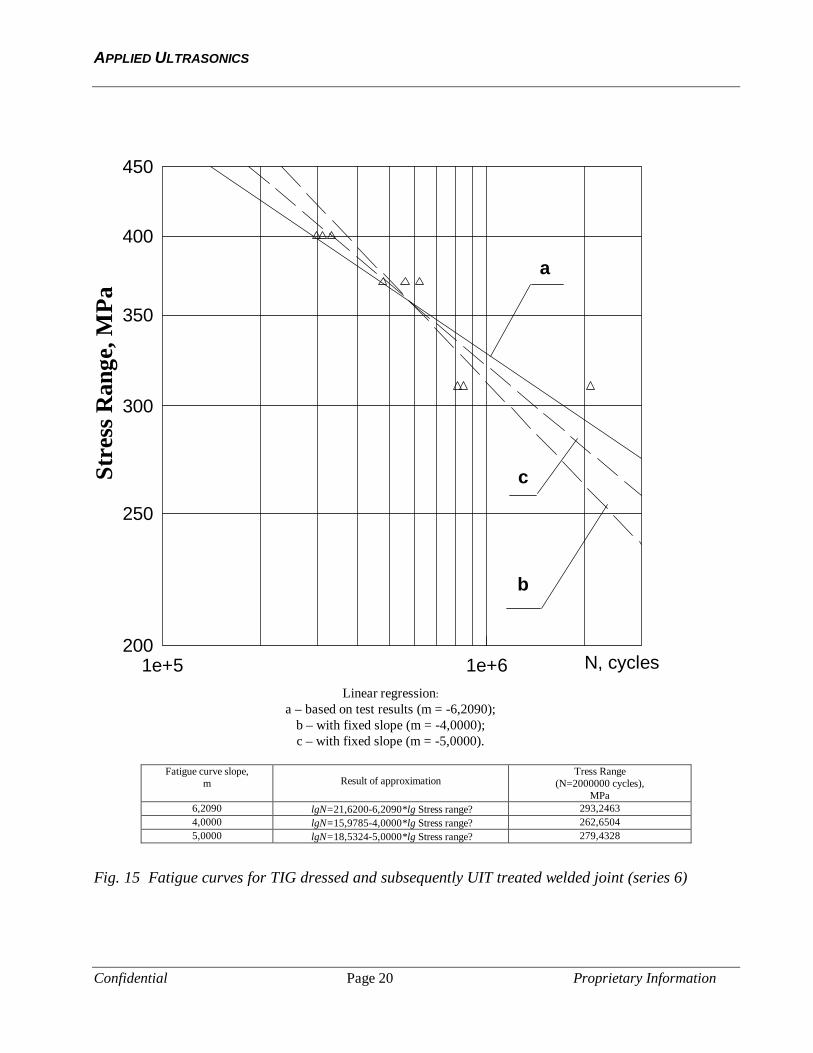
Linear regression: a – based on test results (m = -6,2090);
b – with fixed slope (m = -4,0000); c – with fixed slope (m = -5,0000).
Fatigue curve slope,
m
Result of approximation Tress Range
(N=2000000 cycles), MPa
6,2090 lgN=21,6200-6,2090*lg Stress range? 293,2463 4,0000 lgN=15,9785-4,0000*lg Stress range? 262,6504 5,0000 lgN=18,5324-5,0000*lg Stress range? 279,4328
Fig. 15 Fatigue curves for TIG dressed and subsequently UIT treated welded joint (series 6)
N, cycles1e+5 1e+6
? ? , MPa
200
250
300
350
400
450
a
b
cStre
ss R
ange
, MPa
APPLIED ULTRASONICS
Confidential Page 21 Proprietary Information
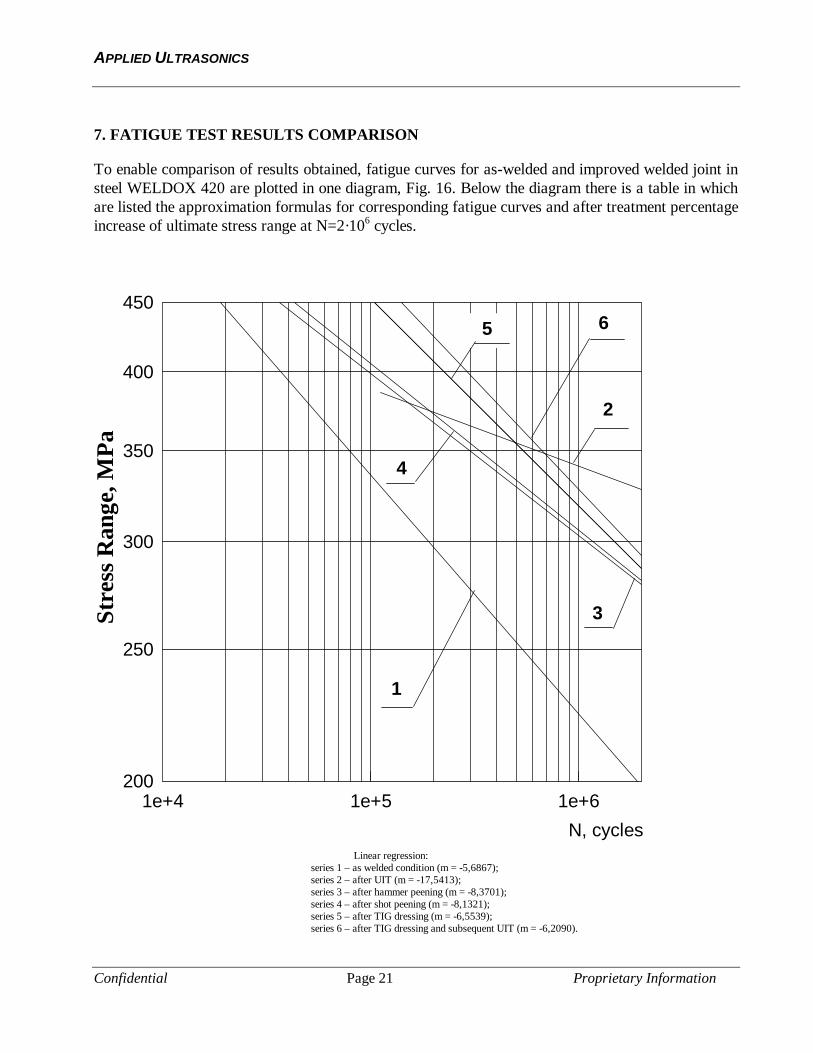
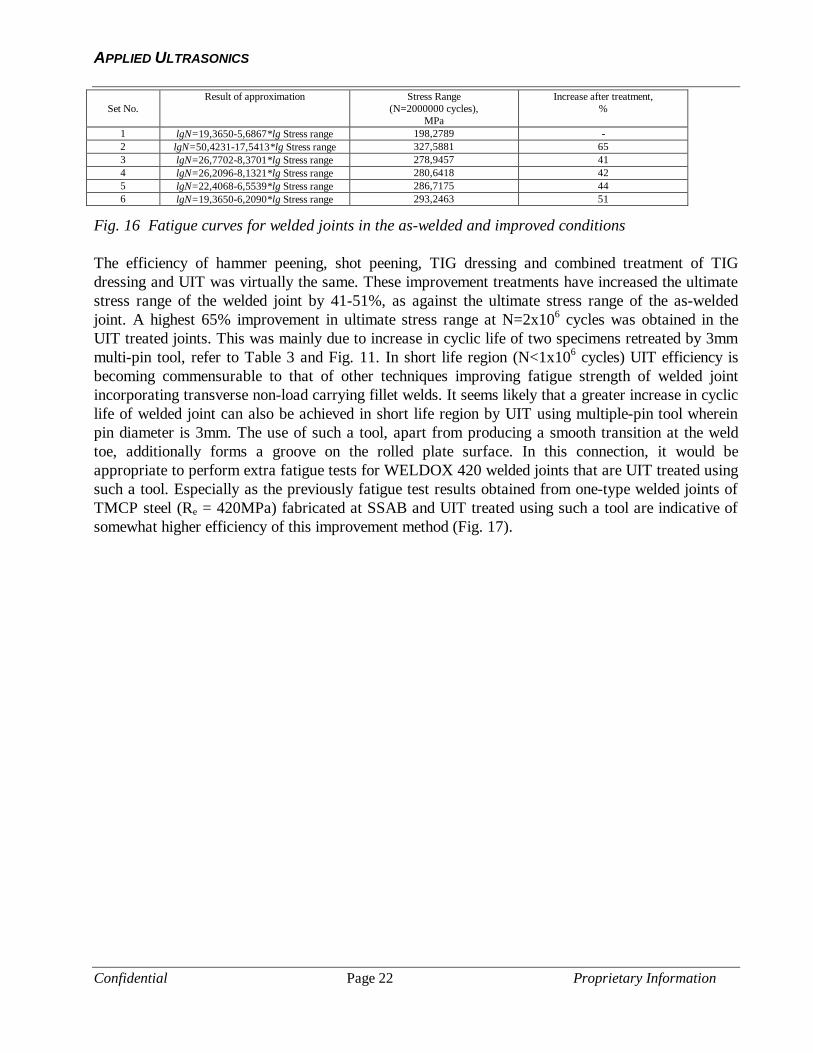
7. FATIGUE TEST RESULTS COMPARISON
To enable comparison of results obtained, fatigue curves for as-welded and improved welded joint in steel WELDOX 420 are plotted in one diagram, Fig. 16. Below the diagram there is a table in which are listed the approximation formulas for corresponding fatigue curves and after treatment percentage increase of ultimate stress range at N=2·106 cycles.
Linear regression: series 1 – as welded condition (m = -5,6867); series 2 – after UIT (m = -17,5413); series 3 – after hammer peening (m = -8,3701); series 4 – after shot peening (m = -8,1321); series 5 – after TIG dressing (m = -6,5539); series 6 – after TIG dressing and subsequent UIT (m = -6,2090).
N, cycles1e+4 1e+5 1e+6
? ? , MPa
200
250
300
350
400
450
1
3
4
6
2
5
Stre
ss R
ange
, MPa
APPLIED ULTRASONICS
Confidential Page 22 Proprietary Information
Set No.
Result of approximation Stress Range (N=2000000 cycles),
MPa
Increase after treatment, %
1 lgN=19,3650-5,6867*lg Stress range 198,2789 - 2 lgN=50,4231-17,5413*lg Stress range 327,5881 65 3 lgN=26,7702-8,3701*lg Stress range 278,9457 41 4 lgN=26,2096-8,1321*lg Stress range 280,6418 42 5 lgN=22,4068-6,5539*lg Stress range 286,7175 44 6 lgN=19,3650-6,2090*lg Stress range 293,2463 51
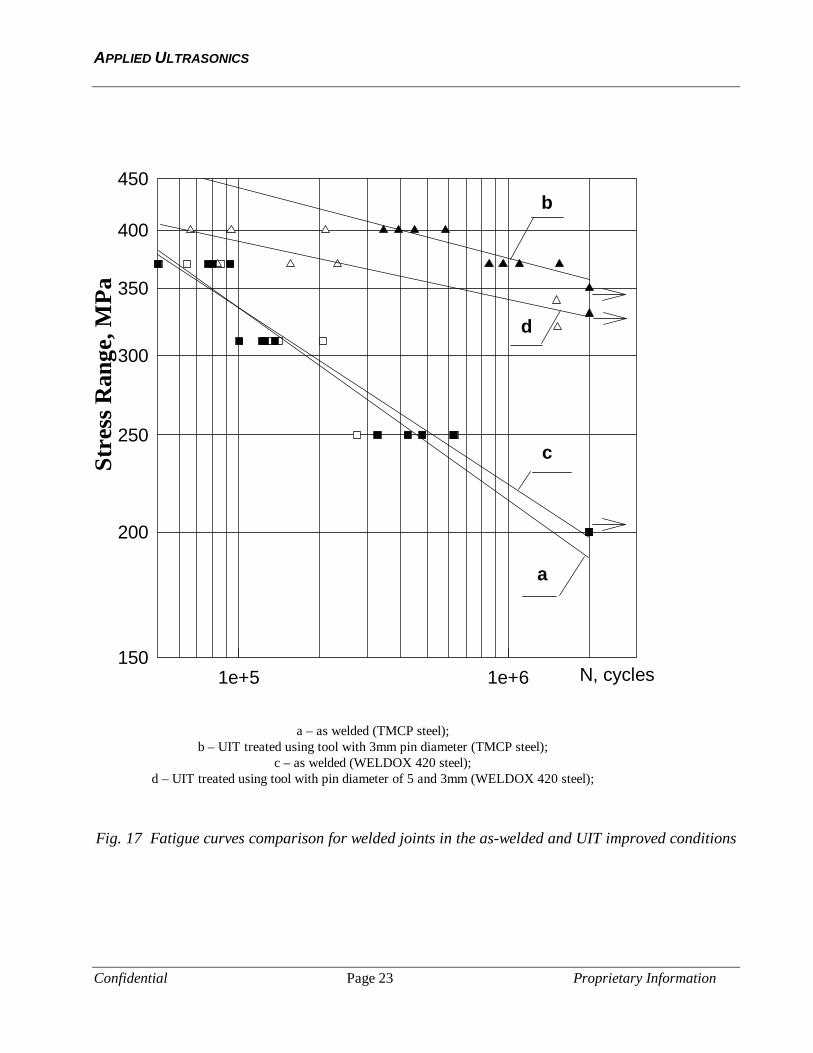
Fig. 16 Fatigue curves for welded joints in the as-welded and improved conditions The efficiency of hammer peening, shot peening, TIG dressing and combined treatment of TIG dressing and UIT was virtually the same. These improvement treatments have increased the ultimate stress range of the welded joint by 41-51%, as against the ultimate stress range of the as-welded joint. A highest 65% improvement in ultimate stress range at N=2x10⁶ cycles was obtained in the UIT treated joints. This was mainly due to increase in cyclic life of two specimens retreated by 3mm multi-pin tool, refer to Table 3 and Fig. 11. In short life region (N<1x10⁶ cycles) UIT efficiency is becoming commensurable to that of other techniques improving fatigue strength of welded joint incorporating transverse non-load carrying fillet welds. It seems likely that a greater increase in cyclic life of welded joint can also be achieved in short life region by UIT using multiple-pin tool wherein pin diameter is 3mm. The use of such a tool, apart from producing a smooth transition at the weld toe, additionally forms a groove on the rolled plate surface. In this connection, it would be appropriate to perform extra fatigue tests for WELDOX 420 welded joints that are UIT treated using such a tool. Especially as the previously fatigue test results obtained from one-type welded joints of TMCP steel (Re = 420MPa) fabricated at SSAB and UIT treated using such a tool are indicative of somewhat higher efficiency of this improvement method (Fig. 17).
APPLIED ULTRASONICS
Confidential Page 23 Proprietary Information
a – as welded (TMCP steel); b – UIT treated using tool with 3mm pin diameter (TMCP steel);
c – as welded (WELDOX 420 steel); d – UIT treated using tool with pin diameter of 5 and 3mm (WELDOX 420 steel);
Fig. 17 Fatigue curves comparison for welded joints in the as-welded and UIT improved conditions
N, cycles1e+5 1e+6
? ? , MPa
150
200
250
300
350
400
450
a
b
c
d
Stre
ss R
ange
, MPa
APPLIED ULTRASONICS
Confidential Page 24 Proprietary Information
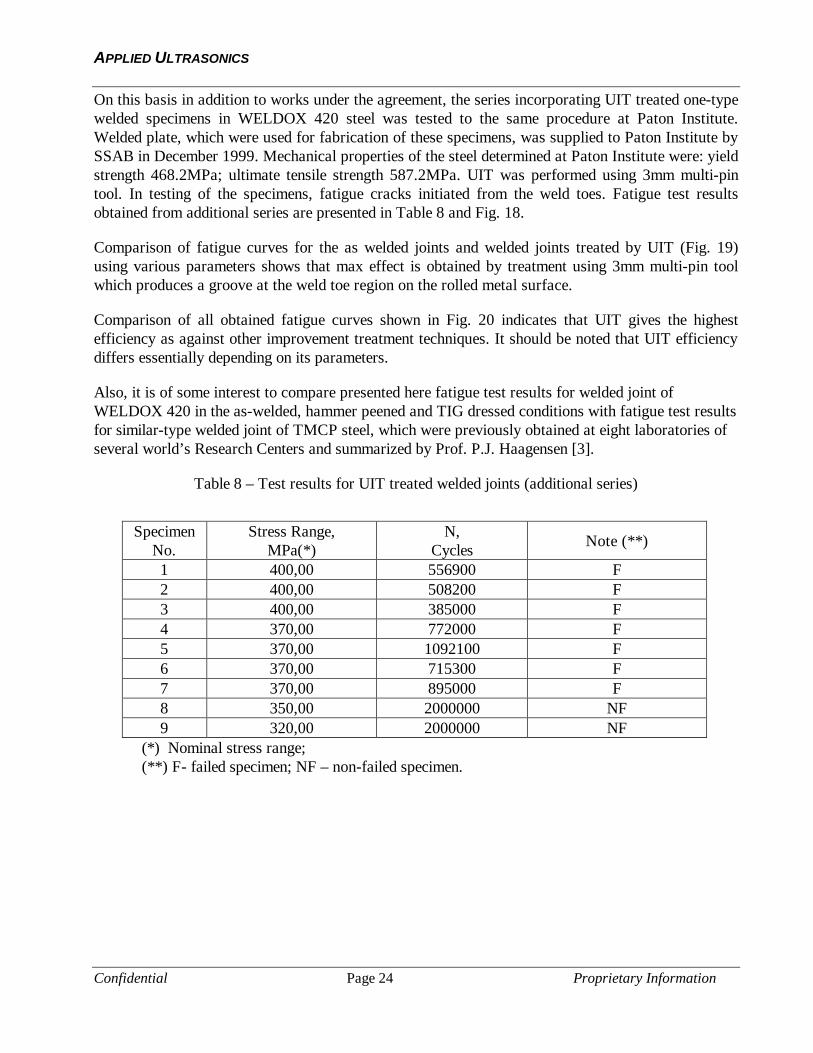
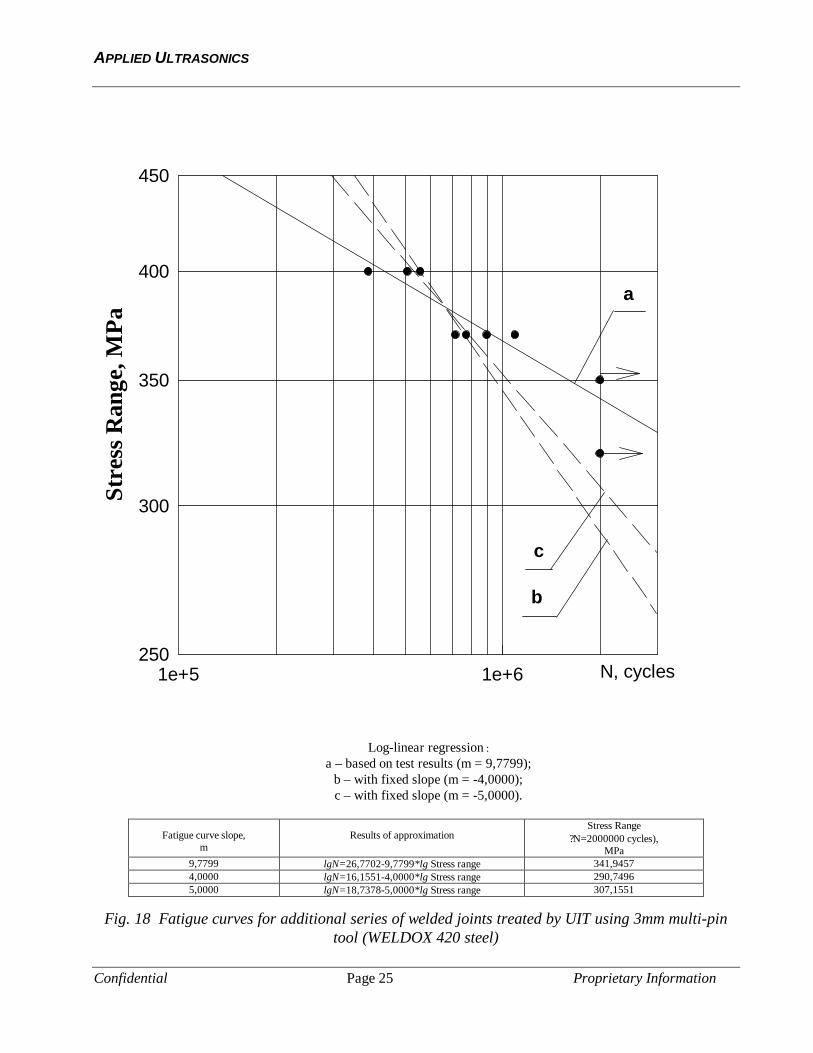
On this basis in addition to works under the agreement, the series incorporating UIT treated one-type welded specimens in WELDOX 420 steel was tested to the same procedure at Paton Institute. Welded plate, which were used for fabrication of these specimens, was supplied to Paton Institute by SSAB in December 1999. Mechanical properties of the steel determined at Paton Institute were: yield strength 468.2MPa; ultimate tensile strength 587.2MPa. UIT was performed using 3mm multi-pin tool. In testing of the specimens, fatigue cracks initiated from the weld toes. Fatigue test results obtained from additional series are presented in Table 8 and Fig. 18.
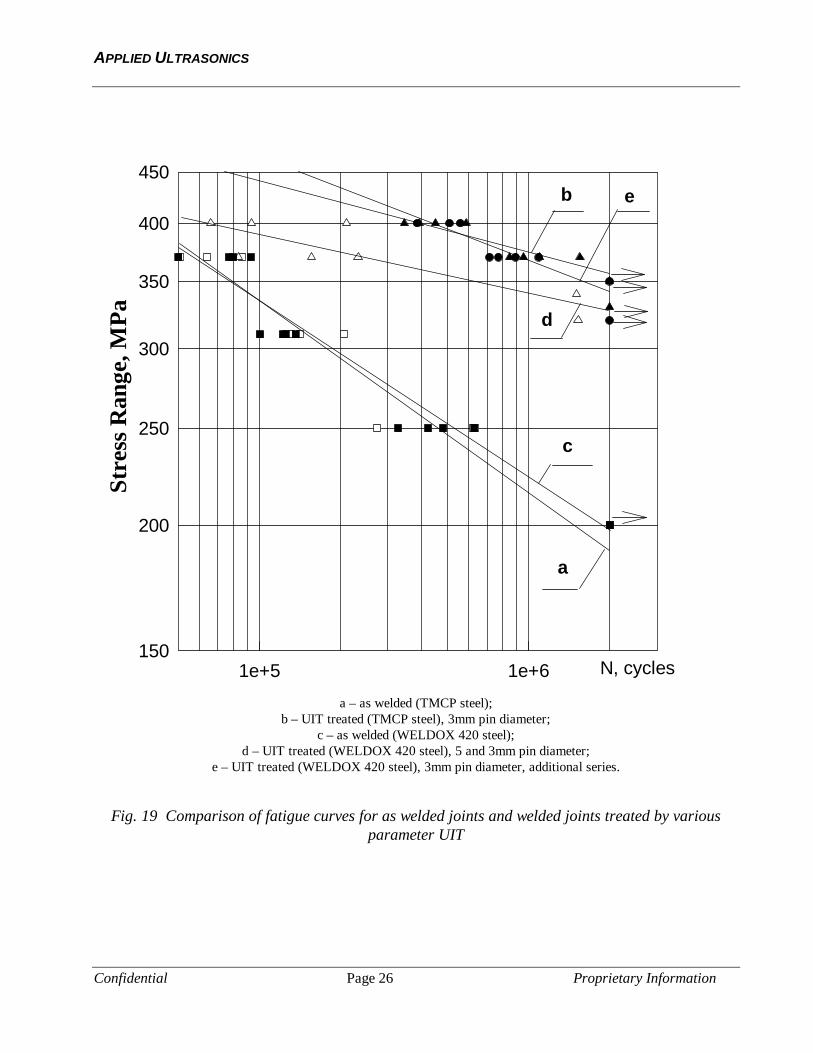
Comparison of fatigue curves for the as welded joints and welded joints treated by UIT (Fig. 19) using various parameters shows that max effect is obtained by treatment using 3mm multi-pin tool which produces a groove at the weld toe region on the rolled metal surface.
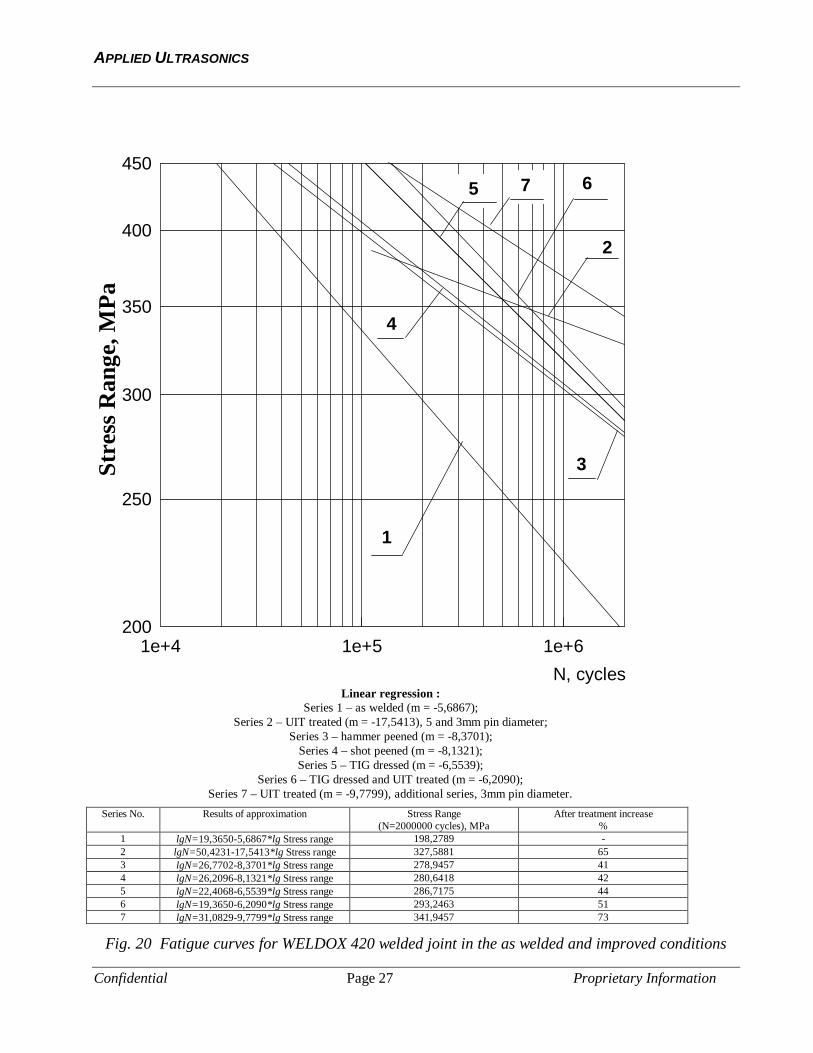
Comparison of all obtained fatigue curves shown in Fig. 20 indicates that UIT gives the highest efficiency as against other improvement treatment techniques. It should be noted that UIT efficiency differs essentially depending on its parameters.
Also, it is of some interest to compare presented here fatigue test results for welded joint of WELDOX 420 in the as-welded, hammer peened and TIG dressed conditions with fatigue test results for similar-type welded joint of TMCP steel, which were previously obtained at eight laboratories of several world’s Research Centers and summarized by Prof. P.J. Haagensen [3].
Table 8 – Test results for UIT treated welded joints (additional series)
Specimen No.
Stress Range, MPa(*)
N, Cycles
Note (**)
1 400,00 556900 F 2 400,00 508200 F 3 400,00 385000 F 4 370,00 772000 F 5 370,00 1092100 F 6 370,00 715300 F 7 370,00 895000 F 8 350,00 2000000 NF 9 320,00 2000000 NF
(*) Nominal stress range; (**) F- failed specimen; NF – non-failed specimen.
APPLIED ULTRASONICS
Confidential Page 25 Proprietary Information
Log-linear regression :
a – based on test results (m = 9,7799); b – with fixed slope (m = -4,0000); c – with fixed slope (m = -5,0000).
Fatigue curve slope, m
Results of approximation
Stress Range ?N=2000000 cycles),
MPa 9,7799 lgN=26,7702-9,7799*lg Stress range 341,9457 4,0000 lgN=16,1551-4,0000*lg Stress range 290,7496 5,0000 lgN=18,7378-5,0000*lg Stress range 307,1551
Fig. 18 Fatigue curves for additional series of welded joints treated by UIT using 3mm multi-pin tool (WELDOX 420 steel)
N, cycles1e+5 1e+6
? ? , MPa
250
300
350
400
450
a
b
c
Stre
ss R
ange
, MPa
APPLIED ULTRASONICS
Confidential Page 26 Proprietary Information
a – as welded (TMCP steel);
b – UIT treated (TMCP steel), 3mm pin diameter; c – as welded (WELDOX 420 steel);
d – UIT treated (WELDOX 420 steel), 5 and 3mm pin diameter; e – UIT treated (WELDOX 420 steel), 3mm pin diameter, additional series.
Fig. 19 Comparison of fatigue curves for as welded joints and welded joints treated by various parameter UIT
N, cycles1e+5 1e+6
? ? , MPa
150
200
250
300
350
400
450
a
b
c
d
e
Stre
ss R
ange
, MPa
APPLIED ULTRASONICS
Confidential Page 27 Proprietary Information
Linear regression : Series 1 – as welded (m = -5,6867);
Series 2 – UIT treated (m = -17,5413), 5 and 3mm pin diameter; Series 3 – hammer peened (m = -8,3701);
Series 4 – shot peened (m = -8,1321); Series 5 – TIG dressed (m = -6,5539);
Series 6 – TIG dressed and UIT treated (m = -6,2090); Series 7 – UIT treated (m = -9,7799), additional series, 3mm pin diameter.
Series No. Results of approximation Stress Range (N=2000000 cycles), MPa
After treatment increase %
1 lgN=19,3650-5,6867*lg Stress range 198,2789 - 2 lgN=50,4231-17,5413*lg Stress range 327,5881 65 3 lgN=26,7702-8,3701*lg Stress range 278,9457 41 4 lgN=26,2096-8,1321*lg Stress range 280,6418 42 5 lgN=22,4068-6,5539*lg Stress range 286,7175 44 6 lgN=19,3650-6,2090*lg Stress range 293,2463 51 7 lgN=31,0829-9,7799*lg Stress range 341,9457 73
Fig. 20 Fatigue curves for WELDOX 420 welded joint in the as welded and improved conditions
N, cycles1e+4 1e+5 1e+6
? ? , MPa
200
250
300
350
400
450
1
3
4
6
2
5 7
Stre
ss R
ange
, MPa
APPLIED ULTRASONICS
Confidential Page 28 Proprietary Information
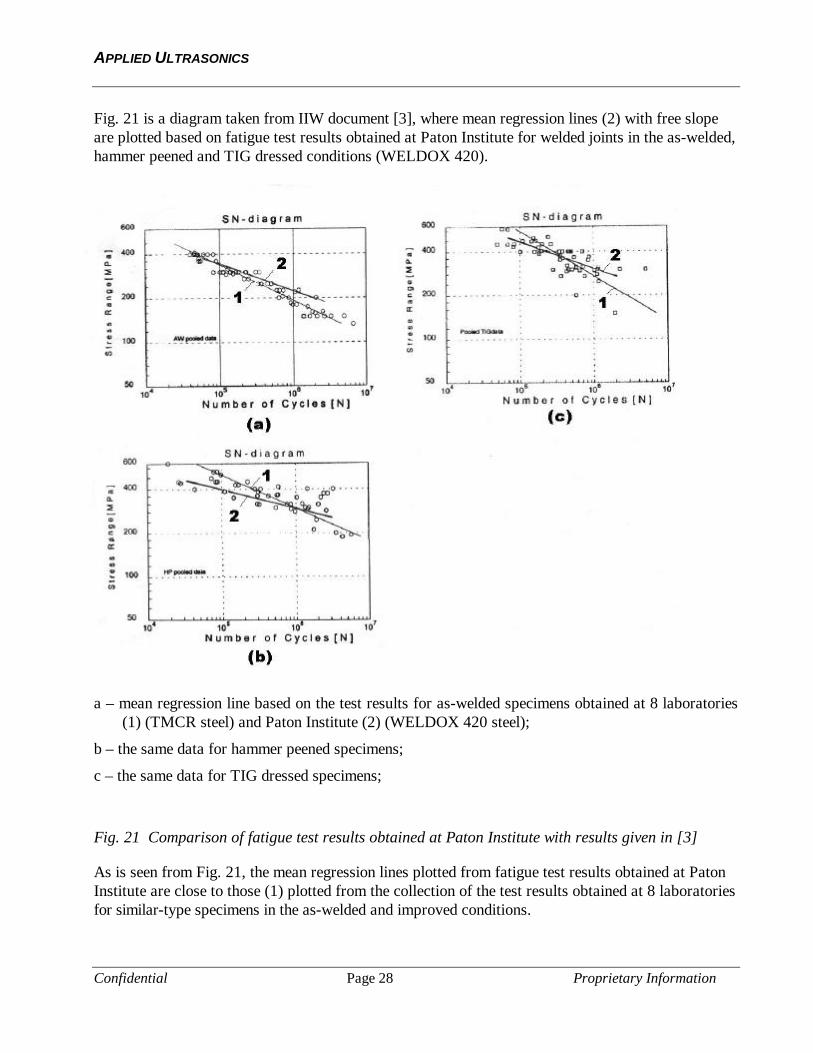
Fig. 21 is a diagram taken from IIW document [3], where mean regression lines (2) with free slope are plotted based on fatigue test results obtained at Paton Institute for welded joints in the as-welded, hammer peened and TIG dressed conditions (WELDOX 420).
a – mean regression line based on the test results for as-welded specimens obtained at 8 laboratories (1) (TMCR steel) and Paton Institute (2) (WELDOX 420 steel);
b – the same data for hammer peened specimens;
c – the same data for TIG dressed specimens;
Fig. 21 Comparison of fatigue test results obtained at Paton Institute with results given in [3]
As is seen from Fig. 21, the mean regression lines plotted from fatigue test results obtained at Paton Institute are close to those (1) plotted from the collection of the test results obtained at 8 laboratories for similar-type specimens in the as-welded and improved conditions.
APPLIED ULTRASONICS
Confidential Page 29 Proprietary Information
CONCLUSIONS
1. While using a single procedure the fatigue test results were obtained for WELDOX 420 welded joints in the as-welded and improved conditions to evaluate the effectiveness of the various improvement treatments.
2. The efficiency of hammer peening, shot peening, TIG dressing and TIG dressing with subsequent UIT was found to be virtually the same. These improvement treatments have increased the ultimate stress range by 41-51% as against the as-welded joint.
3. The highest improvement in ultimate stress range (65 –75%) was obtained in the UIT treated welded joints, where UIT efficiency differs significantly depending on its parameters. The highest effect was obtained in the UIT treated joints where groove was formed at the weld toe.
4. Comparison of the fatigue test results obtained from the WELDOX 420 welded joint in the as-welded, hammer peened and TIG dressed conditions with the results for similar-type joint of TMCP steel, which were previously obtained at 8 laboratories of several Research Centers and summarized by Prof. P.J. Haagensen, is indicative of their satisfactory agreement.
REFERENCES
1. Lieurade H.P., “Fatigue testing of Welded Components,” IIW Doc. XIII-1516, revision 2, May 1995.
2. Haagensen P.J., “IIW Collaborative Test Program on Improvement Methods,” IIW Doc. XIII-WG2-30, August 1994.
3. Haagensen P.J., “IIW’s Round Robin and Design Recommendations for Improvement Methods,” WRC Proceedings IIW. — pp. 305-316.
4. N. Draper, G. Smith. Applied Regression Analysis. - M.: Statistics, 1973. – p.524.