Efficiency and Productivity (TFP) of the Turkish Electricity Distribution Companies an Application...
11
Efficiency and productivity (TFP) of the Turkish electricity distribution companies: An application of two-stage (DEA&Tobit) analysis Aydın Çelen n Turkish Competition Authority, Üniversiteler Mahallesi 1597.Cadde No:9 Çankaya 06800, Ankara, Turkey HIGHLIGHTS We analyze the efficiencies of 21 Turkish electricity distribution companies. A two-stage analysis is employed to take into account environmental variables. We firstly calculate efficiencies of companies with DEA, then Tobit model is used to determine the effects of the variables. Customer density and ownership type affect the efficiencies positively. Privatization is a good strategy to improve efficiencies. article info Article history: Received 21 June 2013 Accepted 5 September 2013 Available online 27 September 2013 Keywords: Efficiency Productivity Two-stage analysis Electricity distribution market abstract In this study, we analyze the efficiency performances of 21 Turkish electricity distribution companies during the period of 2002–2009. For this aim, we employ a two-stage analysis in order to take into account the business environment variables which are beyond the control of distribution companies. We determine the efficiency performances of the electricity distribution companies by help of DEA in the first stage. Then, in the second stage, using these calculated efficiency scores as dependent variable, we utilize Tobit model to determine the business environment variables which may explain the efficiency scores. According to the results, customer density of the region and the private ownership affect the efficiencies positively. Thus, the best strategy to improve efficiency in the market is privatizing the public distribution companies. & 2013 Elsevier Ltd. All rights reserved. 1. Introduction In the recent decades, the electricity markets in most of the countries over the world have witnessed important regulatory re- forms. The main aim of these reforms is to improve the efficiency of the market by introducing competition. To achieve this, the incentive regulations are applied in the sense that the actual performances of electricity companies are compared against to some predefined reference or benchmark performance, and then good performances are rewarded. Thus, for electricity market regulation, the selection of the benchmark efficiency level and the method to measure the actual efficiency levels of the companies are very critical issues. There are several methods of benchmarking for performances of decision making units. The most popular ones are Data Envelopment Analysis (DEA) and Stochastic Frontier Analysis (SFA). DEA is based on linear programming whereas SFA employ econometric techniques. Since these two techniques are radically different, SFA and DFA met- hods have their own strengths and weaknesses. The main advantage of DEA is that it does not need any restriction on the functional form of the production relationship between inputs and outputs. SFA, in contrast, requires strong assumptions regarding the form of the fron- tier. Similarly, DEA does not require any assumption for the under- lying distribution of the inefficiency term while SFA imposes distribu- tional assumption on inefficiency term. As a result of having no assumptions regarding the form of the frontier and inefficiency term, standard DEA method is a deterministic method in nature. 1 In other words, all deviations from the efficiency frontier are assumed to be under control of the firm, so attributed as inefficiency. On the contrary, SFA can model the stochastic shocks by help of the random error introduced into the specification of the frontier. The importance of random error effects for Turkish electricity distribution market has been examined by four studies applying the SFA method, Bağdadioğlu and Weyman-Jones (2008); Contents lists available at ScienceDirect journal homepage: www.elsevier.com/locate/enpol Energy Policy 0301-4215/$ - see front matter & 2013 Elsevier Ltd. All rights reserved. http://dx.doi.org/10.1016/j.enpol.2013.09.034 n Tel.: þ90 3122914612; fax: þ90 3122667944. E-mail address: [email protected] 1 Several studies have aimed to provide a statistical foundation to DEA. One of these studies is Gitto and Mancuso (2012) which employ a bootstrapping technique. In addition, the efficiency estimations of DEA and SFA methods are frequently compared in literature, e.g. Murillo-Zamorano and Vega-Cervera (2001) and Park and Lesourd (2000). For a comprehensive survey on DEA, see Olesen (1995). Energy Policy 63 (2013) 300–310
-
Upload
muhammadfarid -
Category
Documents
-
view
3 -
download
1
description
determine the efficiency performances of the electricity distribution companies by help of DEA in the first stage. Then, in the second stage, using these calculated efficiency scores as dependent variable, we utilize Tobit model to determine the business environment variables which may explain the efficiency scores
Transcript of Efficiency and Productivity (TFP) of the Turkish Electricity Distribution Companies an Application...

Efficiency and productivity (TFP) of the Turkish electricity distributioncompanies: An application of two-stage (DEA&Tobit) analysis
Aydın Çelen n
Turkish Competition Authority, Üniversiteler Mahallesi 1597.Cadde No:9 Çankaya 06800, Ankara, Turkey
H I G H L I G H T S
� We analyze the efficiencies of 21 Turkish electricity distribution companies.� A two-stage analysis is employed to take into account environmental variables.� We firstly calculate efficiencies of companies with DEA, then Tobit model is used to determine the effects of the variables.� Customer density and ownership type affect the efficiencies positively.� Privatization is a good strategy to improve efficiencies.
a r t i c l e i n f o
Article history:Received 21 June 2013Accepted 5 September 2013Available online 27 September 2013
Keywords:EfficiencyProductivityTwo-stage analysisElectricity distribution market
a b s t r a c t
In this study, we analyze the efficiency performances of 21 Turkish electricity distribution companiesduring the period of 2002–2009. For this aim, we employ a two-stage analysis in order to take intoaccount the business environment variables which are beyond the control of distribution companies. Wedetermine the efficiency performances of the electricity distribution companies by help of DEA in thefirst stage. Then, in the second stage, using these calculated efficiency scores as dependent variable, weutilize Tobit model to determine the business environment variables which may explain the efficiencyscores. According to the results, customer density of the region and the private ownership affect theefficiencies positively. Thus, the best strategy to improve efficiency in the market is privatizing the publicdistribution companies.
& 2013 Elsevier Ltd. All rights reserved.
1. Introduction
In the recent decades, the electricity markets in most of thecountries over the world have witnessed important regulatory re-forms. The main aim of these reforms is to improve the efficiency ofthe market by introducing competition. To achieve this, the incentiveregulations are applied in the sense that the actual performances ofelectricity companies are compared against to some predefinedreference or benchmark performance, and then good performancesare rewarded. Thus, for electricity market regulation, the selection ofthe benchmark efficiency level and the method to measure the actualefficiency levels of the companies are very critical issues.
There are several methods of benchmarking for performances ofdecision making units. The most popular ones are Data EnvelopmentAnalysis (DEA) and Stochastic Frontier Analysis (SFA). DEA is based onlinear programming whereas SFA employ econometric techniques.Since these two techniques are radically different, SFA and DFA met-hods have their own strengths and weaknesses. The main advantage
of DEA is that it does not need any restriction on the functional formof the production relationship between inputs and outputs. SFA, incontrast, requires strong assumptions regarding the form of the fron-tier. Similarly, DEA does not require any assumption for the under-lying distribution of the inefficiency term while SFA imposes distribu-tional assumption on inefficiency term. As a result of having noassumptions regarding the form of the frontier and inefficiency term,standard DEA method is a deterministic method in nature.1 In otherwords, all deviations from the efficiency frontier are assumed to beunder control of the firm, so attributed as inefficiency. On the contrary,SFA can model the stochastic shocks by help of the random errorintroduced into the specification of the frontier.
The importance of random error effects for Turkish electricitydistribution market has been examined by four studies applyingthe SFA method, Bağdadioğlu and Weyman-Jones (2008);
Contents lists available at ScienceDirect
journal homepage: www.elsevier.com/locate/enpol
Energy Policy
0301-4215/$ - see front matter & 2013 Elsevier Ltd. All rights reserved.http://dx.doi.org/10.1016/j.enpol.2013.09.034
n Tel.: þ90 3122914612; fax: þ90 3122667944.E-mail address: [email protected]
1 Several studies have aimed to provide a statistical foundation to DEA. One ofthese studies is Gitto and Mancuso (2012) which employ a bootstrappingtechnique. In addition, the efficiency estimations of DEA and SFA methods arefrequently compared in literature, e.g. Murillo-Zamorano and Vega-Cervera (2001)and Park and Lesourd (2000). For a comprehensive survey on DEA, see Olesen(1995).
Energy Policy 63 (2013) 300–310

Bağdadioğlu and Senyücel (2010); Çelen (2011) and Çelen (2013a).All of these studies reached to the conclusion that the technicalinefficiency component of the error term in the SFA specificationdominates the random noise component. This finding means thatthe random error effects are of little importance in Turkishelectricity distribution market, thus instead of SFA, the determi-nistic methods such as DEA and Corrected Ordinary Least Squares(COLS) can be safely used in the efficiency analysis of this market.For this reason, in this study, we utilized the DEA method toanalyze the efficiency performances of 21 Turkish electricitydistribution companies between 2002 and 2009. However, differ-ent from standard DEA applications, we employed a two-stageanalysis in order to take into account business environmentvariables which are beyond the control of distribution companies.To be more specific, we determined the technical efficiencyperformances of the electricity distribution companies by help ofDEA in the first stage. Then, in the second stage, using thesecalculated efficiency scores as dependent variable, we used regres-sion technique called Tobit model (Tobin, 1958) to determine thevariables which may explain the efficiency scores.
The structure of the study is as follows: in Section 2, theempirical studies analyzing the efficiency of Turkish electricitydistribution market will be reviewed. Section 3 explains themethodology of two-stage analysis. In Section 4, the results ofthe empirical analysis are presented. And in Section 5, weconclude the study.
2. Literature review
The electricity markets in most of the countries have alwaysbecome a good candidate to apply the efficiency measurementmethods mainly because of the reasons outlined above. Turkey isnot an exception to this. To the best of our knowledge, there exist19 studies measuring efficiency in the Turkish electricity market.2
Among them, 16 studies aim to measure the efficiency of elec-tricity distribution companies, while only three are related withthe electricity generating power market. Since in this study weaim to assess the efficiency performances of the electricitydistribution companies, we reviewed only studies which arerelated with distribution segment. These studies are summarizedin Table 1.
Out of 16 studies reviewed, 10 applied DEA method, 5 utilizedSFA and 1 utilized Technique for the Order Preference by Similarityto Ideal Solution (TOPSIS) method in order to rank Turkishelectricity distribution companies. All studies reviewed in ourstudy use input-oriented model specification. Indeed, this isunderstandable in the case of electricity companies: In Turkishelectricity distribution market, similar to those of other countries,companies have been responsible from serving all customers,making the outputs as exogenous.
The issue of consistency between efficiency estimations of thestudies reviewed is rather important given that ultimate aim is, atleast indirectly, to use these estimations in regulatory proceedingsto set tariffs. Thus, comparing estimations of these studies adopt-ing different model specifications, we cannot observe a solidconsistency between their efficiency estimations. However, thestudies reviewed can draw a robust conclusion regarding theefficiency performances of public and private companies: on thistopic, we can conveniently claim that in Turkey private electricitydistribution companies are more efficient than their publiccounterparts.
3. Methodology of two-stage analysis
Different from parametric methods such as SFA, the standardDEA models incorporate only variables whose values can bechanged in a reasonable time period by decision making units.These kind of controllable variables are called as discretionaryvariables. In addition to discretionary variables, some non-discretionary variables, also known as environmental variablesmay affect efficiency performances of the firms.3 Two-stageanalysis is one of the popular techniques in literature to take intoaccount the variables which are, at least in the short run, beyondthe control of the firms.4 In this study, we employed this techniqueas follows: in the first stage, we determined the technicalefficiency performances of the electricity distribution firms byhelp of DEA. Then, in the second stage, using these calculatedefficiency scores as dependent variable, we used regressiontechnique to determine the environmental variables which mayexplain the efficiency scores. Efficiency scores calculated from DEAtake values from interval 0 and 1, making the dependent variablein the second stage censored by nature. Thus, the Tobit model(Tobin, 1958) is frequently used in literature to deal with suchlimited dependent variable, which is followed in this study.
Fig. 1 illustrates the two-stage analysis graphically for a simplecase with one input and one output, which is adopted from Afonsoand Aubyn (2006). Firm A located on the production possibilityfrontier is full-efficient while firm B is not. The (input-oriented)efficiency score of the firm B is equal to x1=x2. Some part of theinefficiency of firm B may be attributed to unfavorable environ-mental factors. In other words, inefficient usage of inputs andunfavorable environmental factors may jointly force firm B to usemore inputs, x2, than the theoretical minimum level, namely x1.Once the relevant unfavorable environmental factor disappeared,firm B could produce the same amount of output (y0) with lessinput, namely x3. In other words, firm B was situated a point, suchas B′, which is closer to the production frontier. In this new morefavorable situation, the efficiency of the firm B increased fromx1=x2 to x1=x3.
3.1. DEA
Boles (1966) and Shephard (1970) suggested a linear program-ming method to determine the efficient frontier as a piecewise-linear convex hull. However, this mathematical programmingmethod has gained popularity with Charnes et al. (1978), in whichthis method was first named as data envelopment analysis (DEA).
Charnes et al. (1978) proposed an input-oriented approach tomeasure efficiency assuming constant returns to scale (CRS). Then,Fare et al. (1983) and Banker et al. (1984) relaxed the CRSassumption and extended the model with variable returns to scale(VRS) assumption. We start with the linear programming problemcorresponding to the basic input-oriented DEA specification ofCharnes et al. (1978) under CRS assumption, which is known asthe CCR model. Then we expand the model to incorporate the caseof VRS, which is known as the BCC model.
2 For a comprehensive review of the empirical studies measuring technicalefficiency of Turkish electricity market, see Çelen (2013b).
3 At this point, it should be clarified that all non-discretionary variables arecalled “environmental”. Thus, this definition includes not only environmentvariables such precipitation, CO2 concentration etc., but also business environmentconditions which are beyond the control of the firms. In this study, we aim toconcentrate on the business environment of the firms.
4 Pombo and Taborda (2006) applied a similar two-stage procedure toColombian electricity distribution market, and concluded that the privatizationsin the market increased the efficiencies of the distribution firms. Perez-Reyes andTovar (2009) also utilized two-stage analysis, and reached the conclusion thatreforms in Peru improved the efficiency performances of the electricitydistribution firms.
A. Çelen / Energy Policy 63 (2013) 300–310 301
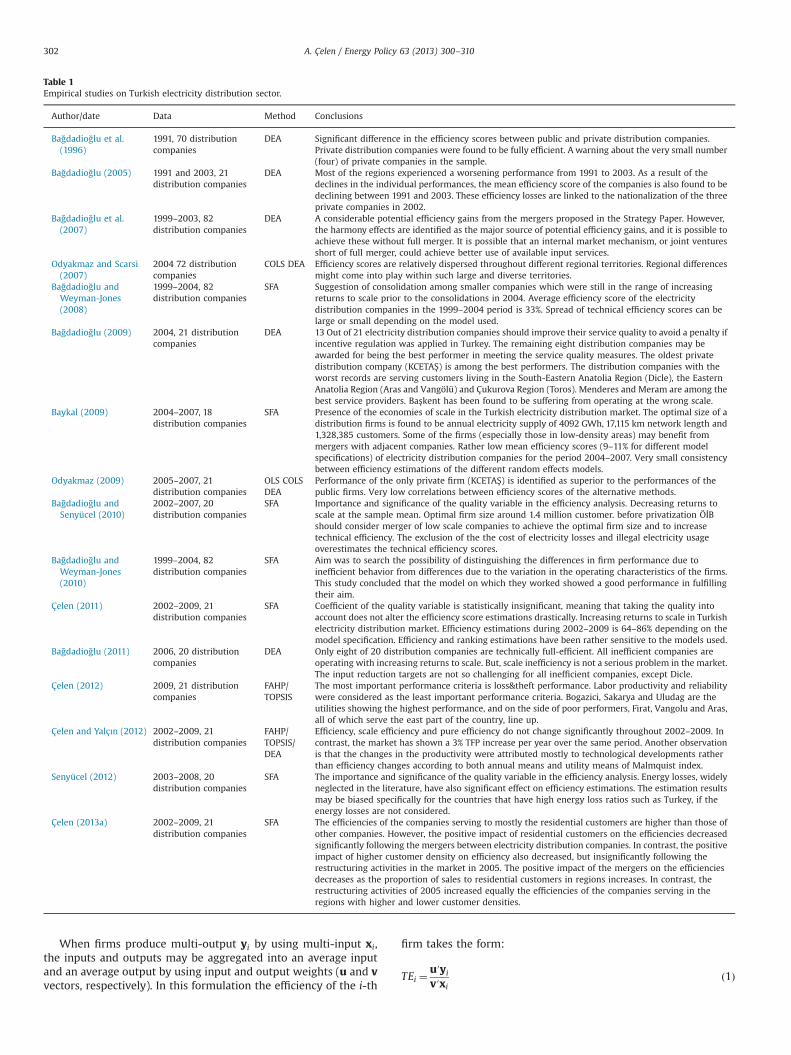
When firms produce multi-output yi by using multi-input xi,the inputs and outputs may be aggregated into an average inputand an average output by using input and output weights (u and vvectors, respectively). In this formulation the efficiency of the i-th
firm takes the form:
TEi ¼u′yiv′xi
ð1Þ
Table 1Empirical studies on Turkish electricity distribution sector.
Author/date Data Method Conclusions
Bağdadioğlu et al.(1996)
1991, 70 distributioncompanies
DEA Significant difference in the efficiency scores between public and private distribution companies.Private distribution companies were found to be fully efficient. A warning about the very small number(four) of private companies in the sample.
Bağdadioğlu (2005) 1991 and 2003, 21distribution companies
DEA Most of the regions experienced a worsening performance from 1991 to 2003. As a result of thedeclines in the individual performances, the mean efficiency score of the companies is also found to bedeclining between 1991 and 2003. These efficiency losses are linked to the nationalization of the threeprivate companies in 2002.
Bağdadioğlu et al.(2007)
1999–2003, 82distribution companies
DEA A considerable potential efficiency gains from the mergers proposed in the Strategy Paper. However,the harmony effects are identified as the major source of potential efficiency gains, and it is possible toachieve these without full merger. It is possible that an internal market mechanism, or joint venturesshort of full merger, could achieve better use of available input services.
Odyakmaz and Scarsi(2007)
2004 72 distributioncompanies
COLS DEA Efficiency scores are relatively dispersed throughout different regional territories. Regional differencesmight come into play within such large and diverse territories.
Bağdadioğlu andWeyman-Jones(2008)
1999–2004, 82distribution companies
SFA Suggestion of consolidation among smaller companies which were still in the range of increasingreturns to scale prior to the consolidations in 2004. Average efficiency score of the electricitydistribution companies in the 1999–2004 period is 33%. Spread of technical efficiency scores can belarge or small depending on the model used.
Bağdadioğlu (2009) 2004, 21 distributioncompanies
DEA 13 Out of 21 electricity distribution companies should improve their service quality to avoid a penalty ifincentive regulation was applied in Turkey. The remaining eight distribution companies may beawarded for being the best performer in meeting the service quality measures. The oldest privatedistribution company (KCETAŞ) is among the best performers. The distribution companies with theworst records are serving customers living in the South-Eastern Anatolia Region (Dicle), the EasternAnatolia Region (Aras and Vangölü) and Çukurova Region (Toros). Menderes and Meram are among thebest service providers. Başkent has been found to be suffering from operating at the wrong scale.
Baykal (2009) 2004–2007, 18distribution companies
SFA Presence of the economies of scale in the Turkish electricity distribution market. The optimal size of adistribution firms is found to be annual electricity supply of 4092 GWh, 17,115 km network length and1,328,385 customers. Some of the firms (especially those in low-density areas) may benefit frommergers with adjacent companies. Rather low mean efficiency scores (9–11% for different modelspecifications) of electricity distribution companies for the period 2004–2007. Very small consistencybetween efficiency estimations of the different random effects models.
Odyakmaz (2009) 2005–2007, 21distribution companies
OLS COLSDEA
Performance of the only private firm (KCETAŞ) is identified as superior to the performances of thepublic firms. Very low correlations between efficiency scores of the alternative methods.
Bağdadioğlu andSenyücel (2010)
2002–2007, 20distribution companies
SFA Importance and significance of the quality variable in the efficiency analysis. Decreasing returns toscale at the sample mean. Optimal firm size around 1.4 million customer. before privatization ÖİBshould consider merger of low scale companies to achieve the optimal firm size and to increasetechnical efficiency. The exclusion of the the cost of electricity losses and illegal electricity usageoverestimates the technical efficiency scores.
Bağdadioğlu andWeyman-Jones(2010)
1999–2004, 82distribution companies
SFA Aim was to search the possibility of distinguishing the differences in firm performance due toinefficient behavior from differences due to the variation in the operating characteristics of the firms.This study concluded that the model on which they worked showed a good performance in fulfillingtheir aim.
Çelen (2011) 2002–2009, 21distribution companies
SFA Coefficient of the quality variable is statistically insignificant, meaning that taking the quality intoaccount does not alter the efficiency score estimations drastically. Increasing returns to scale in Turkishelectricity distribution market. Efficiency estimations during 2002–2009 is 64–86% depending on themodel specification. Efficiency and ranking estimations have been rather sensitive to the models used.
Bağdadioğlu (2011) 2006, 20 distributioncompanies
DEA Only eight of 20 distribution companies are technically full-efficient. All inefficient companies areoperating with increasing returns to scale. But, scale inefficiency is not a serious problem in the market.The input reduction targets are not so challenging for all inefficient companies, except Dicle.
Çelen (2012) 2009, 21 distributioncompanies
FAHP/TOPSIS
The most important performance criteria is loss&theft performance. Labor productivity and reliabilitywere considered as the least important performance criteria. Bogazici, Sakarya and Uludag are theutilities showing the highest performance, and on the side of poor performers, Firat, Vangolu and Aras,all of which serve the east part of the country, line up.
Çelen and Yalçın (2012) 2002–2009, 21distribution companies
FAHP/TOPSIS/DEA
Efficiency, scale efficiency and pure efficiency do not change significantly throughout 2002–2009. Incontrast, the market has shown a 3% TFP increase per year over the same period. Another observationis that the changes in the productivity were attributed mostly to technological developments ratherthan efficiency changes according to both annual means and utility means of Malmquist index.
Senyücel (2012) 2003–2008, 20distribution companies
SFA The importance and significance of the quality variable in the efficiency analysis. Energy losses, widelyneglected in the literature, have also significant effect on efficiency estimations. The estimation resultsmay be biased specifically for the countries that have high energy loss ratios such as Turkey, if theenergy losses are not considered.
Çelen (2013a) 2002–2009, 21distribution companies
SFA The efficiencies of the companies serving to mostly the residential customers are higher than those ofother companies. However, the positive impact of residential customers on the efficiencies decreasedsignificantly following the mergers between electricity distribution companies. In contrast, the positiveimpact of higher customer density on efficiency also decreased, but insignificantly following therestructuring activities in the market in 2005. The positive impact of the mergers on the efficienciesdecreases as the proportion of sales to residential customers in regions increases. In contrast, therestructuring activities of 2005 increased equally the efficiencies of the companies serving in theregions with higher and lower customer densities.
A. Çelen / Energy Policy 63 (2013) 300–310302

A common set of weights (u and v) is valid for each firm in thisformulation, meaning that the importance given to the inputs andoutputs are the same for all the firms under study. Charnes et al.(1978) relaxed this restriction and let each firm use its own set ofweights.
Assume that there are N inputs and M outputs for each of Ifirms. The column vectors xi and yi represent the input and outputvector for i-th firm. X is a N� I input matrix and Y is a M� I outputmatrix for all I firms. For each firm, we continue measuring theratio of all outputs over all inputs, u′yi=v′xi, where u is an M�1vector of output weights and v is a N�1 vector of input weights.The optimal weights of i-th firm are found by solving the followingmathematical programming problem:
maxu;v ðu′yi=v′xiÞst ðu′yj=v′xjÞr1; j¼ 1;2; :::; I
u; vZ0ð2Þ
According to this specification, optimal values of u and v for thei-th firm are searched, such that the efficiency measure of this firmis maximized, subject to the constraints that efficiency measuresof all firms must be less than or equal to one. Solving thismathematical programming for each of the I firms, the mostfavorable set of weights for each firm is determined.
If ðun; vnÞ is a solution to the mathematical programming givenabove, then ðαun; αvnÞ is another solution, meaning that we faceinfinite number of solutions (Coelli et al., 2005). To avoid thisproblem, Charnes et al. (1978) imposed the constraint v′xi ¼ 1.With this new constraint, the linear programming takes the form
maxμ;ν ðμ′yiÞst ν′xi ¼ 1;
μ′yj�ν′xjr0; j¼ 1;2; :::; Iμ; νZ0
ð3Þ
Since this mathematical programming is different from the pre-vious one, we changed the notation from u and v to μ and v, asused in Coelli et al. (2005). This form of the DEA model is knownas the multiplier form. Taking its dual, we can obtain theenvelopment form of the DEA model:
minθ;λθ
st �qiþYλZ0;θxi�XλZ0;λZ0
ð4Þ
The envelopment form and then seeks to radially contract theinput vector xi of i-th firm, as much as possible, while stillremaining in the feasible output set. Thus, similar to the multiplierform, the envelopment form is also solved for each of the I firms.In the envelopment form, θ is the amount of radial reduction in theuse of each input without any change in outputs. Thus, scalar θ
represent technical efficiency of the relevant i-th firm. In thisspecification, λ is a I�1 vector of constants.
To leave the assumption of CRS and allow the VRS (increasingor decreasing returns to scale), one more constraint should beadded to the specification of Charnes et al. (1978). This constraintis that 1′λ¼ 1, implying that the sum of the linear combinationparameters should be equal to 1.
Since the position of the piece-wise efficient frontier changes ineach time period, it is not possible to analyze the efficiencies overtime just by examining the individual yearly efficiency scores.To do inter-temporal comparisons of efficiencies, the Malmqvistindex approach can be used.
The distance functions are used in order to explain theMalmqvist index approach. An input distance function at periods demonstrates the minimal proportional (radial) contraction ofthe input vector, given an output vector. It is defined on the inputset, L(y), as:
dsI ðxs; ysÞ ¼ max fρ : ðxs=ρÞALðysÞg ð5Þ
Then, the Malmqvist input productivity index comparing periods sand sþ1 can be defined by using four combinations of inputdistance functions in periods s and sþ1:
mIðxsþ1; ysþ1;xs;ysÞ ¼
ffiffiffiffiffiffiffiffiffiffiffiffiffiffiffiffiffiffiffiffiffiffiffiffiffiffiffiffiffiffiffiffiffiffiffiffiffiffiffiffiffiffiffiffiffiffiffiffiffiffiffiffiffiffiffiffiffiffiffiffiffiffiffiffiffiffidsI ðxsþ1; ysþ1Þ
dsI ðxs; ysÞdsþ1I ðxsþ1; ysþ1Þdsþ1I ðxs; ysÞ
vuut ð6Þ
This equation can be written alternatively as follows:
mIðxsþ1; ysþ1;xs; ysÞ ¼ dsþ1I ðxsþ1; ysþ1Þ
dsI ðxs; ysÞ
ffiffiffiffiffiffiffiffiffiffiffiffiffiffiffiffiffiffiffiffiffiffiffiffiffiffiffiffiffiffiffiffiffiffiffiffiffiffiffiffiffiffiffiffiffiffiffiffiffiffiffiffiffiffiffiffiffiffiffiffidsI ðxsþ1; ysþ1Þ
dsþ1I ðxsþ1; ysþ1Þ
dsI ðxs; ysÞdsþ1I ðxs; ysÞ
s
ð7Þ
In this equation, the first ratio measures the change in efficiencybetween periods s and sþ1, and the geometric mean of the ratios inthe second term measures the shift in technology between twoperiods.
The required distance functions can be found as follows in theenvelopment form of the DEA model:
dtI ðxr ; yrÞ minθ;λθ
st �qti þYrλZ0;
θxti �XrλZ0;
λZ0
ð8Þ
where t and r represent the possible combinations of time periodss and sþ1.
3.2. Tobit
When the efficiency scores generated from DEA is used asdependent variable in a regression, we encounter a good exampleof censoring, meaning that the values of the dependent variableare restricted to a range of values. To be more specific, censoringoccurs when dependent variable is only observed for a subsample;in contrast, information about the independent variables for thewhole sample is available. In our case, all firms placed on thefrontier are considered as full-efificient, and takes the value of 1 asefficiency score, although their efficiency levels are probably notequal, indeed. Thus, to determine the drivers of the efficiency ofthe distribution firms, the Tobit model (also known as thecensored regression model) is estimated. The Tobit model maybe explained as follows (Perez-Reyes and Tovar, 2009):
To define the observed (i.e. calculated from DEA in the firststage) efficiency score ðδitÞ which is between 0 and 1 in terms ofsome environmental variables ðzitÞ, a latent random variable ðδnitÞ
y0
x2
B’ BA
input
output
x3x1
Fig. 1. DEA method and environmental variables.
A. Çelen / Energy Policy 63 (2013) 300–310 303

which is dependent on the same environmental variables isdescribed:
δnit ¼ z′itβþεit with εit �Nð0; s2Þ ð9Þwhere zit is a (r�1) vector of environmental variables, and β is a(r�1) vector of parameters to be estimated.5
Utilizing this latent variable, the observed efficiency score ðδitÞ canbe defined in such a way that it is censored below 0 and above 1:
δit ¼δnit if 0oδnito10 for other values of δnit
(ð10Þ
The Tobit model structured in this way can be estimated by themaximum likelihood method. Direct OLS regression of the calculatedefficiency scores from DEA ðδitÞ on environmental variables ðzitÞyields inconsistent estimates of β. The same inconsistency problemoccurs when only the observations fully observed, i.e. uncensoredsample, 0oδito1, are used.6
Although frequently employed in literature to take into accountenvironmental variables in the two-stage analysis, Tobit models haveseveral limitations, most of which are addressed by Simar andWilson (2000, 2007). The most important problem with the Tobitmodels is that the environmental variables used in Tobit models areprobably correlated with the efficiency scores calculated in the firststage, leading to the inconsistency problem of estimators. Anotherproblem may emerge because of the sample selection of the firms(Perez-Reyes and Tovar, 2009). To overcome the inconsistencyproblem, Simar and Wilson (2007) proposed bootstrap procedures.In this study, we are contented with Tobit application due to severalreasons: First, the environmental variables are selected in such a waythat the correlation between them and efficiency scores are mini-mized. Second, even if inconsistency problem may emerge, it is notclear that bootstrap estimates are necessarily more reliable given thatbootstrap procedures relied on a set of assumptions about datagenerating process (Afonso and Aubyn, 2006). Third, we do not facewith sample selection problem because of the fact that our data setcovers all firms in the electricity distribution market.
4. Empirical analysis
4.1. Data
The selection of input and output variables is very crucial in DEAapplications aiming to measure the efficiencies of decision makingunits. The availability of data and the previous studies mostlydetermine the inputs and outputs. Having a rather extensive dataset, we just benefited from the extensive review by Jamasb andPollitt (2001) in selecting the input and output variables.
According to the review by Jamasb and Pollitt (2001), the mostwidely used output variables in 20 benchmarking studies reviewedare electricity delivered in MWh and number of customers. Thus, weused these two variables as output, denoted by y1 and y2, respectively.
The number of employees, x1, the length of the distribution line inkm, x2, transformer capacity in MVA, x3 and the quality of electricity,x4 are used as input variables. We considered the labor input vianumber of employees. Capital input was taken into account by othertwo variables, the length of the distribution line and transformercapacity. These three variables have been similarly found to be themost widely used input variables in Jamasb and Pollitt (2001).
Following Growitsch et al. (2009), we prefer to use the averageduration of blackouts per customer as a proxy for electricity quality.7
The loss/theft of electricity is an important problem in Turkey,especially in eastern part of the country. Since the distributorshave rather limited capability, if any, in controlling the loss/theft ofelectricity, the loss/theft ratio of electricity can be considered as aninput or an environmental variable. Thus, we generated twodifferent models according to the usage of the loss/theft ofelectricity in the model. Model specifications are illustrated inTable 2. Model-1 uses the loss/theft of electricity as an inputvariable, denoted by x5. Alternatively in model-2, the loss/theft ofelectricity is defined as an environmental variable, denoted by z5.
Other environmental variables which have the potential toaffect the technical efficiencies of the distribution firms, butmostly not under their control, are defined as follows:
The first environmental variable z1 is to consider the differ-ences in the customer densities of regions (measured in number ofcustomers per km of distribution line). An expectation of positiverelationship between customer density of regions and efficiency offirm serving the relevant regions may be easily posed.
The second environmental variable is the customer structure ofthe regions, z2, which is defined as proportion of sales in MWh toresidential customers to total sales. In contrast to the customerdensity, we do not pose a priori expectations on the effect of thecustomer structure on the efficiency estimation.
In order to capture the effects of the mergers between electricitydistribution organizations in 2004 on their efficiency levels, we useda dummy variable (z3) as another environmental variable. Thisdummy variable takes the value 1 from 2005 (the year just afterthe mergers between electricity distribution organizations) on.
Another environmental variable (z4) is also a dummy variable,evaluating the effect of the ownership on the efficiency of theelectricity companies.8 Some theoretical models such as publicchoice theory and principal agent theory claim that privateenterprises show superior performance in comparison to publiccompanies.9 However, empirical studies on electricity sector fromdifferent regions of the world produce contradictory results.10
As for Turkish electricity distribution market, we identified fourstudies evaluating the effect of the ownership on efficiency.11 All ofthese studies witnessed that private distribution firms havinghigher efficiency scores than their public counterparts.
Data set used in this study covers annual data on 21 electricitydistribution firms over the eight-year period from 2002 to 2009.This data is obtained from the web page of TEDAŞ. Descriptivestatistics over the variables are shown in Table 3. In the first stageof the study, the DEAP program is used to determine efficiency
5 The estimated coefficients in the Tobit regression are interpreted in thesimilar manner to OLS regression coefficients; however, one should bear in mindthat the linear effect is on the uncensored latent variable, not the observedoutcome.
6 See Greene (2000) for the inconsistency of OLS estimations in the case oflimited dependent variables such as censoring.
7 Similarly, Bağdadioğlu and Senyücel (2010) and Çelen (2011) also used theaverage outage duration per consumer for the quality variable. Coelli et al. (2008),on the other hand, preferred to use total number of outages for this input variable.Differently from other studies in the efficiency literature, Çelen and Yalçın (2012)generated a “quality of service variable” using the TOPSIS method in order to use ina standard DEA application.
8 Given that the number of observations related with private firms arerelatively small (11 out of 168), one should be cautious about the comments onthe relationship between ownership and efficiency.
9 According to public choice theory, bureaucrats maximize their own benefitsand not the common interest, which leads to political patronage and otherproblems. As for principal agent theory, asymmetric information leads to thecapture of rents by bureaucrats (Vining and Boardman, 1992).
10 Some of the studies showing that privately owned companies are moreefficient are Zeitsch and Lawrence (1996) and Kumbhakar and Hjalmarsson (1998).In contrast, several studies such as Cote (1989) and Kwoka (2005) claimed thatpublicly owned utilities operate more efficiently. Pollitt (1995) and Pombo andTaborda (2006) find that ownership has no effect on efficiency.
11 These studies are Bağdadioğlu et al. (1996), Bağdadioğlu (2005); Odyakmaz(2009) and Bağdadioğlu (2009).
A. Çelen / Energy Policy 63 (2013) 300–310304

performances of the companies. In the second stage, to estimatethe Tobit models, Stata package program is used.12
4.2. Determining efficiencies: DEA results
Table 4 presents the constant returns to scale technical effi-ciency (CRSTE) scores and ranking of the companies which arecalculated from Model-1. These scores are used as the dependentvariable in the second stage of the study. According to CRSTEscores, the companies which are full-efficient during all periodexamined in this study (2002–2009) are AYEDAŞ, Boğaziçi, Çoruh,Dicle and Yeşilırmak, while Meram appears as the most inefficientfirm during this period. Fırat and KCETAŞ are other companieswith low efficiency levels. As can be seen from the bottom line ofthe table, the average efficiency (CRSTE) levels in the electricitydistribution market are rather high, mostly higher than 0.90.
Relying on constant rates of return assumption imply that theelectricity distribution companies are operating at their optimalscale. Leaving this assumption provides the opportunity to take intoaccount scale efficiency of the companies. Technical and scaleefficiency performances of electricity distribution companies aredetailed in Table 5 for the last two years, 2008 and 2009. Accordingto the VRSTE scores, in 2008, the most inefficient company is Meram,with a VRSTE score of 0.71. With privatization in 2009, this companyshowed an impressive efficiency increase, to 0.95. In 2009, Akdeniz isthe most inefficient company, with score of 0.88. The average VRSTEscores in the market are 0.97 and 0.98 in 2008 and 2009, respec-tively. This implies that if the market operated efficiently, the sameamount of electricity could be distributed to the same number ofcustomers with about 2–3% less input usage.
As for the scale efficiency, out of 21 distribution companies, in2008 and 2009, respectively, 9 and 11 companies operate at theirmost productive scale, implying a constant returns to scale. Theremaining companies—except Toroslar—exhibit increasing returnsto scale during 2008 and 2009. This finding implies that thesecompanies—except Toroslar—should expand their operations tobecome scale efficient, while Toroslar should regress its operationsto increase efficiency performance. The average scale efficiency is0.93 in 2008 and 0.94 in 2009. This means that it is possible todistribute the same amount of electricity to the same number ofcustomers with about 6–7% less input if the scale efficiencyperformances of the scale-inefficient companies increase. Indeed,Sakarya, which was privatized in 2009, succeeded in increasing itsscale efficiency from 0.91 to 1.00. Similarly Meram increased its
scale efficiency level from 0.88 to 0.95 following privatizationin 2009.
Table 6 demonstrates the changes in outputs and inputs whichare necessary to make inefficient companies full-efficient accord-ing to the VRSTE results of the Model-1. In 2009, for example,Akdeniz should increase the quantity of electricity delivered by20.2%, from 6,526,698 MWh to 7,846,772 MWh while the neces-sary increase in the number of customers is zero. As for the inputs,Akdeniz should decrease the number of the employees, length ofdistribution line, transformer capacity, outage duration per custo-mer and loss&theft ratio by 12.3%, 27.1%, 12.3%, 9.1% and 29.3%,respectively.
Table 7 illustrates reference set and target value for Başkent inyear 2009. The reference set (namely, peers) for this companyincludes 5th (Boğaziçi), 19th (Uludağ) and 13th (Menderes) com-panies. Target values of inputs and outputs are calculated by thelinear combination of the peers. The weights of the peers (Boğa-ziçi, Uludağ and Menderes) in the linear combination are calcu-lated as 0.516, 0.471 and 0.013, respectively.
Table 8 demonstrates total changes in outputs and inputs to makeall companies full-efficient in years 2008 and 2009. In 2009, forexample, the total quantity of the electricity delivered and thenumber of customers should be increased by 4.2% and 1.6% respec-tively. In addition, the number of the employees, length of distribu-tion line, transformer capacity, outage duration per customer andloss&theft ratio should be decreased by 1.9%, 10.5%, 1.1%, 5.6% and0.7% respectively so as to make all companies full-efficient.
Table 9 presents the Malmquist index summary of annualgeometric means when the year 2002 is set as the base periodto be the reference point for observing the annual changes.Examining the average values of the annual means which arepresented in the last row of the table, we observe that efficiency,scale efficiency and pure efficiency did not change significantlythroughout 2002–2009. On average, efficiency and scale efficiencydecreased by 0.2% and 0.3% respectively while pure efficiencyincreased by 0.2%. Looking at the individual annual values, weobserved that the change in these three type of efficiency varied inthe range between decreasing by 3.4% and increasing by 2.5%. Theelectricity distribution market exhibited a 3.3% TFP increase peryear over the period of 2002–2009. On average, the change in theTFP was completely determined by technological development(3.4%) rather than slight efficiency decrease (0.2%).13 The electri-city distribution market experienced remarkable TFP performancein year 2007. In this year TFP increased considerably by 9.4%thanks to the technological progress (9.8%).
The Malmquist indices of geometric means for each company aregiven in Table 10. According to the results, productivity increases inthe most of the electricity distribution companies. Out of 21companies, 15 have exhibited TFP progress during 2002–2009.Among them, Boğaziçi, the company serving the European part ofIstanbul, exhibits the most brilliant TFP increase. In each year over2002–2009, Boğaziçi has increased its TFP by 20.4% completely dueto technological development (20.4%). Interestingly AYEDAŞ, thecompany serving the Asian part of Istanbul, has been found to bethe worst performer in terms of TFP change, with a decline of 4.0%,which is completely due to the technological regression.
4.3. Explaining efficiency drivers: Tobit results
Once the efficiency scores of the electricity distribution firmsare calculated by help of DEA, we can assess the effects of severalenvironmental variables on these efficiency scores. For this aim,
Table 2Specification of models.
Variable Models
Model-1 Model-2
y1 Electricity delivered √ √y2 Number of customers √ √x1 Number of employees √ √x2 Length of distribution line √ √x3 Transformer capacity √ √x4 Outage hours per customer √ √x5 Loss&theft ratio √z1 Customer density √ √z2 Customer structure √ √z3 Dummy for restructuring √ √z4 Dummy for ownership √ √z5 Loss&theft ratio √
12 “xttobit” command of Stata is used for estimations of Tobit models,censoring from above 1 and below 0.
13 The domination of technological change over efficiency change in determin-ing the TFP change is observed in all years except 2004 and 2009.
A. Çelen / Energy Policy 63 (2013) 300–310 305
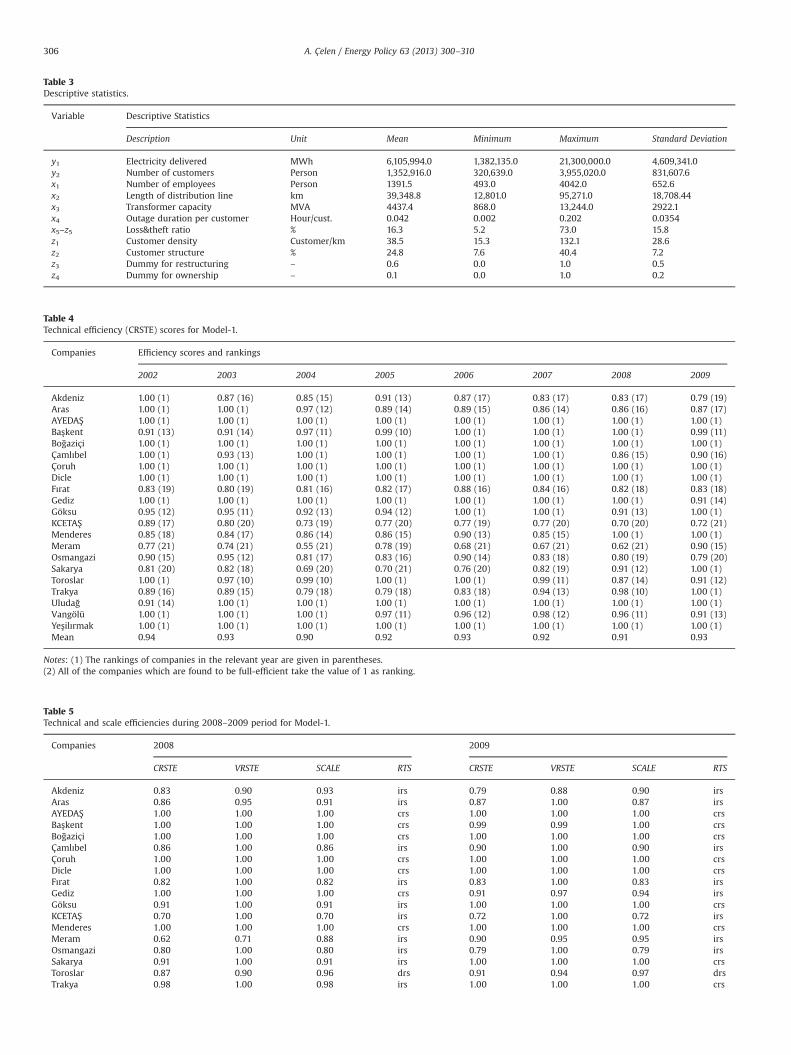
Table 4Technical efficiency (CRSTE) scores for Model-1.
Companies Efficiency scores and rankings
2002 2003 2004 2005 2006 2007 2008 2009
Akdeniz 1.00 (1) 0.87 (16) 0.85 (15) 0.91 (13) 0.87 (17) 0.83 (17) 0.83 (17) 0.79 (19)Aras 1.00 (1) 1.00 (1) 0.97 (12) 0.89 (14) 0.89 (15) 0.86 (14) 0.86 (16) 0.87 (17)AYEDAŞ 1.00 (1) 1.00 (1) 1.00 (1) 1.00 (1) 1.00 (1) 1.00 (1) 1.00 (1) 1.00 (1)Başkent 0.91 (13) 0.91 (14) 0.97 (11) 0.99 (10) 1.00 (1) 1.00 (1) 1.00 (1) 0.99 (11)Boğaziçi 1.00 (1) 1.00 (1) 1.00 (1) 1.00 (1) 1.00 (1) 1.00 (1) 1.00 (1) 1.00 (1)Çamlıbel 1.00 (1) 0.93 (13) 1.00 (1) 1.00 (1) 1.00 (1) 1.00 (1) 0.86 (15) 0.90 (16)Çoruh 1.00 (1) 1.00 (1) 1.00 (1) 1.00 (1) 1.00 (1) 1.00 (1) 1.00 (1) 1.00 (1)Dicle 1.00 (1) 1.00 (1) 1.00 (1) 1.00 (1) 1.00 (1) 1.00 (1) 1.00 (1) 1.00 (1)Fırat 0.83 (19) 0.80 (19) 0.81 (16) 0.82 (17) 0.88 (16) 0.84 (16) 0.82 (18) 0.83 (18)Gediz 1.00 (1) 1.00 (1) 1.00 (1) 1.00 (1) 1.00 (1) 1.00 (1) 1.00 (1) 0.91 (14)Göksu 0.95 (12) 0.95 (11) 0.92 (13) 0.94 (12) 1.00 (1) 1.00 (1) 0.91 (13) 1.00 (1)KCETAŞ 0.89 (17) 0.80 (20) 0.73 (19) 0.77 (20) 0.77 (19) 0.77 (20) 0.70 (20) 0.72 (21)Menderes 0.85 (18) 0.84 (17) 0.86 (14) 0.86 (15) 0.90 (13) 0.85 (15) 1.00 (1) 1.00 (1)Meram 0.77 (21) 0.74 (21) 0.55 (21) 0.78 (19) 0.68 (21) 0.67 (21) 0.62 (21) 0.90 (15)Osmangazi 0.90 (15) 0.95 (12) 0.81 (17) 0.83 (16) 0.90 (14) 0.83 (18) 0.80 (19) 0.79 (20)Sakarya 0.81 (20) 0.82 (18) 0.69 (20) 0.70 (21) 0.76 (20) 0.82 (19) 0.91 (12) 1.00 (1)Toroslar 1.00 (1) 0.97 (10) 0.99 (10) 1.00 (1) 1.00 (1) 0.99 (11) 0.87 (14) 0.91 (12)Trakya 0.89 (16) 0.89 (15) 0.79 (18) 0.79 (18) 0.83 (18) 0.94 (13) 0.98 (10) 1.00 (1)Uludağ 0.91 (14) 1.00 (1) 1.00 (1) 1.00 (1) 1.00 (1) 1.00 (1) 1.00 (1) 1.00 (1)Vangölü 1.00 (1) 1.00 (1) 1.00 (1) 0.97 (11) 0.96 (12) 0.98 (12) 0.96 (11) 0.91 (13)Yeşilırmak 1.00 (1) 1.00 (1) 1.00 (1) 1.00 (1) 1.00 (1) 1.00 (1) 1.00 (1) 1.00 (1)Mean 0.94 0.93 0.90 0.92 0.93 0.92 0.91 0.93
Notes: (1) The rankings of companies in the relevant year are given in parentheses.(2) All of the companies which are found to be full-efficient take the value of 1 as ranking.
Table 3Descriptive statistics.
Variable Descriptive Statistics
Description Unit Mean Minimum Maximum Standard Deviation
y1 Electricity delivered MWh 6,105,994.0 1,382,135.0 21,300,000.0 4,609,341.0y2 Number of customers Person 1,352,916.0 320,639.0 3,955,020.0 831,607.6x1 Number of employees Person 1391.5 493.0 4042.0 652.6x2 Length of distribution line km 39,348.8 12,801.0 95,271.0 18,708.44x3 Transformer capacity MVA 4437.4 868.0 13,244.0 2922.1x4 Outage duration per customer Hour/cust. 0.042 0.002 0.202 0.0354x5–z5 Loss&theft ratio % 16.3 5.2 73.0 15.8z1 Customer density Customer/km 38.5 15.3 132.1 28.6z2 Customer structure % 24.8 7.6 40.4 7.2z3 Dummy for restructuring – 0.6 0.0 1.0 0.5z4 Dummy for ownership – 0.1 0.0 1.0 0.2
Table 5Technical and scale efficiencies during 2008–2009 period for Model-1.
Companies 2008 2009
CRSTE VRSTE SCALE RTS CRSTE VRSTE SCALE RTS
Akdeniz 0.83 0.90 0.93 irs 0.79 0.88 0.90 irsAras 0.86 0.95 0.91 irs 0.87 1.00 0.87 irsAYEDAŞ 1.00 1.00 1.00 crs 1.00 1.00 1.00 crsBaşkent 1.00 1.00 1.00 crs 0.99 0.99 1.00 crsBoğaziçi 1.00 1.00 1.00 crs 1.00 1.00 1.00 crsÇamlıbel 0.86 1.00 0.86 irs 0.90 1.00 0.90 irsÇoruh 1.00 1.00 1.00 crs 1.00 1.00 1.00 crsDicle 1.00 1.00 1.00 crs 1.00 1.00 1.00 crsFırat 0.82 1.00 0.82 irs 0.83 1.00 0.83 irsGediz 1.00 1.00 1.00 crs 0.91 0.97 0.94 irsGöksu 0.91 1.00 0.91 irs 1.00 1.00 1.00 crsKCETAŞ 0.70 1.00 0.70 irs 0.72 1.00 0.72 irsMenderes 1.00 1.00 1.00 crs 1.00 1.00 1.00 crsMeram 0.62 0.71 0.88 irs 0.90 0.95 0.95 irsOsmangazi 0.80 1.00 0.80 irs 0.79 1.00 0.79 irsSakarya 0.91 1.00 0.91 irs 1.00 1.00 1.00 crsToroslar 0.87 0.90 0.96 drs 0.91 0.94 0.97 drsTrakya 0.98 1.00 0.98 irs 1.00 1.00 1.00 crs
A. Çelen / Energy Policy 63 (2013) 300–310306

Table 6The changes in outputs and inputs to make inefficient companies efficient in 2008–2009 (according to the VRSTE results of Model-1).
Company Output/input 2008 2009
Actual value Target value Potential improvement (%) Actual value Target value Potential improvement (%)
Akdeniz y1 6,645,856 7,097,122 6.80 6,526,698 7,846,772 20.20y2 1,429,592 1,429,592 0.00 1,550,049 1,550,049 0.00x1 1049 940 �10.40 1011 886 �12.30x2 52,088 38,168 �26.70 52,465 38,243 �27.10x3 4964 4447 �10.40 5718 5012 �12.30x4 0.01 0.01 �9.10 0.01 0.01 �9.10x5 9.00 7.00 �22.10 9.20 6.50 �29.30
Aras y1 2,274,083 2,489,275 9.50y2 704,773 704,773 0.00x1 1355 930 �31.40x2 41670 35392 �15.10x3 1735 1640 �5.50x4 0.04 0.03 �29.50x5 27.20 25.70 �5.50
Başkent y1 12,147,521 16,118,563 32.70y2 3,185,468 3,185,468 0.00x1 1542 1533 �0.60x2 95,271 40,015 �58.00x3 10,045 9985 �0.60x4 0.04 0.01 �85.70x5 8.30 7.80 �6.40
Gediz y1 13,468,479 13,468,479 0.00y2 2,389,889 2,506,337 4.90x1 1221 1182 �3.20x2 40,337 39,059 �3.20x3 10,129 8640 �14.70x4 0.01 0.01 0.00x5 7.70 7.50 �3.20
Meram y1 6,393,604 7,349,192 14.90 6,094,727 7,549,965 23.90y2 1,487,241 1,487,241 0.00 1,582,154 1,582,154 0.00x1 1609 1064 �33.90 742 706 �4.90x2 59,805 35,163 �41.20 60,699 51,179 �15.70x3 6479 4577 �29.40 6186 5883 �4.90x4 0.04 0.01 �71.10 0.04 0.02 �42.90x5 8.40 5.90 �29.40 8.50 8.10 �4.90
Toroslar y1 15,262,841 15,262,841 0.00 15,855,339 15,855,339 0.00y2 2,539,933 2,794,791 10.00 2,742,156 3,127,272 14.00x1 2247 1565 �30.30 2087 1525 �26.90x2 73,515 41,754 �43.20 70,157 40,644 �42.10x3 9653 8695 �9.90 10,309 9719 �5.70x4 0.01 0.01 �40.00 0.01 0.01 �50.00x5 8.90 8.00 �9.90 8.30 7.80 �5.70
Table 7Composite reference set for the Başkent in 2009.
Actual value Reference set Target value
U4 λ5 U5 λ19 U19 λ13 U13 Un
4
y1 12,147,521 0.516 20,410,302 0.471 11,704,348 0.013 5,834,963 16,118,563y2 3,185,468 3,955,020 2,388,477 1,534,588 3,185,468x1 1542 1757 1313 611 1533x2 95,271 30,402 50,003 59,525 40,015x3 10,045 0.516 13,244 0.471 6,532 0.013 5715 9985x4 0.04 0.00 0.01 0.04 0.01
Table 5 (continued )
Companies 2008 2009
CRSTE VRSTE SCALE RTS CRSTE VRSTE SCALE RTS
Uludağ 1.00 1.00 1.00 crs 1.00 1.00 1.00 crsVangölü 0.96 1.00 0.96 irs 0.91 1.00 0.91 irsYeşilırmak 1.00 1.00 1.00 irs 1.00 1.00 1.00 crsMean 0.91 0.97 0.93 – 0.93 0.98 0.94 –
A. Çelen / Energy Policy 63 (2013) 300–310 307

two different Tobit models are specified, and Table 11 presents theestimation results of these models.14
The variable of customer density defined as the number ofcustomers per km of distribution line has statistically significantand positive coefficient in both models. In addition, two alter-native models find the magnitude of the coefficient for thisvariable rather close to each other: One unit increase in customerdensity leads to 0.32% and 0.37% increase in the efficiency score,according to Model-1 and Model-2 respectively. Positive effect ofcustomer density on efficiency of Turkish electricity distributionfirms is also confirmed by Çelen (2011).
As for the second environmental variable, measured as propor-tion of sales in MWh to residential customers to total sales, twoalternative models find negative coefficients. But, the coefficient is
Table 8Total changes in outputs and inputs to make companies efficient (according to the VRSTE results).
Outputs/inputs2008 2009
Actual total Change % Actual total Change %
Quantity delivered y1 161,488,057 þ1,622,046 þ1.0 160,472,357 þ6,746,354 þ4.2Number of customers y2 30,496,212 þ254,858 þ0.8 32,283,333 þ501,563 þ1.6Number of employees x1 26,362 �882 �3.3 22,923 �442 �1.9Length of distribution line x2 881,244 �44,052 �5.0 902,528 �94,473 �10.5Transformer capacity x3 106,479 0 0 111,081 �1168 �1.1Outage duration x4 0.71 �0.03 �4.2 0.71 �0.04 �5.6Loss&theft ratio x5 106,479 �1.05 �0.001 307.34 �2.04 �0.7
Table 9Malmquist index summary of annual means.
Year Efficiencychange
Technologicalchange
Pure efficiencychange
Scale efficiencychange
TFPchange
[A] [B] [C] [D¼A/C] [E¼A�B]
2003 0.986 1.039 1.000 0.985 1.0242004 0.966 1.028 0.999 0.967 0.9932005 1.023 0.969 1.008 1.014 0.9922006 1.009 1.023 1.004 1.006 1.0332007 0.997 1.098 0.995 1.001 1.0942008 0.985 1.064 0.989 0.997 1.0482009 1.025 1.023 1.016 1.008 1.048Mean 0.998 1.034 1.002 0.997 1.033
Table 10Malmquist index summary of company means.
Compa-nies
Efficiencychange
Technologicalchange
Pure efficiencychange
Scale efficiencychange
TFPchange
[A] [B] [C] [D¼A/C] [E¼A�B]
Akdeniz 0.967 1.037 0.981 0.986 1.003Aras 0.980 1.002 1.000 0.980 0.982AYEDAŞ 1.000 0.960 1.000 1.000 0.960Başkent 1.012 1.064 0.999 1.013 1.077Boğaziçi 1.000 1.204 1.000 1.000 1.204Çamlıbel 0.985 1.006 1.000 0.985 0.991Çoruh 1.000 0.999 1.000 1.000 0.999Dicle 1.000 1.033 1.000 1.000 1.033Fırat 1.000 1.008 1.008 0.992 1.008Gediz 0.986 1.046 0.995 0.991 1.032Göksu 1.008 1.025 1.000 1.008 1.033KCETAŞ 0.970 1.030 1.000 0.970 0.999Menderes 1.024 1.035 1.009 1.015 1.059Meram 1.023 1.036 1.018 1.004 1.060Osmangazi0.981 1.040 1.000 0.981 1.020Sakarya 1.030 1.050 1.023 1.007 1.082Toroslar 0.987 1.075 0.992 0.995 1.061Trakya 1.016 1.026 1.000 1.016 1.043Uludağ 1.013 1.048 1.007 1.006 1.062Vangölü 0.987 0.994 1.000 0.987 0.980Yeşilırmak1.000 1.023 1.000 1.000 1.023Mean 0.998 1.034 1.002 0.997 1.033
Table 7 (continued )
Actual value Reference set Target value
U4 λ5 U5 λ19 U19 λ13 U13 Un
4
x5 8.30 9.70 5.60 9.60 7.80
Notes: (1) U4, U5, U19 and U13 respectively represent companies of Başkent, Boğaziçi, Uludağ and Menderes.(2) Target values are calculated as: Un
4 ¼ λ5U5þλ19U19þλ13U13.
Table 11Estimation results of alternative models.
Variable Parameter Model-1 Model-2
Coefficient t-ratio Coefficient t-ratio
Constant β0 98.05nnn 10.13 82.10nnn 7.92Customer density β1 0.32nn 2.32 0.37nnn 2.64Customer structure β2 �0.47 �1.42 �035 �1.15Dummy for restructuring β3 �0.68 �0.46 0.84 0.58Dummy for ownership β4 11.80nn 2.31 19.46nnn 3.71Loss&theft ratio β5 – – 0.39nn 2.06Number of observations 168 168Uncensered observations 90 107Censored observations 78 61Number of groups 21 21Observations per group 8 8Log-likelihood 367.8 415.9
nnn Denotes significance at the 1% level using a two-tailed test.nn Denotes significance at the 5% level using a two-tailed test.n Denotes significance at the 10% level using a two-tailed test.
14 To test the validity of the normality and homoscedasticity assumptionsunderlying our Tobit models, we applied the routines provided by Cameron andTrivedi (2009). According to the results, we cannot reject the null hypothesis of thenormality and homoscedasticity.
A. Çelen / Energy Policy 63 (2013) 300–310308
not significant at any meaningful significance levels in bothmodels. If it was found to be significant, its negative sign impliedthat the higher the share of the sales to residential customers thelower the efficiency score of the relevant electricity distributionfirm. As stated before, the expected effect of the customer struc-ture on the efficiency scores is not clear theoretically. However,Çelen (2011) concluded that efficiencies of the companies ser-ving mostly the residential customers in Turkey are higher thanthose of other companies. In addition, several studies such asHirschhausen et al. (2006) reported that an increase of the share ofindustrial customers represents a disadvantage for the electricitydistribution companies in terms of efficiency.
The dummy variable setting to evaluate the effects of themergers between electricity distribution organizations on theirefficiency levels has negative in Model-1, but positive in Model-2.Although this dummy variable has different signs in two alter-native models, its coefficient is found to be insignificant in bothmodels. This conclusion indicates that the mergers occurred in2005 did not increase the efficiency levels of the electricitydistribution firms. Bağdadioğlu et al. (2007) and also motivatedto measure how the efficiency performances of the electricitydistribution regions were affected by the mergers between dis-tribution regions occurred in 2005. This study shows that themergers between distribution organizations increase the efficiencylevels significantly. In contrast, our findings in this study cannotsupport a positive relationship between these merger activitiesand technical efficiency levels.
The dummy variable of ownership has positive and significantcoefficient as at least theoretically expected. This means thatefficiency scores of the private distribution firms are higher thanthose of public distribution firms. This result is also confirmed byrecent studies (i.e. Bağdadioğlu et al. (1996); Bağdadioğlu (2005);Odyakmaz (2009) and Bağdadioğlu (2009)) evaluating the effect ofthe ownership on efficiency in Turkish electricity distributionmarket. In light of all these studies, one may confidently claimthat the efficiency performance of the electricity distributionmarket in Turkey will be enhanced with the completion of theprivatizations of distribution firms.
The loss/theft ratio, which is the last environmental variable inModel-2, is found to be positive, and significant. This implies thatthe distribution firms operating in regions with higher loss/theftratio have showed higher efficiency performances, which seems tobe an unexpected result at the first glance. One possible reason forexplaining this finding is as follows: In calculating the outputs inthis study, we sum up all customers and all electricity delivered tothem even the relevant electricity distribution company cannotcollect money for all electricity distributed. We follow this strategybecause of the fact that we do not predict cost efficiency ofelectricity distribution companies. Instead, only physical measuresof the variables are used in calculating technical efficiency scoresbecause of the fact that cost minimization assumption is veryquestionable in regulated markets such as electricity distributionsectors mainly due to political and regulatory interventions(Rungsuriyawiboon and Coelli 2004). Thus, in such a framework,the negative relationship between efficiency and loss/theft ratiodoes not appear. In contrast, at least in short-run, distributioncompanies which do not try to decrease the loss/theft of electricityproblem by increasing its capital and human resources may obtainhigher technical efficiency scores.
5. Conclusion
The environmental variables considered in this study are notunder control of the distribution companies, which is certainlytrue in the short run. However, it seems to be a logical discussion
whether these environmental variables can be changed, especiallyin the long run, by distribution companies and/or government toincrease the efficiency performances. Among the environmentalvariables considered, the first two (i.e. customer density andcustomer structure) are absolutely non-discretionary in nature:In Turkish electricity market, distribution firms have been respon-sible from serving all customers in predetermined regions. Thus, inorder to increase the customer density per km of line, the firmscannot refrain from expanding their distribution network. Inaddition, with some promotional activities, increasing the numberof the customers and/or changing the structure of the customerportfolio may not seem to be possible at the moment given thatcompetition between distribution companies responsible fromdifferent regions has not started yet. As a result, focusing on thefirst two environmental variables may not help in improving theefficiency performances of distribution companies.
Generally speaking, one of the structural approaches toincrease the efficiencies of companies in regulated markets maybe to merge/demerge of electricity companies. As a starting pointof reforms in Turkish electricity market, the government created21 distribution companies following a series of mergers between82 distribution organizations in 2004. Our study cannot supportthe expected conclusion that these mergers increased the effi-ciency performances. Thus, our study does not offer the reorgani-zation of the distribution companies to improve efficiency in themarket.
According to our results, the best strategy that could be done toimprove efficiency in the market is passing the ownership of thedistribution companies from public to private. Indeed, this strategyhas been exactly what the Turkish government has tried to follow.Although some delays in privatizations of distribution companiesare occurred due to the global financial crisis, the governmentshould continue to show her strong commitment to privatizations.
It may be possible to extend this study in some direction: inthis study we rated many number of companies as full-efficient.One possible reason for this finding may be insufficiency of thenumber of companies in comparison to the number of inputs andoutputs. Bowlin (1987) suggested that at least two decisionmaking units for each input or output measure are necessary formaintaining an adequate number of degrees of freedom. Giventhat this condition is easily satisfied in our study, it would be ofgreat interest to work on this issue.
References
Afonso, A., Aubyn, M., 2006. Relative efficiency of health provision: a DEA approachwith non-discretionary inputs. Department of Economics at the School ofEconomics and Management (ISEG), Technical University of Lisbon.
Bağdadioğlu, N., Price, C.M.W., Weyman-Jones, T., 1996. Efficiency and ownership inelectricity distribution: a non-parametric model of the Turkish experience.Energy Economics 18, 1–23.
Bağdadioğlu, N., 2005. The efficiency consequences of resisting changes in achanging world: evidence from the Turkish electricity distribution. Interna-tional Journal of Business, Management and Economics, 23–44.
Bağdadioğlu, N., Waddams Price, C., Weyman-Jones, T., 2007. Measuring potentialgains from mergers among electricity distribution companies in Turkey using anon-parametric model. The Energy Journal 28 (2), 83–100.
Bağdadioğlu, N., Weyman-Jones, T., 2008. Panel data stochastic frontier analysis forenergy network regulation, ⟨www.cepe.ethz.ch/workshop2008/Weyman-Jones⟩, (accessed 30.01.12).
Bağdadioğlu, N., 2009. An application of incentive regulation of service quality inthe Turkish electricity distribution sector. Gazi Üniversitesi İktisadi ve İdariBilimler Fakültesi Dergisi 11 (1), 23–44. (in Turkish).
Bağdadioğlu, N., Senyücel, O., 2010. Service quality regulation in electricitydistribution. In: Paper presented in 6th International Scientific Conference,May 13–14, 2010, Vilnius, Lithuania.
Bağdadioğlu, N., Weyman-Jones, T., 2010. Stochastic frontier panel data modelingfor regulatory bechmarking: an application to the Turkish electricity distribu-tion sector. İktisat, İşletme ve Finans 25, 97–119.
Bağdadioğlu, N., 2011. Regulation in the Turkish electricity industry. In: Çetin, T.,Oğuz, F. (Eds.), The Political Economy of Regulation in Turkey. Springer, NewYork, pp. 123–143.
A. Çelen / Energy Policy 63 (2013) 300–310 309

Banker, R.D., Charnes, A., Cooper, W.W., 1984. Some models for estimating technicaland scale inefficiencies in data envelopment analysis. Management Science 30(9), 1078–1092.
Baykal, Ş., 2009. The Cost Efficiency Analysis of Turkish electricity DistributionFirms (M.Sc. thesis, unpublished), Eidgenöessische Technische Hochschule,Zürich.
Boles, J.N., 1966. Efficiency squared—efficient computation of efficiency indexes. In:Proceedings of Thirty Ninth Annual Meeting of the Western Farm EconomicsAssociation, pp. 137–142.
Bowlin, W.F., 1987. Evaluating the efficiency of US air force real-property main-tenance activities. Journal of the Operational Research Society 38 (2), 127–135.
Cameron, Colin A., Trivedi, P.K., 2009. Microeconometrics Using Stata. Stata Press,College Station.
Charnes, A., Cooper, W.W., Rhodes, E., 1978. Measuring the efficiency of decisionmaking units. European Journal of Operational Research, 429–444.
Coelli, T.J., Rao, D.S.P., O'Donnell, C.J., Battese, G.E., 2005. An introduction toefficiency and productivity analysis, 2nd edition Springer.
Coelli, T.J., Crespo, H., Paszukiewicz, A., Perelma, S., Plagnet, M.A., Romano, E., 2008.Incorporating quality of service in a benchmarking model: an application toFrench electricity distribution operators. ⟨http://www.gis-larsen.org/Pdf/Incorporating_quality_of_service_Zurich_0908.pdf⟩, (accessed 30.01.12).
Cote, D.O., 1989. Firm efficiency and ownership structure. Annals of Public &Cooperative Economics 60 (4), 431–450.
Çelen, A., 2011. Measuring the efficiency of the Turkish electric distribution sectorusing Stochastic Frontier Analysis (M.Sc. thesis, unpublished). Middle EastTechnical University, Industrial Engineering Department.
Çelen, A., 2012. Performance evaluation of Turkish electricity distribution marketusing a combined FAHP/TOPSIS method. Energy Education Science and Tech-nology Part A: Energy Science and Research 29 (2), 1263–1276.
Çelen, A., Yalçın, N., 2012. Performance assessment of Turkish electricity distribu-tion utilities: an application of combined FAHP/TOPSIS/DEA methodology toincorporate quality of service. Utilities Policy 23, 59–71.
Çelen, A., 2013a. The effect of merger and consolidation activities on the efficiencyof electricity distribution regions in Turkey. Energy Policy 59, 674–682.
Çelen, A., 2013b. A review and synthesis of empirical studies on technical efficiencymeasurement in Turkish electricity market. Competition Journal (published byTurkish Competition Authority) 14 (2), 43–64.
Fare, R., Grosskopf, S., Logan, J., 1983. The relative efficiency of Illinois electricutilities. Resources and Energy 5, 349–367.
Gitto, S., Mancuso, P., 2012. Bootstrapping the Malmquist indexes for Italianairports. International Journal of Production Economics 135 (1), 403–411.
Greene, W.H., 2000. Econometric analysis. Prentice Hall, Upper Saddle River, NJ.Growitsch, C., Jamasb, T., Pollitt, M., 2009. Quality of service, efficiency, and scale in
network industries: an analysis of European electricity distribution. AppliedEconomics 41 (20), 2555–2570.
Hirschhausen, C., von, Cullman, A., Kappeler, A., 2006. Efficiency analysis of Germanelectricity distribution utilities: nonparametric and parametric tests. AppliedEconomics 38, 2553–2566.
Jamasb, T., Pollitt, M., 2001. Benchmarking and regulation of electricity transmis-sion and distribution utilities: Lessons from international experience. Depart-ment of Applied Economics, University of Cambridge.
Kumbhakar, S.C., Hjalmarsson, L., 1998. Relative performance of public and privateownership under yardstick competition: Electricity retail distribution. Eur-opean Economic Review, 42; , pp. 97–122.
Kwoka, J.E., 2005. The comparative advantage of public ownership: evidence fromU.S. electric utilities. Canadian Journal of Economics 38 (2), 622–640.
Murillo-Zamorano, L.R., Vega-Cervera, J.A., 2001. The use of parametric and non-parametric frontier methods to measure the productive efficiency in theindustrial sector: a comparative study. International Journal of ProductionEconomics 69 (3), 265–275.
Odyakmaz N., Scarsi, G.C., 2007. Electricity distribution benchmarking in Turkey forregulatory purposes: The case of TEDAS. In: 9th IAEE European EnergyConference Energy Markets and Sustainability in a Larger Europe, FlorenceItaly.
Odyakmaz, N., 2009. The comparative performance analysis of Turkish electricitydistribution companies in the framework of performance-based regulation (Ph.d. thesis, unpublished). Department of Economics, Hacettepe University,Ankara (in Turkish).
Olesen, O.B., 1995. Some unsolved problems in data envelopment analysis—asurvey. International Journal of Production Economics 39 (1–2), 5–36.
Park, S.-U., Lesourd, J.-B., 2000. Efficiency of conventional fuel power plants inSouth Korea: a comparison of parametric and non-parametric approaches.International Journal of Production Economics 63 (1), 59–67.
Perez-Reyes, R., Tovar, B., 2009. Measuring efficiency and productivity change (PTF)in the Peruvian electricity distribution companies after reforms. Energy Policy37, 2249–2261.
Pollitt, M.G., 1995. Ownership and performance in electricity utilities: The inter-national evidence on privatization and efficiency. Oxford Institute for EnergyStudies.
Pombo, C., Taborda, R., 2006. Performance and efficiency in Colombia's powerdistribution system: effects of the 1994 reform. Energy Economics 28 (3),339–369.
Rungsuriyawiboon, S., Coelli, T., 2004. Regulatory Reform and Economic Perfor-mance in US Electricity Generation. Working Paper 06/2004, CEPA WorkingPapers Series, University of Queensland, School of Economics.
Senyücel, O., 2012. Türkiye'de Elektrik Dağıtımında Hizmet Kalitesi ve EtkinlikÖlçümü. Published Phd Thesis, Turkish Competition Authority, Graduate ThesisSeries, No: 19, Ankara.
Shephard, R.W., 1970. The theory of cost and production functions. PrincetonUniversity Press.
Simar, L., Wilson, P.W., 2007. Estimation and inference in two-stage, semi-parametric models of production processes. Journal of Econometrics 136,31–64.
Simar, L., Wilson, P.W., 2000. A general methodology for bootstrapping in non-parametric frontier models. Journal of Applied Statistics 27, 779–802.
Tobin, J., 1958. Estimation of relationships for limited dependent variables.Econometrica 26, 24–36.
Vining, A.R., Boardman, A.E., 1992. Ownership versus competition: efficiency inpublic enterprise. Public Choice 73, 205–309.
Zeitsch, J., Lawrence, D., 1996. Decomposing economic inefficiency in baseloadpower plants. Journal of Productivity Analysis 7 (4), 359–378.
A. Çelen / Energy Policy 63 (2013) 300–310310