
Efficiency And Optimization Of Your Hybrid Cloud
18
-
Upload
harmeet-sahni -
Category
Technology
-
view
290 -
download
3
Transcript of Efficiency And Optimization Of Your Hybrid Cloud


Harmeet Sahni
Director, SteelApp Product Management
Efficiency and Optimization of your Hybrid Cloud
SteelApp Cloud Application Delivery
Agenda
1
2
3
4
5

Why Hybrid Cloud?
Expand Capacity Enhance Capability
Example: Public cloud could be used for disaster recovery of a private service
Example: Use a public cloud backup storage service for archival purposes

To augment internal capacity
• For seasonal workloads (e.g. holiday sales, tax season)
For staging workloads
• Dev/test/pilot in public cloud and production in private cloud
For disaster recovery
• Public cloud used as disaster recovery back up
As a migration path
• To transition on-premises environment to public cloud
For specific services
• Leverage unique services provided by a cloud provider
How to Leverage the Hybrid Cloud
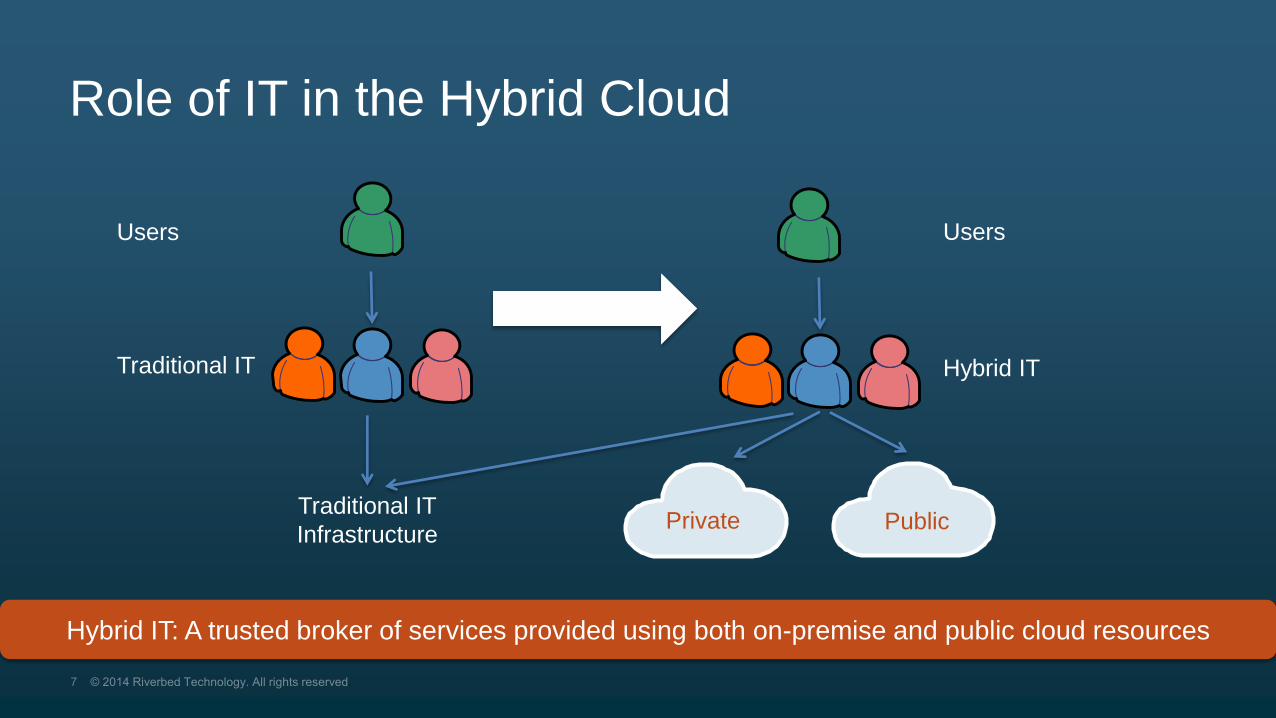
Role of IT in the Hybrid Cloud
Traditional IT
Infrastructure
Users
Traditional IT Hybrid IT
Users
Private Public
Hybrid IT: A trusted broker of services provided using both on-premise and public cloud resources

Key Requirements for Hybrid Application Delivery
1
2
3
4
5

Cloud Scale Cloud Integration Cloud Control
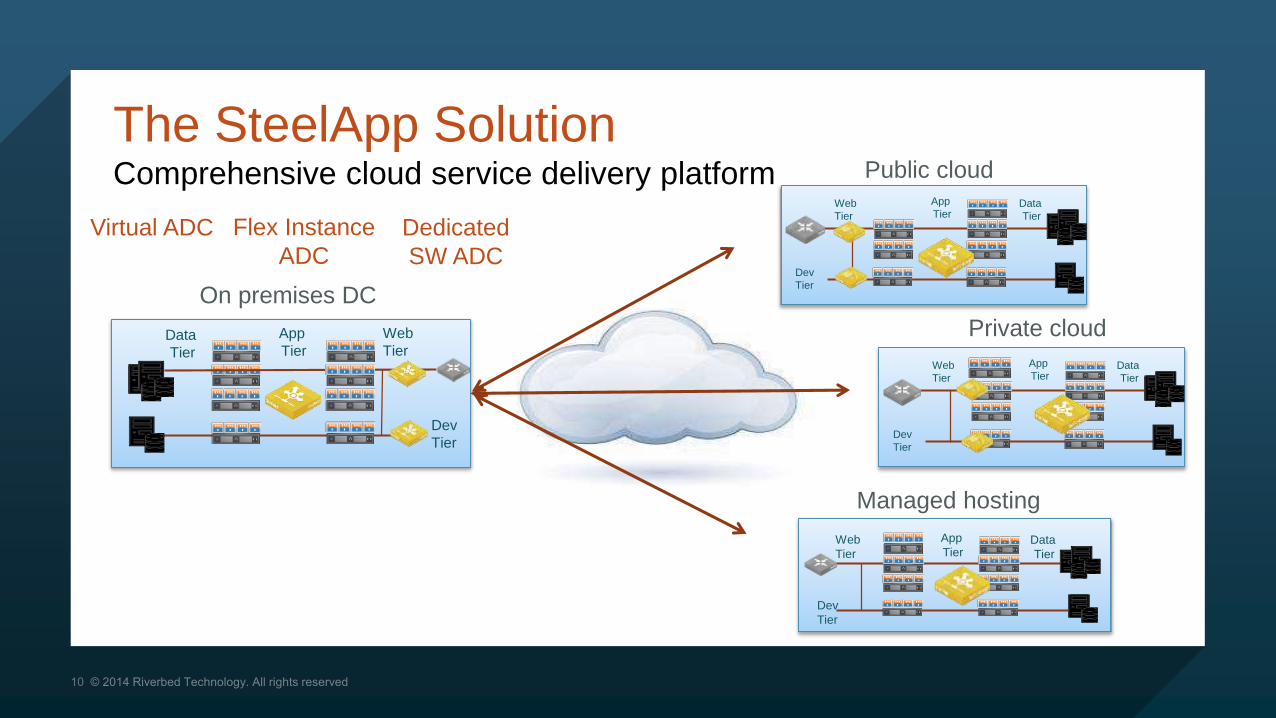
SteelApp: Designed From the Cloud UpComprehensive app service portfolio for the cloud
Web
TierData
Tier
Dev
Tier
App
TierApp
TierData
Tier
Dev
Tier
Web
Tier
App
TierData
Tier
Dev
Tier
Web
Tier
App
TierData
Tier
Dev
Tier
Web
Tier
Virtual ADC Flex Instance
ADC
Dedicated
SW ADC
On premises DC
Public cloud
Private cloud
Managed hosting
The SteelApp SolutionComprehensive cloud service delivery platform

• Provides application
reliability, availability,
server offload/efficiency,
security, scripting,
and more
SteelApp Traffic
ManagerSteelApp Web
Accelerator
• Reduces page load
time and cuts
bandwidth.
• Deployed as an
Integrated solution w/
STM or as a Proxy
SteelApp Web
Application Firewall
• Defends your web
applications against
threats
• Integrated/Proxy/Web
Server Plugin (Dist. WAF)
SteelCentral
Services Controller
for SteelApp
• Elastic and adaptive
services controller
• Automates ADC service
deployment, resource
utilization, metering,
licensing & provisioning
The SteelApp PortfolioComprehensive app delivery portfolio

Hybrid Application Delivery Use Cases
1
2
3
4
5

Internet
Enterprise
Data CenterPublic Cloud
DNSDNSX
Cloud Load BalancingDR and extra capacity

Content Delivery CloudApplication acceleration Your
Data Center
Service
Provider
Hybrid
Accelerate and Control
Your Content • Use SteelApp for origin and
edge-caching
• Global load balancing
routes users to the
best location
• SteelApp can be installed
on private or public clouds
• Install on SteelHead for
complete optimization

Web Application FirewallApplication security
• Protects the application layer
• Complements end-point and network security
• Fits into existing architectures
• Flexible and highly scalable security software

Attempt access
Federated AuthenticationApplication security
Enterprise
Cloud
1
3
2
Succeed in attempt
Authenticate
Identity
Provider (IdP)
Service Provider (SP)
App

Proactive Performance
Measurement in the Cloud
• Continuous measurement
of end-user experience
• SteelApp automates
instrumentation for
applications
• Deep-dive analysis of
applications in the cloud or
data center
AppResponse Xpert SaaS Edition
file:////Rdbuild1.opnet.com/releases/_UNCERTIFIED_/ARX_SaaS_Edition/doc/doc_drop_07_20120906/index.html [1/25/2013 11:58:29 AM]
Response Time
A graph showing the average
response time, in seconds, for the
selected time range.
Violations
A bar chart showing the number
of violations and when they
occurred for the selected time
range.
For more information, see
violations.
Traffic Volume
A graph showing the number of
page views for the selected time
range.
Browser Details
A pie chart showing the web
browsers used to view page for
the selected time range.
Platform Details
A pie chart showing the operating
systems used to view pages for
the selected time range.
Geography
A map showing
performance/usage for the
selected time range. You can
inspect information for specific
countries or drill-down into
regions.
Use the zoom buttons ( ) to
zoom in and out. Alternately, use
the mouse wheel. Additionally,
when zoomed in, you can pan
up/down/left/right by holding down
the left-mouse button on the map
and dragging.
About Granularity For the Apdex, Response Time, Violations, and Traffic Volume views, notice that the granularity of the data (the time interval used to
organize data) is shown in the lower-right corner of the chart. The granularity is based on the length of the selected time range, as listed in the following
table.
Metrics collated analyzed and
shared centrally via browserSteelCentral
Web Analyzer
End-User Experience MonitoringApplication visibility

Driving business alignment in the cloudWhat Sets SteelApp Apart?
Virtual ADC Flex Instance
ADC
Dedicated
SW ADC
ON PREM DCWeb
TierData
Tier
Dev
Tier
App
Tier
PUBLIC CLOUD
App
TierData
Tier
Dev
Tier
Web
Tier
PRIVATE CLOUDApp
TierData
Tier
Dev
Tier
Web
Tier
App
TierData
Tier
Dev
Tier
Web
Tier
MANAGED HOSTING
Fully distributed licensing of application bandwidth
priced for the cloud• Any size instance
• Any form factor
• Any location
• Adaptable in the cloud
• Pay for what you need when you need it
• Burst when demand requires

THANK YOU