Efficiency & Streamlining Following Implementation of the ...
54
Efficiency & Streamlining Following Implementation of the Core Laboratory Shauna Thompson, MLT, MBA, Senior Director, Dr. Amy Lou, M.D. Ph.D. FCACB, Clinical Biochemist NSHA Pathology and Laboratory Medicine Pathology Grand Rounds Nov. 10, 2016
Transcript of Efficiency & Streamlining Following Implementation of the ...
Efficiency & Streamlining Following Implementation of the
Core Laboratory
Shauna Thompson, MLT, MBA, Senior Director,
Dr. Amy Lou, M.D. Ph.D. FCACB, Clinical Biochemist
NSHA Pathology and Laboratory Medicine
Pathology Grand Rounds Nov. 10, 2016
Objectives
• Provide a brief overview on the implementation of the Core Laboratory
• Demonstrate how laboratory TAT and FTEs were affected following the implementation of the Total Automation System
• Discuss how the analysis of the TAT data helps identify potential areas for quality improvement.

What is a CORE laboratory? Consolidation of analytical instruments into a
common area of analytical instruments for various disciplines: Chemistry Hematology Coagulation Immunology
Automation of specimen processing (pre-post
analytics) Transport Processing Reporting Archival

CURRENT MANUAL PROCESSES
Sample tubes received in lab Tubes unpackaged, sorted Bar codes read Tubes examined Tubes put in centrifuge Centrifuge balanced Tubes spun in centrifuge Centrifuge unloaded Aliquots made & labeled Aliquots sorted, bar codes read
Tubes sorted & stored Tubes unloaded ± Samples diluted & re-run Tests run Instrument programmed Loaded into instrument Sorted into test groups Tubes examined Received by technologist Tubes sent to workstations
All of these steps will be automated
How does the CORE laboratory work?

Business Case 1. Improved Patient Care
• Laboratory able to deliver consistent, accurate results in a predictable timeframe to health care providers
• Faster turnaround of test results by standardizing workflow and eliminating many manual steps
• Improved patient safety Reduced errors caused by fatigue Reduced labelling errors Fewer breakages
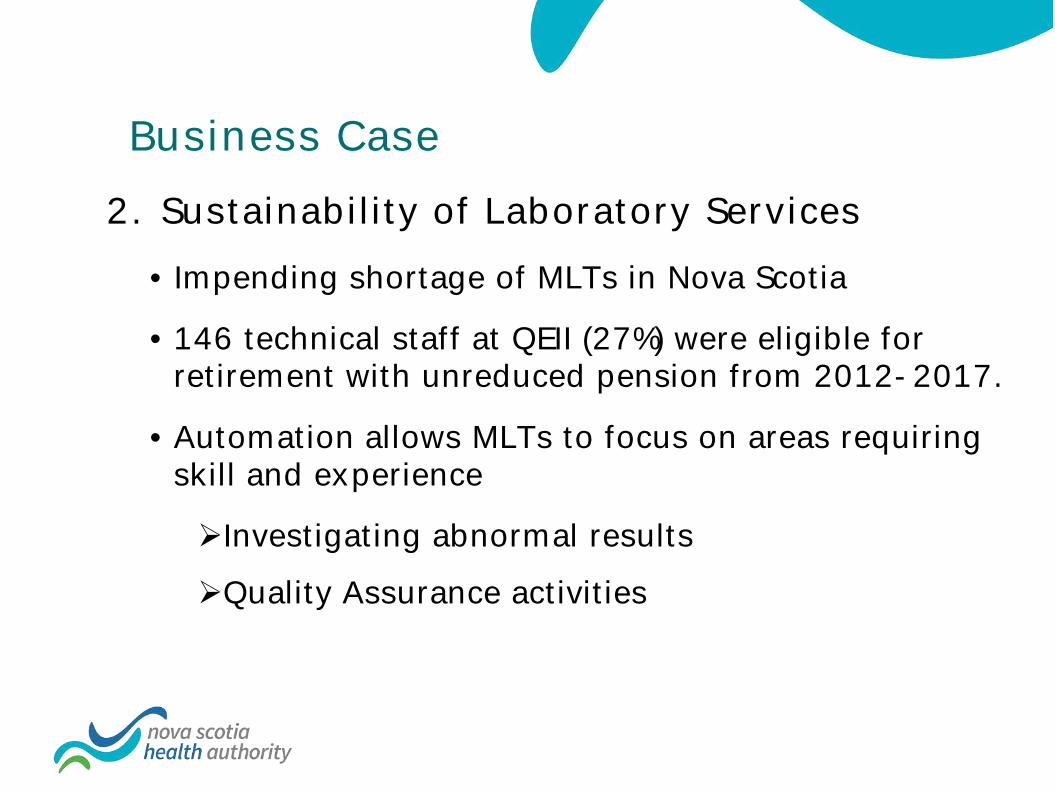
2. Sustainability of Laboratory Services • Impending shortage of MLTs in Nova Scotia
• 146 technical staff at QEII (27%) were eligible for retirement with unreduced pension from 2012-2017.
• Automation allows MLTs to focus on areas requiring skill and experience
Investigating abnormal results Quality Assurance activities
Business Case

3. Improved Employee Safety
Minimize exposure of technical staff to blood-borne pathogens using enclosed automated system for:
Decapping Aliquotting Centrifugation Transportation between instruments Recapping (sealing) for storage
Business Case

Business Case
• All routine Chem/Heme/Coag/Immuno testing in Central Core Lab
• Reduction of 29 FTEs system wide (achieved through attrition)
• Operational savings = $2.2M
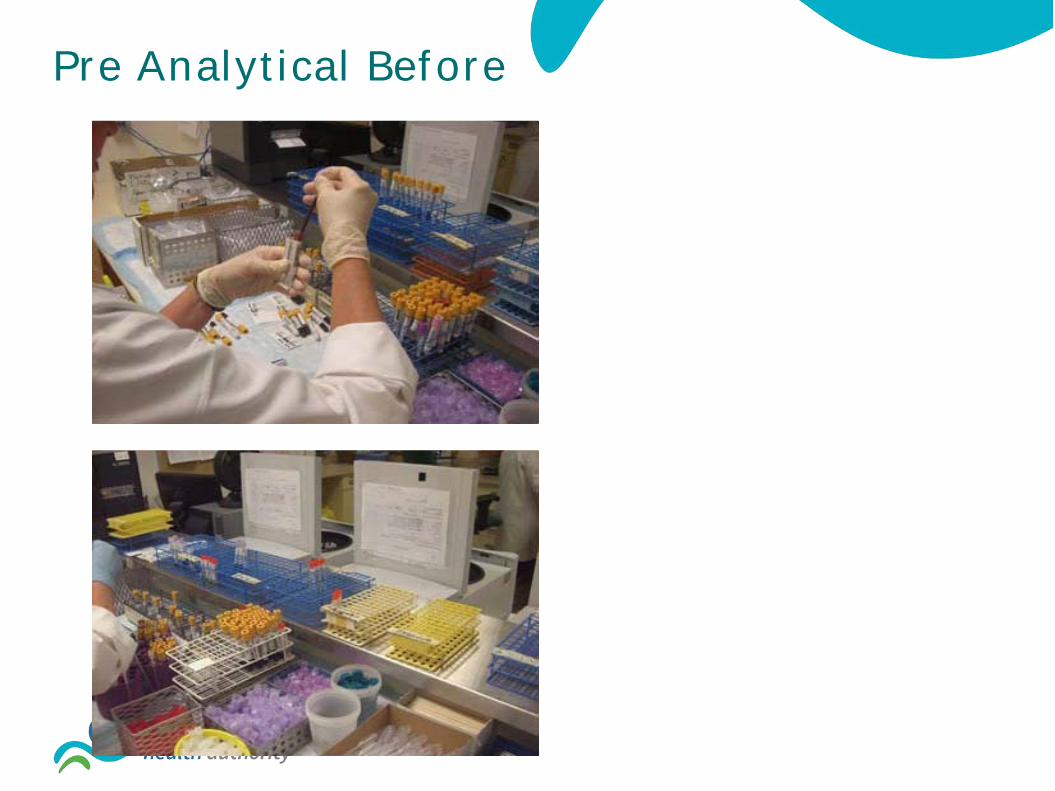
Pre Analytical Before
• Process approx. 7000 tubes of blood each day
• 60% (4200) are subdivided into additional tubes
•Samples delivered manually to testing areas
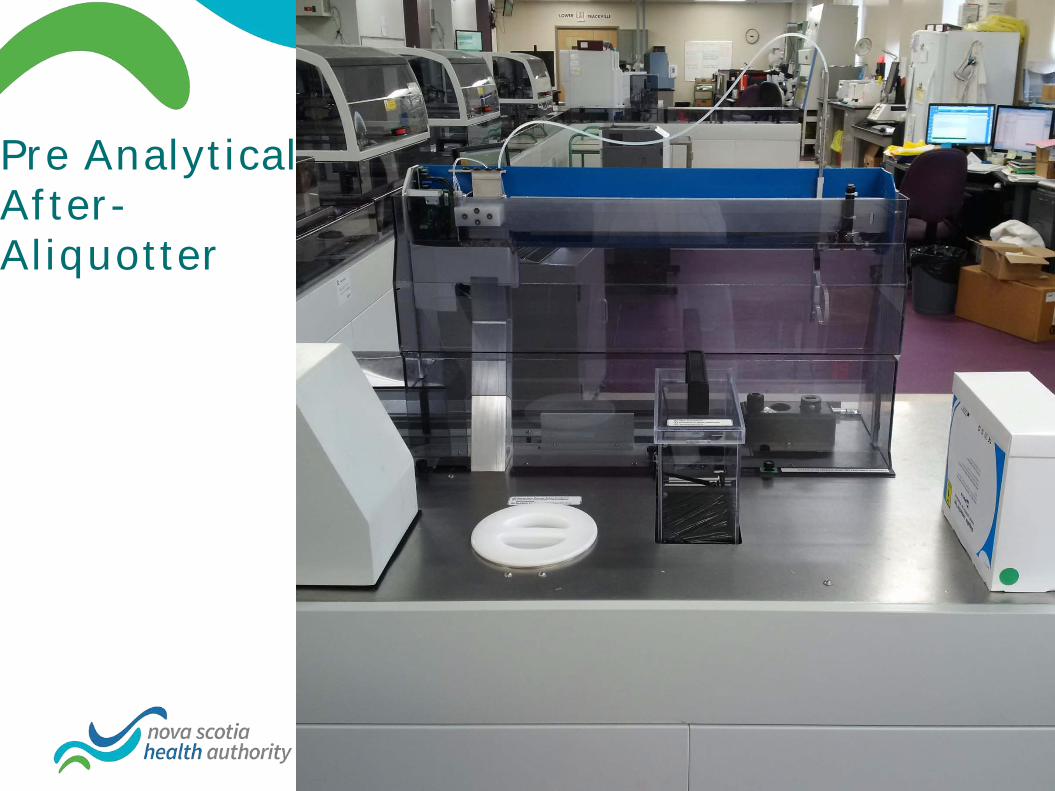
Pre Analytical After-Aliquotter

Automated tube transport between 1st and 2nd floor Mackenzie
Specimen Transport (VTS)

Analytical Before

Automated Track Connects to Analyzers

Sample Storage Before

Automated Track Connects to Tube Storage Units

Change Management
• Multi-stakeholder engagement • Involving end users in planning and design • Communication Frequent communications/updates FAQs Transparency
• Involve end users to implement the changes • Provide support • Celebrate milestones!
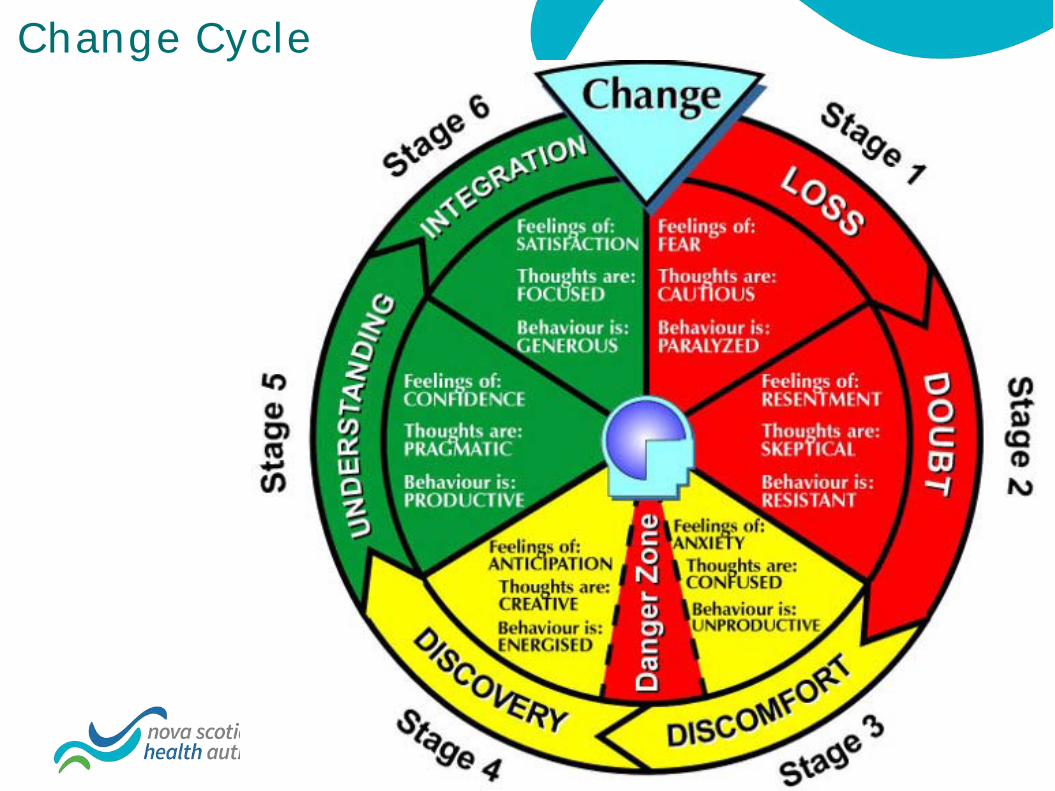
Change Cycle

Turnaround Time (TAT)-
a Key Quality Indicator of Laboratory Performance

Analytical 20%
Specimen Processing 27%
Transport 13%
13% Post Analytical
27%
Turnaround Time- Total Laboratory Testing Cycle
Sample Collection
Result Reporting Test Ordering
Phlebotomy
Lab receipt
Improving Turnaround Time • Solutions to improve TAT
– Pre-analytical • Electronic test order entry • Specimens transportation by pneumatic tube systems • Use of a high speed centrifuge • Use of plasma rather than serum specimens • Training of laboratory staff to expedite handling of urgent
samples
– Analytical • Consolidation of analytical platforms • Interfacing instruments
– Post-analytical • Auto-verification of results

Core Laboratory Establishment Early 2013-May 2015
Pre-analytical: Electric Track Vehicle (ETV) System
Pre- & analytical: Total Laboratory Automation (TLA)
Post-analytical : Auto-Verification

Module Number Module Number Input/output module 2 Aliquoter 1 BIM (bulk Input module
1 Architect c16000 3
Centrifuge module 3 Architect i2000 5 De-capper module 2 Sysmex XN1000 3 Re-sealer 1 ACL TOP 700 (IL) 2 De-sealer 1 Tube storage module 2
Total Laboratory Automation System Layout
• Processing 3600 tubes per hour • Total distance traveled from IOM to
Storage is 96.6 meters • Total time traveled: 9.5 minutes. • Total Track Footprint is about 3000 feet2 • The largest and most complex system in
North America !!
CBC
Coag
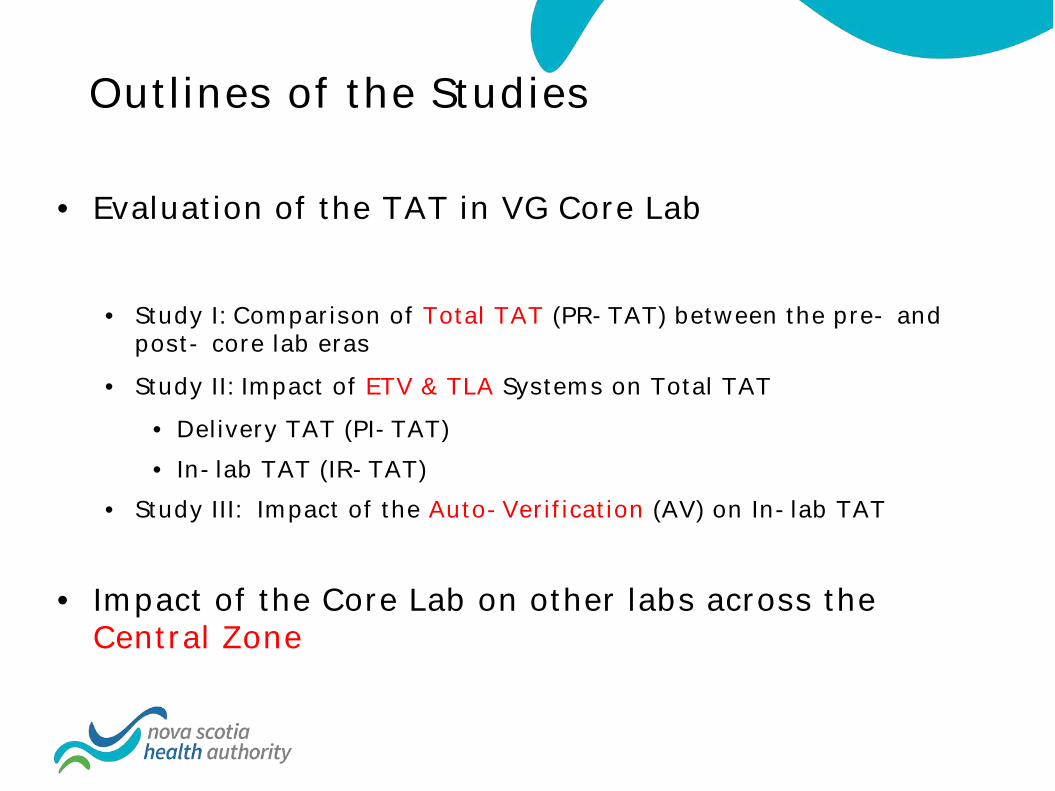
Outlines of the Studies
• Evaluation of the TAT in VG Core Lab • Study I: Comparison of Total TAT (PR-TAT) between the pre- and
post- core lab eras • Study II: Impact of ETV & TLA Systems on Total TAT
• Delivery TAT (PI-TAT) • In-lab TAT (IR-TAT)
• Study III: Impact of the Auto-Verification (AV) on In-lab TAT
• Impact of the Core Lab on other labs across the Central Zone
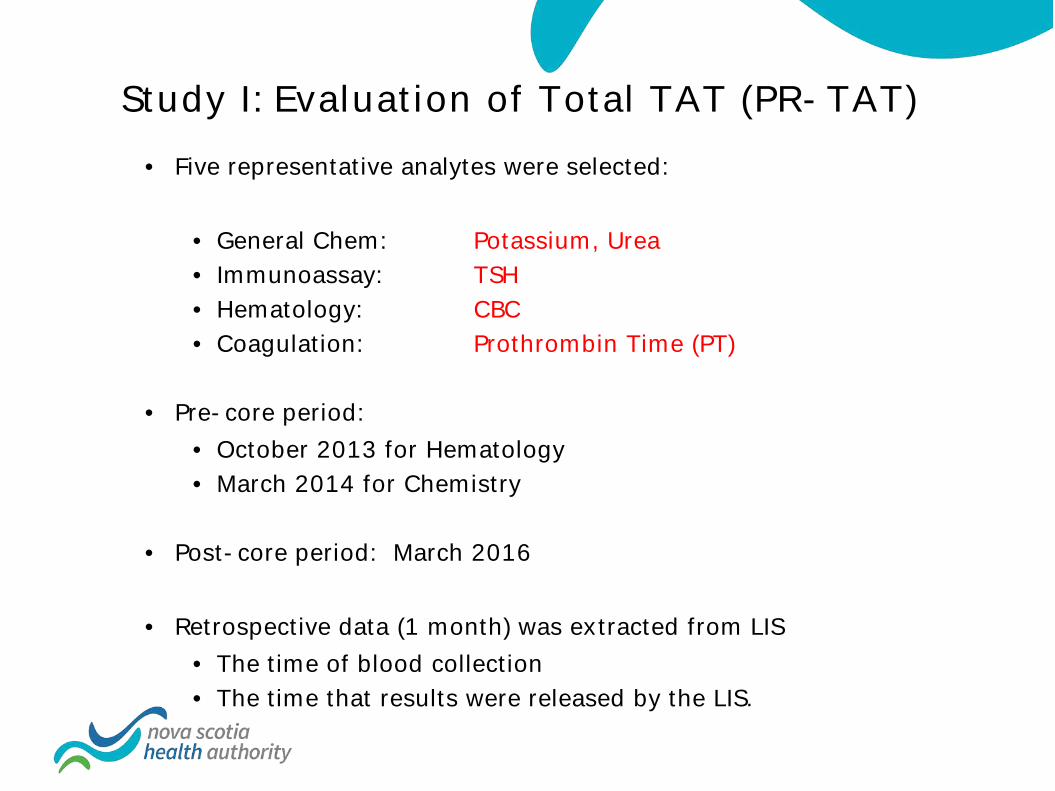
Study I: Evaluation of Total TAT (PR-TAT) • Five representative analytes were selected:
• General Chem: Potassium, Urea • Immunoassay: TSH • Hematology: CBC • Coagulation: Prothrombin Time (PT)
• Pre-core period:
• October 2013 for Hematology • March 2014 for Chemistry
• Post-core period: March 2016
• Retrospective data (1 month) was extracted from LIS
• The time of blood collection • The time that results were released by the LIS.

Goals of Total TAT (PR-TAT) in Our Department
• Priorities of Test Requests
– STAT 1 hr
– Urgent 3 hrs
– Routine 8 hrs
– Outlier percentage rate <10% for each type of priorities
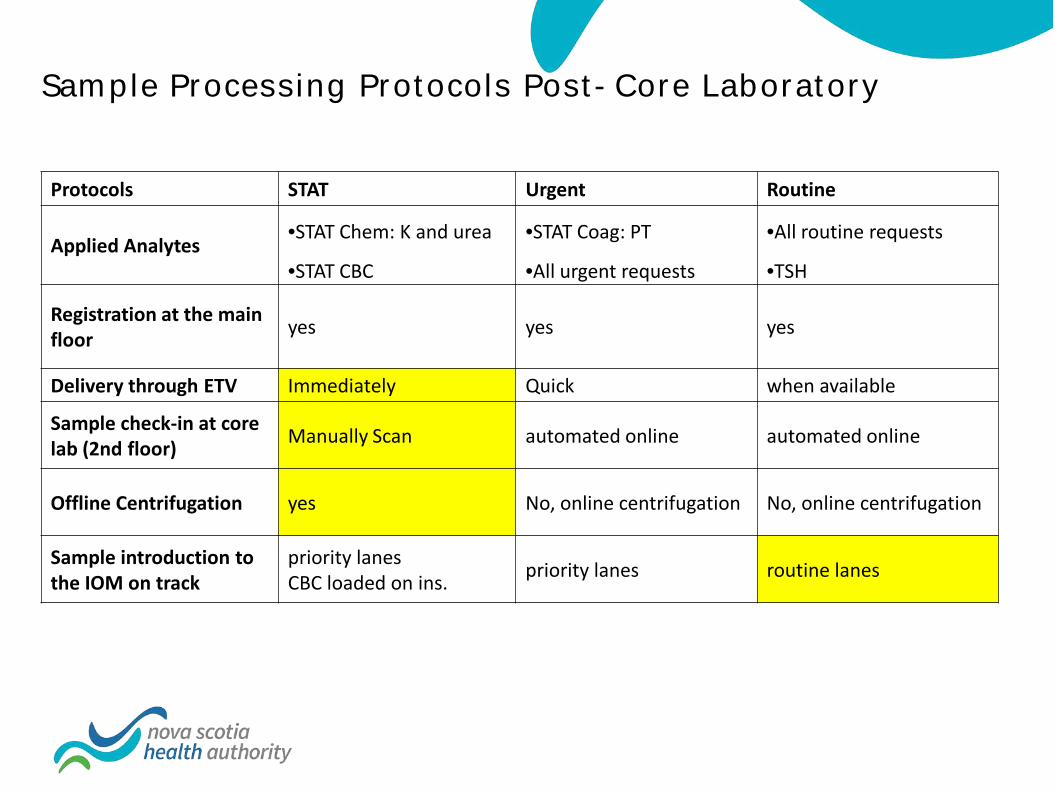
Sample Processing Protocols Post-Core Laboratory
Protocols STAT Urgent Routine
Applied Analytes •STAT Chem: K and urea •STAT Coag: PT •All routine requests
•STAT CBC •All urgent requests •TSH
Registration at the main floor yes yes yes
Delivery through ETV Immediately Quick when available
Sample check-in at core lab (2nd floor) Manually Scan automated online automated online
Offline Centrifugation yes No, online centrifugation No, online centrifugation
Sample introduction to the IOM on track
priority lanes CBC loaded on ins. priority lanes routine lanes

Analyte January - March 2014
January - March 2016
% increase in 2016 (naturally)
Routine samples referred-in to VG
in Apr. 2015
% referred-in samples to
total numbers
Potassium 44139 47983 8.7% 18962 28.3% Urea 33973 36194 6.5% 12844 26.2% TSH* 45886 47897 4.4% NA NA
CBC 52791 58971 11.7% 23733 28.7% PT 14383 15938 10.8% 4819 23.2%
TSH*: TSH has always been referred-in to VG laboratory. No extra referred samples after the TLA
Increase in Test Volumes from 2014 to 2016
STAT: 1% Urgent: 30% Routine: 70%

Results for Study I- STAT
Pre-core laboratory Post-core laboratory Priority
type Analyte potassium urea CBC PT potassium urea CBC PT
Stat
Sample number (n) 146 108 221 103 188 124 243 115
Mean (min) 73.5 74.7 43.1 57.9 72.8 74.9 51 74.6 SD 48.9 53 34.9 25.5 34.7 37.7 28.9 31.4
Median (min) 63.1 63 33.5 50.4 63.2 67.8 45.6 * 68.9 * 90% percentile
TAT (min) 105.1 100.2 72.5 80 106.4 102.3 82.6 112.7
OP-TAT 60min % 55.5% 55.6% 17.6% 28.2% 57.4% 63.7% 25.9% 66.1%
OP-TAT 90min% 15.8% 13.9% 6.3% 5.8% 18.1% 16.1% 8.6% 23.5%
• PR-TAT was comparable for chemistry analytes, but delayed by 15 min for hematology tests
• 90% completion time for STAT requests was 1.5-2 hours! • Outlier rates were worse and did not meet our goals

Results for Study I- Urgent
Pre-core laboratory Post-core laboratory Priority
type Analyte potassium urea CBC PT potassium urea CBC PT
Urgent
Sample number (n) 4165 3585 4464 2097 4569 4152 4674 1785
Mean TAT (min) 141.1 141.2 117.5 139.8 121.1 119.6 103.6 116.6
SD 61.8 56.5 61.2 63.2 49.9 47.5 59.1 50.5 Median
TAT (min) 133.1 133.8 108.3 127 111.2* 110.8 * 91.2 * 106 *
90% tile TAT (min) 201.2 202.3 182.3 211.6 174.7 107.4 166 175.7
OP-TAT 2 hrs (%) 62.8% 63.3% 41.4% 55.9% 40.0% 38.8% 25.7% 36.1%
OP-TAT 3 hrs (%) 16.3% 16.4% 10.6% 19.1% 8.8% 8.0% 7.6% 9.4%
• PR-TAT was improved by 25 min for all urgent tests • 90% completion times were < 3 hours • Outlier rates at 3hrs <10% and reduced by 50%

Results for Study I- Routine Pre-core laboratory Post-core laboratory Priority
type Analyte potassium urea CBC PT potassium urea CBC PT
Routine
Sample number (n) 10477 7669 15274 3625 11304 7801 14629 3395
Mean TAT (min) 337 336 241 223 185 181 160 169
SD 139 139 132 176 101 100 98 162 Median
TAT (min) 314 313 201 177 157 * 154 * 133 * 138 *
90% tile TAT (min) 523 523 413 387 316 311 286 289
OP-TAT 6 hrs (%) 39.5% 39.6% 19.4% 14.6% 5.6% 5.0% 3.8% 4.7%
OP-TAT 8 hrs (%) 22.0% 16.5% 4.1% 3.3% 1.2% 0.9% 0.4% 0.7%
• The PR-TAT were improved by 50-150 min (30-50% ) for all routine tests • 90% completion time was < 6 hours and outlier rates <10%!

K+ urea CBC PT K+ urea CBC PT Pre-core laboratory Post-core laboratory
Stat 73 75 43 58 73 75 51 75 Urgent 141 141 117 140 121 120 104 117 Routine 337 336 241 223 185 181 160 169
0
50
100
150
200
250
300
350
400 M
ean
PR-T
AT (m
in)
– The PR-TAT were significantly improved for urgent and routine requests, given the volume were about 35% higher post-core laboratory.
– For STAT requests, mean PR-TAT has no change for chemistry analytes while it is
delayed significantly for hematology testing. WHY ?
Summary for Study I

Study II: Impact of ETV & TLA Systems on Total TAT
PR- TAT was divided into PI - TAT (phlebotomy to in- lab, delivery) : Efficiency of the ETV system
IR- TAT (in- lab to reporting, in-lab): Efficiency of the TLA system
Representative analytes were grouped:
Hem: CBC and PT Chem: Potassium, Urea, TSH
Pre-core period: Hem tests: received, then processed in Hem lab
Chem tests: were centrifuged in ACS and then received in Chem lab
Post-core period Hem+ Chem samples were delivered through ETV
All samples are received, then processed in the core lab
Retrospective data was extracted from LIS

Study II: Impact of ETV on PI- TAT (delivery)
• Median PI-TATs were delayed by 12 min for STAT and urgent, but comparable for routine • 90% tile post-core delivery time was 59min (1hr), 131 min (2hrs) and 280 min (4hrs) for stat,
urgent and routine respectively and no improvement for the outlier rates
CBC pre-core (Oct-Dec 2013) post-core (Jan-Mar 2016) stat urgent routine stat urgent routine n 526 12460 40177 682 13997 44292
Mean (min) 29 73 136 38 84 152 SD 42 50 270 39 56 97
Median (min) 20 61 120 32* 74* 123 90% tile (min) 48 140 227 58 132 293
OP 60min 7.6% 50.9% 88.9% 8.5% 67.3% 92.5% OP 120min 2.3% 17.1% 50.4% 1.9% 13.8% 51.9%
PT pre-core (Oct-Dec 2013) post-core (Jan-Mar 2016) stat urgent routine stat urgent routine n 259 5730 9670 322 5322 10294
Mean 25 74 137 38 84 140 SD 20 73 166 23 59 120
Median 21 58 114 34* 73* 112 90% tile 43 139 245 59 131 274
OP 60min 6.2% 48.3% 84.8% 9.6% 66.3% 87.2% OP 120min 0.4% 16.0% 45.4% 1.2% 13.6% 44.6%

Analyte Parameters Pre-TLA Post-TLA STAT Urgent Routine STAT Urgent Routine
CBC Sample number (n) 526 12464 40177 682 13997 44292 Mean TAT (min) 20 43.2 95 16.4 21.5 16.8 SD 23.6 40.3 111 33 27.7 26.4 Median TAT (min) 12.4 34.1 43.5 8.7* 11.6* 11.3* 90th percentile (min) 43.2 90.4 257.4 36.7 50 26.5 OP-TAT 30 min (%) 15.6% 54.5% 59.1% 15.0% 18.3% 8.0% OP-TAT 60 min (%) 4.6% 25.8% 42.4% 3.1% 7.5% 2.6%
Study II: Impact of TLA on In-Lab TAT of Hema Analytes
• All parameters for TAT were improved dramatically • Median TAT reduced by 5min, 25min and 20 min for STAT, urgent and routine • 90% completion time was <60min for both tests on all priorities • OP –TAT exceeding 60 min <10%
Analyte Parameters Pre-TLA Post-TLA STAT Urgent Routine STAT Urgent Routine
PT Sample number (n) 259 5730 9670 322 5322 10294 Mean TAT (min) 35.4 64.3 80.9 34.3 34.4 31.9 SD 14.6 40.3 98.2 24.2 22.1 19.4 Median TAT (min) 31.1 56.4 42.8 26.9* 27.6* 27.1* 90th percentile (min) 49 106 217.6 50.8 53.8 43.4 OP-TAT 30 min (%) 54.8% 87.3% 80.8% 38.2% 35.3% 29.5% OP-TAT 60 min (%) 5.4% 45.6% 33.2% 6.5% 7.6% 4.8%

Summary for Study II on Hematology Testing
• Generally, delivery TAT > in-lab TAT •More remarkable in post-core lab
• ETV negatively impacted on delivery TAT •STAT: 12 min (60%) •Urgent: 14 min (23%) •Routine: no change
• TLA system significantly improved In-lab TAT •STAT :
•CBC- 3 min (25%) •PT- 4 min (13%)
•Urgent •CBC- 22 min (65%) •PT- 28 min (50%)
•Routine •CBC- 32 min (74%) •PT- 17 min (40%)
• Total TATs were improved for both urgent and routine, but not for STAT requests due to the longer delivery TAT after the core
pre-core post-core pre-core post-core in-lab TAT 12 9 31 27 delivery TAT 20 32 21 33
0 20 40 60 80
Med
ian
TAT
(min
s) STAT
CBC PT *
* *
* *
pre-core post-core pre-core post-core in-lab TAT 34 12 56 28 delivery TAT 61 74 58 73
0 20 40 60 80
100 120 140
Med
ian
TAT
(min
s)
Urgent CBC PT
* *
* *
* *
pre-core post-core pre-core post-core in-lab TAT 43 11 43 27 delivery TAT 120 123 114 112
0 50
100 150 200
Med
ian
TAT
(min
s)
Routine CBC PT
* *
* *

• Compared to pre-automation TAT excluded the centrifugation time, post-automation TATs were still reduced by
• STAT: 10min (24%) • Urgent: 14 min (26%) • Routine: 150 min (81%)
Jan Feb mar Jan Feb mar 2014 pre-automation 2016 post-automation
stat 43 43 41 29 28 28 urgent 55 54 53 40 39 40 routine 181 190 182 30 32 32
0 20 40 60 80
100 120 140 160 180 200
intr
a-la
bora
tory
TAT
(min
)
Potassium
Jan Feb March Jan Feb March 2014 pre-automation 2016 post-automation
stat 44 42 42 29 26 27 urgent 53 52 52 40 38 39 routine 183 192 184 30 34 33
0
50
100
150
200
250
intr
a-la
bora
tory
TAT
(min
)
Urea
Impact of TLA on In-lab TAT of Chem Analytes

Impact of TLA on In-lab TAT of TSH Testing
• Represent a group of tests
• Run during the day shifts, weekdays
• Treated as routine tests by lab
• TLA changes the running pattern
• Randomly and 24/7
• Median TAT reduction: 400 min ( 6.5 hrs)
• 90% completion: <90 min
TSH 2014 pre-TLA
2016 post-TLA
Sample number (n) 45886 47897
Mean TAT (min) 855 62
SD 976 55
Median TAT (min) 453 52 *
90% til (min) 1715 82
OP TAT 90 min (%) 98.0% 7.9%
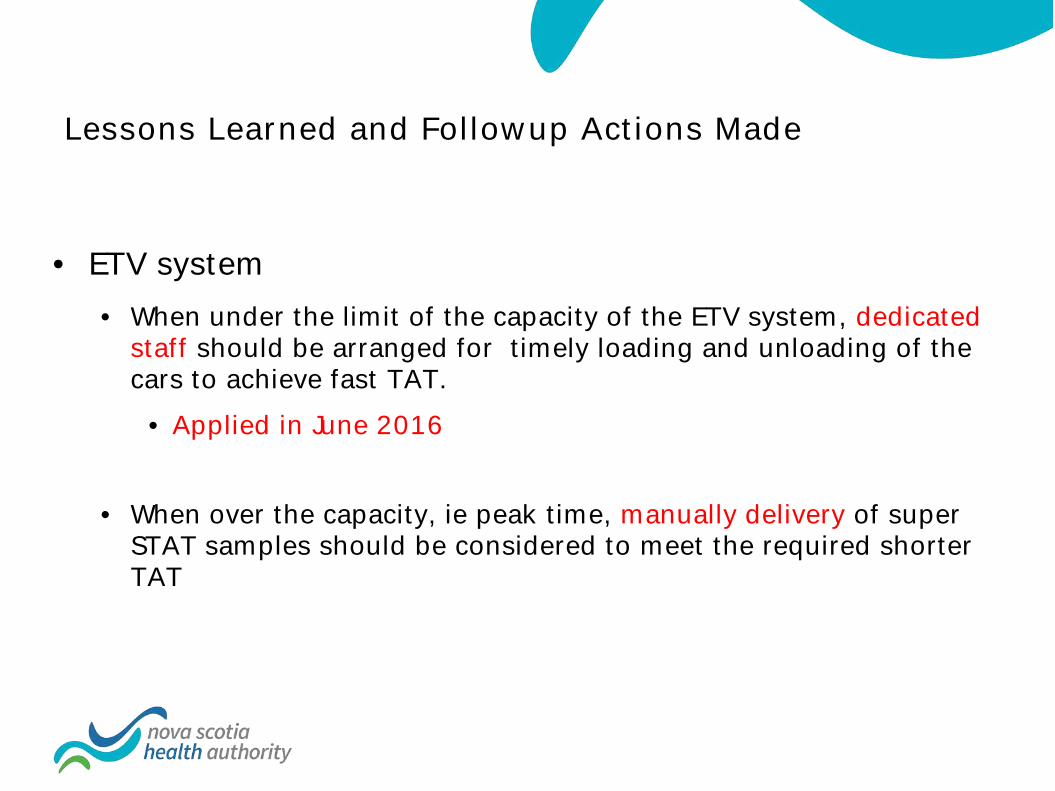
Lessons Learned and Followup Actions Made
• ETV system • When under the limit of the capacity of the ETV system, dedicated
staff should be arranged for timely loading and unloading of the cars to achieve fast TAT.
• Applied in June 2016
• When over the capacity, ie peak time, manually delivery of super STAT samples should be considered to meet the required shorter TAT

Lessons Learned and Followup Actions Made
• TLA system • Efficiently manage substantial amount of samples at a reasonable
TAT no matter what types of priorities
• To reach the shortest TAT, samples should be offline centrifuged and directly front loaded on to the analyzers
• There are no benefit with the current practice for STAT Chem
tests (off-line centrifugation then loading onto the IOM) • Practice has been changed for STAT Chem since Oct. 2016
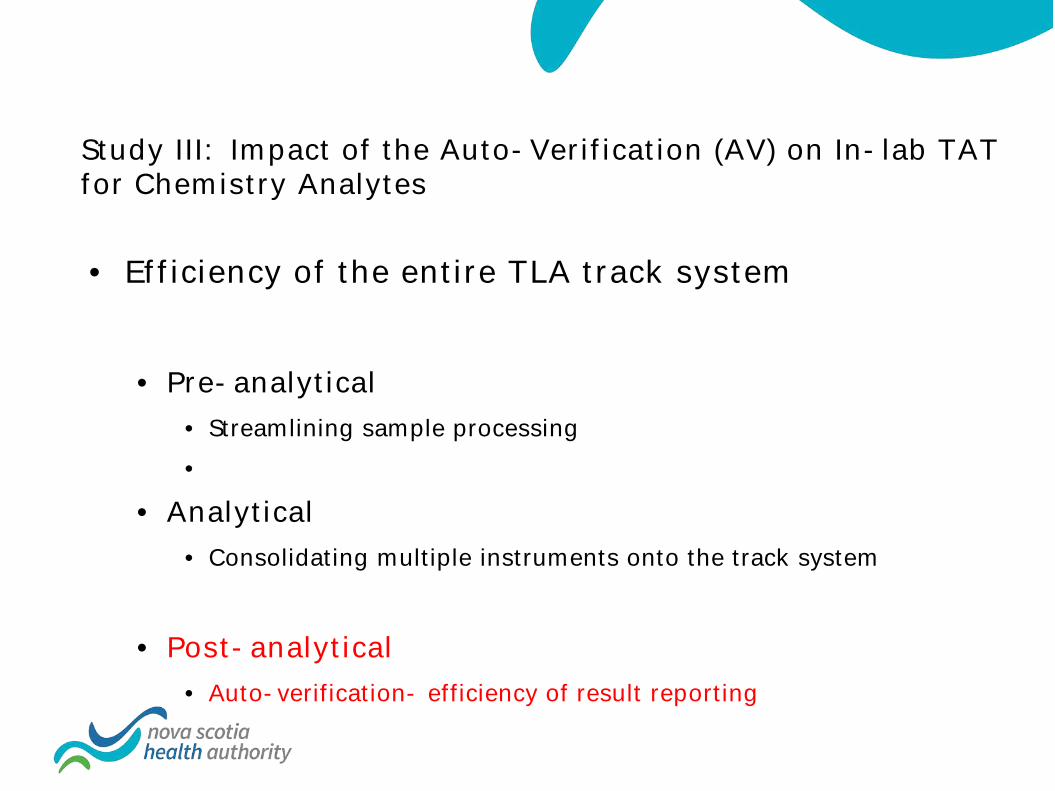
Study III: Impact of the Auto-Verification (AV) on In-lab TAT for Chemistry Analytes
• Efficiency of the entire TLA track system • Pre-analytical
• Streamlining sample processing •
• Analytical • Consolidating multiple instruments onto the track system
• Post-analytical
• Auto-verification- efficiency of result reporting

Introduction of Auto-Verification (AV)
• AV is a process of using computer-based rules to verify lab results without manual intervention
• Free up staff
• Improve the quality by standardizing the process of resulting
• Detect lab errors

Study III Approach
• Representative Analytes • Potassium and Urea
• Study periods 1. Pre-AV period: before TLA 2. AV-RR (Initial AV rules based on reference ranges):
• Potassium RR: 3.4-5.0 mmol/L • Urea RR: 2.5-9.2mmol/L
3. AV-advanced • AV cutoffs- Potassium: 3.2-5.3 mmol/L • AV cutoffs- Urea: 2.5-36 mmol/L
• Retrospective data was extracted from the LIS • the time that samples were loaded onto the IOM, • the time that results were released by LIS

Results: Impact of Auto-Verifications on In-lab TAT
Analytes Parameters AV - RR (Nov. 2015) AV –advanced (Mar. 2016)
STAT Urgent Routine STAT Urgent Routine Potassium Sample number (n) 159 4365 11434 165 4396 11229 Mean TAT (min) 44.4 46.5 40.1 27.7 39.4 32.4 SD 98.1 33.5 82.0 17.1 27.4 44.6 Median TAT (min) 30.7 37.6 29.3 23.6 * 34.7 * 27.3 90th percentile (min) 66.4 73.5 56.5 42.3 54.0 48.8 OP-TAT 60 min (%) 14.5% 15.4% 8.5% 4.3% 7.6% 5.3%
Urea Sample number (n) 116 3961 8117 124 4152 7801 Mean TAT (min) 35.4 46.3 40.0 26.8 38.5 33.2 SD 23.3 39.7 52.5 24.7 20.0 49.9 Median TAT (min) 28.9 37.4 30.5 22.3 * 33.4 * 29.1 90th percentile (min) 59.8 71.3 58.9 40.9 50.4 49.2 OP-TAT 60 min (%) 10.3% 15.0% 9.4% 2.4% 6.3% 5.3%
• Median TAT were reduced by 6 and 4 min for STA and urgent • 90% tile TAT were reduced by avg. 22, 20 and 9 min for STAT, Urgent and
Routine • OP-TAT 60 min for both tests were reduced from 38- 77% for different
priorities, indicating improvement of reporting consistency .

Impact of the Core Laboratory on the Community Hospitals- DGH
• What has been changed in other sites • Auto-verifications • Reduced routine test volume- referred to the core lab (65%) • Reduced FTEs- 1x tech-II and 2.5x tech-I (25% reduction)
• Impact of the changes on the in-lab TAT in DGH?
• Study periods
1. Pre-AV period: Oct. 2014 2. AV-RR: Mar. 2015 3. AV-RR + reduced test volume: Nov. 2015 4. AV-advanced + reduced test volume: Mar. 2016

Volume Changes in DGH
Volume priority 2014 Oct. (pre-core)
2015 Mar (post-core+
AV-RR)
2015 Nov. (refer VG+
AV-RR
2016 Mar. (refer VG +
AV-Adv.)
% diff Mar15-14
%diff Nov.15 -14
%Diff Mar.16-14
K stat 77 93 102 82 17% 32% 6% urgent 2290 2277 2134 1848 -1% -7% -19% routine 5608 (70%) 4852 1322 1324 -16% -76% -76%
urea stat 62 61 83 58 -2% 34% -6% urgent 2168 2144 2034 882 -1% -6% -59% routine 4110 (65%) 3450 982 888 -19% -76% -78%
K+Urea Total monthly 14238 12784 6555 5000 -11% -54% -65%
stat urgent routine stat urgent routine K urea
2014 Oct. 45 46 133 47 46 135 2015 mar 43 44 112 45 44 114 2015Nov. 42 40 53 40 40 53 2016 Mar 42 42 59 41 44 60
0 20 40 60 80
100 120 140 160
Med
ian
IR-T
AT (m
in)
1. AV-RR improved TAT by 21 min for routine requests! 2. Decreased routine test volume shorten the TAT further by 1 hr
Median IR-TAT in DGH Site
NO AV AV-RR
AV-RR + Vol AV-adv + Vol
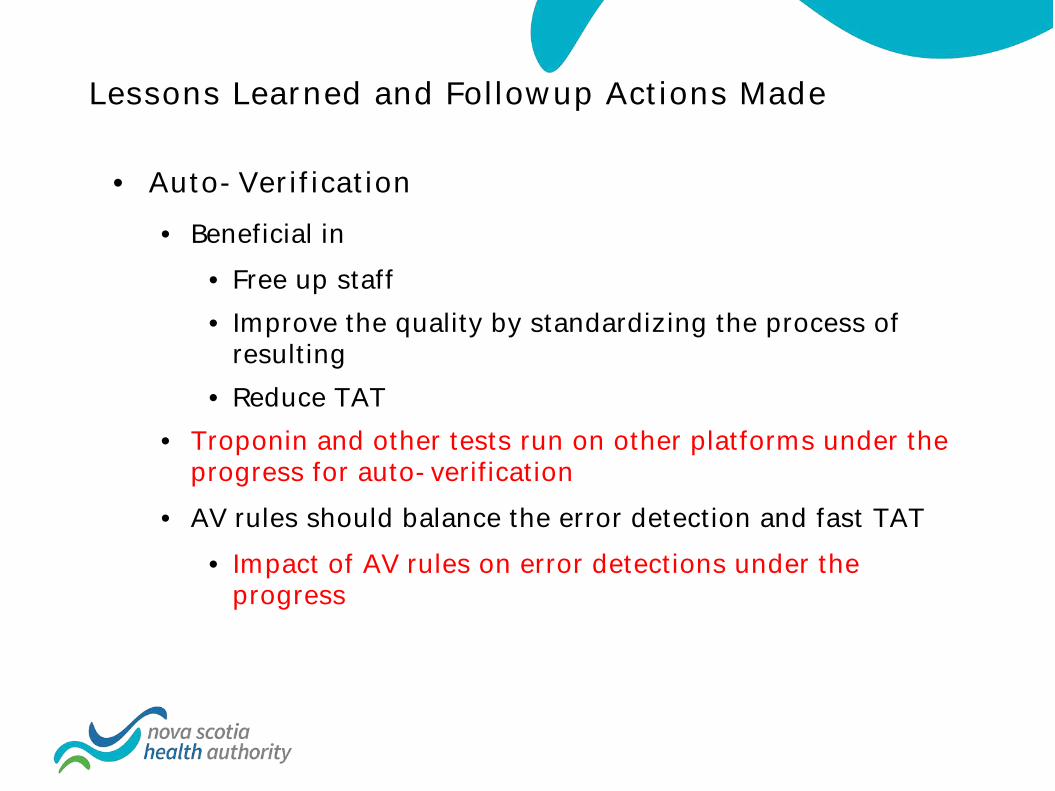
Lessons Learned and Followup Actions Made
• Auto-Verification • Beneficial in
• Free up staff • Improve the quality by standardizing the process of
resulting • Reduce TAT
• Troponin and other tests run on other platforms under the progress for auto-verification
• AV rules should balance the error detection and fast TAT • Impact of AV rules on error detections under the
progress
Continue Monitoring TAT Across the Central Zone Following the Core
Laboratory
• Review the goals • Recommendations

Test volumes for all the labs in the Central Zone (June, 2016)
1. All routine requests is under the control of the VG Core lab with the TLA
2. TAT for STAT request – HI site
3. TAT for urgent requests should be the focus for all the sites
Volume STAT Urgent % Urgent K + Trop K + Trop K + Trop
CCHC Site 2 3 1166 372 100% 99% DGH Site 114 71 1898 773 94% 92% HCH Site 1 0 298 123 100% 100% HI Site 836 364 7365 1512 90% 81%
VG Core Lab Site 165 125 4707 276 97% 69%
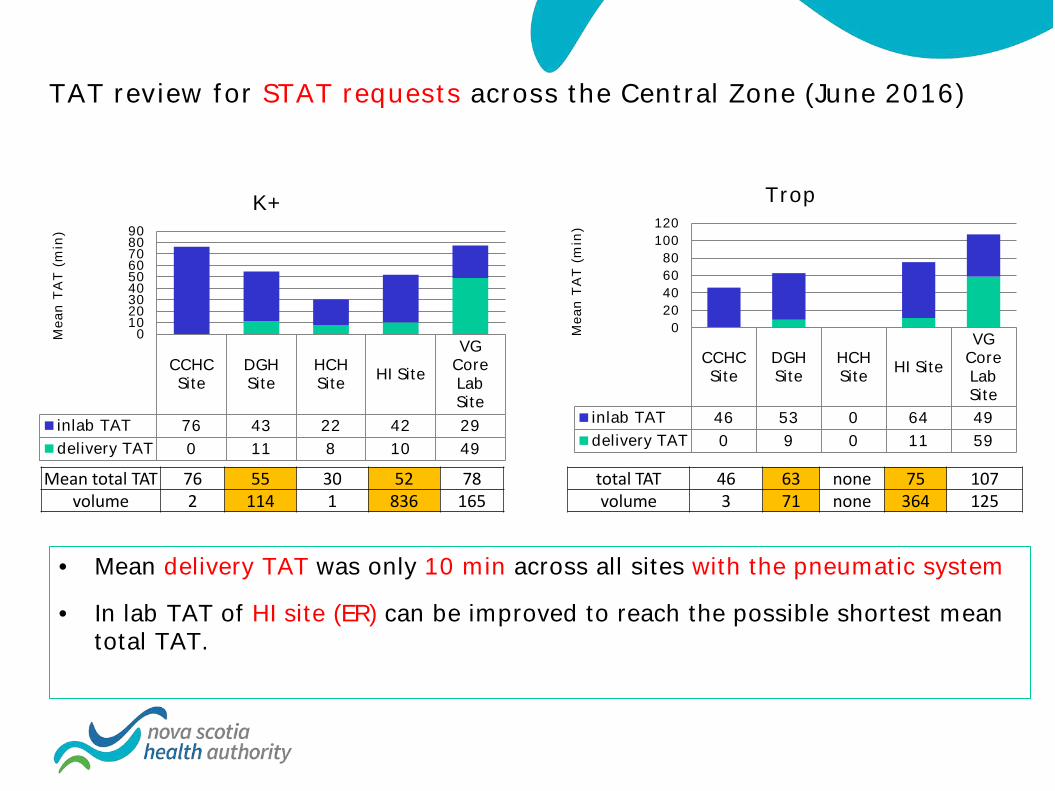
TAT review for STAT requests across the Central Zone (June 2016)
CCHC Site
DGH Site
HCH Site HI Site
VG Core Lab Site
inlab TAT 76 43 22 42 29 delivery TAT 0 11 8 10 49
0 10 20 30 40 50 60 70 80 90
Mea
n TA
T (m
in)
K+
CCHC Site
DGH Site
HCH Site HI Site
VG Core Lab Site
inlab TAT 46 53 0 64 49 delivery TAT 0 9 0 11 59
0 20 40 60 80
100 120
Mea
n TA
T (m
in)
Trop
Mean total TAT 76 55 30 52 78 volume 2 114 1 836 165
total TAT 46 63 none 75 107 volume 3 71 none 364 125
• Mean delivery TAT was only 10 min across all sites with the pneumatic system
• In lab TAT of HI site (ER) can be improved to reach the possible shortest mean total TAT.

TAT Review for Urgent Request Across the Central Zone
CCHC Site
DGH Site
HCH Site HI Site
VG Core Lab Site
inlab TAT 56 47 40 51 48 delivery TAT 2 14 6 23 87
0 20 40 60 80
100 120 140 160
Mea
n TA
T (m
in)
Urgent K+
CCHC Site
DGH Site
HCH Site HI Site
VG Core Lab Site
inlab TAT 51 50 37 72 64 delivery TAT 5 29 10 23 84
0 20 40 60 80
100 120 140 160
Mea
n TA
T (m
in)
Urgent Trop
total TAT 59 61 46 73 134
volume 1166 1898 298 7365 4707 total TAT 56 79 46 88 148
volume 372 773 123 1512 276
• HI site shows the longest delivery, in-lab and total TAT for both K and Trop, which can be associated with the highest volume.
• By comparing the TAT across the sites, each lab should determine its own goals
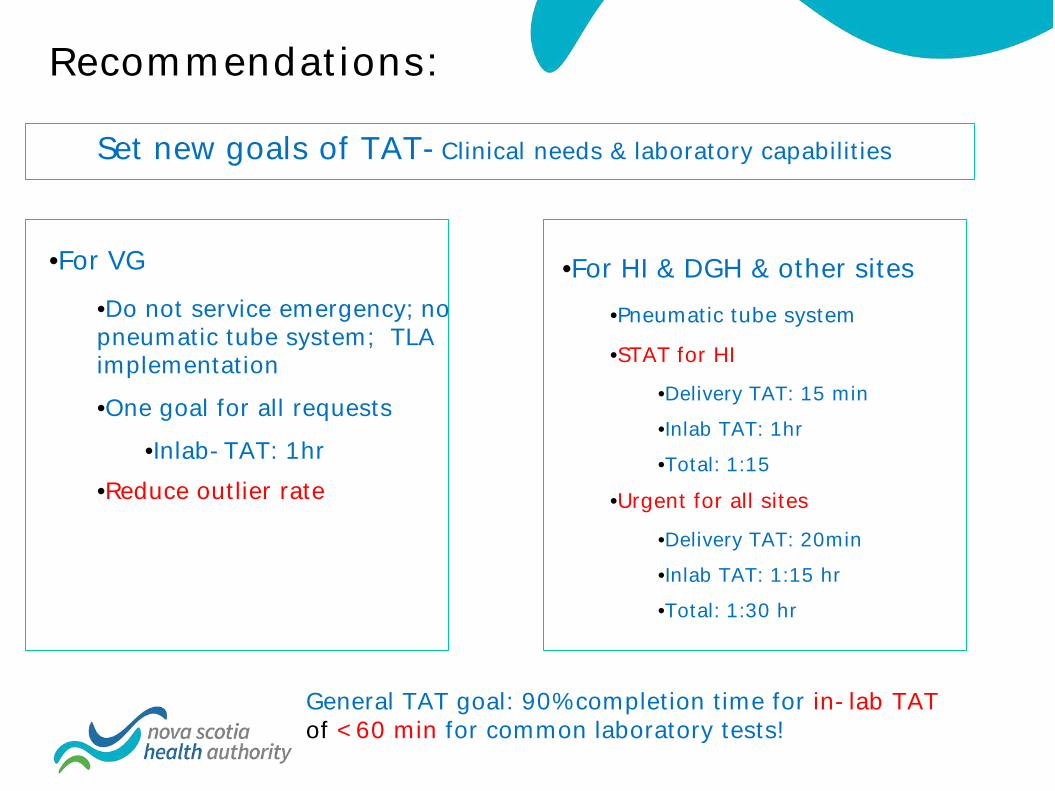
Recommendations:
•For VG •Do not service emergency; no pneumatic tube system; TLA implementation •One goal for all requests
•Inlab-TAT: 1hr •Reduce outlier rate
•For HI & DGH & other sites •Pneumatic tube system
•STAT for HI •Delivery TAT: 15 min •Inlab TAT: 1hr •Total: 1:15
•Urgent for all sites
•Delivery TAT: 20min •Inlab TAT: 1:15 hr •Total: 1:30 hr
Set new goals of TAT-Clinical needs & laboratory capabilities
General TAT goal: 90% completion time for in-lab TAT of <60 min for common laboratory tests!

Summary
• Significant positive impact of Core Lab on the laboratory service as a whole. • Improvement of total TAT across all the labs in the Central Zone
• Reduced workload on other community labs
• Cost savings in FTEs
• 25% reduction in the community labs • 13% reduction in the QEII
• Change in workflow has driven new considerations in monitoring TAT • Setting new goals of TAT based on the clinical requirements and the laboratory
capabilities/limitations
• 90% completion time and outlier rate of TAT are more effective measurements of TAT and can be a marker of greater value for lab services and related clinical outcomes.
• Analysis of the different phases of TAT helps identify potential areas for continuous quality improvement

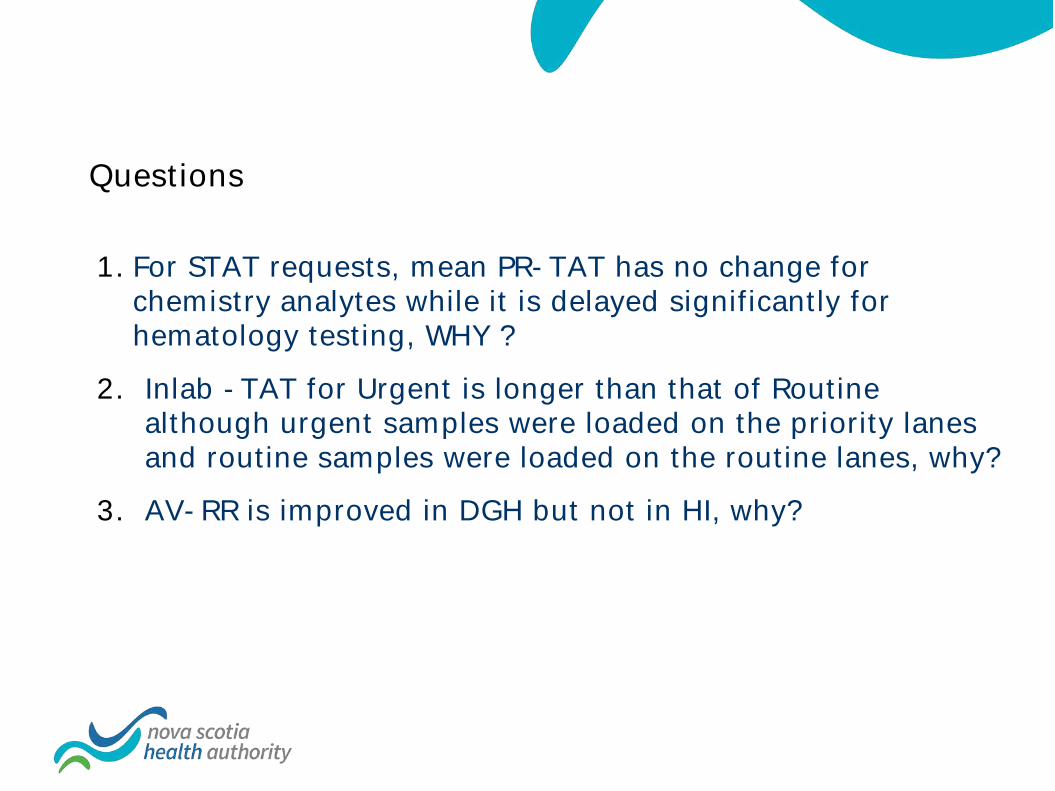
Questions
1. For STAT requests, mean PR-TAT has no change for chemistry analytes while it is delayed significantly for hematology testing, WHY ?
2. Inlab -TAT for Urgent is longer than that of Routine although urgent samples were loaded on the priority lanes and routine samples were loaded on the routine lanes, why?
3. AV-RR is improved in DGH but not in HI, why?