Efficacy Report WISCV - Pearson | The world's · PDF fileEfficacy Report WISCV ......
36
Efficacy Report WISCV March 23, 2016 1
Transcript of Efficacy Report WISCV - Pearson | The world's · PDF fileEfficacy Report WISCV ......
Efficacy Report
WISCV
March 23, 2016
1

Product Summary
Intended Outcomes
Foundational Research
Intended Product Implementation
Product Research
Future Research Plans
2
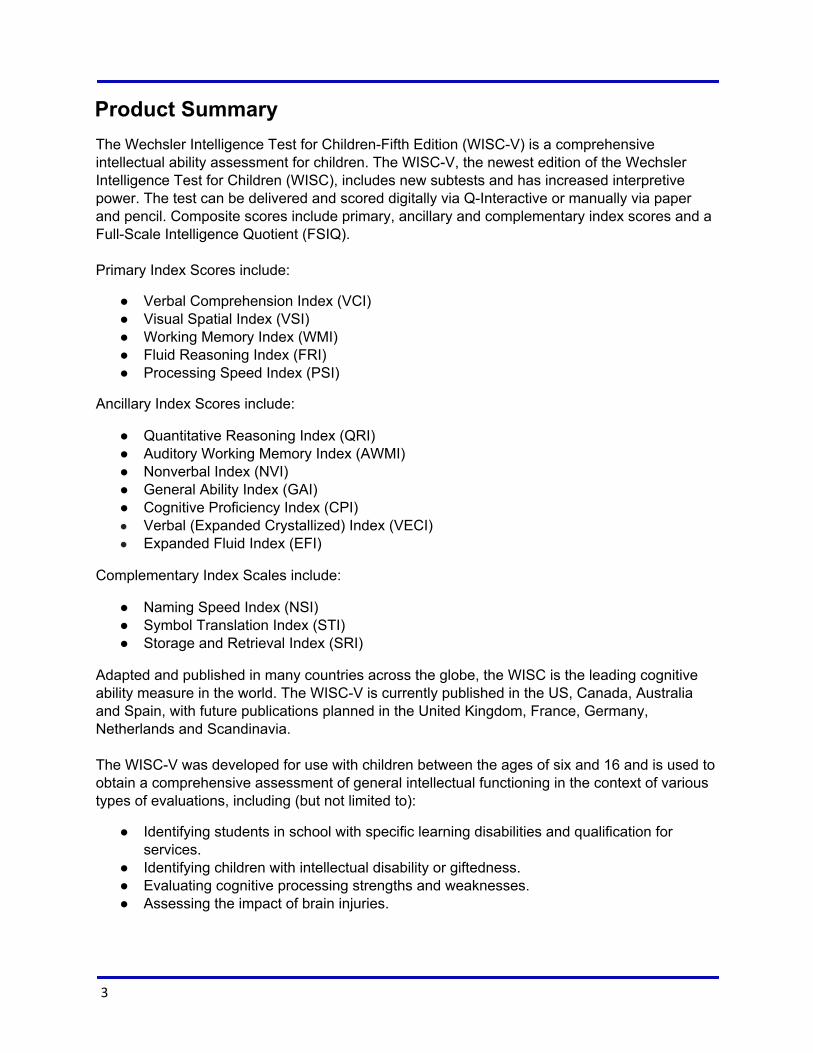
Product Summary The Wechsler Intelligence Test for ChildrenFifth Edition (WISCV) is a comprehensive intellectual ability assessment for children. The WISCV, the newest edition of the Wechsler Intelligence Test for Children (WISC), includes new subtests and has increased interpretive power. The test can be delivered and scored digitally via QInteractive or manually via paper and pencil. Composite scores include primary, ancillary and complementary index scores and a FullScale Intelligence Quotient (FSIQ). Primary Index Scores include:
Verbal Comprehension Index (VCI) Visual Spatial Index (VSI) Working Memory Index (WMI) Fluid Reasoning Index (FRI) Processing Speed Index (PSI)
Ancillary Index Scores include:
Quantitative Reasoning Index (QRI) Auditory Working Memory Index (AWMI) Nonverbal Index (NVI) General Ability Index (GAI) Cognitive Proficiency Index (CPI) Verbal (Expanded Crystallized) Index (VECI) Expanded Fluid Index (EFI)
Complementary Index Scales include:
Naming Speed Index (NSI) Symbol Translation Index (STI) Storage and Retrieval Index (SRI)
Adapted and published in many countries across the globe, the WISC is the leading cognitive ability measure in the world. The WISCV is currently published in the US, Canada, Australia and Spain, with future publications planned in the United Kingdom, France, Germany, Netherlands and Scandinavia. The WISCV was developed for use with children between the ages of six and 16 and is used to obtain a comprehensive assessment of general intellectual functioning in the context of various types of evaluations, including (but not limited to):
Identifying students in school with specific learning disabilities and qualification for services.
Identifying children with intellectual disability or giftedness. Evaluating cognitive processing strengths and weaknesses. Assessing the impact of brain injuries.
3
The WISC has been revised frequently over the last seven decades to incorporate advances in the field of intellectual assessment, to update norms that reflect population changes, to update item content to reflect changes in culture and technology, and to meet the practical and clinical needs of contemporary society. The original WISC adapted subtests of the Wechsler–Bellevue Intelligence Scale (Wechsler, 1939) for use with children. It provided a Verbal IQ (VIQ), Performance IQ (PIQ), and Full Scale IQ (FSIQ). The WISC–Revised (WISCR) retained all 12 subtests from the first edition, shifted the age range, and continued to offer a VIQ, PIQ, and FSIQ. The WISC–Third Edition (WISCIII) retained all of the subtests from the WISC–R and introduced a new subtest. The WISC–III introduced four new index scores that represented more narrow domains of cognitive function: the Verbal Comprehension Index, the Perceptual Organization Index, the Freedom from Distractibility Index, and the Processing Speed Index. It continued to offer a VIQ, PIQ, and FSIQ. The Wechsler Intelligence Scale for Children–Fourth Edition (WISCIV) dropped three subtests that appeared on the WISC–III. Ten of the subtests were retained with revised item content and scoring procedures. Five new subtests were developed. The traditional VIQ and PIQ scores were eliminated, and the FSIQ was retained. Several process scores, which provided more detailed information about certain aspects of WISCV performance, also were included. The revision goals for the WISC–V were generally to consider advances in structural models of intelligence, cognitive neuroscience, neurodevelopmental research, psychometrics, and contemporary practical clinical demands. The latter included revising instructions and item phrasing to enhance comprehension of the task demands; simplifying scoring criteria, shortening testing time; improving psychometric properties in norming methods; improving floors and ceilings; increasing significance level options for critical values; improving the measure of visual spatial processing, fluid reasoning, and working memory; adding a variety of new composite scores to provide more clinical information; and adding measures of cognitive processes that are sensitive to learning problems. These considerations are appropriate and collectively refine the entire battery.
4
Intended Outcomes
Overview of Intended Outcomes
The efficacy of the WISCV can be conceptualized as its quality as a signal of general intellectual ability. Signal quality, in turn, can be characterized as a function of the fairness of the assessments, the consistency and accuracy of scores (reliability), and the extent to which the assessment allows test users to make sound interpretations of children’s intellectual functioning (validity) (AERA, APA, & NCME, 2014).
Intended Outcome 1: Test scores can be interpreted as measures of intelligence in children and can be used for identification, placement, and resource allocation (Validity). A key WISCV outcome is to enable test users to make sound interpretations about examinee ability and to support identification or placement decisions by providing measures that accurately capture general intellectual ability, as well as profiles of relative strengths and weaknesses across different aspects or domains of cognitive ability.
Intended Outcome 2: Test scores are consistent over time and/or over multiple raters (Reliability). Another important goal of the WISCV is to minimize errors in judgment and decisionmaking by providing scores that are consistent over different testing occasions and raters.
Intended Outcome 3: Test scores can be interpreted the same way for testtakers of different subgroups (Fairness). The WISCV also strives to provide scores that can be interpreted in the same way for all testtakers, regardless of gender or race/ethnicity. Fairness implies that when the assessments are administered as intended, items are not systematically biased against any particular group of testtakers and students are not hindered in demonstrating their skills by irrelevant barriers in the test administration procedures.
5
Foundational Research
Overview of Foundational Research
Contemporary intelligence research supports the presence of a general underlying global intelligence factor, which is manifest in several subabilities within specific domains, such as verbal ability (Gottfredson & Saklofske, 2009; Johnson, Bouchard, Krueger, McGue, & Gottesman, 2004). The design of the original Wechsler intelligence test was consistent with this view, positing an underlying global intelligence factor, with subtests focused on specific aspect of cognitive abilities, including verbal comprehension, abstract reasoning, visual spatial processing, quantitative reasoning, memory, and processing speed. Despite periodic revisions to the particular mix of subtests with each new edition of the Wechsler tests, this general approach of modeling intelligence using a hierarchical structure persists. Moreover, some of the original subtests (e.g., Block Design and Vocabulary) continue to appear in modified form on other published intelligence measures, confirming their continued relevance to intelligence theory today. Several of the new subtests of the WISCV are based on subtests appearing on either the WAIS or the WPPSI that have already been wellresearched. Finally, in line with recent advances in intelligence theory, updates to the latest version include new measures of visual spatial ability, fluid reasoning, and working memory; separate visual spatial and fluid reasoning composites; and improvements of the measure of verbal comprehension and processing speed.
6
Intended Product Implementation
Overview of Intended Product Implementation
The WISCV was developed over the course of five years by an expert team including doctorallevel scientists and clinicians and an advisory panel who provided expert advice about intellectual ability testing, clinical utility, specific learning disabilities, and child neuropsychology. Administration of the WISCV can take place in digital or paper format. It is used to assess for intellectual disability, intellectual giftedness, and specific learning disabilities; and is frequently part of a battery to examine cognitive functioning in ADHD and Autism Spectrum Disorder. Complete details on test administration, scoring, and interpretation can be found in the WISCV administration manual and in Kaufman, Raiford, and Coalson (2016) and Weiss, Saklofske, Holdnack, and Prifitera (2015).
7
Product Research
Overview of Product Research
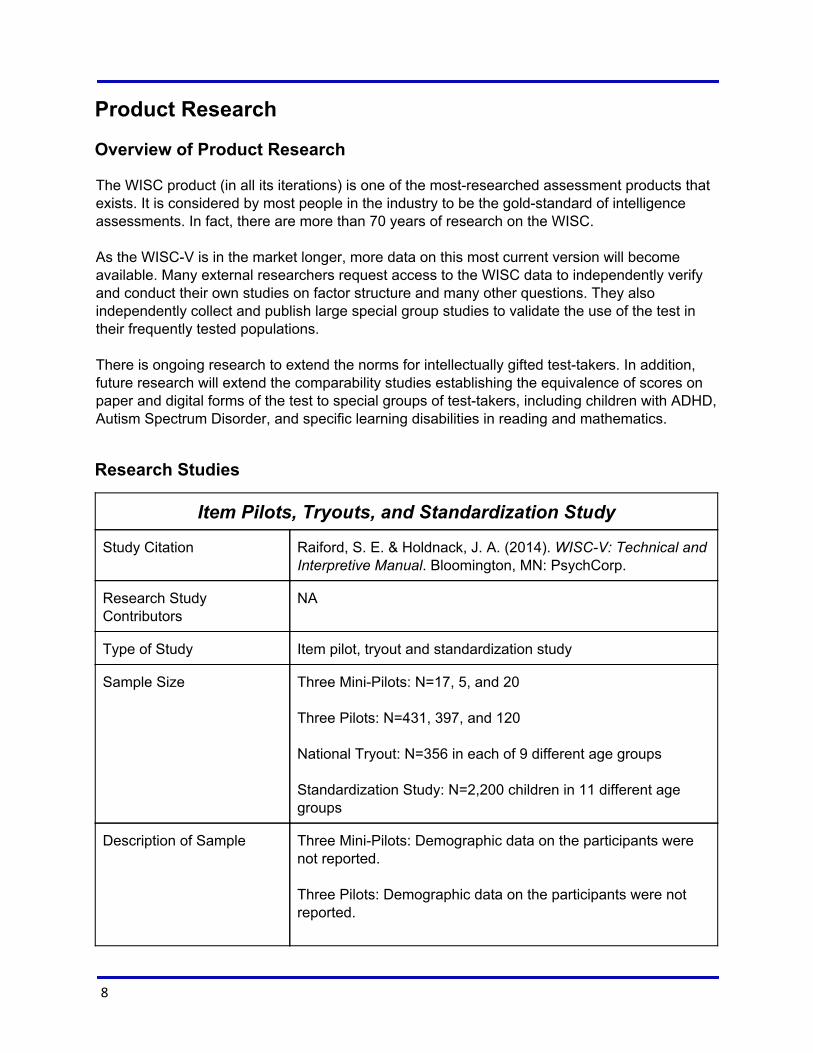
The WISC product (in all its iterations) is one of the mostresearched assessment products that exists. It is considered by most people in the industry to be the goldstandard of intelligence assessments. In fact, there are more than 70 years of research on the WISC. As the WISCV is in the market longer, more data on this most current version will become available. Many external researchers request access to the WISC data to independently verify and conduct their own studies on factor structure and many other questions. They also independently collect and publish large special group studies to validate the use of the test in their frequently tested populations. There is ongoing research to extend the norms for intellectually gifted testtakers. In addition, future research will extend the comparability studies establishing the equivalence of scores on paper and digital forms of the test to special groups of testtakers, including children with ADHD, Autism Spectrum Disorder, and specific learning disabilities in reading and mathematics.
Research Studies
Item Pilots, Tryouts, and Standardization Study
Study Citation Raiford, S. E. & Holdnack, J. A. (2014). WISCV: Technical and Interpretive Manual. Bloomington, MN: PsychCorp.
Research Study Contributors
NA
Type of Study Item pilot, tryout and standardization study
Sample Size Three MiniPilots: N=17, 5, and 20 Three Pilots: N=431, 397, and 120 National Tryout: N=356 in each of 9 different age groups Standardization Study: N=2,200 children in 11 different age groups
Description of Sample Three MiniPilots: Demographic data on the participants were not reported. Three Pilots: Demographic data on the participants were not reported.
8
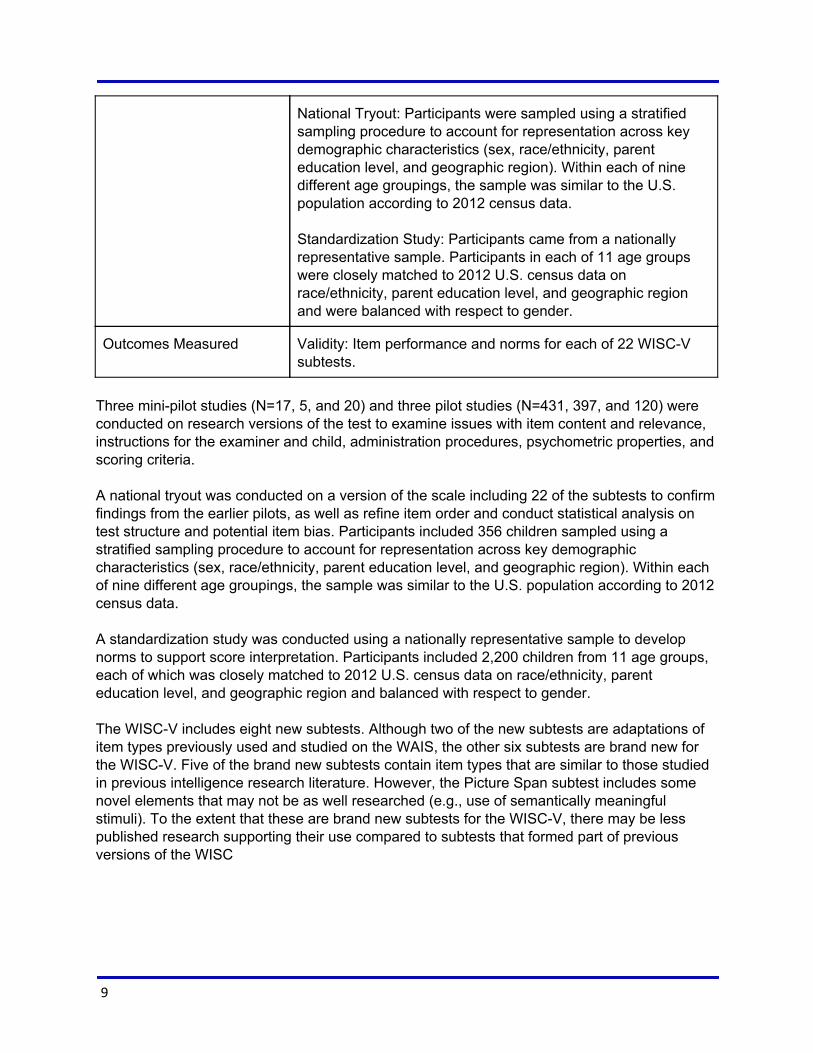
National Tryout: Participants were sampled using a stratified sampling procedure to account for representation across key demographic characteristics (sex, race/ethnicity, parent education level, and geographic region). Within each of nine different age groupings, the sample was similar to the U.S. population according to 2012 census data. Standardization Study: Participants came from a nationally representative sample. Participants in each of 11 age groups were closely matched to 2012 U.S. census data on race/ethnicity, parent education level, and geographic region and were balanced with respect to gender.
Outcomes Measured Validity: Item performance and norms for each of 22 WISCV subtests.
Three minipilot studies (N=17, 5, and 20) and three pilot studies (N=431, 397, and 120) were conducted on research versions of the test to examine issues with item content and relevance, instructions for the examiner and child, administration procedures, psychometric properties, and scoring criteria. A national tryout was conducted on a version of the scale including 22 of the subtests to confirm findings from the earlier pilots, as well as refine item order and conduct statistical analysis on test structure and potential item bias. Participants included 356 children sampled using a stratified sampling procedure to account for representation across key demographic characteristics (sex, race/ethnicity, parent education level, and geographic region). Within each of nine different age groupings, the sample was similar to the U.S. population according to 2012 census data. A standardization study was conducted using a nationally representative sample to develop norms to support score interpretation. Participants included 2,200 children from 11 age groups, each of which was closely matched to 2012 U.S. census data on race/ethnicity, parent education level, and geographic region and balanced with respect to gender. The WISCV includes eight new subtests. Although two of the new subtests are adaptations of item types previously used and studied on the WAIS, the other six subtests are brand new for the WISCV. Five of the brand new subtests contain item types that are similar to those studied in previous intelligence research literature. However, the Picture Span subtest includes some novel elements that may not be as well researched (e.g., use of semantically meaningful stimuli). To the extent that these are brand new subtests for the WISCV, there may be less published research supporting their use compared to subtests that formed part of previous versions of the WISC
9
Factor Analytic Study
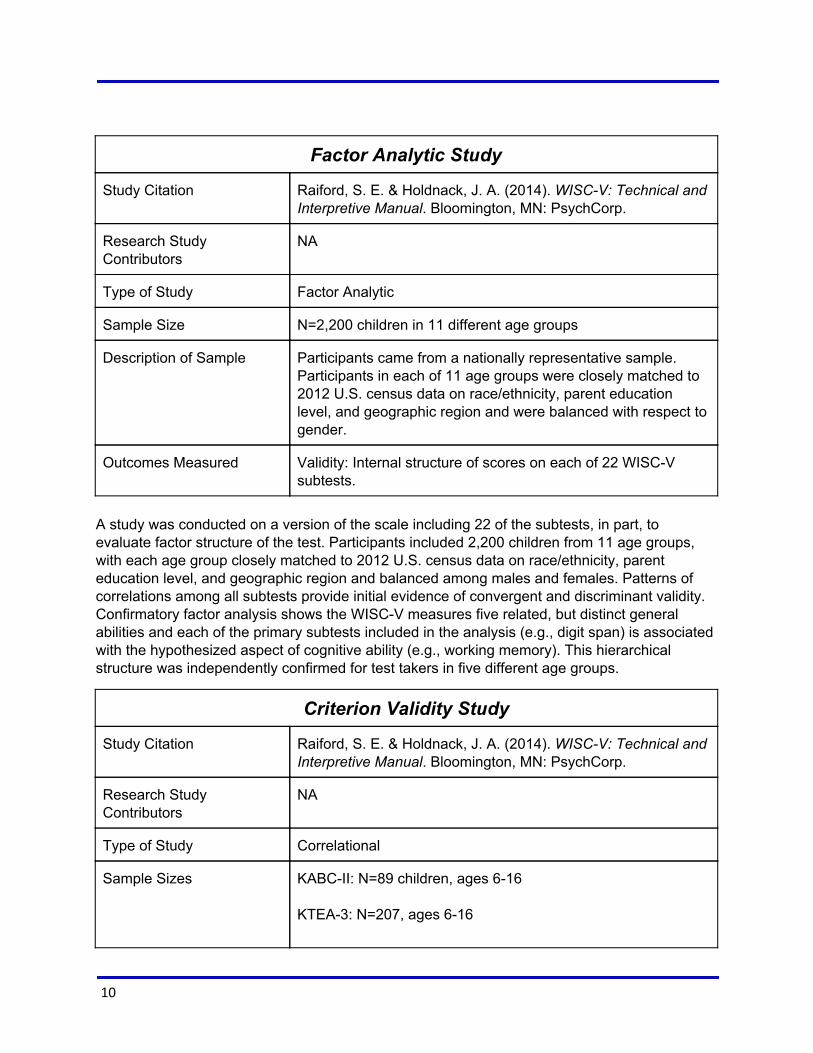
Study Citation Raiford, S. E. & Holdnack, J. A. (2014). WISCV: Technical and Interpretive Manual. Bloomington, MN: PsychCorp.
Research Study Contributors
NA
Type of Study Factor Analytic
Sample Size N=2,200 children in 11 different age groups
Description of Sample Participants came from a nationally representative sample. Participants in each of 11 age groups were closely matched to 2012 U.S. census data on race/ethnicity, parent education level, and geographic region and were balanced with respect to gender.
Outcomes Measured Validity: Internal structure of scores on each of 22 WISCV subtests.
A study was conducted on a version of the scale including 22 of the subtests, in part, to evaluate factor structure of the test. Participants included 2,200 children from 11 age groups, with each age group closely matched to 2012 U.S. census data on race/ethnicity, parent education level, and geographic region and balanced among males and females. Patterns of correlations among all subtests provide initial evidence of convergent and discriminant validity. Confirmatory factor analysis shows the WISCV measures five related, but distinct general abilities and each of the primary subtests included in the analysis (e.g., digit span) is associated with the hypothesized aspect of cognitive ability (e.g., working memory). This hierarchical structure was independently confirmed for test takers in five different age groups.
Criterion Validity Study
Study Citation Raiford, S. E. & Holdnack, J. A. (2014). WISCV: Technical and Interpretive Manual. Bloomington, MN: PsychCorp.
Research Study Contributors
NA
Type of Study Correlational
Sample Sizes KABCII: N=89 children, ages 616 KTEA3: N=207, ages 616
10
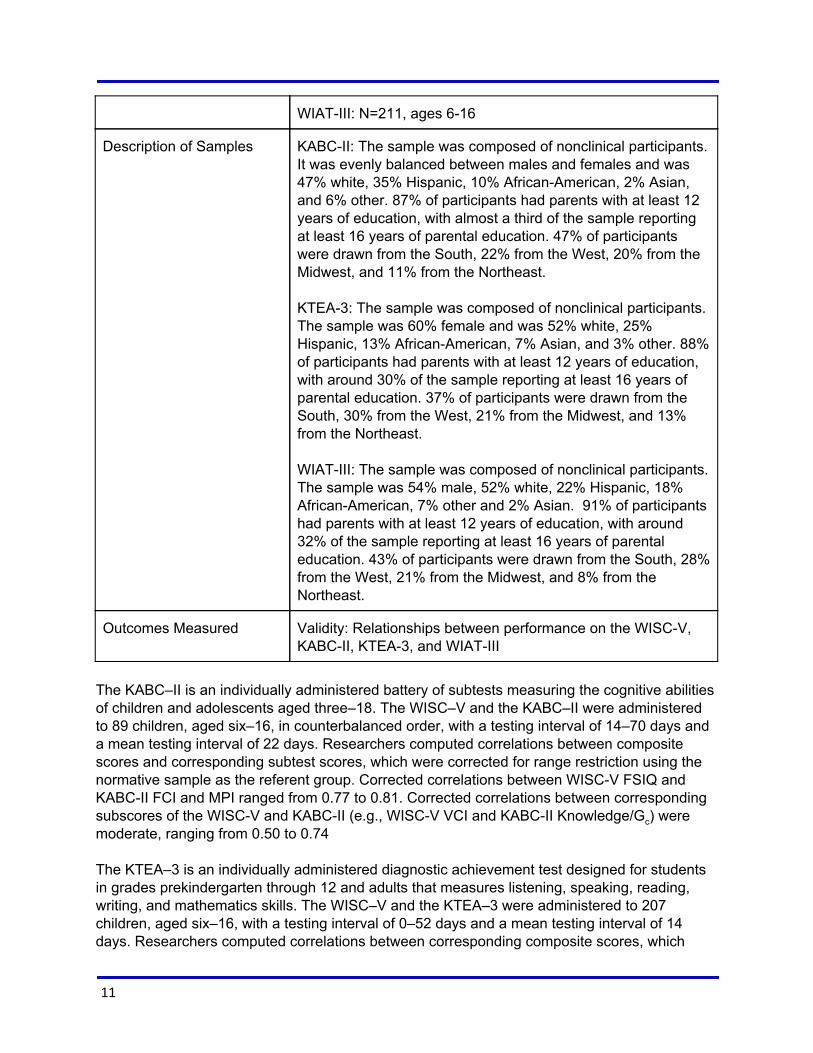
WIATIII: N=211, ages 616
Description of Samples KABCII: The sample was composed of nonclinical participants. It was evenly balanced between males and females and was 47% white, 35% Hispanic, 10% AfricanAmerican, 2% Asian, and 6% other. 87% of participants had parents with at least 12 years of education, with almost a third of the sample reporting at least 16 years of parental education. 47% of participants were drawn from the South, 22% from the West, 20% from the Midwest, and 11% from the Northeast. KTEA3: The sample was composed of nonclinical participants. The sample was 60% female and was 52% white, 25% Hispanic, 13% AfricanAmerican, 7% Asian, and 3% other. 88% of participants had parents with at least 12 years of education, with around 30% of the sample reporting at least 16 years of parental education. 37% of participants were drawn from the South, 30% from the West, 21% from the Midwest, and 13% from the Northeast. WIATIII: The sample was composed of nonclinical participants. The sample was 54% male, 52% white, 22% Hispanic, 18% AfricanAmerican, 7% other and 2% Asian. 91% of participants had parents with at least 12 years of education, with around 32% of the sample reporting at least 16 years of parental education. 43% of participants were drawn from the South, 28% from the West, 21% from the Midwest, and 8% from the Northeast.
Outcomes Measured Validity: Relationships between performance on the WISCV, KABCII, KTEA3, and WIATIII
The KABC–II is an individually administered battery of subtests measuring the cognitive abilities of children and adolescents aged three–18. The WISC–V and the KABC–II were administered to 89 children, aged six–16, in counterbalanced order, with a testing interval of 14–70 days and a mean testing interval of 22 days. Researchers computed correlations between composite scores and corresponding subtest scores, which were corrected for range restriction using the normative sample as the referent group. Corrected correlations between WISCV FSIQ and KABCII FCI and MPI ranged from 0.77 to 0.81. Corrected correlations between corresponding subscores of the WISCV and KABCII (e.g., WISCV VCI and KABCII Knowledge/Gc) were moderate, ranging from 0.50 to 0.74 The KTEA–3 is an individually administered diagnostic achievement test designed for students in grades prekindergarten through 12 and adults that measures listening, speaking, reading, writing, and mathematics skills. The WISC–V and the KTEA–3 were administered to 207 children, aged six–16, with a testing interval of 0–52 days and a mean testing interval of 14 days. Researchers computed correlations between corresponding composite scores, which
11
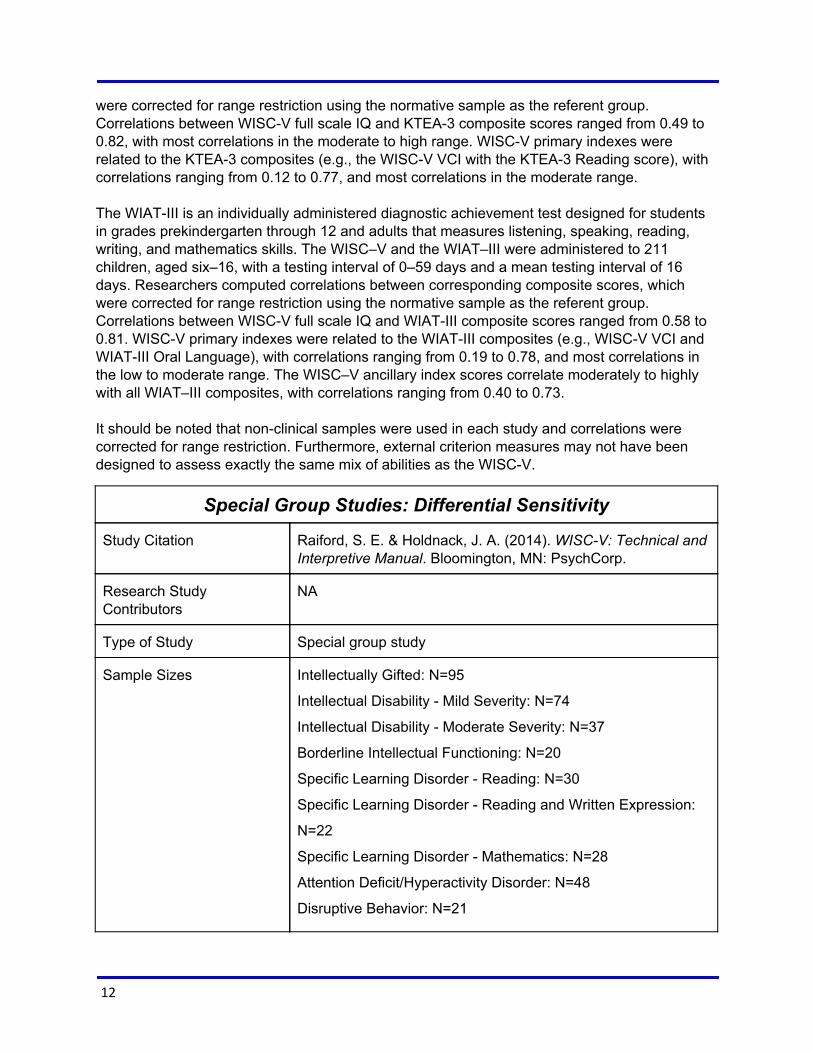
were corrected for range restriction using the normative sample as the referent group. Correlations between WISCV full scale IQ and KTEA3 composite scores ranged from 0.49 to 0.82, with most correlations in the moderate to high range. WISCV primary indexes were related to the KTEA3 composites (e.g., the WISCV VCI with the KTEA3 Reading score), with correlations ranging from 0.12 to 0.77, and most correlations in the moderate range. The WIATIII is an individually administered diagnostic achievement test designed for students in grades prekindergarten through 12 and adults that measures listening, speaking, reading, writing, and mathematics skills. The WISC–V and the WIAT–III were administered to 211 children, aged six–16, with a testing interval of 0–59 days and a mean testing interval of 16 days. Researchers computed correlations between corresponding composite scores, which were corrected for range restriction using the normative sample as the referent group. Correlations between WISCV full scale IQ and WIATIII composite scores ranged from 0.58 to 0.81. WISCV primary indexes were related to the WIATIII composites (e.g., WISCV VCI and WIATIII Oral Language), with correlations ranging from 0.19 to 0.78, and most correlations in the low to moderate range. The WISC–V ancillary index scores correlate moderately to highly with all WIAT–III composites, with correlations ranging from 0.40 to 0.73. It should be noted that nonclinical samples were used in each study and correlations were corrected for range restriction. Furthermore, external criterion measures may not have been designed to assess exactly the same mix of abilities as the WISCV.
Special Group Studies: Differential Sensitivity
Study Citation Raiford, S. E. & Holdnack, J. A. (2014). WISCV: Technical and Interpretive Manual. Bloomington, MN: PsychCorp.
Research Study Contributors
NA
Type of Study Special group study
Sample Sizes Intellectually Gifted: N=95
Intellectual Disability Mild Severity: N=74
Intellectual Disability Moderate Severity: N=37
Borderline Intellectual Functioning: N=20
Specific Learning Disorder Reading: N=30
Specific Learning Disorder Reading and Written Expression:
N=22
Specific Learning Disorder Mathematics: N=28
Attention Deficit/Hyperactivity Disorder: N=48
Disruptive Behavior: N=21
12
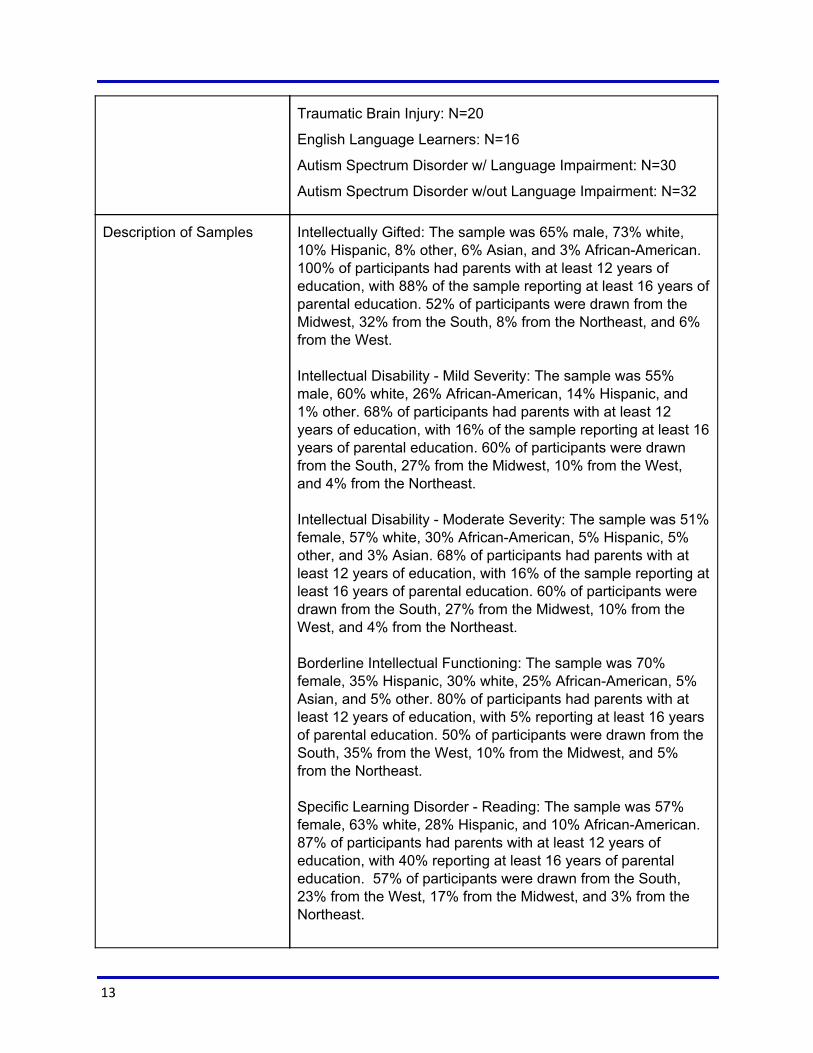
Traumatic Brain Injury: N=20
English Language Learners: N=16
Autism Spectrum Disorder w/ Language Impairment: N=30
Autism Spectrum Disorder w/out Language Impairment: N=32
Description of Samples Intellectually Gifted: The sample was 65% male, 73% white, 10% Hispanic, 8% other, 6% Asian, and 3% AfricanAmerican. 100% of participants had parents with at least 12 years of education, with 88% of the sample reporting at least 16 years of parental education. 52% of participants were drawn from the Midwest, 32% from the South, 8% from the Northeast, and 6% from the West. Intellectual Disability Mild Severity: The sample was 55% male, 60% white, 26% AfricanAmerican, 14% Hispanic, and 1% other. 68% of participants had parents with at least 12 years of education, with 16% of the sample reporting at least 16 years of parental education. 60% of participants were drawn from the South, 27% from the Midwest, 10% from the West, and 4% from the Northeast. Intellectual Disability Moderate Severity: The sample was 51% female, 57% white, 30% AfricanAmerican, 5% Hispanic, 5% other, and 3% Asian. 68% of participants had parents with at least 12 years of education, with 16% of the sample reporting at least 16 years of parental education. 60% of participants were drawn from the South, 27% from the Midwest, 10% from the West, and 4% from the Northeast. Borderline Intellectual Functioning: The sample was 70% female, 35% Hispanic, 30% white, 25% AfricanAmerican, 5% Asian, and 5% other. 80% of participants had parents with at least 12 years of education, with 5% reporting at least 16 years of parental education. 50% of participants were drawn from the South, 35% from the West, 10% from the Midwest, and 5% from the Northeast. Specific Learning Disorder Reading: The sample was 57% female, 63% white, 28% Hispanic, and 10% AfricanAmerican. 87% of participants had parents with at least 12 years of education, with 40% reporting at least 16 years of parental education. 57% of participants were drawn from the South, 23% from the West, 17% from the Midwest, and 3% from the Northeast.
13
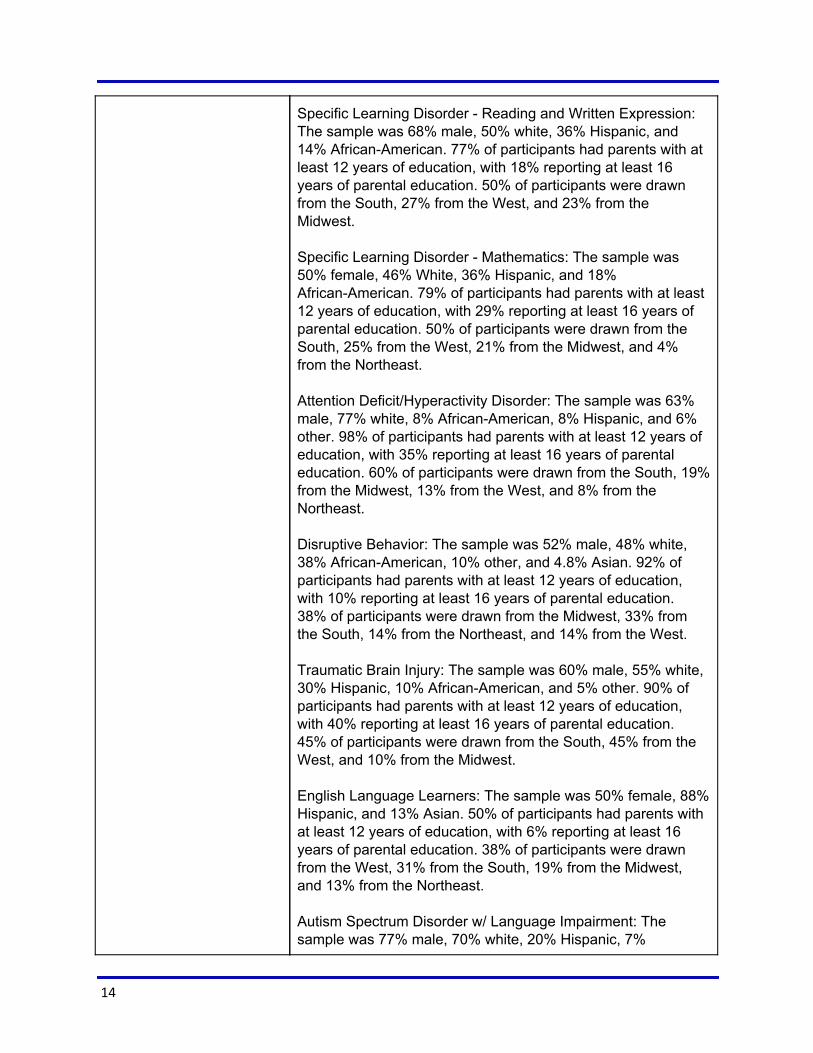
Specific Learning Disorder Reading and Written Expression: The sample was 68% male, 50% white, 36% Hispanic, and 14% AfricanAmerican. 77% of participants had parents with at least 12 years of education, with 18% reporting at least 16 years of parental education. 50% of participants were drawn from the South, 27% from the West, and 23% from the Midwest. Specific Learning Disorder Mathematics: The sample was 50% female, 46% White, 36% Hispanic, and 18% AfricanAmerican. 79% of participants had parents with at least 12 years of education, with 29% reporting at least 16 years of parental education. 50% of participants were drawn from the South, 25% from the West, 21% from the Midwest, and 4% from the Northeast. Attention Deficit/Hyperactivity Disorder: The sample was 63% male, 77% white, 8% AfricanAmerican, 8% Hispanic, and 6% other. 98% of participants had parents with at least 12 years of education, with 35% reporting at least 16 years of parental education. 60% of participants were drawn from the South, 19% from the Midwest, 13% from the West, and 8% from the Northeast. Disruptive Behavior: The sample was 52% male, 48% white, 38% AfricanAmerican, 10% other, and 4.8% Asian. 92% of participants had parents with at least 12 years of education, with 10% reporting at least 16 years of parental education. 38% of participants were drawn from the Midwest, 33% from the South, 14% from the Northeast, and 14% from the West. Traumatic Brain Injury: The sample was 60% male, 55% white, 30% Hispanic, 10% AfricanAmerican, and 5% other. 90% of participants had parents with at least 12 years of education, with 40% reporting at least 16 years of parental education. 45% of participants were drawn from the South, 45% from the West, and 10% from the Midwest. English Language Learners: The sample was 50% female, 88% Hispanic, and 13% Asian. 50% of participants had parents with at least 12 years of education, with 6% reporting at least 16 years of parental education. 38% of participants were drawn from the West, 31% from the South, 19% from the Midwest, and 13% from the Northeast. Autism Spectrum Disorder w/ Language Impairment: The sample was 77% male, 70% white, 20% Hispanic, 7%
14
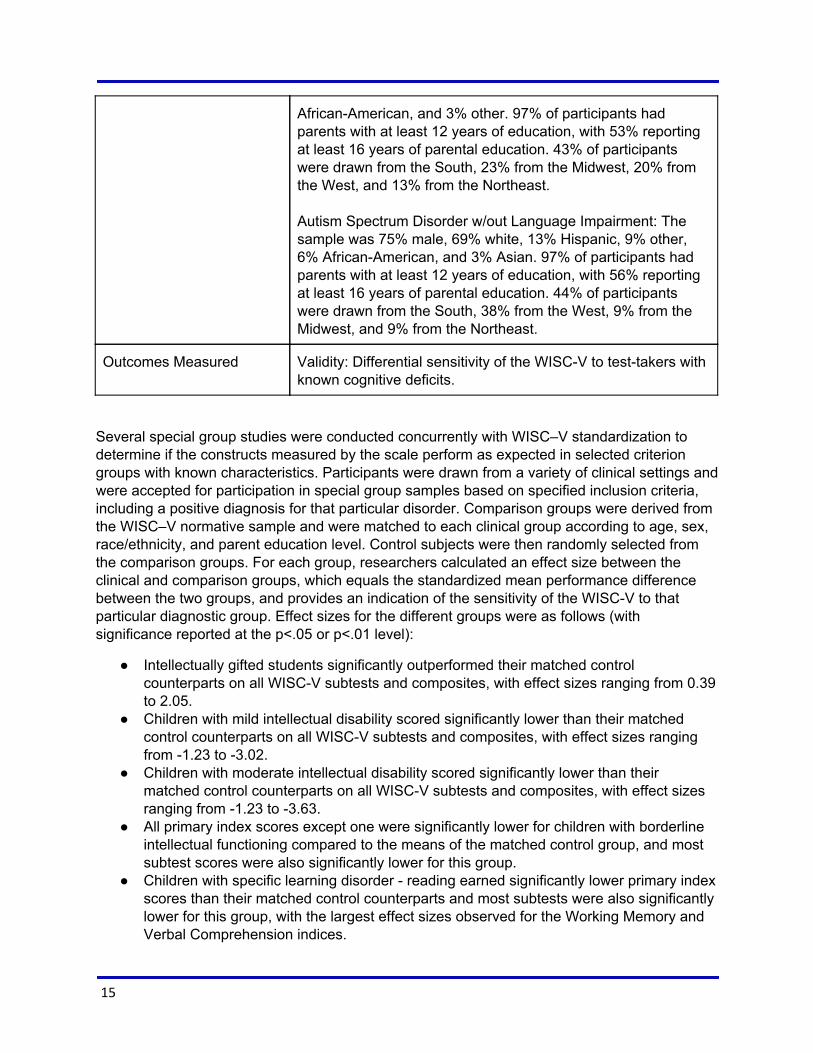
AfricanAmerican, and 3% other. 97% of participants had parents with at least 12 years of education, with 53% reporting at least 16 years of parental education. 43% of participants were drawn from the South, 23% from the Midwest, 20% from the West, and 13% from the Northeast. Autism Spectrum Disorder w/out Language Impairment: The sample was 75% male, 69% white, 13% Hispanic, 9% other, 6% AfricanAmerican, and 3% Asian. 97% of participants had parents with at least 12 years of education, with 56% reporting at least 16 years of parental education. 44% of participants were drawn from the South, 38% from the West, 9% from the Midwest, and 9% from the Northeast.
Outcomes Measured Validity: Differential sensitivity of the WISCV to testtakers with known cognitive deficits.
Several special group studies were conducted concurrently with WISC–V standardization to determine if the constructs measured by the scale perform as expected in selected criterion groups with known characteristics. Participants were drawn from a variety of clinical settings and were accepted for participation in special group samples based on specified inclusion criteria, including a positive diagnosis for that particular disorder. Comparison groups were derived from the WISC–V normative sample and were matched to each clinical group according to age, sex, race/ethnicity, and parent education level. Control subjects were then randomly selected from the comparison groups. For each group, researchers calculated an effect size between the clinical and comparison groups, which equals the standardized mean performance difference between the two groups, and provides an indication of the sensitivity of the WISCV to that particular diagnostic group. Effect sizes for the different groups were as follows (with significance reported at the p<.05 or p<.01 level):
Intellectually gifted students significantly outperformed their matched control counterparts on all WISCV subtests and composites, with effect sizes ranging from 0.39 to 2.05.
Children with mild intellectual disability scored significantly lower than their matched control counterparts on all WISCV subtests and composites, with effect sizes ranging from 1.23 to 3.02.
Children with moderate intellectual disability scored significantly lower than their matched control counterparts on all WISCV subtests and composites, with effect sizes ranging from 1.23 to 3.63.
All primary index scores except one were significantly lower for children with borderline intellectual functioning compared to the means of the matched control group, and most subtest scores were also significantly lower for this group.
Children with specific learning disorder reading earned significantly lower primary index scores than their matched control counterparts and most subtests were also significantly lower for this group, with the largest effect sizes observed for the Working Memory and Verbal Comprehension indices.
15
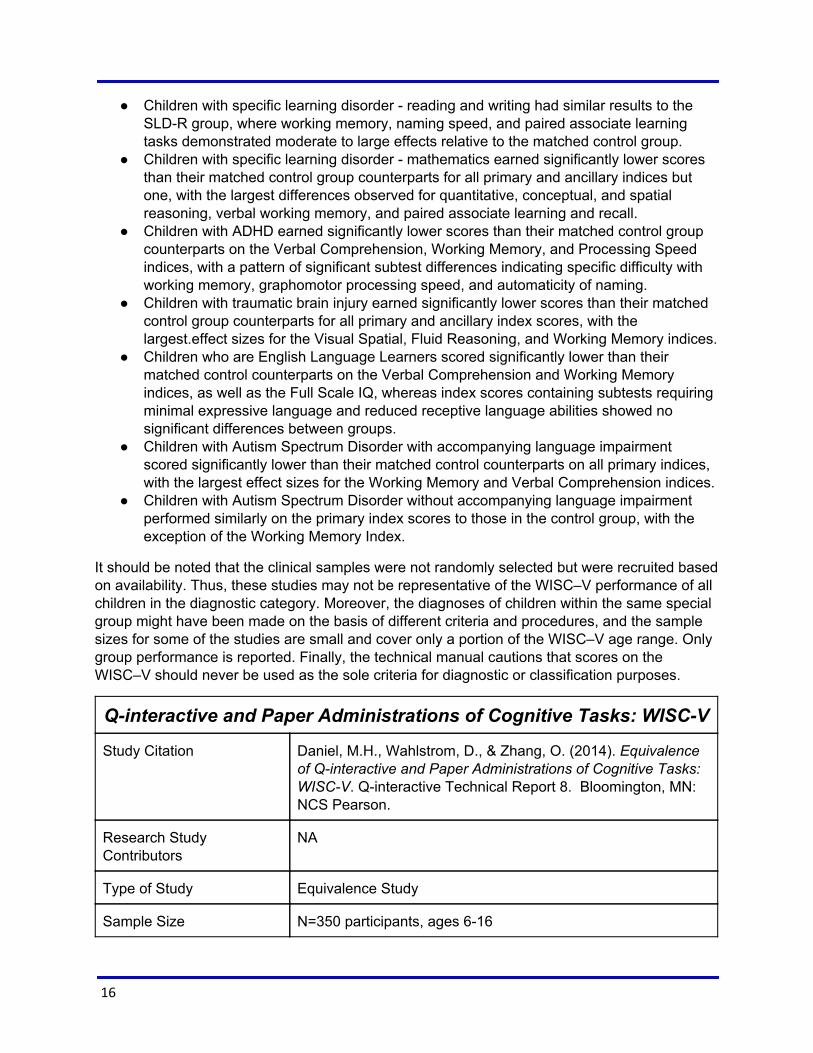
Children with specific learning disorder reading and writing had similar results to the SLDR group, where working memory, naming speed, and paired associate learning tasks demonstrated moderate to large effects relative to the matched control group.
Children with specific learning disorder mathematics earned significantly lower scores than their matched control group counterparts for all primary and ancillary indices but one, with the largest differences observed for quantitative, conceptual, and spatial reasoning, verbal working memory, and paired associate learning and recall.
Children with ADHD earned significantly lower scores than their matched control group counterparts on the Verbal Comprehension, Working Memory, and Processing Speed indices, with a pattern of significant subtest differences indicating specific difficulty with working memory, graphomotor processing speed, and automaticity of naming.
Children with traumatic brain injury earned significantly lower scores than their matched control group counterparts for all primary and ancillary index scores, with the largest.effect sizes for the Visual Spatial, Fluid Reasoning, and Working Memory indices.
Children who are English Language Learners scored significantly lower than their matched control counterparts on the Verbal Comprehension and Working Memory indices, as well as the Full Scale IQ, whereas index scores containing subtests requiring minimal expressive language and reduced receptive language abilities showed no significant differences between groups.
Children with Autism Spectrum Disorder with accompanying language impairment scored significantly lower than their matched control counterparts on all primary indices, with the largest effect sizes for the Working Memory and Verbal Comprehension indices.
Children with Autism Spectrum Disorder without accompanying language impairment performed similarly on the primary index scores to those in the control group, with the exception of the Working Memory Index.
It should be noted that the clinical samples were not randomly selected but were recruited based on availability. Thus, these studies may not be representative of the WISC–V performance of all children in the diagnostic category. Moreover, the diagnoses of children within the same special group might have been made on the basis of different criteria and procedures, and the sample sizes for some of the studies are small and cover only a portion of the WISC–V age range. Only group performance is reported. Finally, the technical manual cautions that scores on the WISC–V should never be used as the sole criteria for diagnostic or classification purposes.
Qinteractive and Paper Administrations of Cognitive Tasks: WISCV
Study Citation Daniel, M.H., Wahlstrom, D., & Zhang, O. (2014). Equivalence of Qinteractive and Paper Administrations of Cognitive Tasks: WISCV. Qinteractive Technical Report 8. Bloomington, MN: NCS Pearson.
Research Study Contributors
NA
Type of Study Equivalence Study
Sample Size N=350 participants, ages 616
16
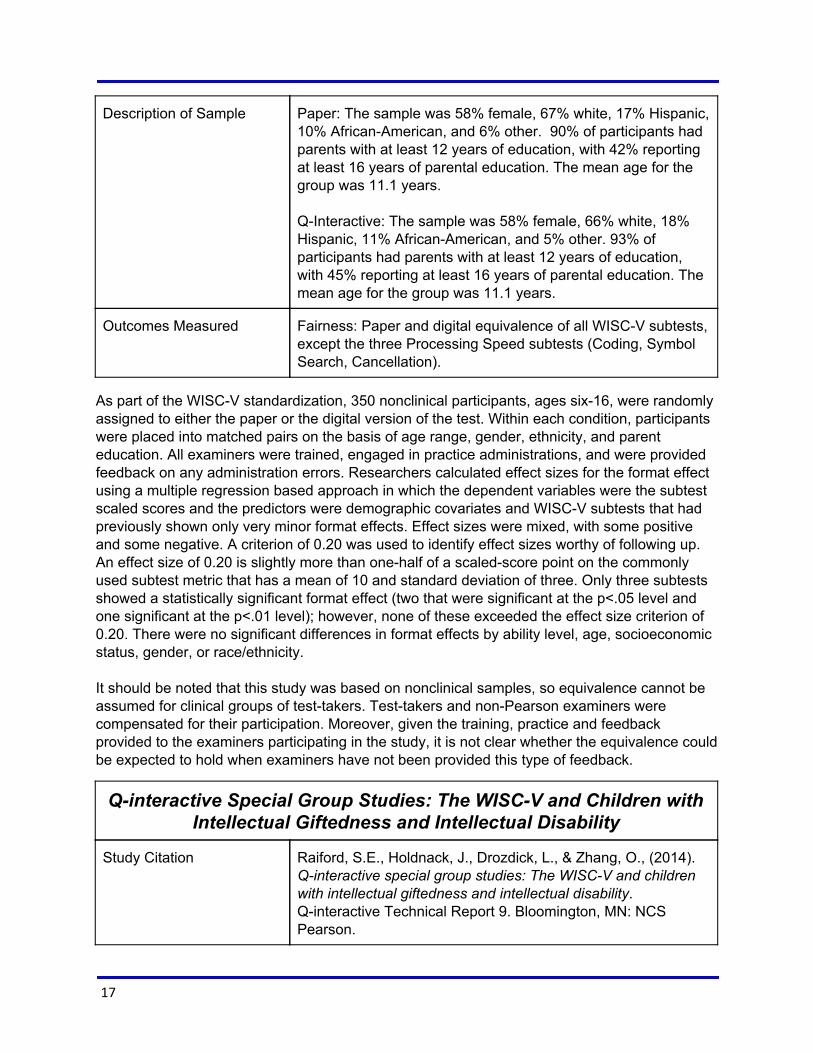
Description of Sample Paper: The sample was 58% female, 67% white, 17% Hispanic, 10% AfricanAmerican, and 6% other. 90% of participants had parents with at least 12 years of education, with 42% reporting at least 16 years of parental education. The mean age for the group was 11.1 years. QInteractive: The sample was 58% female, 66% white, 18% Hispanic, 11% AfricanAmerican, and 5% other. 93% of participants had parents with at least 12 years of education, with 45% reporting at least 16 years of parental education. The mean age for the group was 11.1 years.
Outcomes Measured Fairness: Paper and digital equivalence of all WISCV subtests, except the three Processing Speed subtests (Coding, Symbol Search, Cancellation).
As part of the WISCV standardization, 350 nonclinical participants, ages six16, were randomly assigned to either the paper or the digital version of the test. Within each condition, participants were placed into matched pairs on the basis of age range, gender, ethnicity, and parent education. All examiners were trained, engaged in practice administrations, and were provided feedback on any administration errors. Researchers calculated effect sizes for the format effect using a multiple regression based approach in which the dependent variables were the subtest scaled scores and the predictors were demographic covariates and WISCV subtests that had previously shown only very minor format effects. Effect sizes were mixed, with some positive and some negative. A criterion of 0.20 was used to identify effect sizes worthy of following up. An effect size of 0.20 is slightly more than onehalf of a scaledscore point on the commonly used subtest metric that has a mean of 10 and standard deviation of three. Only three subtests showed a statistically significant format effect (two that were significant at the p<.05 level and one significant at the p<.01 level); however, none of these exceeded the effect size criterion of 0.20. There were no significant differences in format effects by ability level, age, socioeconomic status, gender, or race/ethnicity. It should be noted that this study was based on nonclinical samples, so equivalence cannot be assumed for clinical groups of testtakers. Testtakers and nonPearson examiners were compensated for their participation. Moreover, given the training, practice and feedback provided to the examiners participating in the study, it is not clear whether the equivalence could be expected to hold when examiners have not been provided this type of feedback.
Qinteractive Special Group Studies: The WISCV and Children with Intellectual Giftedness and Intellectual Disability
Study Citation Raiford, S.E., Holdnack, J., Drozdick, L., & Zhang, O., (2014). Qinteractive special group studies: The WISCV and children with intellectual giftedness and intellectual disability. Qinteractive Technical Report 9. Bloomington, MN: NCS Pearson.
17
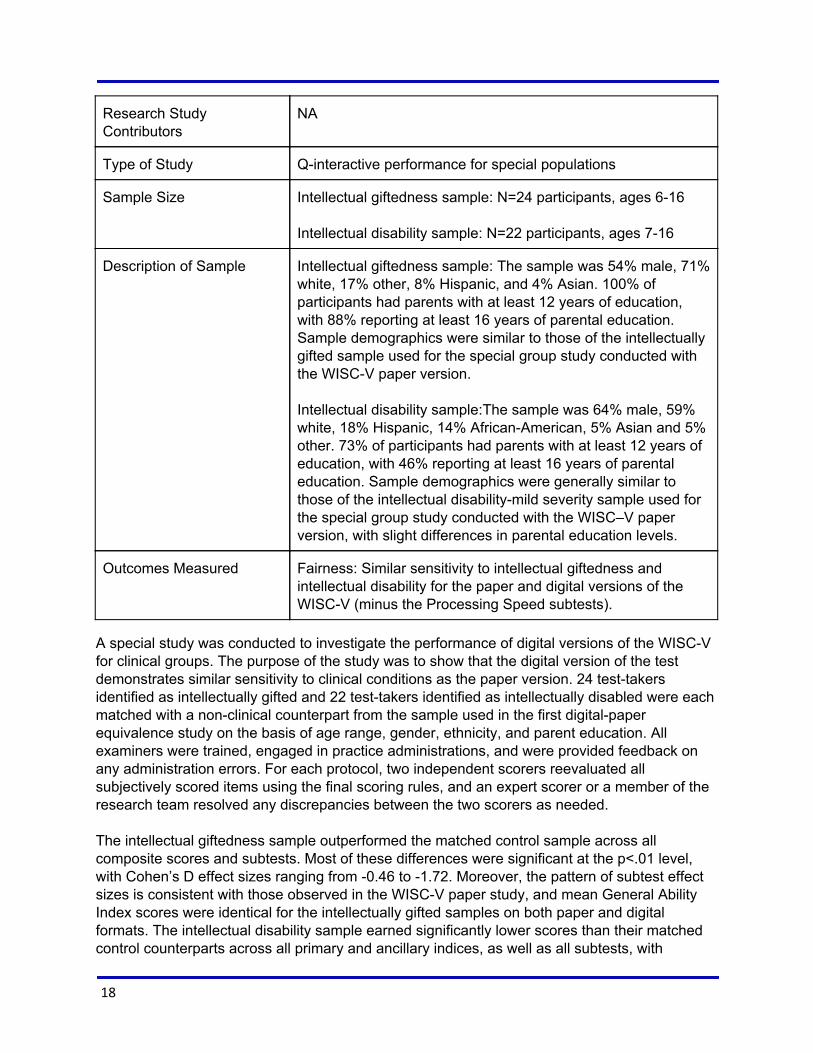
Research Study Contributors
NA
Type of Study Qinteractive performance for special populations
Sample Size Intellectual giftedness sample: N=24 participants, ages 616 Intellectual disability sample: N=22 participants, ages 716
Description of Sample Intellectual giftedness sample: The sample was 54% male, 71% white, 17% other, 8% Hispanic, and 4% Asian. 100% of participants had parents with at least 12 years of education, with 88% reporting at least 16 years of parental education. Sample demographics were similar to those of the intellectually gifted sample used for the special group study conducted with the WISCV paper version. Intellectual disability sample:The sample was 64% male, 59% white, 18% Hispanic, 14% AfricanAmerican, 5% Asian and 5% other. 73% of participants had parents with at least 12 years of education, with 46% reporting at least 16 years of parental education. Sample demographics were generally similar to those of the intellectual disabilitymild severity sample used for the special group study conducted with the WISC–V paper version, with slight differences in parental education levels.
Outcomes Measured Fairness: Similar sensitivity to intellectual giftedness and intellectual disability for the paper and digital versions of the WISCV (minus the Processing Speed subtests).
A special study was conducted to investigate the performance of digital versions of the WISCV for clinical groups. The purpose of the study was to show that the digital version of the test demonstrates similar sensitivity to clinical conditions as the paper version. 24 testtakers identified as intellectually gifted and 22 testtakers identified as intellectually disabled were each matched with a nonclinical counterpart from the sample used in the first digitalpaper equivalence study on the basis of age range, gender, ethnicity, and parent education. All examiners were trained, engaged in practice administrations, and were provided feedback on any administration errors. For each protocol, two independent scorers reevaluated all subjectively scored items using the final scoring rules, and an expert scorer or a member of the research team resolved any discrepancies between the two scorers as needed. The intellectual giftedness sample outperformed the matched control sample across all composite scores and subtests. Most of these differences were significant at the p<.01 level, with Cohen’s D effect sizes ranging from 0.46 to 1.72. Moreover, the pattern of subtest effect sizes is consistent with those observed in the WISCV paper study, and mean General Ability Index scores were identical for the intellectually gifted samples on both paper and digital formats. The intellectual disability sample earned significantly lower scores than their matched control counterparts across all primary and ancillary indices, as well as all subtests, with
18
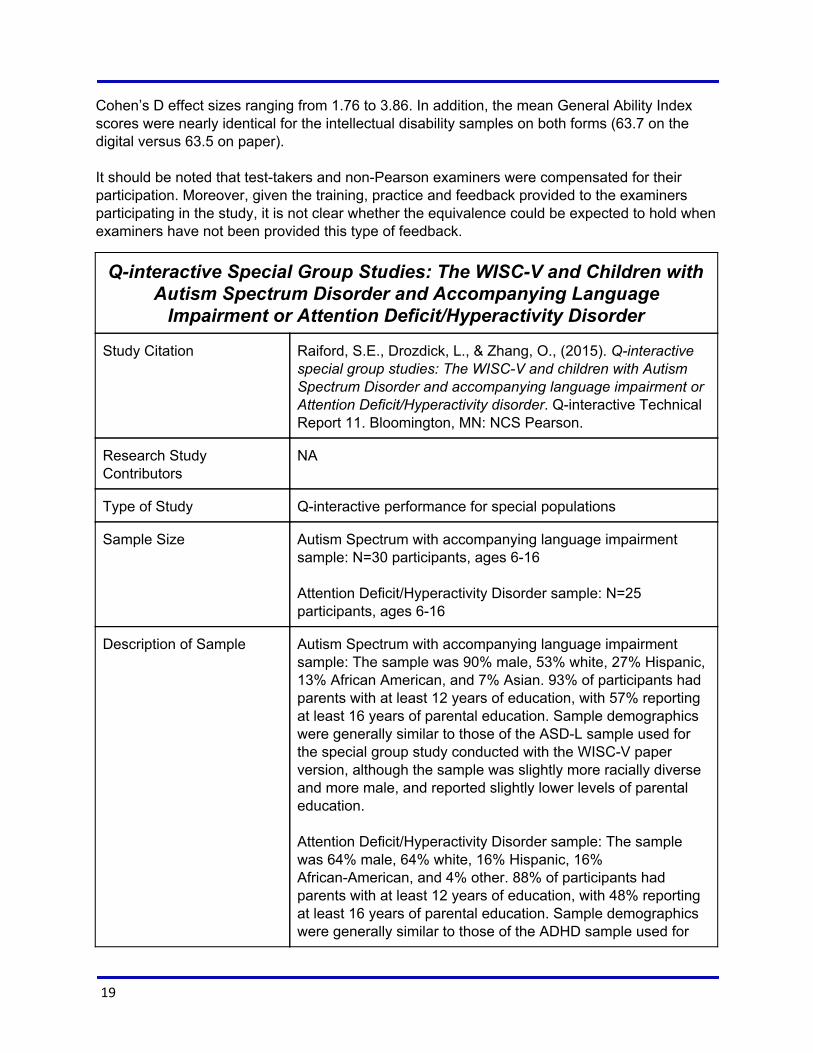
Cohen’s D effect sizes ranging from 1.76 to 3.86. In addition, the mean General Ability Index scores were nearly identical for the intellectual disability samples on both forms (63.7 on the digital versus 63.5 on paper). It should be noted that testtakers and nonPearson examiners were compensated for their participation. Moreover, given the training, practice and feedback provided to the examiners participating in the study, it is not clear whether the equivalence could be expected to hold when examiners have not been provided this type of feedback.
Qinteractive Special Group Studies: The WISCV and Children with Autism Spectrum Disorder and Accompanying Language Impairment or Attention Deficit/Hyperactivity Disorder
Study Citation Raiford, S.E., Drozdick, L., & Zhang, O., (2015). Qinteractive special group studies: The WISCV and children with Autism Spectrum Disorder and accompanying language impairment or Attention Deficit/Hyperactivity disorder. Qinteractive Technical Report 11. Bloomington, MN: NCS Pearson.
Research Study Contributors
NA
Type of Study Qinteractive performance for special populations
Sample Size Autism Spectrum with accompanying language impairment sample: N=30 participants, ages 616 Attention Deficit/Hyperactivity Disorder sample: N=25 participants, ages 616
Description of Sample Autism Spectrum with accompanying language impairment sample: The sample was 90% male, 53% white, 27% Hispanic, 13% African American, and 7% Asian. 93% of participants had parents with at least 12 years of education, with 57% reporting at least 16 years of parental education. Sample demographics were generally similar to those of the ASDL sample used for the special group study conducted with the WISCV paper version, although the sample was slightly more racially diverse and more male, and reported slightly lower levels of parental education. Attention Deficit/Hyperactivity Disorder sample: The sample was 64% male, 64% white, 16% Hispanic, 16% AfricanAmerican, and 4% other. 88% of participants had parents with at least 12 years of education, with 48% reporting at least 16 years of parental education. Sample demographics were generally similar to those of the ADHD sample used for
19
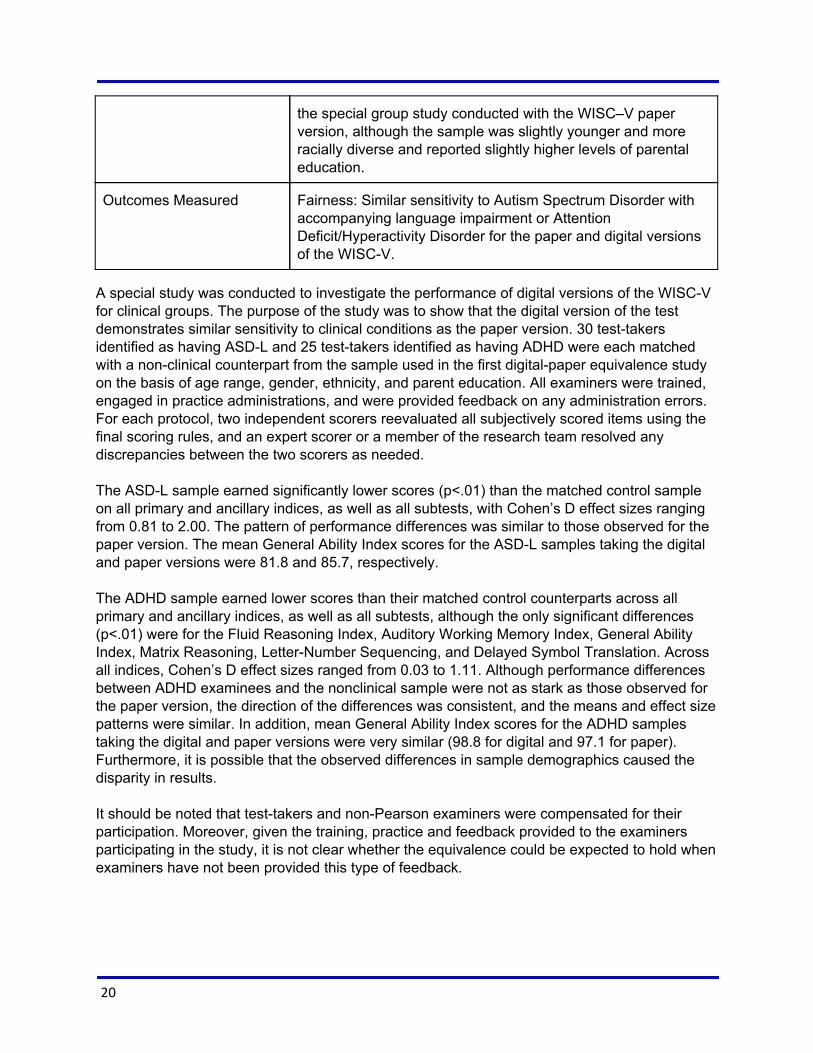
the special group study conducted with the WISC–V paper version, although the sample was slightly younger and more racially diverse and reported slightly higher levels of parental education.
Outcomes Measured Fairness: Similar sensitivity to Autism Spectrum Disorder with accompanying language impairment or Attention Deficit/Hyperactivity Disorder for the paper and digital versions of the WISCV.
A special study was conducted to investigate the performance of digital versions of the WISCV for clinical groups. The purpose of the study was to show that the digital version of the test demonstrates similar sensitivity to clinical conditions as the paper version. 30 testtakers identified as having ASDL and 25 testtakers identified as having ADHD were each matched with a nonclinical counterpart from the sample used in the first digitalpaper equivalence study on the basis of age range, gender, ethnicity, and parent education. All examiners were trained, engaged in practice administrations, and were provided feedback on any administration errors. For each protocol, two independent scorers reevaluated all subjectively scored items using the final scoring rules, and an expert scorer or a member of the research team resolved any discrepancies between the two scorers as needed. The ASDL sample earned significantly lower scores (p<.01) than the matched control sample on all primary and ancillary indices, as well as all subtests, with Cohen’s D effect sizes ranging from 0.81 to 2.00. The pattern of performance differences was similar to those observed for the paper version. The mean General Ability Index scores for the ASDL samples taking the digital and paper versions were 81.8 and 85.7, respectively. The ADHD sample earned lower scores than their matched control counterparts across all primary and ancillary indices, as well as all subtests, although the only significant differences (p<.01) were for the Fluid Reasoning Index, Auditory Working Memory Index, General Ability Index, Matrix Reasoning, LetterNumber Sequencing, and Delayed Symbol Translation. Across all indices, Cohen’s D effect sizes ranged from 0.03 to 1.11. Although performance differences between ADHD examinees and the nonclinical sample were not as stark as those observed for the paper version, the direction of the differences was consistent, and the means and effect size patterns were similar. In addition, mean General Ability Index scores for the ADHD samples taking the digital and paper versions were very similar (98.8 for digital and 97.1 for paper). Furthermore, it is possible that the observed differences in sample demographics caused the disparity in results. It should be noted that testtakers and nonPearson examiners were compensated for their participation. Moreover, given the training, practice and feedback provided to the examiners participating in the study, it is not clear whether the equivalence could be expected to hold when examiners have not been provided this type of feedback.
20
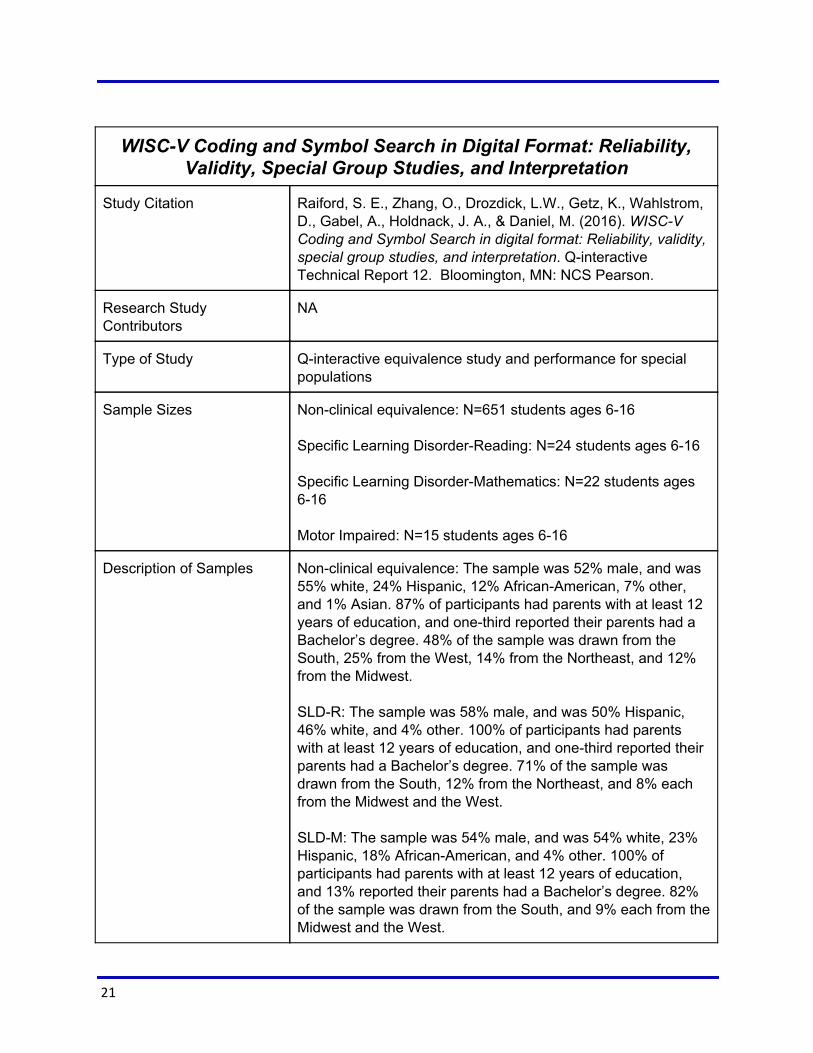
WISCV Coding and Symbol Search in Digital Format: Reliability, Validity, Special Group Studies, and Interpretation
Study Citation Raiford, S. E., Zhang, O., Drozdick, L.W., Getz, K., Wahlstrom, D., Gabel, A., Holdnack, J. A., & Daniel, M. (2016). WISCV Coding and Symbol Search in digital format: Reliability, validity, special group studies, and interpretation. Qinteractive Technical Report 12. Bloomington, MN: NCS Pearson.
Research Study Contributors
NA
Type of Study Qinteractive equivalence study and performance for special populations
Sample Sizes Nonclinical equivalence: N=651 students ages 616 Specific Learning DisorderReading: N=24 students ages 616 Specific Learning DisorderMathematics: N=22 students ages 616 Motor Impaired: N=15 students ages 616
Description of Samples Nonclinical equivalence: The sample was 52% male, and was 55% white, 24% Hispanic, 12% AfricanAmerican, 7% other, and 1% Asian. 87% of participants had parents with at least 12 years of education, and onethird reported their parents had a Bachelor’s degree. 48% of the sample was drawn from the South, 25% from the West, 14% from the Northeast, and 12% from the Midwest. SLDR: The sample was 58% male, and was 50% Hispanic, 46% white, and 4% other. 100% of participants had parents with at least 12 years of education, and onethird reported their parents had a Bachelor’s degree. 71% of the sample was drawn from the South, 12% from the Northeast, and 8% each from the Midwest and the West. SLDM: The sample was 54% male, and was 54% white, 23% Hispanic, 18% AfricanAmerican, and 4% other. 100% of participants had parents with at least 12 years of education, and 13% reported their parents had a Bachelor’s degree. 82% of the sample was drawn from the South, and 9% each from the Midwest and the West.
21
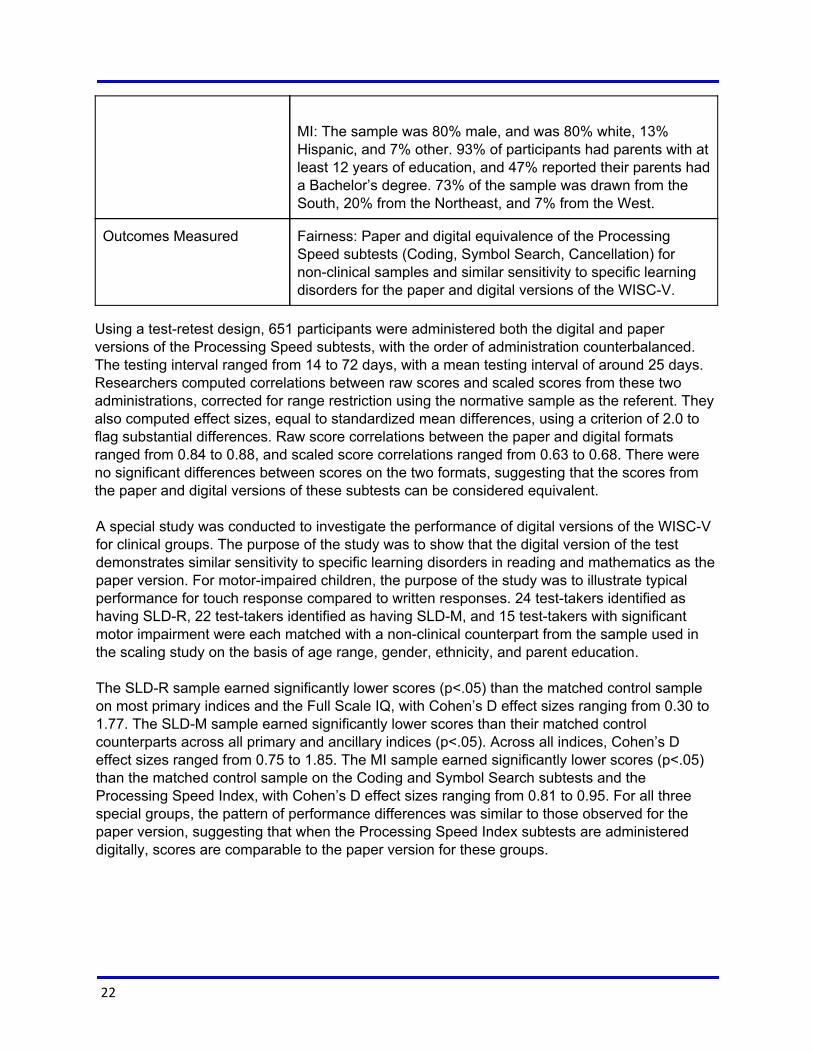
MI: The sample was 80% male, and was 80% white, 13% Hispanic, and 7% other. 93% of participants had parents with at least 12 years of education, and 47% reported their parents had a Bachelor’s degree. 73% of the sample was drawn from the South, 20% from the Northeast, and 7% from the West.
Outcomes Measured Fairness: Paper and digital equivalence of the Processing Speed subtests (Coding, Symbol Search, Cancellation) for nonclinical samples and similar sensitivity to specific learning disorders for the paper and digital versions of the WISCV.
Using a testretest design, 651 participants were administered both the digital and paper versions of the Processing Speed subtests, with the order of administration counterbalanced. The testing interval ranged from 14 to 72 days, with a mean testing interval of around 25 days. Researchers computed correlations between raw scores and scaled scores from these two administrations, corrected for range restriction using the normative sample as the referent. They also computed effect sizes, equal to standardized mean differences, using a criterion of 2.0 to flag substantial differences. Raw score correlations between the paper and digital formats ranged from 0.84 to 0.88, and scaled score correlations ranged from 0.63 to 0.68. There were no significant differences between scores on the two formats, suggesting that the scores from the paper and digital versions of these subtests can be considered equivalent. A special study was conducted to investigate the performance of digital versions of the WISCV for clinical groups. The purpose of the study was to show that the digital version of the test demonstrates similar sensitivity to specific learning disorders in reading and mathematics as the paper version. For motorimpaired children, the purpose of the study was to illustrate typical performance for touch response compared to written responses. 24 testtakers identified as having SLDR, 22 testtakers identified as having SLDM, and 15 testtakers with significant motor impairment were each matched with a nonclinical counterpart from the sample used in the scaling study on the basis of age range, gender, ethnicity, and parent education. The SLDR sample earned significantly lower scores (p<.05) than the matched control sample on most primary indices and the Full Scale IQ, with Cohen’s D effect sizes ranging from 0.30 to 1.77. The SLDM sample earned significantly lower scores than their matched control counterparts across all primary and ancillary indices (p<.05). Across all indices, Cohen’s D effect sizes ranged from 0.75 to 1.85. The MI sample earned significantly lower scores (p<.05) than the matched control sample on the Coding and Symbol Search subtests and the Processing Speed Index, with Cohen’s D effect sizes ranging from 0.81 to 0.95. For all three special groups, the pattern of performance differences was similar to those observed for the paper version, suggesting that when the Processing Speed Index subtests are administered digitally, scores are comparable to the paper version for these groups.
22
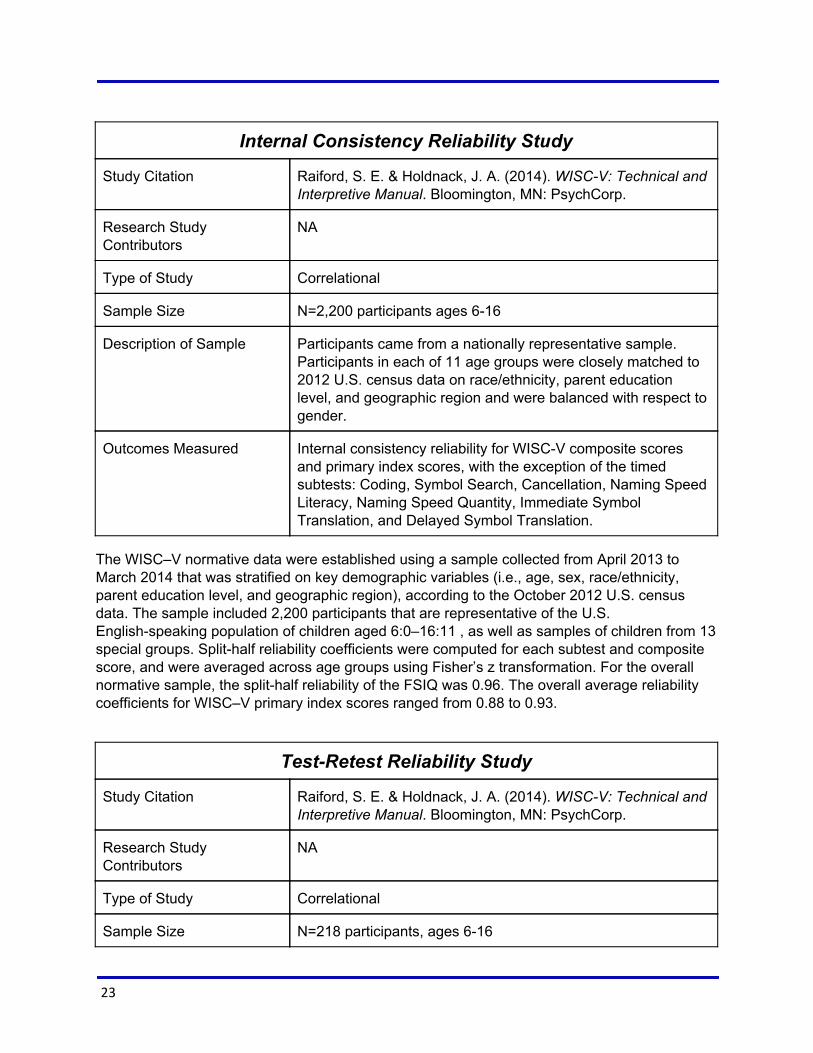
Internal Consistency Reliability Study
Study Citation Raiford, S. E. & Holdnack, J. A. (2014). WISCV: Technical and Interpretive Manual. Bloomington, MN: PsychCorp.
Research Study Contributors
NA
Type of Study Correlational
Sample Size N=2,200 participants ages 616
Description of Sample Participants came from a nationally representative sample. Participants in each of 11 age groups were closely matched to 2012 U.S. census data on race/ethnicity, parent education level, and geographic region and were balanced with respect to gender.
Outcomes Measured Internal consistency reliability for WISCV composite scores and primary index scores, with the exception of the timed subtests: Coding, Symbol Search, Cancellation, Naming Speed Literacy, Naming Speed Quantity, Immediate Symbol Translation, and Delayed Symbol Translation.
The WISC–V normative data were established using a sample collected from April 2013 to March 2014 that was stratified on key demographic variables (i.e., age, sex, race/ethnicity, parent education level, and geographic region), according to the October 2012 U.S. census data. The sample included 2,200 participants that are representative of the U.S. Englishspeaking population of children aged 6:0–16:11 , as well as samples of children from 13 special groups. Splithalf reliability coefficients were computed for each subtest and composite score, and were averaged across age groups using Fisher’s z transformation. For the overall normative sample, the splithalf reliability of the FSIQ was 0.96. The overall average reliability coefficients for WISC–V primary index scores ranged from 0.88 to 0.93.
TestRetest Reliability Study
Study Citation Raiford, S. E. & Holdnack, J. A. (2014). WISCV: Technical and Interpretive Manual. Bloomington, MN: PsychCorp.
Research Study Contributors
NA
Type of Study Correlational
Sample Size N=218 participants, ages 616
23
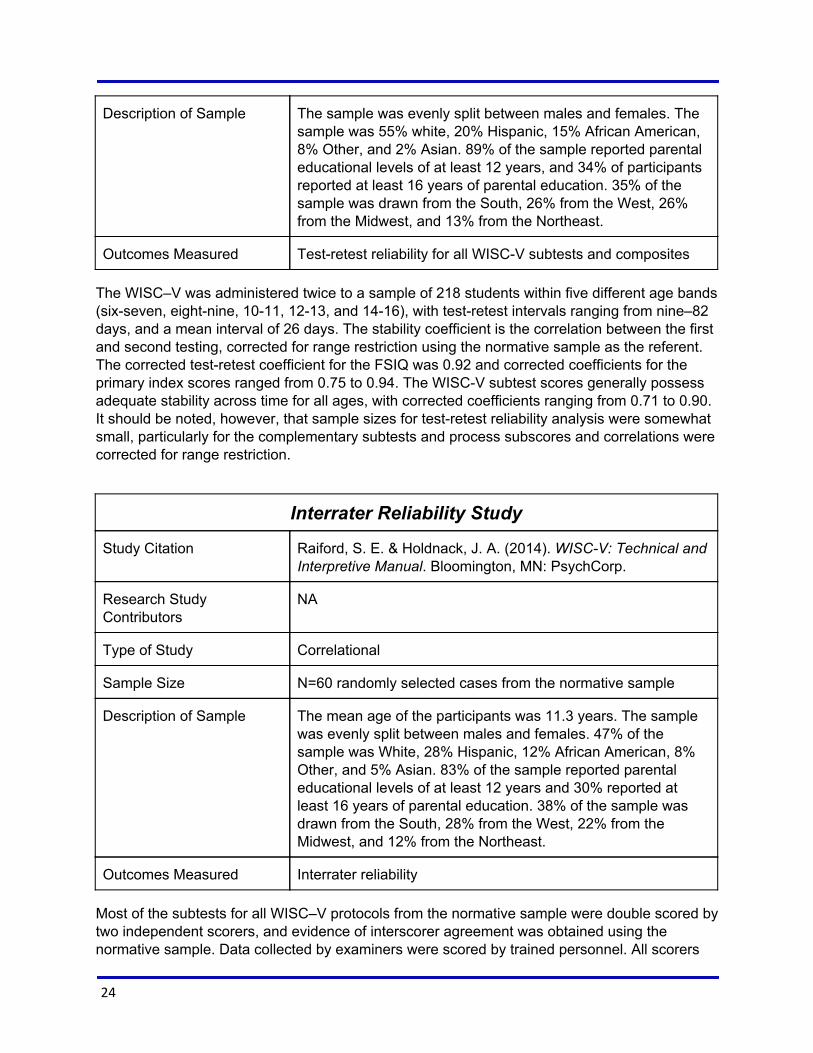
Description of Sample The sample was evenly split between males and females. The sample was 55% white, 20% Hispanic, 15% African American, 8% Other, and 2% Asian. 89% of the sample reported parental educational levels of at least 12 years, and 34% of participants reported at least 16 years of parental education. 35% of the sample was drawn from the South, 26% from the West, 26% from the Midwest, and 13% from the Northeast.
Outcomes Measured Testretest reliability for all WISCV subtests and composites
The WISC–V was administered twice to a sample of 218 students within five different age bands (sixseven, eightnine, 1011, 1213, and 1416), with testretest intervals ranging from nine–82 days, and a mean interval of 26 days. The stability coefficient is the correlation between the first and second testing, corrected for range restriction using the normative sample as the referent. The corrected testretest coefficient for the FSIQ was 0.92 and corrected coefficients for the primary index scores ranged from 0.75 to 0.94. The WISCV subtest scores generally possess adequate stability across time for all ages, with corrected coefficients ranging from 0.71 to 0.90. It should be noted, however, that sample sizes for testretest reliability analysis were somewhat small, particularly for the complementary subtests and process subscores and correlations were corrected for range restriction.
Interrater Reliability Study
Study Citation Raiford, S. E. & Holdnack, J. A. (2014). WISCV: Technical and Interpretive Manual. Bloomington, MN: PsychCorp.
Research Study Contributors
NA
Type of Study Correlational
Sample Size N=60 randomly selected cases from the normative sample
Description of Sample The mean age of the participants was 11.3 years. The sample was evenly split between males and females. 47% of the sample was White, 28% Hispanic, 12% African American, 8% Other, and 5% Asian. 83% of the sample reported parental educational levels of at least 12 years and 30% reported at least 16 years of parental education. 38% of the sample was drawn from the South, 28% from the West, 22% from the Midwest, and 12% from the Northeast.
Outcomes Measured Interrater reliability
Most of the subtests for all WISC–V protocols from the normative sample were double scored by two independent scorers, and evidence of interscorer agreement was obtained using the normative sample. Data collected by examiners were scored by trained personnel. All scorers
24
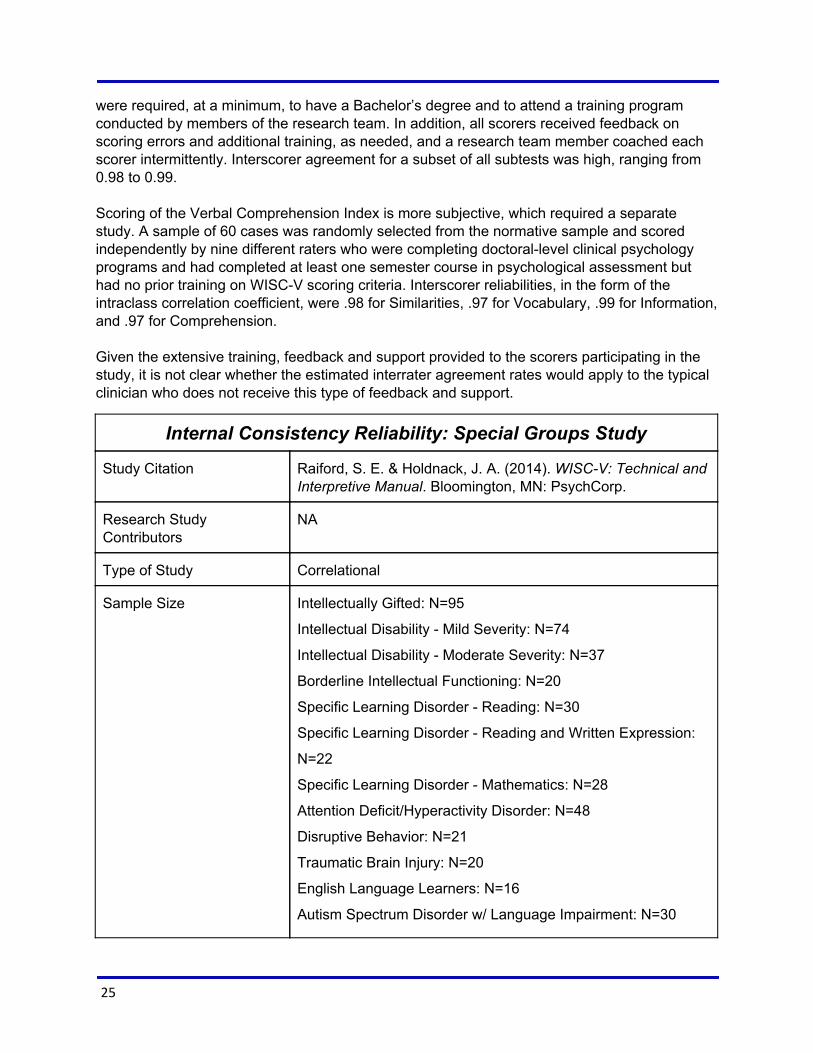
were required, at a minimum, to have a Bachelor’s degree and to attend a training program conducted by members of the research team. In addition, all scorers received feedback on scoring errors and additional training, as needed, and a research team member coached each scorer intermittently. Interscorer agreement for a subset of all subtests was high, ranging from 0.98 to 0.99. Scoring of the Verbal Comprehension Index is more subjective, which required a separate study. A sample of 60 cases was randomly selected from the normative sample and scored independently by nine different raters who were completing doctorallevel clinical psychology programs and had completed at least one semester course in psychological assessment but had no prior training on WISCV scoring criteria. Interscorer reliabilities, in the form of the intraclass correlation coefficient, were .98 for Similarities, .97 for Vocabulary, .99 for Information, and .97 for Comprehension. Given the extensive training, feedback and support provided to the scorers participating in the study, it is not clear whether the estimated interrater agreement rates would apply to the typical clinician who does not receive this type of feedback and support.
Internal Consistency Reliability: Special Groups Study
Study Citation Raiford, S. E. & Holdnack, J. A. (2014). WISCV: Technical and Interpretive Manual. Bloomington, MN: PsychCorp.
Research Study Contributors
NA
Type of Study Correlational
Sample Size Intellectually Gifted: N=95
Intellectual Disability Mild Severity: N=74
Intellectual Disability Moderate Severity: N=37
Borderline Intellectual Functioning: N=20
Specific Learning Disorder Reading: N=30
Specific Learning Disorder Reading and Written Expression:
N=22
Specific Learning Disorder Mathematics: N=28
Attention Deficit/Hyperactivity Disorder: N=48
Disruptive Behavior: N=21
Traumatic Brain Injury: N=20
English Language Learners: N=16
Autism Spectrum Disorder w/ Language Impairment: N=30
25
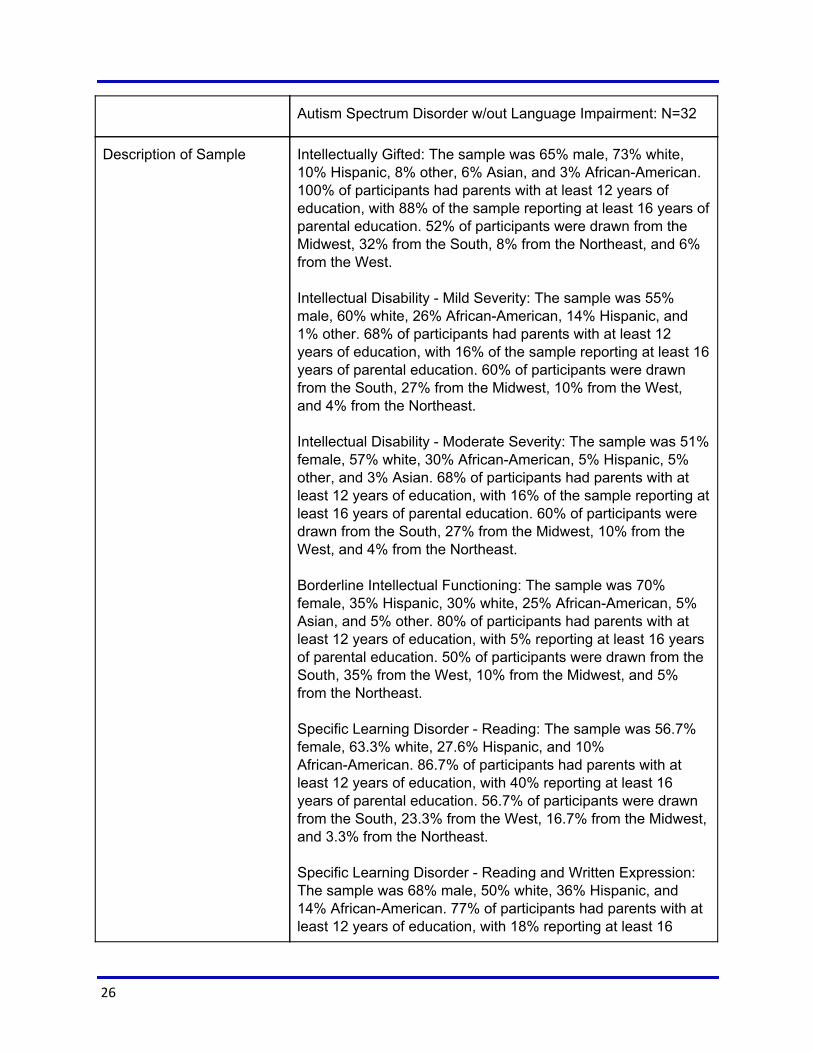
Autism Spectrum Disorder w/out Language Impairment: N=32
Description of Sample Intellectually Gifted: The sample was 65% male, 73% white, 10% Hispanic, 8% other, 6% Asian, and 3% AfricanAmerican. 100% of participants had parents with at least 12 years of education, with 88% of the sample reporting at least 16 years of parental education. 52% of participants were drawn from the Midwest, 32% from the South, 8% from the Northeast, and 6% from the West. Intellectual Disability Mild Severity: The sample was 55% male, 60% white, 26% AfricanAmerican, 14% Hispanic, and 1% other. 68% of participants had parents with at least 12 years of education, with 16% of the sample reporting at least 16 years of parental education. 60% of participants were drawn from the South, 27% from the Midwest, 10% from the West, and 4% from the Northeast. Intellectual Disability Moderate Severity: The sample was 51% female, 57% white, 30% AfricanAmerican, 5% Hispanic, 5% other, and 3% Asian. 68% of participants had parents with at least 12 years of education, with 16% of the sample reporting at least 16 years of parental education. 60% of participants were drawn from the South, 27% from the Midwest, 10% from the West, and 4% from the Northeast. Borderline Intellectual Functioning: The sample was 70% female, 35% Hispanic, 30% white, 25% AfricanAmerican, 5% Asian, and 5% other. 80% of participants had parents with at least 12 years of education, with 5% reporting at least 16 years of parental education. 50% of participants were drawn from the South, 35% from the West, 10% from the Midwest, and 5% from the Northeast. Specific Learning Disorder Reading: The sample was 56.7% female, 63.3% white, 27.6% Hispanic, and 10% AfricanAmerican. 86.7% of participants had parents with at least 12 years of education, with 40% reporting at least 16 years of parental education. 56.7% of participants were drawn from the South, 23.3% from the West, 16.7% from the Midwest, and 3.3% from the Northeast. Specific Learning Disorder Reading and Written Expression: The sample was 68% male, 50% white, 36% Hispanic, and 14% AfricanAmerican. 77% of participants had parents with at least 12 years of education, with 18% reporting at least 16
26
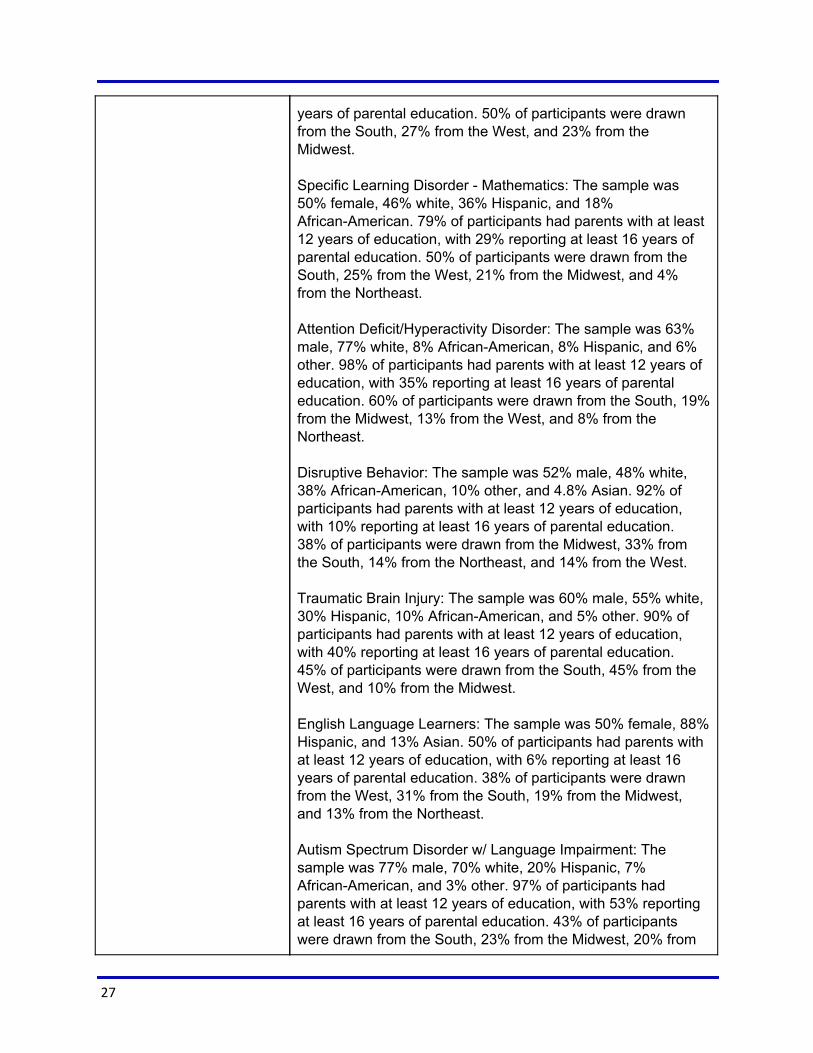
years of parental education. 50% of participants were drawn from the South, 27% from the West, and 23% from the Midwest. Specific Learning Disorder Mathematics: The sample was 50% female, 46% white, 36% Hispanic, and 18% AfricanAmerican. 79% of participants had parents with at least 12 years of education, with 29% reporting at least 16 years of parental education. 50% of participants were drawn from the South, 25% from the West, 21% from the Midwest, and 4% from the Northeast. Attention Deficit/Hyperactivity Disorder: The sample was 63% male, 77% white, 8% AfricanAmerican, 8% Hispanic, and 6% other. 98% of participants had parents with at least 12 years of education, with 35% reporting at least 16 years of parental education. 60% of participants were drawn from the South, 19% from the Midwest, 13% from the West, and 8% from the Northeast. Disruptive Behavior: The sample was 52% male, 48% white, 38% AfricanAmerican, 10% other, and 4.8% Asian. 92% of participants had parents with at least 12 years of education, with 10% reporting at least 16 years of parental education. 38% of participants were drawn from the Midwest, 33% from the South, 14% from the Northeast, and 14% from the West. Traumatic Brain Injury: The sample was 60% male, 55% white, 30% Hispanic, 10% AfricanAmerican, and 5% other. 90% of participants had parents with at least 12 years of education, with 40% reporting at least 16 years of parental education. 45% of participants were drawn from the South, 45% from the West, and 10% from the Midwest. English Language Learners: The sample was 50% female, 88% Hispanic, and 13% Asian. 50% of participants had parents with at least 12 years of education, with 6% reporting at least 16 years of parental education. 38% of participants were drawn from the West, 31% from the South, 19% from the Midwest, and 13% from the Northeast. Autism Spectrum Disorder w/ Language Impairment: The sample was 77% male, 70% white, 20% Hispanic, 7% AfricanAmerican, and 3% other. 97% of participants had parents with at least 12 years of education, with 53% reporting at least 16 years of parental education. 43% of participants were drawn from the South, 23% from the Midwest, 20% from
27
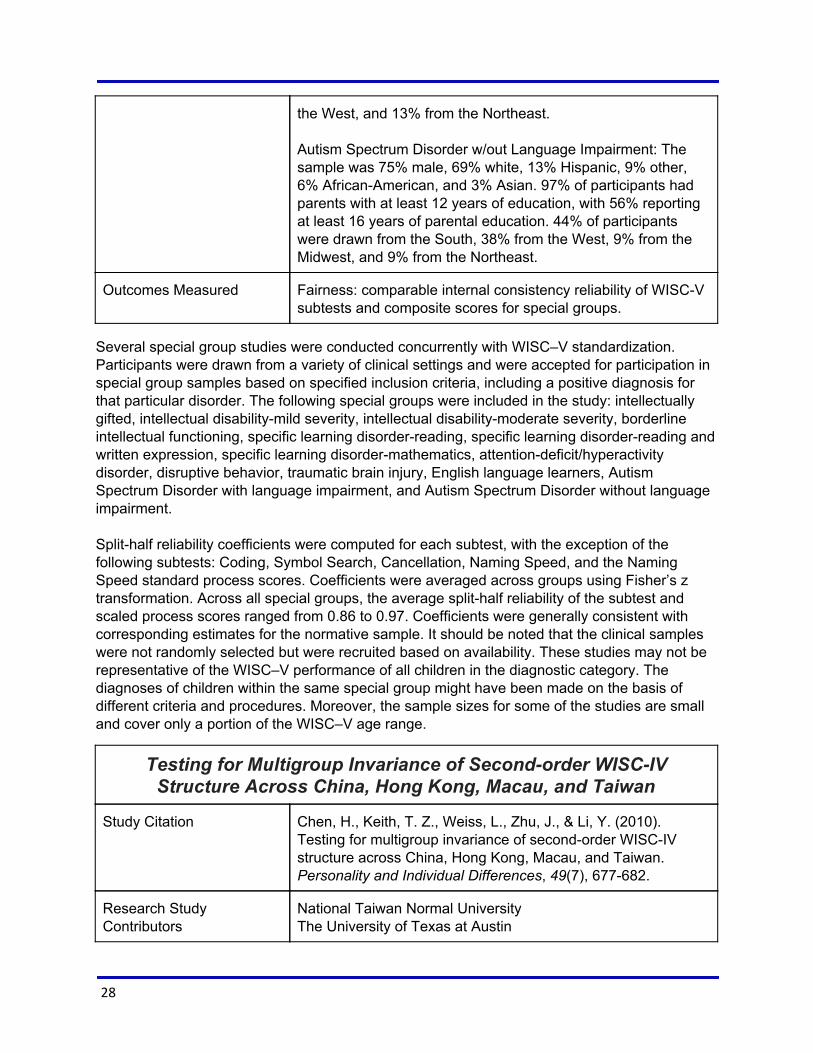
the West, and 13% from the Northeast. Autism Spectrum Disorder w/out Language Impairment: The sample was 75% male, 69% white, 13% Hispanic, 9% other, 6% AfricanAmerican, and 3% Asian. 97% of participants had parents with at least 12 years of education, with 56% reporting at least 16 years of parental education. 44% of participants were drawn from the South, 38% from the West, 9% from the Midwest, and 9% from the Northeast.
Outcomes Measured Fairness: comparable internal consistency reliability of WISCV subtests and composite scores for special groups.
Several special group studies were conducted concurrently with WISC–V standardization. Participants were drawn from a variety of clinical settings and were accepted for participation in special group samples based on specified inclusion criteria, including a positive diagnosis for that particular disorder. The following special groups were included in the study: intellectually gifted, intellectual disabilitymild severity, intellectual disabilitymoderate severity, borderline intellectual functioning, specific learning disorderreading, specific learning disorderreading and written expression, specific learning disordermathematics, attentiondeficit/hyperactivity disorder, disruptive behavior, traumatic brain injury, English language learners, Autism Spectrum Disorder with language impairment, and Autism Spectrum Disorder without language impairment. Splithalf reliability coefficients were computed for each subtest, with the exception of the following subtests: Coding, Symbol Search, Cancellation, Naming Speed, and the Naming Speed standard process scores. Coefficients were averaged across groups using Fisher’s z transformation. Across all special groups, the average splithalf reliability of the subtest and scaled process scores ranged from 0.86 to 0.97. Coefficients were generally consistent with corresponding estimates for the normative sample. It should be noted that the clinical samples were not randomly selected but were recruited based on availability. These studies may not be representative of the WISC–V performance of all children in the diagnostic category. The diagnoses of children within the same special group might have been made on the basis of different criteria and procedures. Moreover, the sample sizes for some of the studies are small and cover only a portion of the WISC–V age range.
Testing for Multigroup Invariance of Secondorder WISCIV Structure Across China, Hong Kong, Macau, and Taiwan
Study Citation Chen, H., Keith, T. Z., Weiss, L., Zhu, J., & Li, Y. (2010). Testing for multigroup invariance of secondorder WISCIV structure across China, Hong Kong, Macau, and Taiwan. Personality and Individual Differences, 49(7), 677682.
Research Study Contributors
National Taiwan Normal University The University of Texas at Austin
28
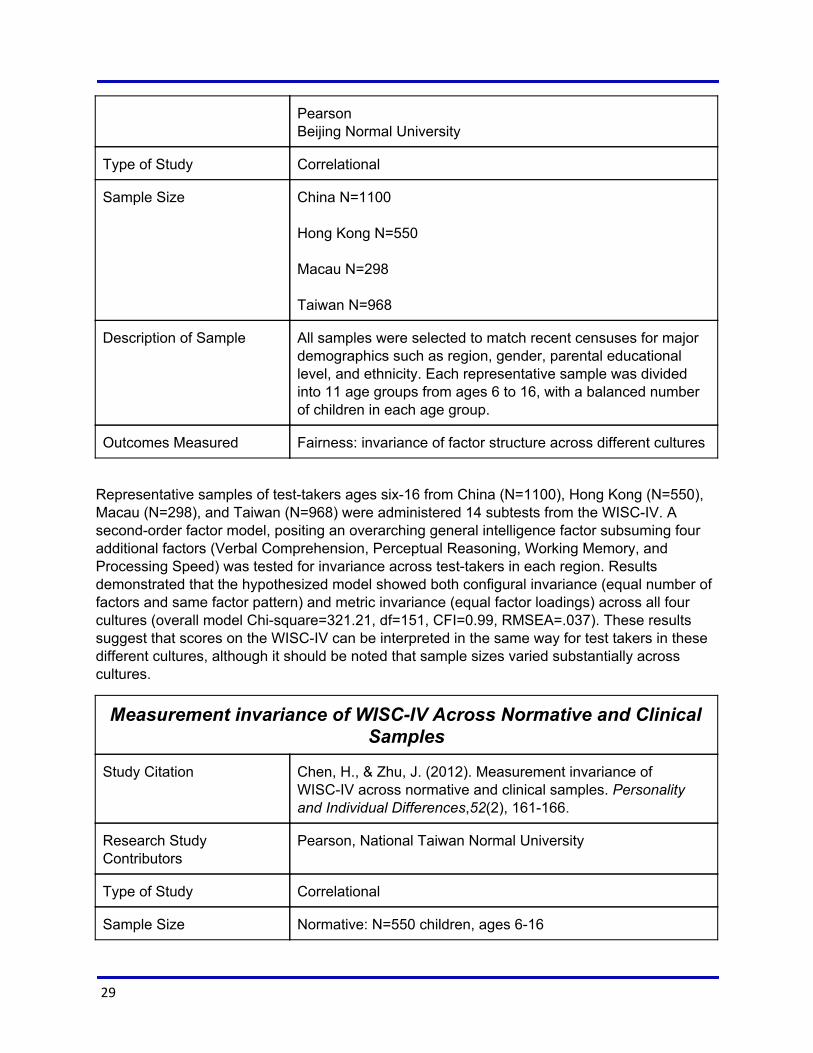
Pearson Beijing Normal University
Type of Study Correlational
Sample Size China N=1100 Hong Kong N=550 Macau N=298 Taiwan N=968
Description of Sample All samples were selected to match recent censuses for major demographics such as region, gender, parental educational level, and ethnicity. Each representative sample was divided into 11 age groups from ages 6 to 16, with a balanced number of children in each age group.
Outcomes Measured Fairness: invariance of factor structure across different cultures
Representative samples of testtakers ages six16 from China (N=1100), Hong Kong (N=550), Macau (N=298), and Taiwan (N=968) were administered 14 subtests from the WISCIV. A secondorder factor model, positing an overarching general intelligence factor subsuming four additional factors (Verbal Comprehension, Perceptual Reasoning, Working Memory, and Processing Speed) was tested for invariance across testtakers in each region. Results demonstrated that the hypothesized model showed both configural invariance (equal number of factors and same factor pattern) and metric invariance (equal factor loadings) across all four cultures (overall model Chisquare=321.21, df=151, CFI=0.99, RMSEA=.037). These results suggest that scores on the WISCIV can be interpreted in the same way for test takers in these different cultures, although it should be noted that sample sizes varied substantially across cultures.
Measurement invariance of WISCIV Across Normative and Clinical Samples
Study Citation Chen, H., & Zhu, J. (2012). Measurement invariance of WISCIV across normative and clinical samples. Personality and Individual Differences,52(2), 161166.
Research Study Contributors
Pearson, National Taiwan Normal University
Type of Study Correlational
Sample Size Normative: N=550 children, ages 616
29
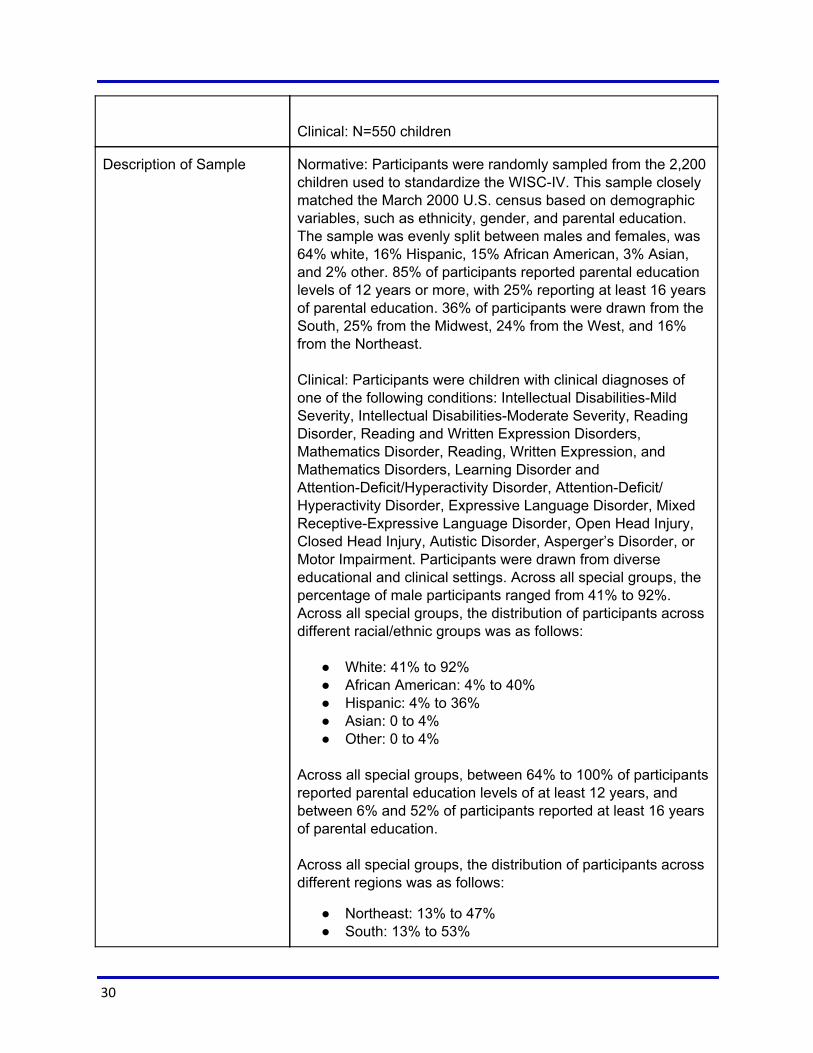
Clinical: N=550 children
Description of Sample Normative: Participants were randomly sampled from the 2,200 children used to standardize the WISCIV. This sample closely matched the March 2000 U.S. census based on demographic variables, such as ethnicity, gender, and parental education. The sample was evenly split between males and females, was 64% white, 16% Hispanic, 15% African American, 3% Asian, and 2% other. 85% of participants reported parental education levels of 12 years or more, with 25% reporting at least 16 years of parental education. 36% of participants were drawn from the South, 25% from the Midwest, 24% from the West, and 16% from the Northeast. Clinical: Participants were children with clinical diagnoses of one of the following conditions: Intellectual DisabilitiesMild Severity, Intellectual DisabilitiesModerate Severity, Reading Disorder, Reading and Written Expression Disorders, Mathematics Disorder, Reading, Written Expression, and Mathematics Disorders, Learning Disorder and AttentionDeficit/Hyperactivity Disorder, AttentionDeficit/ Hyperactivity Disorder, Expressive Language Disorder, Mixed ReceptiveExpressive Language Disorder, Open Head Injury, Closed Head Injury, Autistic Disorder, Asperger’s Disorder, or Motor Impairment. Participants were drawn from diverse educational and clinical settings. Across all special groups, the percentage of male participants ranged from 41% to 92%. Across all special groups, the distribution of participants across different racial/ethnic groups was as follows:
White: 41% to 92% African American: 4% to 40% Hispanic: 4% to 36% Asian: 0 to 4% Other: 0 to 4%
Across all special groups, between 64% to 100% of participants reported parental education levels of at least 12 years, and between 6% and 52% of participants reported at least 16 years of parental education. Across all special groups, the distribution of participants across different regions was as follows:
Northeast: 13% to 47% South: 13% to 53%
30
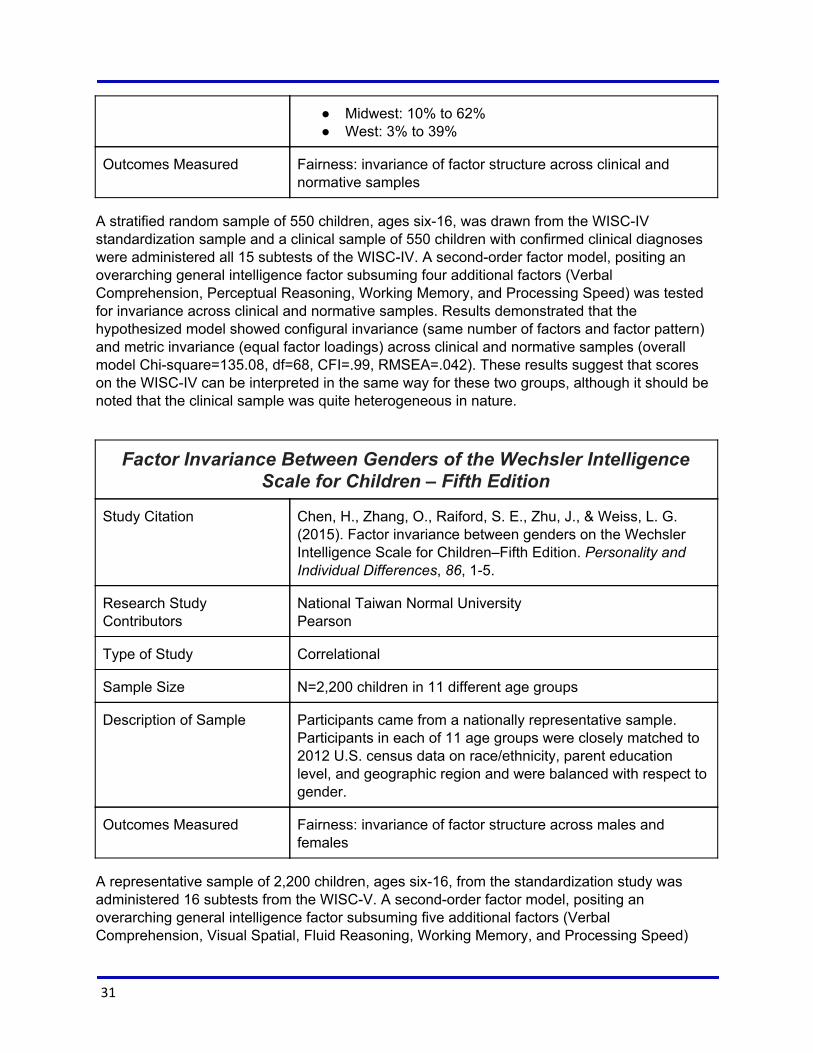
Midwest: 10% to 62% West: 3% to 39%
Outcomes Measured Fairness: invariance of factor structure across clinical and normative samples
A stratified random sample of 550 children, ages six16, was drawn from the WISCIV standardization sample and a clinical sample of 550 children with confirmed clinical diagnoses were administered all 15 subtests of the WISCIV. A secondorder factor model, positing an overarching general intelligence factor subsuming four additional factors (Verbal Comprehension, Perceptual Reasoning, Working Memory, and Processing Speed) was tested for invariance across clinical and normative samples. Results demonstrated that the hypothesized model showed configural invariance (same number of factors and factor pattern) and metric invariance (equal factor loadings) across clinical and normative samples (overall model Chisquare=135.08, df=68, CFI=.99, RMSEA=.042). These results suggest that scores on the WISCIV can be interpreted in the same way for these two groups, although it should be noted that the clinical sample was quite heterogeneous in nature.
Factor Invariance Between Genders of the Wechsler Intelligence Scale for Children – Fifth Edition
Study Citation Chen, H., Zhang, O., Raiford, S. E., Zhu, J., & Weiss, L. G. (2015). Factor invariance between genders on the Wechsler Intelligence Scale for Children–Fifth Edition. Personality and Individual Differences, 86, 15.
Research Study Contributors
National Taiwan Normal University Pearson
Type of Study Correlational
Sample Size N=2,200 children in 11 different age groups
Description of Sample Participants came from a nationally representative sample. Participants in each of 11 age groups were closely matched to 2012 U.S. census data on race/ethnicity, parent education level, and geographic region and were balanced with respect to gender.
Outcomes Measured Fairness: invariance of factor structure across males and females
A representative sample of 2,200 children, ages six16, from the standardization study was administered 16 subtests from the WISCV. A secondorder factor model, positing an overarching general intelligence factor subsuming five additional factors (Verbal Comprehension, Visual Spatial, Fluid Reasoning, Working Memory, and Processing Speed)
31

was tested for invariance across males and females. Results demonstrated that the hypothesized model showed configural invariance (same number of factors and factor pattern) and metric invariance (equal factor loadings) across males and females (overall model Chisquare=428.14, df=207, CFI=0.99, RMSEA=0.031). These results suggest that WISCV scores can be interpreted in the same way for males and females.
32
Future Research Plans
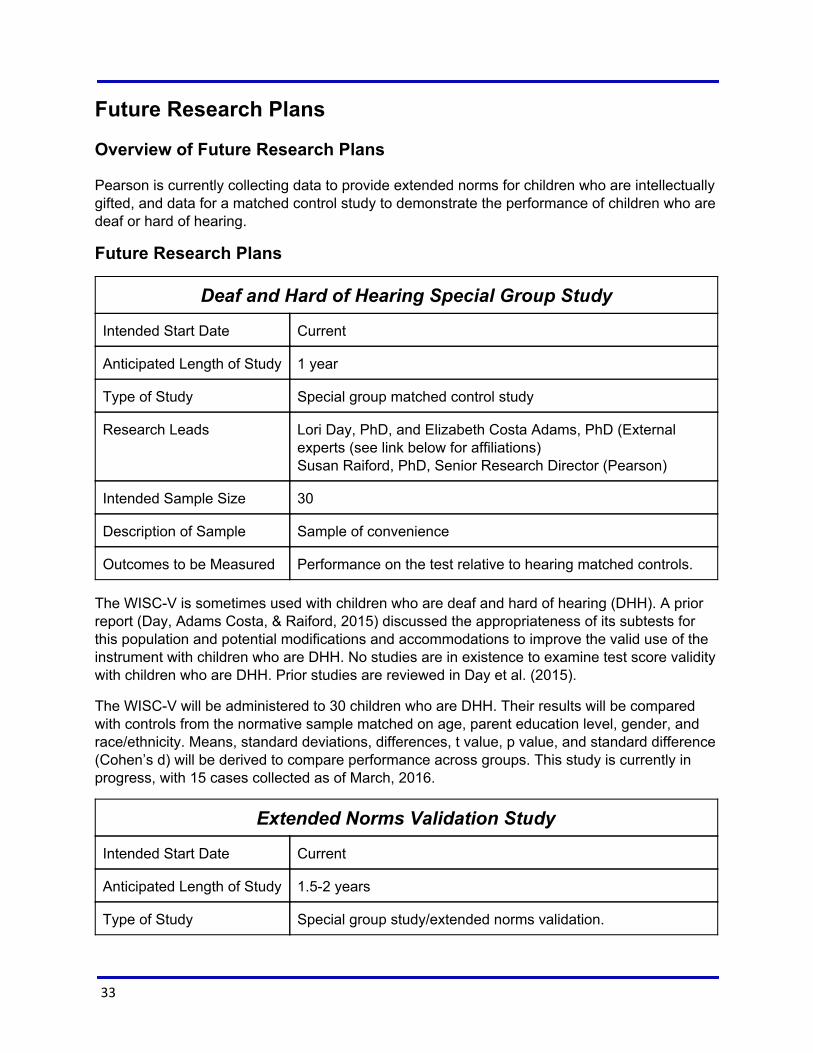
Overview of Future Research Plans
Pearson is currently collecting data to provide extended norms for children who are intellectually gifted, and data for a matched control study to demonstrate the performance of children who are deaf or hard of hearing.
Future Research Plans
Deaf and Hard of Hearing Special Group Study
Intended Start Date Current
Anticipated Length of Study 1 year
Type of Study Special group matched control study
Research Leads Lori Day, PhD, and Elizabeth Costa Adams, PhD (External experts (see link below for affiliations) Susan Raiford, PhD, Senior Research Director (Pearson)
Intended Sample Size 30
Description of Sample Sample of convenience
Outcomes to be Measured Performance on the test relative to hearing matched controls.
The WISCV is sometimes used with children who are deaf and hard of hearing (DHH). A prior report (Day, Adams Costa, & Raiford, 2015) discussed the appropriateness of its subtests for this population and potential modifications and accommodations to improve the valid use of the instrument with children who are DHH. No studies are in existence to examine test score validity with children who are DHH. Prior studies are reviewed in Day et al. (2015).
The WISCV will be administered to 30 children who are DHH. Their results will be compared with controls from the normative sample matched on age, parent education level, gender, and race/ethnicity. Means, standard deviations, differences, t value, p value, and standard difference (Cohen’s d) will be derived to compare performance across groups. This study is currently in progress, with 15 cases collected as of March, 2016.
Extended Norms Validation Study
Intended Start Date Current
Anticipated Length of Study 1.52 years
Type of Study Special group study/extended norms validation.
33
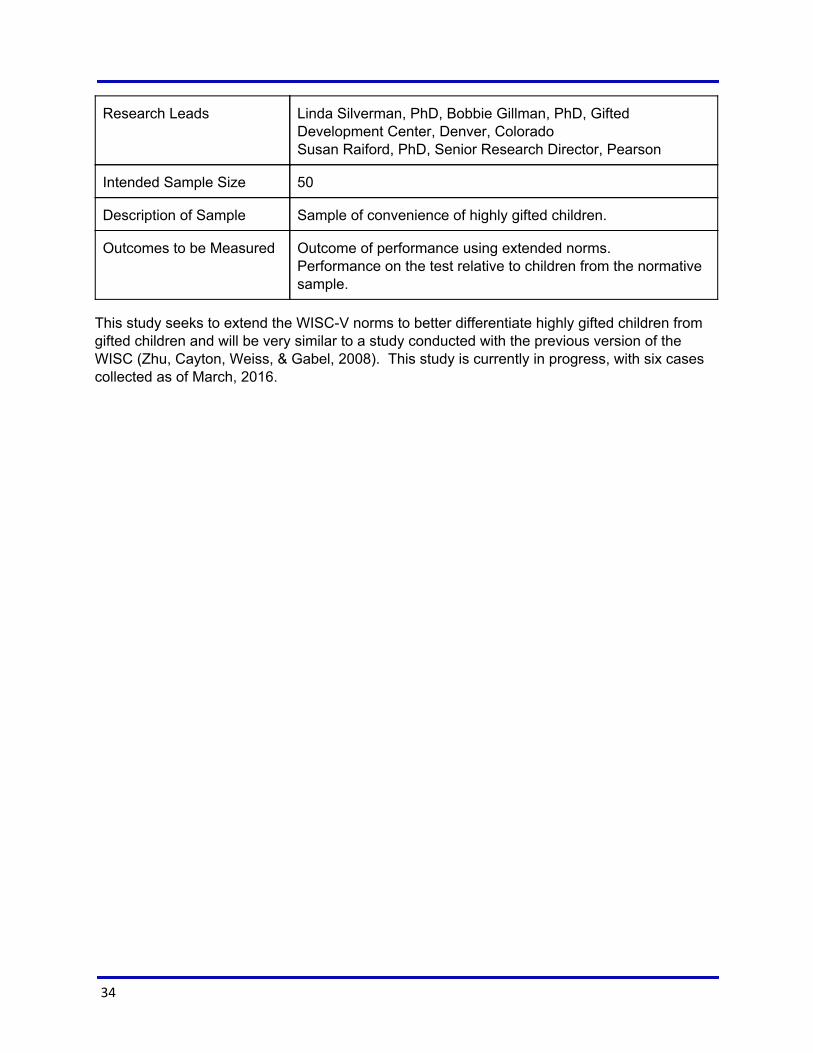
Research Leads Linda Silverman, PhD, Bobbie Gillman, PhD, Gifted Development Center, Denver, Colorado Susan Raiford, PhD, Senior Research Director, Pearson
Intended Sample Size 50
Description of Sample Sample of convenience of highly gifted children.
Outcomes to be Measured Outcome of performance using extended norms. Performance on the test relative to children from the normative sample.
This study seeks to extend the WISCV norms to better differentiate highly gifted children from gifted children and will be very similar to a study conducted with the previous version of the WISC (Zhu, Cayton, Weiss, & Gabel, 2008). This study is currently in progress, with six cases collected as of March, 2016.
34
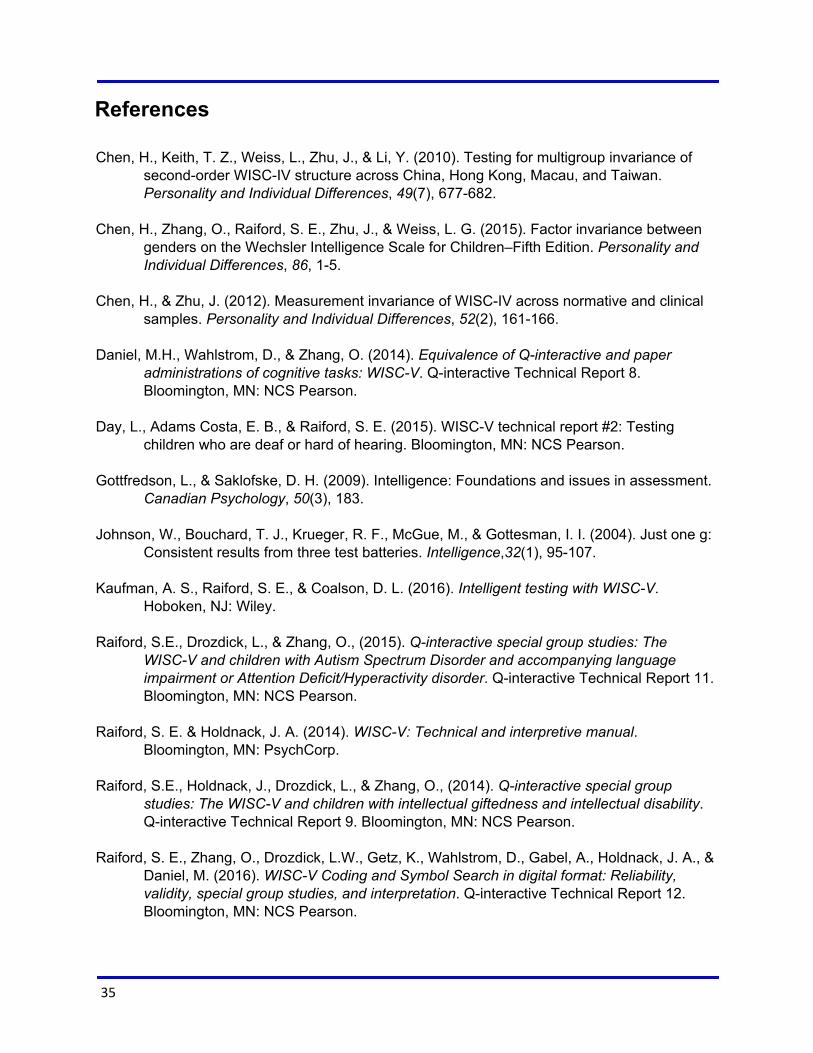
References
Chen, H., Keith, T. Z., Weiss, L., Zhu, J., & Li, Y. (2010). Testing for multigroup invariance of secondorder WISCIV structure across China, Hong Kong, Macau, and Taiwan. Personality and Individual Differences, 49(7), 677682.
Chen, H., Zhang, O., Raiford, S. E., Zhu, J., & Weiss, L. G. (2015). Factor invariance between
genders on the Wechsler Intelligence Scale for Children–Fifth Edition. Personality and Individual Differences, 86, 15.
Chen, H., & Zhu, J. (2012). Measurement invariance of WISCIV across normative and clinical
samples. Personality and Individual Differences, 52(2), 161166. Daniel, M.H., Wahlstrom, D., & Zhang, O. (2014). Equivalence of Qinteractive and paper
administrations of cognitive tasks: WISCV. Qinteractive Technical Report 8. Bloomington, MN: NCS Pearson.
Day, L., Adams Costa, E. B., & Raiford, S. E. (2015). WISCV technical report #2: Testing
children who are deaf or hard of hearing. Bloomington, MN: NCS Pearson. Gottfredson, L., & Saklofske, D. H. (2009). Intelligence: Foundations and issues in assessment.
Canadian Psychology, 50(3), 183. Johnson, W., Bouchard, T. J., Krueger, R. F., McGue, M., & Gottesman, I. I. (2004). Just one g:
Consistent results from three test batteries. Intelligence,32(1), 95107. Kaufman, A. S., Raiford, S. E., & Coalson, D. L. (2016). Intelligent testing with WISCV.
Hoboken, NJ: Wiley. Raiford, S.E., Drozdick, L., & Zhang, O., (2015). Qinteractive special group studies: The
WISCV and children with Autism Spectrum Disorder and accompanying language impairment or Attention Deficit/Hyperactivity disorder. Qinteractive Technical Report 11. Bloomington, MN: NCS Pearson.
Raiford, S. E. & Holdnack, J. A. (2014). WISCV: Technical and interpretive manual.
Bloomington, MN: PsychCorp. Raiford, S.E., Holdnack, J., Drozdick, L., & Zhang, O., (2014). Qinteractive special group
studies: The WISCV and children with intellectual giftedness and intellectual disability. Qinteractive Technical Report 9. Bloomington, MN: NCS Pearson.
Raiford, S. E., Zhang, O., Drozdick, L.W., Getz, K., Wahlstrom, D., Gabel, A., Holdnack, J. A., &
Daniel, M. (2016). WISCV Coding and Symbol Search in digital format: Reliability, validity, special group studies, and interpretation. Qinteractive Technical Report 12. Bloomington, MN: NCS Pearson.
35
Weiss, L., Saklofske, D., Holdnack, J., & Prifitera, A. (2015). WISCV assessment and interpretation: Scientistpractitioner perspectives. London, UK: Academic Press.
Zhu, J., Cayton, T., Weiss, L., & Gabel, A. (2008). WISCIV technical report #7: WISCIV
extended norms. Bloomington MN: NCS Pearson.
36