EFFICACY OF COMMON DISINFECTANT/CLEANING AGENTS IN ...
189
EFFICACY OF COMMON DISINFECTANT/CLEANING AGENTS IN INACTIVATING MURINE NOROVIRUS AND FELINE CALICIVIRUS AS SURROGATE VIRUSES FOR HUMAN NOROVIRUS by Stephanie Chiu B.Sc., The University of British Columbia, 2006 A THESIS SUBMITTED IN PARTIAL FULFILLMENT OF THE REQUIREMENTS FOR THE DEGREE OF MASTER OF SCIENCE in The Faculty of Graduate Studies (Food Science) THE UNIVERSITY OF BRITISH COLUMBIA (Vancouver) February 2013 © Stephanie Chiu, 2013
Transcript of EFFICACY OF COMMON DISINFECTANT/CLEANING AGENTS IN ...

EFFICACY OF COMMON DISINFECTANT/CLEANING
AGENTS IN INACTIVATING MURINE NOROVIRUS AND
FELINE CALICIVIRUS AS SURROGATE VIRUSES FOR
HUMAN NOROVIRUS
by
Stephanie Chiu
B.Sc., The University of British Columbia, 2006
A THESIS SUBMITTED IN PARTIAL FULFILLMENT OF
THE REQUIREMENTS FOR THE DEGREE OF
MASTER OF SCIENCE
in
The Faculty of Graduate Studies
(Food Science)
THE UNIVERSITY OF BRITISH COLUMBIA
(Vancouver)
February 2013
© Stephanie Chiu, 2013
ii
Abstract
Background/Objectives: Norovirus, a major cause of foodborne gastrointestinal infection,
cannot be propagated in cell culture. Limited information exists on the effectiveness of
disinfectants and cleaning agents. The objective of this study was to determine the efficacy of
common types of disinfectants/cleaning agents used in health care facilities in British Columbia
on surrogate viruses, murine norovirus (MNV-1) and feline calicivirus (FCV). Sodium
hypochlorite, accelerated hydrogen peroxide (AHP) and a quaternary ammonium compound
(QUAT) were assessed.
Methods: A virus suspension of known concentration (with or without a soil load) was deposited
onto stainless steel discs under wet or dry load conditions and exposed to defined concentrations
of the disinfectant/cleaning agent for 1, 5 or 10 minute contact time using the quantitative carrier
test (QCT-2) method. Virus inactivation was determined by plaque assay.
Results: Sodium hypochlorite at 1350 ppm inactivated MNV-1 after 5 minutes with a ~5.5 to 6.5
log10 reduction, whereas it took twice as long to inactivate the FCV with ~4.6 to 5.6 log10
reduction. After 5 minutes, 2700 ppm of sodium hypochlorite was able to inactivate MNV-1 and
FCV. Accel at 35000 ppm AHP inactivated MNV-1 after 10 minutes with a ~5.6 to 6.5 log10
reduction, whereas at 3500 ppm, FCV was inactivated by a ~5 log10 reduction. CaviCide at
2800 ppm QUAT and Virox 5 at 5000 ppm AHP were unable to inactivate MNV-1. T36 at
2000 ppm QUAT and 70 % ethanol was effective in inactivating MNV-1 with a >6 log10
reduction after 5 minutes, but only resulted in a <3 log10 reduction of FCV after 10 minutes.

iii
Conclusions: The results have demonstrated that sodium hypochlorite at 1350 ppm after 10
minutes or 2700 ppm at shorter contact times of 5 minutes was more effective in reducing the
viral load of both MNV-1 and FCV on stainless steel surfaces than ready-to-use AHP and QUAT
products. Concentrated AHP products were only effective against MNV-1 when used at a
concentration of 35000 ppm for 10 minutes. QUATs without ethanol were ineffective against
both surrogate viruses and are therefore not indicated for disinfecting environmental surfaces
contaminated with norovirus.

iv
Preface
The University of British Columbia (UBC) Department of Health, Safety and Environment
Laboratory Biological Safety Course was completed on October 10, 2006, prior to the start of the
project.
The UBC Biosafety Committee had approved of this project, Certificate Number B10-0140.

v
Table of Contents
Abstract ........................................................................................................................................... ii
Preface............................................................................................................................................ iv
Table of Contents ............................................................................................................................ v
List of Tables ............................................................................................................................... viii
List of Figures ................................................................................................................................ ix
List of Symbols and Abbreviations................................................................................................. x
Acknowledgements ....................................................................................................................... xii
CHAPTER 1 Introduction ........................................................................................................... 1
1.1 Burden of Disease Associated with Norovirus ................................................................ 1
1.2 Background Information and Literature Review ............................................................. 3
1.2.1 Virology of Noroviruses ........................................................................................... 3
1.2.2 Norovirus Structure ................................................................................................... 5
1.2.3 Norovirus Genome .................................................................................................... 5
1.2.4 Phenotypic Characteristics of Norovirus .................................................................. 6
1.2.5 Norovirus Detection Methods ................................................................................. 10
1.2.6 Clinical Presentations of Norovirus Infections ....................................................... 13
1.2.7 Epidemiology and Transmission of Norovirus ....................................................... 15
1.2.8 Norovirus Outbreaks ............................................................................................... 17
1.2.9 Susceptibility and Vaccine Development ............................................................... 21
1.3 Prevention Strategies ...................................................................................................... 24
1.3.1 Infection Control and Outbreak Prevention ............................................................ 24
1.3.2 Disinfectant Recommendations .............................................................................. 27
1.4 Surrogate Viruses of Human Norovirus: MNV-1 and FCV .......................................... 29
1.4.1 Murine Norovirus (MNV-1) ................................................................................... 30
1.4.2 Feline Calicivirus (FCV)......................................................................................... 34
1.5 Disinfectants and Cleaning Agents ................................................................................ 40
1.5.1 Chlorine Compounds .............................................................................................. 42
1.5.2 Quaternary Ammonium Compounds ...................................................................... 43
1.5.3 Alcohols .................................................................................................................. 45
1.5.4 Hydrogen Peroxide ................................................................................................. 46
1.5.5 Chlorhexidine .......................................................................................................... 47
1.5.6 Phenolic Compounds .............................................................................................. 47
1.6 Disinfectant Studies on Surrogate Viruses: MNV-1 and FCV ...................................... 48

vi
1.7 Research Question and Hypothesis ................................................................................ 58
CHAPTER 2 Materials and Methodology ................................................................................ 66
2.1 Surrogate Viruses and Cell Cultures .............................................................................. 66
2.2 Thawing Frozen Cell Cultures ....................................................................................... 67
2.3 Passaging Cell Cultures .................................................................................................. 68
2.4 Harvesting and Preservation of Cells for Frozen Stock ................................................. 69
2.5 Virus Propagation for Frozen Stock ............................................................................... 70
2.6 Virus Inactivation Tests: Quantitative Carrier Test 2 (QCT-2) Method ........................ 71
2.7 Plaque Assay .................................................................................................................. 73
2.8 Disinfectants and Cleaning Agents ................................................................................ 74
2.9 Neutralizer ...................................................................................................................... 76
2.9.1 Sodium Thiosulphate Neutralizer ........................................................................... 76
2.9.2 Letheen Broth Neutralizer ....................................................................................... 77
2.10 Additional Control Tests for Virucidal Activity ......................................................... 77
2.10.1 Cytotoxicity Control Test ....................................................................................... 78
2.10.2 Interference with Virus Infectivity Control Test .................................................... 79
2.11 Reagent and Media Solution Preparation ................................................................... 81
2.11.1 HEPES Buffer Solution .......................................................................................... 82
2.11.2 Crystal Violet Solution ........................................................................................... 82
2.11.3 Penicillin G Potassium Salt Solution ...................................................................... 83
2.11.4 2X alpha-MEM Solution......................................................................................... 83
2.11.5 Trypsin-Versene Solution ....................................................................................... 83
2.11.6 Alpha-MEM Solution ............................................................................................. 84
2.11.7 Fungizone® Amphotericin B Solution ................................................................... 84
2.11.8 Gentamicin Reagent Solution ................................................................................. 85
2.12 Soil Load Mixture ....................................................................................................... 85
2.12.1 Tryptone .................................................................................................................. 85
2.12.2 Bovine Mucin.......................................................................................................... 86
2.12.3 Bovine Serum Albumin .......................................................................................... 86
2.12.4 SeaPlaque and SeaKem Agarose Overlay .............................................................. 86
2.13 Statistical Analysis ..................................................................................................... 87
CHAPTER 3 Results and Discussion ........................................................................................ 95
3.1 Efficacy of Sodium Hypochlorite (Domestic Miraclean Bleach) against MNV-1 and
FCV, with and without Soil Load, under Wet and Dry Load Conditions .................... 100

vii
3.2 Efficacy of Accelerated Hydrogen Peroxide (Accel and Virox 5) against MNV-1 and
FCV, with and without Soil Load, under Wet and Dry Load Conditions .................... 102
3.3 Efficacy of QUAT (CaviCide) and QUAT-Alcohol (T36) against MNV-1 and FCV,
with and without Soil Load, under Wet and Dry Load Conditions.............................. 106
3.4 Effect of Drying on Viral Titer .................................................................................... 107
3.5 Cytotoxicity and Virus Infectivity Control Test .......................................................... 113
3.5.1 Cytotoxicity Observations for RAW 264.7 and CRFK Cells ............................... 114
3.5.2 Virus Infectivity of MNV-1 towards RAW 264.7 Cells ....................................... 116
3.5.3 Virus Infectivity of FCV towards CRFK Cells..................................................... 118
3.6 Challenges .................................................................................................................... 119
3.7 Mechanism of Virucidal Activity and Overall Assessment of Most Suitable Surrogate
Virus for Human Norovirus ......................................................................................... 123
CHAPTER 4 Conclusion and Recommendations for Future Work ........................................ 140
BIBLIOGRAPHY ....................................................................................................................... 142
APPENDICES ............................................................................................................................ 156
Appendix A. Solution and Media Preparation ........................................................................ 156
Appendix B. Statistical Analysis of Virus Infectivity Control Tests and Viral Drying ......... 158
Appendix C. Photo Images of Experimental Design and Virus Plaques ................................ 172
Appendix D. Conversion of Revolutions Per Minute (rpm) to Centrifugal Force (× g) ........ 177
viii
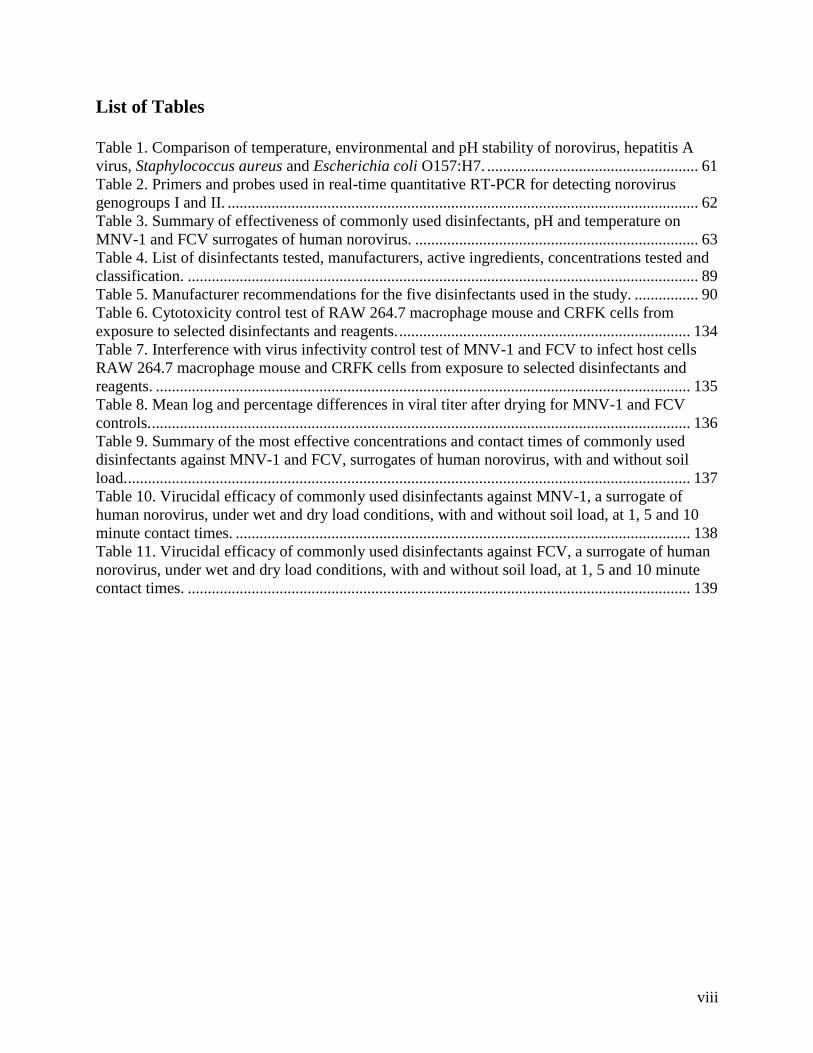
List of Tables
Table 1. Comparison of temperature, environmental and pH stability of norovirus, hepatitis A
virus, Staphylococcus aureus and Escherichia coli O157:H7. ..................................................... 61
Table 2. Primers and probes used in real-time quantitative RT-PCR for detecting norovirus
genogroups I and II. ...................................................................................................................... 62
Table 3. Summary of effectiveness of commonly used disinfectants, pH and temperature on
MNV-1 and FCV surrogates of human norovirus. ....................................................................... 63
Table 4. List of disinfectants tested, manufacturers, active ingredients, concentrations tested and
classification. ................................................................................................................................ 89
Table 5. Manufacturer recommendations for the five disinfectants used in the study. ................ 90
Table 6. Cytotoxicity control test of RAW 264.7 macrophage mouse and CRFK cells from
exposure to selected disinfectants and reagents. ......................................................................... 134
Table 7. Interference with virus infectivity control test of MNV-1 and FCV to infect host cells
RAW 264.7 macrophage mouse and CRFK cells from exposure to selected disinfectants and
reagents. ...................................................................................................................................... 135
Table 8. Mean log and percentage differences in viral titer after drying for MNV-1 and FCV
controls. ....................................................................................................................................... 136
Table 9. Summary of the most effective concentrations and contact times of commonly used
disinfectants against MNV-1 and FCV, surrogates of human norovirus, with and without soil
load. ............................................................................................................................................. 137
Table 10. Virucidal efficacy of commonly used disinfectants against MNV-1, a surrogate of
human norovirus, under wet and dry load conditions, with and without soil load, at 1, 5 and 10
minute contact times. .................................................................................................................. 138
Table 11. Virucidal efficacy of commonly used disinfectants against FCV, a surrogate of human
norovirus, under wet and dry load conditions, with and without soil load, at 1, 5 and 10 minute
contact times. .............................................................................................................................. 139

ix
List of Figures
Figure 1. Diagram of Calicivirus family, genus, genogroup and genotype. ................................. 64
Figure 2. Norovirus genome with protein products and positions of regions A-D used for
detection and genotyping. ............................................................................................................. 65
Figure 3. Experimental design flowchart of the study including surrogate viruses MNV-1 and
FCV, soil load versus no soil load, wet versus dry load conditions, and contact time. ................ 91
Figure 4. QCT-2 method for virus inactivation and plaque assay method. .................................. 92
Figure 5. Cytotoxicity control test. ............................................................................................... 93
Figure 6. Interference with virus infectivity control test. ............................................................. 94
Figure 7. Effectiveness of sodium hypochlorite against MNV-1, (A) without soil load and (B)
with soil load, at 1, 5 and 10 minute contact times, under wet and dry load conditions. ........... 128
Figure 8. Effectiveness of sodium hypochlorite against FCV, (A) without soil load and (B) with
soil load, at 1, 5 and 10 minute contact times, under wet and dry load conditions. ................... 129
Figure 9. Effectiveness of Accel (AHP) against MNV-1, (A) without soil load and (B) with soil
load, at 1, 5 and 10 minute contact times, under wet and dry load conditions. .......................... 130
Figure 10. Effectiveness of Accel (AHP) against FCV, (A) without soil load and (B) with soil
load, at 1, 5 and 10 minute contact times, under wet and dry load conditions. .......................... 131
Figure 11. Effectiveness of CaviCide (QUAT), Virox 5 (AHP) and T36 (QUAT-alcohol) against
MNV-1 (without soil load) at 1, 5 and 10 minute contact times, under wet and dry load
conditions. ................................................................................................................................... 132
Figure 12. Effectiveness of Virox 5 (AHP) against MNV-1 (with soil load) at 1, 5 and 10 minute
contact times, under wet and dry load conditions. ...................................................................... 132
Figure 13. Effectiveness of CaviCide (QUAT), Virox 5 (AHP) and T36 (QUAT-alcohol) against
FCV (without soil load) at 1, 5 and 10 minute contact times, under wet and dry load conditions.
..................................................................................................................................................... 133
Figure 14. Effectiveness of Virox 5 (AHP) against FCV (with soil load) at 1, 5 and 10 minute
contact times, under wet and dry load conditions. ...................................................................... 133

x
List of Symbols and Abbreviations
3C
AHP
Alpha-MEM
ANOVA
ATCC
BCPHMRL
BCCDC
BGA
BSA
CDC
CRFK
CTE
DMSO
D-Value
EBSS
EDTA
EHO
ELISA
EPA
FBS
FBVE
FCV
GEP
HAV
HBGA
HIV
HSD
ID50
MNV-1
NTP
ORF
PBS
PFU
PPE
QCT-2
QUATs
RdRp
RHDV
RPM
RT-PCR
RT-qPCR
RTU
TCID50
3C-Like Protease
Accelerated Hydrogen Peroxide
Alpha-Minimum Essential Medium
Analysis of Variance
American Type Culture Collection
British Columbia Public Health & Microbiology Reference
Laboratories
British Columbia Centre for Disease Control
Blood Group Antigen
Bovine Serum Albumin
Centers for Disease Control and Prevention
Crandell Reese Feline Kidney
Cytotoxic Effects
Dimethyl sulfoxide
Decimal Reduction Time
Earle’s Balanced Salt Solution
Ethylenediaminetetraacetic acid disodium salt
Environmental Health Officer
Enzyme Linked Immunosorbent Assay
Environmental Protection Agency
Fetal Bovine Serum
Foodborne Viruses in Europe
Feline Calicivirus
Genome Equivalent Particles
Hepatitis A Virus
Histo-Blood Group Antigen
Human Immunodeficiency Virus
Honestly Significant Difference
Infective Dose
Murine Norovirus
Nucleoside Triphosphatase
Open Reading Frame
Phosphate-buffered saline
Plaque Forming Unit
Personal Protective Equipment
Quantitative Carrier Test-2
Quaternary Ammonium Compounds
RNA-Directed RNA Polymerase
Rabbit Haemorrhagic Disease Virus
Revolutions per minute
Reverse Transcription-Polymerase Chain Reaction
Reverse Transcription-Quantitative Polymerase Chain Reaction
Ready-to-use
Tissue Culture Infectious Dose

xi
TV
USEPA
VLP
VP1
VP2
VPG
VS-FCV
Tulane Virus
United States Environmental Protection Agency
Virus-Like Particle
Viral Protein 1
Viral Protein 2
Viral Genome-Linked Protein
Virulent Systemic Feline Calicivirus
xii
Acknowledgements
I would like to thank the Community and Hospital Infection Control Association of Canada
(CHICA-Canada) for awarding a research grant to help fund this project. I would also like to
thank CHICA-Canada for supporting this research and Dr. Brent Skura for graciously providing
financial assistance. I would like to thank my committee members, Dr. Judith Isaac-Renton, Dr.
Martin Petric, Lorraine McIntyre and Bruce Gamage, my supervisor, Dr. Brent Skura, for their
continued support and advice, and the support staff of the British Columbia Public Health &
Microbiology Reference Laboratories (BCPHMRL).
My laboratory experiments were conducted in the BCPHMRL located at the British Columbia
Centre for Disease Control (BCCDC). The laboratory technologists from the BCPHMRL
Virology Program were very helpful, thoughtful, encouraging and knowledgeable. I would like
to send a heartfelt thanks to all BCPHMRL staff that helped me along the way, specifically Joe
Fung, Julie Wong, Brian Auk, Ron Gillies, Louella D’Silva, Raymond Ma, Benny Hoy, Tracy
Chan, Julie Ho, Annie Mak and Alan McNabb. I would like to especially thank David Lawrence
for training me on growing viruses and performing plaque assays. The many laboratory skills I
learned from David were invaluable.
Lastly, I would like to thank my family for their financial support and understanding, and my
friends for their words of encouragement throughout the course of my M.Sc. program.

1
CHAPTER 1 Introduction
1.1 Burden of Disease Associated with Norovirus
Acute gastroenteritis, the inflammation of the stomach and small intestine, is characterized by
nausea, vomiting and diarrhea. It may also be accompanied by other symptoms such as fever
and chills. Acute gastroenteritis can be caused by viral, bacterial or parasitic infection, or can
result from intoxication by bacterial toxins (Nuermberger, 2005). Norovirus has emerged as the
major cause of foodborne gastrointestinal infections based on the recent development and use of
sensitive nucleic acid based diagnostic techniques (Nuermberger, 2005; Patel et al., 2009).
Through active and passive surveillance, it is estimated that each year 31 major pathogens in the
United States cause 9.4 million episodes of foodborne illness, of which 58 % were caused by
norovirus, 11 % by Salmonella enterica, 10 % by Clostridium perfringens, 9 % by
Campylobacter spp., and 3 % by Staphylococcus aureus (Centers for Disease Control and
Prevention, 2011a; Scallan et al., 2011). Norovirus is highly contagious, and can spread quickly
in premises such as hospitals, daycare centres, residential and domestic homes (Barker et al.,
2004).
Of all infectious intestinal diseases, noroviruses accounted for an estimated 6 % in England and
11 % in the Netherlands (Fretz et al., 2005). The Centers for Disease Control and Prevention
(CDC) in the United States estimates that each year, more than 21 million cases of acute
gastroenteritis are caused by norovirus infection (Centers for Disease Control and Prevention,
2011c). Noroviruses were shown to be responsible for over 85 % of all nonbacterial outbreaks
of gastroenteritis reported from 1995 to 2000 based on information from 10 data surveillance
systems in the Foodborne Viruses in Europe (FBVE) Network (Lopman et al., 2003). In 2006,

2
the number of norovirus outbreaks from 13 European countries was reported at 4074 (11.2
outbreak rate per million population size) (Kroneman et al., 2007). In the United States, 39 % of
all foodborne outbreaks were reported to be due to norovirus infection (Centers for Disease
Control and Prevention, 2010). Between 300 and 400 norovirus outbreaks are reported to the
National Enteric Surveillance Program each year in Canada (Public Health Agency of Canada,
2005).
In the late 1990s, sensitive and simpler assays such as reverse transcription-polymerase chain
reaction (RT-PCR) were adopted at the CDC for detection of norovirus in outbreaks.
Accordingly, norovirus was identified as the etiologic agent in 93 % of outbreaks of nonbacterial
gastroenteritis in tests submitted to the CDC from 1997 to 2000. An analysis of 8271 foodborne
outbreaks reported to the CDC from 1991 to 2000 showed that the introduction of RT-PCR
greatly improved identification of the etiological source of outbreaks in the United States, up
from less than 1 % in 1991 to 12 % in 2000 (Widdowson et al., 2005). Harris et al. (2008) used
regression analysis to determine the number of deaths in England and Wales from 2001-2006,
and based on the model, the results suggested that 20 % of deaths for people 65 years of age or
higher could be attributed to infectious intestinal diseases that were associated with norovirus
infection.

3
1.2 Background Information and Literature Review
1.2.1 Virology of Noroviruses
Noroviruses, previously called Norwalk virus or Norwalk-like viruses, were discovered and
identified using immune electron microscopy to examine stool filtrate samples from a volunteer
infected with a bacteria-free stool filtrate (the sample was obtained during a school outbreak in
Norwalk, Ohio in 1968) (Kapikian et al., 1972). This became the prototype of the norovirus
genus.
Noroviruses are single-stranded, positive-sense RNA viruses that belong to the Caliciviridae
family (Lopman et al., 2004; Zingg et al., 2005). They are small, round, non-enveloped,
icosahedral structured viruses that can range from 35 to 40 nm in diameter (Donaldson et al.,
2010; Lopman et al., 2004; Zingg et al., 2005). The Caliciviridae family (Figure 1) includes the
following genera: Norovirus, Sapovirus, Lagovirus, Vesivirus and proposed (but not official)
genera, Nebovirus and Recovirus, which are pending (Green et al., 2000; Karst, 2010; Patel et al.,
2009).
The Norovirus genus is composed of more than 40 virus genotypes (strains) that are divided into
five genogroups based on sequence diversity in the complete capsid protein, VP1 (Donaldson et
al., 2010; Patel et al., 2009). Most human noroviruses relevant to human disease are divided into
genogroups I and II, based on the genetic diversity of the capsid or polymerase genes, and with a
subset also clustered within genogroup IV (Goodridge et al., 2004; Patel et al., 2009). Data from
early antigenic analyses and more recently extensive sequence analyses show noroviruses to be
highly genetically variable (Radford et al., 2004). Genogroup II viruses have less genetic

4
diversity than genogroup I (Hutson et al., 2004; Radford et al., 2004). Genogroup II includes
both human and swine noroviruses (Patel et al., 2009). Genogroup II, genotype 4 noroviruses
(GII.4) are the most common strains currently detected and are responsible for 70-80 % of
human norovirus outbreaks in the world (Donaldson et al., 2010). Out of 773 norovirus-related
outbreaks reported to the CDC between 1994 and 2006, 81.4 % were caused by genogroup II
viruses and 44.2 % were caused by GII.4 strains (Zheng et al., 2010). Genogroup IV viruses are
rare in humans and their significance is currently unknown although they include both human
and canine noroviruses. Genogroup III noroviruses are bovine noroviruses, whereas genogroup
V are murine noroviruses (Patel et al., 2009; Radford et al., 2004).
There is 69-97 % nucleotide identity in strains within a genotype, whereas strains of different
genogroups have 51-56 % nucleotide similarity. There is substantial variability in structural
proteins from strains within one genotype reaching up to 40 % in the capsid amino acid
sequence, whereas the strains of different genogroups can differ by more than 50 % (Donaldson
et al., 2010).
There is some evidence to suggest that evolution in some genotypes is sufficient enough to
generate mutant clusters with new ligand-binding characteristics and antigenic properties. It has
been shown in the GII.4 genotype that evolution can result in differential receptor binding and
novel antigenic features (Donaldson et al., 2010).

5
1.2.2 Norovirus Structure
The norovirus genome (Figure 2) is approximately 7.7 kb in size and contains three open reading
frames (ORF) that encode structural and non-structural proteins (Donaldson et al., 2010; Hardy,
2005). The first x-ray crystallography of the norovirus capsid was performed by Prasad et al.
(1999). The capsid consists of 180 copies of a single protein, with the capsid protein having a
protruding P domain connected by a flexible hinge to a shell S domain which has a classical
eight-stranded ß-sandwich motif. The S domain is involved in the formation of the icosahedral
shell, whereas the P domain forms the protrusion emanating from the shell. Three-dimensional
structures of recombinant norovirus were studied using electron cryomicroscopy and computer
image processing techniques at ~22 Å resolution. Caliciviruses have a T = 3 icosahedral
symmetry with 180 molecules of the capsid protein, which contain a protein shell between 100
and 145 Å radius, organized into 90 dimers. The protein shell of the capsid protein exhibits
protrusions at all local and strict two-fold axes that extend to an outer radius of ~190 Å and
leaves large depressions at the icosahedral five and three-fold axes (Prasad et al., 1999).
1.2.3 Norovirus Genome
The 5’ end of the genome is covalently coupled with protein VPg and the 3’ end is
polyadenylated (Hardy, 2005). The capsid of norovirus is composed of 180 copies of viral
protein 1 (VP1), which is the major important component. Viral protein 2 (VP2), a minor
structural protein, is also present in the capsid in low copy number. VP1 is divided into two
domains: shell domain and protruding domain, which is further divided into two sub-domains,
P1 and P2 (Donaldson et al., 2010).
6
The first ORF (ORF1) of about 5 kb is located in the first two-thirds of the genome. This ORF
encodes a ~200 kDa polyprotein that is auto-processed by a virally encoded 3C-like protease
(3C) and yields non-structural replicase proteins that are essential for viral replications. The
polyprotein is cleaved into p48, nucleoside triphosphatase (NTP), p22, viral genome-linked
protein (VPg), and RNA-directed RNA polymerase (RdRp). The second ORF (ORF2) of 1.8 kb
encodes VP1. The third ORF (ORF3) of about 0.6 kb encodes the 22 kDa structural protein,
VP2 (Donaldson et al., 2010).
The A-B dimer, formed from two capsid protein monomers, provides the receptor-binding region
and sites of antigenic variation. The virus particle contains 180 monomers of the capsid protein
assembled as dimers (Donaldson et al., 2010).
1.2.4 Phenotypic Characteristics of Norovirus
The norovirus capsid protects the genome from environmental degradation caused by increased
temperatures, desiccation and nucleases, and confers a high degree of resistance to chemical
disinfection compared to that observed with more complex viruses such as those with envelopes
or bacteria (Wu et al., 2005). Norovirus particles are also resistant to other stressors such as
moderate heat, chlorine and freezing temperatures (Nuermberger, 2005).
Because human noroviruses cannot be grown in cell culture, data on their environmental survival
has been limited to studies with surrogate viruses such as feline calicivirus (FCV), murine
norovirus (MNV-1) and other non-enveloped viruses such as bacteriophage MS2 (Weber et al.,
2010). This limitation is relevant because these surrogate viruses may not accurately reflect how

7
human norovirus behaves in regard to environmental survival and susceptibility to disinfectants
(Weber et al., 2010). A number of studies have used human norovirus; however, analysis was
done by monitoring damage to the genome using real-time reverse transcription quantitative
polymerase chain reaction (RT-qPCR) and not infectivity (Hudson et al., 2007).
Norovirus in general can contaminate and survive in inanimate environments such as on surfaces
and medical equipment (Hota, 2004). Norovirus survived in stool samples for ≤14 days and ≤12
days on carpets (through environmental swabbing and testing via RT-PCR) (Cheesbrough et al.,
2000; Hota, 2004). Because norovirus is capable of surviving for long periods of time in the
environment, contamination and the spread of norovirus via inanimate objects has been
demonstrated by outbreaks on cruise ships (Nuermberger, 2005).
Human norovirus genome resisted complete degradation at 72 °C for 45 and 60 minutes (Weber
et al., 2010). The virus can survive on surfaces of refrigerated foods for at least 10 days and in
mineral and tap water for over two months at 4, 25 and -20 °C (Weber et al., 2010). FCV can
survive on surfaces in a dried state for 21 to 28 days at room temperature (Weber et al., 2010).
Norovirus can survive in a wide range of temperatures, from freezing to 60 °C and can survive
on environmental surfaces and in a variety of foods (Weber et al., 2010). In a surface and
ground water study, MNV-1 was a better human norovirus surrogate virus than FCV due to its
genetic similarity and environmental stability (Bae & Schwab, 2008). The infectivity reduction
rates for FCV were significantly higher than other surrogate viruses at 25 °C in water, indicating
that FCV is a much less stable surrogate virus than MNV-1 (Bae & Schwab, 2008). A thermal
inactivation study, which focused on the stability of FCV and human norovirus (GII.4 norovirus)

8
RNA, demonstrated that human norovirus is heat stable when exposed for 2 minutes up to
76.6 °C compared to FCV which was only stable to 63.3 °C (Topping et al., 2009). MNV-1,
FCV and bacteriophage MS2 survived in a variety of beverages such as juices, juice blends and
milk at 4 °C (Horm & D’Souza, 2011). MNV-1 showed no reduction in viral titer after 21 days
in orange juice and milk but showed a moderate reduction of 1.4 log in pomegranate juice, and
was completely inactivated after 7 days in an orange and pomegranate juice blend (Horm &
D’Souza, 2011). FCV was completely inactivated after 14 days in orange juice and pomegranate
juice; ~3 logs of viral titer was inactivated after 21 days in milk, and the virus was completely
inactivated after 1 day in an orange and pomegranate juice blend (Horm & D’Souza, 2011).
MS2 was inactivated by ~1.28 log and <1 log after 21 days in orange juice, and milk or
pomegranate juice, respectively, and <1 log after 21 days in juice blends (Horm & D’Souza,
2011). Human norovirus can survive on food preparation surfaces (such as stainless steel,
Formica® and ceramic) and on human hands for long periods of time, and these can act as
vehicles for norovirus transmission (Liu et al., 2009). In particular, norovirus survived after 21-
28 days of storage on surfaces and showed a gradual average reduction in detectable viral RNA
ranging from 1.5 to 2.9 log10 genome equivalent particles (GEP) through real-time RT-qPCR,
whereas Snow Mountain virus showed greater environmental stability with 0.4 to 1.2 log10 GEP
reduction on all three types of surfaces after 42 days of storage (Liu et al., 2009).
Norovirus transmission through cleaning cloths (in particular, nonwoven cloths and cotton terry
bar towels), which can transfer a significant amount of virus back to food contact surfaces, was
documented by Gibson et al. (2012). Takahashi et al. (2011) demonstrated that the presence of
food residues left behind on stainless steel surfaces from improper cleaning increased the
9
survivability of MNV-1 and reduced the germicidal effect of sodium hypochlorite. The presence
of organic material such as feces can generally decrease the efficacy of a number of disinfectants
including organic acid, aldehyde, sodium hypochlorite and peroxide (Poschetto et al., 2007). A
thermal inactivation study involving MNV-1, Hepatitis A virus (HAV) and FCV demonstrated
that all three viruses were stable at 37 °C (Gibson & Schwab, 2011). MNV-1 was statistically
more stable than FCV at 50 °C (decimal reduction time [D-value] of MNV-1 was 106 minutes)
whereas D-value of FCV was 50.6 minutes; however, HAV had significantly higher D-values
than both MNV-1 and FCV at 50 and 60 °C with 385 and 74.6 minutes, respectively, suggesting
that HAV was more resistant to thermal inactivation than both MNV-1 or FCV, with MNV-1
being moderately resistant and FCV being the least resistant (Gibson & Schwab, 2011). The
survivability of FCV was dependent on the type of fomite used, with the surrogate virus
surviving on the surfaces of telephones for up to 3 days, computer mouse for 1 or 2 days, and
computer keyboards and brass for 8 to 12 hours (Clay et al., 2006).
A comparison of the inactivation profiles of MNV-1 and FCV was conducted to determine the
stability of the norovirus surrogate viruses upon exposure to pH, organic solvents, temperature
and environmental surface conditions (wet and dry conditions). MNV-1 was stable between pH
2 to 10, with <1 log reduction at pH 2, whereas FCV was inactivated at pH <3 and >9. Both
MNV-1 and FCV were inactivated at 63 and 72 °C, however FCV was more stable than MNV-1
at 56 °C. MNV-1 and FCV had shown long-term survival when both viruses were suspended in
a fecal matrix and inoculated onto a stainless steel surface at 4 °C; however, MNV-1 was more
stable than FCV at room temperature. Overall, MNV-1 was selected to be a more suitable
surrogate virus for human norovirus due to its ability to survive in gastric pH ranges and

10
environmental conditions (Cannon et al., 2006). A comparison of the temperature,
environmental and pH profiles of norovirus to other microorganisms from previous studies was
compiled (Table 1).
1.2.5 Norovirus Detection Methods
Human noroviruses do not grow in cell culture so a definitive diagnosis of viral infection was
initially accomplished by electron microscopy, an approach which proved to be relatively
insensitive and could not be used for detecting low concentrations of virions found in food and
water (Goodridge et al., 2004; Kapikian et al., 1972; Radford et al., 2004). Human challenge
studies were also conducted to identify and diagnose norovirus infections (Donaldson et al.,
2010). The use of enzyme linked immunosorbent assays (ELISA) for norovirus diagnosis is
likewise not effective due to the antigenic variability of the capsid protein of different strains and
its inherently lower sensitivity (Goodridge et al., 2004).
Currently, RT-PCR has become the standard for diagnosis of norovirus alone or as a component
of multiplex RT-PCR assays which have been used to allow simultaneous detection of
noroviruses, astroviruses and rotaviruses (Pang et al., 2005; Radford et al., 2004). However, a
problem with the RT-PCR approach is that the genomic diversity of strains would mean that it is
unlikely that a single primer pair would detect all strains over time, possibly leading to false
negative results during testing (Goodridge et al., 2004). Another limitation with RT-PCR is that
it does not indicate whether the virus is in its virulent, viable form, or if it is inactivated and
poses no threat to human health (Richards, 1999). Because RT-PCR cannot discriminate
between inactivated and infectious virus, false positives can occur; however, the detection of

11
inactivated virus poses no risk to public health but may lead to unnecessary environmental
disinfection and/or patient restrictions (Nuanualsuwan & Cliver, 2002; United States Food and
Drug Administration, 2012).
Because norovirus cannot be grown in cell culture, laboratories currently use either conventional
or real-time RT-PCR assays to rapidly detect and diagnose the virus in specimens and samples in
large numbers, especially during epidemics and endemic gastroenteritis (Duizer et al., 2004;
Mattison et al., 2009; Patel et al., 2009). In addition to detection, the genotype frequency
distribution or genotype profiles of norovirus strains derived from long-term norovirus strain
collection can be used to differentiate between foodborne outbreaks that are caused by food
contamination early in the food chain versus foodborne outbreaks that are caused by food
handlers contaminating the food (Verhoef et al., 2010). This type of differentiation can be
important to food safety authorities and public health institutions for estimating the number of
foodborne outbreaks originating from different sources (Verhoef et al., 2010).
RT-PCR and nucleotide sequence analysis have been useful and promising approaches in
molecular epidemiology studies to identify the source of infection and to differentiate between
outbreaks that have been incorrectly assumed to be connected (Patel et al., 2009). The methods
were used to sequence one or more regions of the virus genome through the use of primers by
targeting regions of ORF1 or ORF2 originating respectively from either the polymerase or capsid
(Gonin et al., 2000; Kageyama et al., 2003; Mattison et al., 2009; Vinjé et al., 2004). Because of
the diversity of norovirus genomes, one of the challenges pertaining to the RT-PCR assay is

12
finding the appropriate conserved sequences to use as PCR primers (Kageyama et al., 2003;
Kojima et al., 2002).
Previous studies have used the RNA-dependent RNA polymerase region for amplification
because it was believed to contain the most conserved nucleotide sequence in the norovirus
genome; however, in contrast to the RNA-dependent RNA polymerase, the capsid N/S domain at
the 5’ end of the ORF2 is highly conserved within genogroup I or II (of noroviruses) with over
80 % homology, whereas the ORF1-ORF2 junction region is the most conserved region of the
norovirus genome (Kageyama et al., 2003; Katayama et al., 2002; Kojima et al., 2002). The
major capsid protein (VP1) region D is now considered the reference genomic region for
genotyping genogroup I and genogroup II norovirus strains (Vinjé et al., 2004). Most
laboratories either sequence a small region of the polymerase (regions A and B) or the major
capsid (regions C or D) gene to genotype strains (Gonin et al., 2000; Kojima et al., 2002;
Mattison et al., 2009; Vinjé et al., 2003; Vinjé et al., 2004). In Europe, the FBVE network
conducts surveillance for norovirus outbreaks and genotypes strains using a fragment of the
RNA-dependent RNA polymerase at regions B, C and D (Verhoef et al., 2010).
Health Canada uses Kageyama primers (COG1F-COG1R) for the detection of genogroup I,
Kageyama primers (COG2F and COG2R) for the detection of genogroup II, Monroe primers
(431, 432, 433 and 434) for the detection of genogroups I and II, and Actin-A and Actin-R
primers for the detection of oyster actin mRNA from genogroups I and II (Table 2) (Health
Canada, 2010). The ORF1-ORF2 junction region showed that highly conserved nucleotide
sequences were located at nucleotide 5279 to 5381 (102 bases) for Norwalk/68 virus (M87661)

13
among norovirus genogroup I and nucleotide 4988 to 5108 (102 bases) for Camberwell virus
(AF145896) among norovirus genogroup II (Kageyama et al., 2003). The method was
performed using the Qiagen OneStep RT-PCR Kit (#210210 or 210212) (Health Canada, 2010).
The BCPHMRL (personal communication, April 5, 2011) currently uses Kageyama primers
(COG1F and COG1R) and fluorescent probes (RING1(a)-TP and RING1(b)-TP) to detect
norovirus genogroup I, and Kageyama primers (COG2F-COG2R) and fluorescent probe
(RING2-TP) to detect genogroup II (Kageyama et al., 2003).
Clinical laboratories participating in CaliciNet, the US Centers for Disease Control’s electronic
norovirus outbreak surveillance network, use region D for genotyping noroviruses (Centers for
Disease Control and Prevention, 2011c). Clinical diagnostic laboratories currently use real-time
RT-PCR derived from Kageyama et al. (2003) which had been modified into one-step and
duplex assays for high throughput screening and detection of genogroup I and II (Centers for
Disease Control and Prevention, 2011c; Pang et al., 2005; Trujillo et al., 2006).
1.2.6 Clinical Presentations of Norovirus Infections
The human norovirus infection incubation period is between 12 and 48 hours with clinical
symptoms being generally acute, and lasting between 1 to 2 days (Nuermberger, 2005; Radford
et al., 2004). Symptoms include nausea, severe vomiting (most commonly projectile vomiting),
watery diarrhea, abdominal cramps, headache, fever and general malaise (Hutson et al., 2004;
Nuermberger, 2005; Radford et al., 2004). Diarrhea is usually non-inflammatory and most
patients have no more than 3 to 4 watery stools per 24 hour period (Nuermberger, 2005).
14
Norovirus has been shown to be present in the stool by RT-PCR for up to 2 weeks and although
symptoms resolve, it is not clear if this virus continues to be infectious (Nuermberger, 2005).
Norovirus infection in the elderly or the immunocompromised can last longer and be more
severe, and in some cases, have a fatal outcome (Radford et al., 2004). There are reports stating
the potential for immunosuppressed patients to develop chronic disease from norovirus infection
(Radford et al., 2004). The elderly and the chronically ill with gastroenteritis are also vulnerable
to complications such as dehydration, electrolyte disturbances, and aspiration of vomitus (Wu et
al., 2005).
Mattner et al. (2006) carried out a study which focused on high risk groups and clinical
complications of norovirus infections. In particular, five outbreak wards, where 84 patients and
60 nurses were infected with the norovirus variant, Grimsby virus, were studied. Patients with
cardiovascular disease and renal transplant were at a 20 % greater risk for a fall in their
potassium, elderly patients aged 65 and older had increased diarrhea lasting more than 2 days,
and immunosuppression was a risk factor for creatinine increase of more than 10 %. Norovirus
infections in patients with underlying conditions, such as cardiovascular disease, renal transplant
and immunosuppressive therapy, may lead to severe consequences such as decreased potassium
levels, increased levels of C-reactive protein and creatine phosphokinase (Mattner et al., 2006).
It was concluded that such populations are at a higher risk of several clinical outcomes,
especially patients with cardiovascular disease, those receiving immunosuppressive therapy, the
elderly and organ transplant recipients. One study done in the 1970s by Schreiber et al. (1974)
investigated intestinal biopsies of six human volunteers who orally ingested stool filtrate
15
containing norovirus. The results showed volunteers exhibiting clinical gastroenteritis and the
biopsies showed intestinal mucosal lesions with altered mucosal architecture, inflammation and
abnormal absorptive cells.
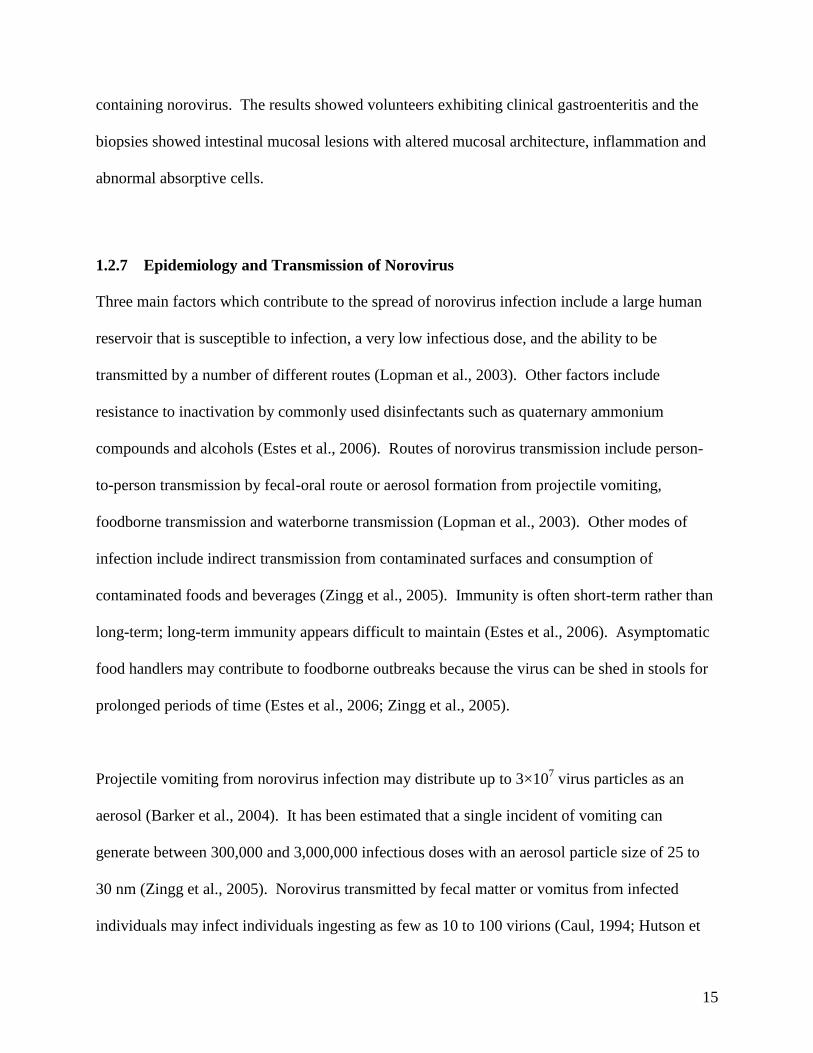
1.2.7 Epidemiology and Transmission of Norovirus
Three main factors which contribute to the spread of norovirus infection include a large human
reservoir that is susceptible to infection, a very low infectious dose, and the ability to be
transmitted by a number of different routes (Lopman et al., 2003). Other factors include
resistance to inactivation by commonly used disinfectants such as quaternary ammonium
compounds and alcohols (Estes et al., 2006). Routes of norovirus transmission include person-
to-person transmission by fecal-oral route or aerosol formation from projectile vomiting,
foodborne transmission and waterborne transmission (Lopman et al., 2003). Other modes of
infection include indirect transmission from contaminated surfaces and consumption of
contaminated foods and beverages (Zingg et al., 2005). Immunity is often short-term rather than
long-term; long-term immunity appears difficult to maintain (Estes et al., 2006). Asymptomatic
food handlers may contribute to foodborne outbreaks because the virus can be shed in stools for
prolonged periods of time (Estes et al., 2006; Zingg et al., 2005).
Projectile vomiting from norovirus infection may distribute up to 3×10⁷ virus particles as an
aerosol (Barker et al., 2004). It has been estimated that a single incident of vomiting can
generate between 300,000 and 3,000,000 infectious doses with an aerosol particle size of 25 to
30 nm (Zingg et al., 2005). Norovirus transmitted by fecal matter or vomitus from infected
individuals may infect individuals ingesting as few as 10 to 100 virions (Caul, 1994; Hutson et

16
al., 2004). An analysis of outbreaks from cruise ships demonstrated person-to-person
transmission by showing that passengers were infected with the causative strain of norovirus
even though they did not consume any contaminated food or drink (Nuermberger, 2005).
Consumption of norovirus-contaminated food is a significant mode of transmission for norovirus
(Lopman et al., 2003, Zingg et al., 2005). Foods which serve as a vehicle of norovirus infection
include oysters, salad vegetables, poultry, red meat, deli meats, fruit, soups, desserts and snacks
(Lopman et al., 2003). In particular, consumption of raw and undercooked shellfish such as
oysters has often been associated with outbreaks of gastroenteritis because shellfish are filter
feeders capable of obtaining food, such as algae, by filtering small particles from the surrounding
water and in some cases, they concentrate viruses and human pathogens derived from
contaminated sewage water (Cheng et al., 2005; Lees, 2000).
Viruses documented to have been transmitted by the fecal-oral route associated with the
consumption of bivalve shellfish include caliciviruses, astroviruses, rotaviruses, adenoviruses,
enteroviruses and hepatitis A virus (HAV) (Lees, 2000). Other outbreaks associated with
contaminated bivalve molluscan shellfish such as mussels, cockles, oysters and clams have also
been documented (Lees, 2000; Tian et al., 2007). Oysters become contaminated with norovirus
through bioaccumulation by the intestinal type A-like histo-blood group antigen (HBGA) (Tian
et al., 2007). Three oyster species studied by Tian et al. (2007) expressed type A and type O-like
HBGA in their gastrointestinal tissue, whereas mussels and clams were also found with similar
type A-like antigens, and some only with O-like antigens. Multiple HBGAs are expressed in the
gastrointestinal tissues of oysters, mussels and clams, allowing binding and bioaccumulation of

17
norovirus to occur in these bivalve molluscan shellfish (Tian et al., 2007). The survival of FCV
as a surrogate for norovirus in foods and on surfaces was investigated using plaque assay;
infectious virus can survive in foods such as lettuce and ham, and on surfaces of stainless steel
for up to 7 days (Mattison et al., 2007).
1.2.8 Norovirus Outbreaks
The CDC confirmed that 660 norovirus outbreaks occurred between 1994 and 2006 in the United
States (Centers for Disease Control and Prevention, 2011c). Of the 660 laboratory-confirmed
norovirus outbreaks, 35.4 % originated from long-term care facilities, 31.1 % from restaurants,
parties and events, 20.5 % from cruise ships and vacations, and 13.0 % were from schools, child
care and communities (Centers for Disease Control and Prevention, 2011c). The CDC also
reported 1097 foodborne outbreaks in the United States during 2007, and within those outbreaks,
there were 21,244 cases of foodborne illness and 18 deaths (Centers for Disease Control and
Prevention, 2010). Of the 1097 foodborne outbreaks, 497 outbreaks (12,767 illnesses) were
laboratory-confirmed with the etiologic agent identified; norovirus was the most common cause
of foodborne outbreaks, followed by Salmonella (Centers for Disease Control and Prevention,
2010). Norovirus accounted for 193 outbreaks (39 %) out of the 497 laboratory-confirmed
outbreaks (Centers for Disease Control and Prevention, 2010). In 2010, the National Enteric
Surveillance Program of Canada reported 388 out of 3623 norovirus serotypes were found in
British Columbia (Public Health Agency of Canada, 2010). Although norovirus transmission
may occur year-round, norovirus outbreaks peaked during the winter months of the year in the
northern hemisphere, especially in health-care institutions such as hospitals and residential
homes (Lopman et al., 2003; Mounts et al., 2000).

18
Norovirus has been the main cause of outbreaks in cruise ships, hospitals and hotels (Hota,
2004). Outbreaks in cruise ships have occurred on consecutive cruises despite attempts to
disinfect and sanitize the ships between cruises (Hota, 2004). For ships that have been affected
by outbreaks, discontinuation of services followed by vigorous and aggressive cleaning and
sanitation of the vessels was required to stop the outbreaks (Hota, 2004).
Of the norovirus outbreaks from 1992 and 2000 in England and Wales, 40 % occurred in
hospitals and 39 % occurred in residential-care facilities (Lopman et al., 2003). Norovirus
infection which centred on elderly care and geriatric units occurred in 39 % of hospital outbreaks
and 89 % of residential home outbreaks (Lopman et al., 2003). Hotels accounted for 7.8 % of
outbreaks, 4 % occurred in schools, 6 % were linked to food outlets, and 3.9 % occurred in other
settings such as private homes, holiday camps and military bases (Lopman et al., 2003).
In particular, residential-care facilities and hospitals facilitate the movement of viruses within the
institutions because health care settings are semi-closed environments where patients and
residents may experience person-to-person spread as well as being exposed to contaminated
environments (Lopman et al., 2003). Norovirus outbreaks in health care settings are common
and may affect vulnerable populations (Lopman et al., 2004). Hospitalized patients in health
care facilities having norovirus infections may experience more severe outcomes and an
increased duration of illness than other groups in the community (Lopman et al., 2004).
Calderon-Margalit et al. (2005) investigated six nursing homes in the Tel-Aviv district of Israel
for three weeks in 2002 and found person-to-person transmission to be involved but social

19
interaction was not attributed to the spread of the virus. Most of the nursing home residents were
bedridden which suggested that the transmission of norovirus was from staff members to
residents, possibly by direct contact (Calderon-Margalit et al., 2005). It was noted that the staff
had encountered the virus either by direct contact from vomitus or feces or by indirect contact
from contaminated surfaces (Calderon-Margalit et al., 2005).
Another study focused on the impact of hospital resources in norovirus outbreaks and found that
attack rates were 13.9 % among patients and 29.5 % were among healthcare workers (Zingg et
al., 2005). The financial impact of the outbreak on hospital resources, which comprised lost
revenue, extra costs for diagnosis, increased nurse’s care, and expenses for the infection control
team, totalled $40,675 USD (Zingg et al., 2005).
Norovirus infections have also occurred from the consumption of ready-to-eat meat prepared by
infected food handlers (Malek et al., 2009). In 2005, a norovirus outbreak occurred among river
rafters on trips on the Colorado River (Grand Canyon) (Malek et al., 2009). Of the 57 rafters
who became ill at ≤72 hours after the rafting trip began, 96 % reported eating delicatessen meat
originating from one batch purchased from one processing plant. The employee of the
processing plant had sliced this batch with bare hands 1 day after recovering from gastroenteritis.
Infected food handlers can contaminate ready-to-eat foods with norovirus during processing and
handling, and it is important to include specific measures in meat-processing practices to prevent
contamination and widespread outbreaks (Malek et al., 2009).

20
There has been a sharp increase in norovirus outbreaks on cruise ships in the United States
(Widdowson et al., 2004; Wikswo et al., 2011). In 2002, there were 14 laboratory-confirmed
norovirus outbreaks on cruise ships of which 12 of the 14 (86 %) outbreaks were caused by
caliciviruses (Widdowson et al., 2004). Eleven of the outbreaks were caused by noroviruses
(Widdowson et al., 2004). Another study on a norovirus outbreak in a cruise ship has indicated
that the outbreak affected passengers from two consecutive cruises and later continued on four
following cruises despite a one week of sanitizing of the same ship (Isakbaeva, 2005).
Epidemiological analysis suggests that an initial foodborne source of infection followed by
secondary person-to-person transmission may have been the cause of the outbreak (Isakbaeva,
2005). Environmental contamination may have helped perpetrate the outbreak and infected crew
members may have also contributed by being a reservoir of norovirus infection between cruises
(Isakbaeva, 2005).
Over the past five years, an average of 27 norovirus outbreaks had been confirmed in cruise
ships in the United States. In 2009, a norovirus outbreak on a cruise ship prompted an
investigation, where it was found that person-to-person transmission (involving an incident of
public vomiting) likely caused this high morbidity outbreak. A questionnaire was conducted in
the retrospective cohort study on the cruise ship where the norovirus outbreak occurred. Of the
1842 passengers, 83.2 % returned the questionnaire; the results revealed that over 90 % of all
passengers reported increased hand hygiene practices after becoming aware of the outbreak, and
38 % of ill passengers and 11 % of well passengers decreased their participation in public
activities. The number of ill passengers who decreased their activities was low, indicating the
21
need to encourage voluntary self-isolation for those who become ill and to report their illness to
ship personnel (Wikswo et al., 2011).
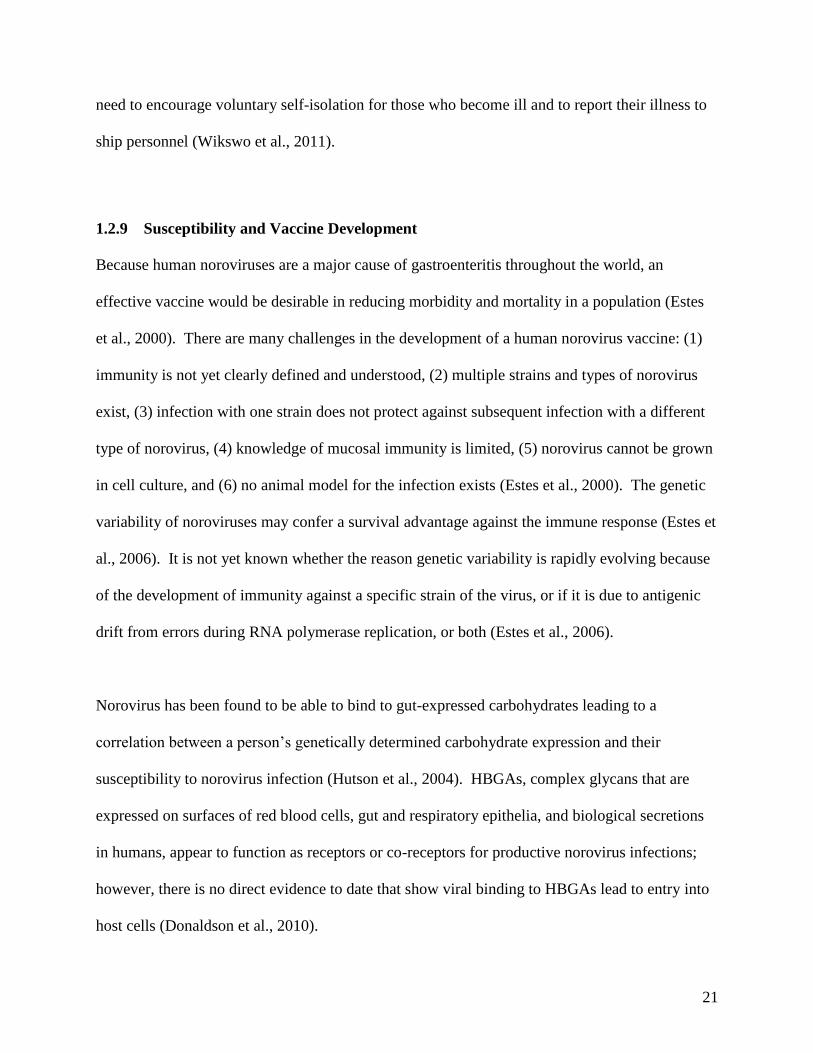
1.2.9 Susceptibility and Vaccine Development
Because human noroviruses are a major cause of gastroenteritis throughout the world, an
effective vaccine would be desirable in reducing morbidity and mortality in a population (Estes
et al., 2000). There are many challenges in the development of a human norovirus vaccine: (1)
immunity is not yet clearly defined and understood, (2) multiple strains and types of norovirus
exist, (3) infection with one strain does not protect against subsequent infection with a different
type of norovirus, (4) knowledge of mucosal immunity is limited, (5) norovirus cannot be grown
in cell culture, and (6) no animal model for the infection exists (Estes et al., 2000). The genetic
variability of noroviruses may confer a survival advantage against the immune response (Estes et
al., 2006). It is not yet known whether the reason genetic variability is rapidly evolving because
of the development of immunity against a specific strain of the virus, or if it is due to antigenic
drift from errors during RNA polymerase replication, or both (Estes et al., 2006).
Norovirus has been found to be able to bind to gut-expressed carbohydrates leading to a
correlation between a person’s genetically determined carbohydrate expression and their
susceptibility to norovirus infection (Hutson et al., 2004). HBGAs, complex glycans that are
expressed on surfaces of red blood cells, gut and respiratory epithelia, and biological secretions
in humans, appear to function as receptors or co-receptors for productive norovirus infections;
however, there is no direct evidence to date that show viral binding to HBGAs lead to entry into
host cells (Donaldson et al., 2010).

22
Hutson et al. (2002) reported on the relationship between an individual’s ABO histo-blood group
type and the risk of norovirus infection and symptomatic disease after viral challenge by
analysing serum samples from volunteers. Individuals with the group O phenotype were more
likely to become infected with norovirus and symptomatic disease than individuals with the
group B HBGA (Hutson et al., 2002). Individuals with blood group O are more susceptible to
GI.1-NV infection than individuals with other blood groups (Donaldson et al., 2010). GI.1-NV
binds to gastroduodenal epithelial cells from secretor-positive individuals, whereas the virus-like
particle (VLP) did not bind to the cells of secretor-negative individuals (Donaldson et al., 2010).
One study found that blood group and an individual’s secretor status did not strongly correlate
with susceptibility to viral infection; however, another study showed that secretor-negative
individuals have lower antibody titer to GII.4 strains than secretor-positive individuals,
suggesting that non-secretors are less likely to be infected than secretors (Donaldson et al., 2010;
Marionneau et al., 2002; Thorven et al., 2005). These studies show that although norovirus
strains may only infect a subset of the human population, the variability and the complexity of
HBGA-binding affinities may cause nearly all individuals to be more susceptible to one or more
strains (Donaldson et al., 2010). Norovirus strains have highly variable HBGA-binding patterns
and as such, evolution of strains may be influenced by HBGA binding (Donaldson et al., 2010).
Short-term immunity (for up to 14 weeks) has been observed in previous volunteer challenge
studies but this immunity did not extend to distinct antigenic strains of genetic clusters of
norovirus, as volunteers from a virus challenge study who became ill with norovirus also became
ill with another strain, Hawaii virus, at the same rate as volunteers who were not previously
infected with norovirus (Matsui & Greenberg, 2000; Wyatt et al., 1974). Generally, short-term

23
immunity lasts between 6 and 14 weeks, and long-term immunity lasts between 9 and 15 months
(Estes et al., 2000).
Previous rechallenge studies had shown that of all the volunteers who had been infected with
norovirus and rechallenged with the same virus 27 to 42 months later, half of them became ill
again with gastroenteritis with jejunal lesions, whereas the other half who were previously
immune remained immune again with no jejunal lesions (Parrino et al., 1977).
An effective norovirus vaccine would be ideal for specific people in the population such as food
handlers, care providers and military personnel (Lindesmith et al., 2005). However, there are
many obstacles for norovirus vaccine development because of the large degree of antigenic
heterogeneity and the rapid evolution of viruses within the family (Lindesmith et al., 2005).
Also, there is a possibility that immunity against norovirus may be short-lived due to the
variability and the growing list of norovirus strains (Goodridge et al., 2004; Lindesmith et al.,
2005). Norovirus strains that are within a genetic cluster generally show ≥ 80 % amino acid
identity in the major capsid protein sequence, strains within the same genogroup show ≥ 60 %
identity, and strains that are in different genogroups show ≤ 50 % identity (Lindesmith et al.,
2005). Because of the high degree of genetic variability, there is a high degree of antigenic
variability within noroviruses (Lindesmith et al., 2005).
A recent study by Atmar et al. (2011) was conducted to determine the safety, immunogenicity
and effectiveness of an investigational norovirus VLP vaccine containing chitosan and
monophosphoryl lipid A as adjuvants and delivered intranasally to healthy adult volunteers.

24
Ninety-eight adult volunteers were enrolled in the study and randomly selected to receive two
doses of either the vaccine or placebo, followed by inoculation with norovirus and monitored for
viral infection and gastroenteritis symptoms. Of those vaccinated, 70 % had an IgA response.
Results showed that frequency of gastroenteritis was 69 % for placebo recipients versus 37 % for
vaccine recipients, and frequency of norovirus infection was 82 % for placebo recipients versus
61 % for vaccine recipients, suggesting that norovirus vaccination had significantly reduced the
frequency of gastroenteritis and virus infection and is capable of providing protection against
norovirus illness and infection (Atmar et al., 2011).
1.3 Prevention Strategies
1.3.1 Infection Control and Outbreak Prevention
There are several measures that can be taken to minimize the spread of norovirus. Because viral
particles can resist exposure including moderate heat, chlorine and freezing temperatures, to
prevent secondary transmission of norovirus infection on cruise ship settings, careful attention
must be put into infection control procedures including hand hygiene, barrier precautions such as
gloves, and proper disposal and/or sterilization of materials that have been contaminated with the
virus (Nuermberger, 2005). In addition, disinfection processes must include concentrated
chlorine solutions, phenol-based compounds or accelerated hydrogen peroxide products
(Nuermberger, 2005). Routine cleaning and disinfection of frequently touched environmental
surfaces, equipment and clinical areas should be performed (MacCannell et al., 2011).
Environmental surfaces that are frequently touched include toilets, faucets, hand and bed
railings, telephones, door handles, computer equipment such as keyboards, and kitchen
preparation surfaces (MacCannell et al., 2011).

25
Barker et al. (2004) recommended that to achieve good hygiene, it is important that surfaces be
wiped clean using a cloth soaked in detergent before applying a combined hypochlorite solution
or detergent. Fingers contaminated with norovirus from fecal material could transfer the virus to
up to seven clean surfaces. Despite using detergents and disinfectants, it has been shown that
detergent-based cleaning with a cloth, even with a second wipe step, to produce a visibly clean
surface failed to eliminate norovirus contamination, especially on surfaces contaminated with
fecal soiling where norovirus could still be detected on 28 % of surfaces, even with a combined
hypochlorite or detergent formulation of 5000 ppm of available chlorine present (Barker et al.,
2004).
Detergent-based cleaning alone or with a combined hypochlorite or detergent solution is not
enough to eliminate norovirus contamination from surfaces and if the cleaning cloth is used to
wipe another surface, viral transfer could occur from the cloth to another surface or to the hands
of another person handling the cloth (Barker et al., 2004). For secondary contact surfaces that
have become contaminated with norovirus either by transfer from hands or cloth, and where
organic soiling is minimal, disinfection with bleach is sufficient to decontaminate surfaces and
prevent the transfer of virus (Barker et al., 2004).
To maintain good hand hygiene during outbreaks, soap and water should be used after having
contact with or providing care to patients with suspected or confirmed cases of norovirus
(MacCannell et al., 2011). Food handlers must perform good hand hygiene practices before
contact with or during preparation of foods and beverages (MacCannell et al., 2011).

26
The CDC recommends avoiding exposure to bodily fluids such as vomitus and diarrhea from
infected individuals during gastroenteritis outbreaks in healthcare settings (Centers for Disease
Control and Prevention, 2011b). Patients infected with norovirus should go through longer
periods of isolation and avoid contact with others for a minimum of 48 hours after symptoms
resolve to prevent further exposure to other patients susceptible to the virus (Centers for Disease
Control and Prevention, 2011b). Hand hygiene is recommended through the use of soap and
clean water or ethanol-based hand sanitizers (60-95 % alcohol), and should be actively promoted
among healthcare personnel, patients and visitors in patient care areas (Centers for Disease
Control and Prevention, 2011b). Personal protective equipment (PPE) such as gowns and gloves
are recommended when entering patient care areas to reduce exposure to vomitus or fecal matter
(Centers for Disease Control and Prevention, 2011b). To avoid exposure and anticipated
splashes from patients who are vomiting, eye protection or a full face shield is recommended
(Centers for Disease Control and Prevention, 2011b). Soiled linens should be handed carefully
as agitating them may allow the virus to be dispersed (MacCannell et al., 2011). Routine
cleaning of frequently contaminated environmental surfaces and equipment such as commodes,
toilets, faucets, sinks, hand and bed-railings, telephones, door handles, computer equipment and
kitchen preparation areas is also recommended (Centers for Disease Control and Prevention,
2011b). The CDC recommends that chlorine bleach or United States Environmental Protection
Agency (EPA)-approved products be used to clean and disinfect contaminated surfaces of patient
care areas frequently, as much as twice daily to maintain cleanliness, and to clean and disinfect
frequently touched environmental surfaces three times per day using EPA-approved products in
healthcare settings (Centers for Disease Control and Prevention, 2011b; Centers for Disease
Control and Prevention, 2011c). When using chlorine bleach solutions, the CDC recommends
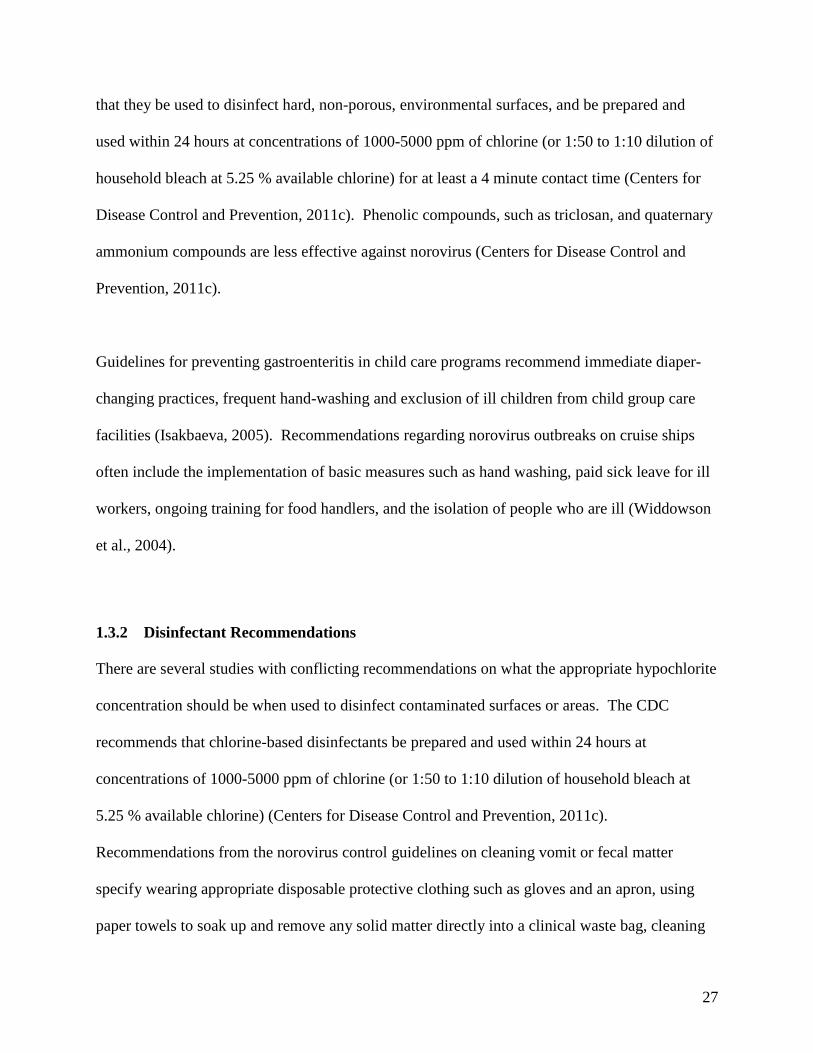
27
that they be used to disinfect hard, non-porous, environmental surfaces, and be prepared and
used within 24 hours at concentrations of 1000-5000 ppm of chlorine (or 1:50 to 1:10 dilution of
household bleach at 5.25 % available chlorine) for at least a 4 minute contact time (Centers for
Disease Control and Prevention, 2011c). Phenolic compounds, such as triclosan, and quaternary
ammonium compounds are less effective against norovirus (Centers for Disease Control and
Prevention, 2011c).
Guidelines for preventing gastroenteritis in child care programs recommend immediate diaper-
changing practices, frequent hand-washing and exclusion of ill children from child group care
facilities (Isakbaeva, 2005). Recommendations regarding norovirus outbreaks on cruise ships
often include the implementation of basic measures such as hand washing, paid sick leave for ill
workers, ongoing training for food handlers, and the isolation of people who are ill (Widdowson
et al., 2004).
1.3.2 Disinfectant Recommendations
There are several studies with conflicting recommendations on what the appropriate hypochlorite
concentration should be when used to disinfect contaminated surfaces or areas. The CDC
recommends that chlorine-based disinfectants be prepared and used within 24 hours at
concentrations of 1000-5000 ppm of chlorine (or 1:50 to 1:10 dilution of household bleach at
5.25 % available chlorine) (Centers for Disease Control and Prevention, 2011c).
Recommendations from the norovirus control guidelines on cleaning vomit or fecal matter
specify wearing appropriate disposable protective clothing such as gloves and an apron, using
paper towels to soak up and remove any solid matter directly into a clinical waste bag, cleaning

28
the contaminated area with detergent and hot water using a disposable cloth, disinfecting the
contaminated area with 1000 ppm (0.1 %) hypochlorite solution, disposing the protective
materials such as gloves and cloths into the clinical waste bag, and lastly washing hands
thoroughly with soap and water (Chadwick et al, 2000). Barker et al. (2004) recommended that
in order to achieve good hygiene, surfaces should be wiped clean using a cloth soaked with
detergent before applying a hypochlorite solution. Hota (2004) has indicated that the
decontamination of viruses requires 10 % sodium hypochlorite solution (household bleach) or
another biocide. In addition to using a germicidal product such as a 10 % sodium hypochlorite
solution (household bleach) for decontaminating areas affected with outbreaks, the closure of the
affected institution or facility may also be required (Hota, 2004).
It is unknown at this time if alcohol-based hand sanitizers are effective against human norovirus
(Centers for Disease Control and Prevention, 2011c). A finger pad method used for studying the
effectiveness of liquid soap and hand sanitizers on norovirus showed that liquid soap (0.67 to
1.20 log10 reduction) was more effective than alcohol-based hand sanitizers containing 62 %
ethyl alcohol (0.14 to 0.34 log10 reduction) in reducing norovirus contamination on human hands
(Liu et al., 2010). However, one limitation to the study by Liu et al. (2010) was that real-time
RT-qPCR was used to determine the viral titer and log10 reduction of genomic copies of
norovirus cDNA, even though RT-PCR is unable to differentiate between infectious and non-
infectious virus (Baert et al., 2008). More research is needed to evaluate the efficacy of alcohol-
based hand sanitizers against human or surrogates of human norovirus (MacCannell et al., 2011).
At this time, it is recommended that ethanol-based hand sanitizers between 60 and 95 % ethanol

29
be used instead of other alcohol or non-alcohol-based hand sanitizers during outbreaks (Centers
for Disease Control and Prevention, 2011b; MacCannell et al., 2011).
1.4 Surrogate Viruses of Human Norovirus: MNV-1 and FCV
One of the major problems with human noroviruses is that they do not grow in cell or organ
cultures and to date, there is still no small animal model available which has made it difficult to
study norovirus infection and gastroenteritis, and has made it difficult to study the efficacy of
disinfectants (Ball et al., 1999; Hutson et al., 2004; Widdowson et al., 2004). Most knowledge
of the natural history and other basic pathophysiological information about norovirus infections
had been derived from outbreaks and volunteer studies (Hutson et al., 2004). Efforts to develop
a methodology to cultivate human noroviruses in the laboratory were unsuccessful (Duizer et al.,
2004). A recent study investigating the viral infection of a 3-dimensional (3D) model of the
intestinal epithelium using Caco-2 cells with human norovirus has shown promise in developing
an in vitro assay for human noroviruses; however, despite showing infection via shortening and
loss of apical microvilli, viral enumeration was determined using real-time RT-qPCR but not
plaque assay. Because plaque assay was not used in the study, viral RNA amplification may not
necessarily point to the production of infectious virus particles (Straub et al., 2011). As a result,
studies on norovirus persistence, inactivation and transmission have been limited to cultivable
surrogate viruses such as FCV and MNV-1 (Cannon et al., 2006).
MNV-1 and FCV are norovirus surrogate viruses from the Caliciviridae family that are often
used in experimental biomedical research for studying norovirus infection because of their ability
to replicate in cell culture and animals (Wobus et al., 2004).

30
1.4.1 Murine Norovirus (MNV-1)
MNV-1 was discovered in 2003; it was found to infect both wild-type and immunocompromised
mice after peroral and intranasal inoculation, and was later found to also infect a significant
number of laboratory mice nationwide (Wobus et al., 2004). MNV-1 is 28-35 nm in diameter, is
icosahedral and its buoyant density is 1.36 ± 0.04 g/cm3 (Wobus et al., 2004). MNV-1 has the
ability to infect the intestinal tract of mice through oral ingestion (Wobus et al., 2004). MNV-1
can also infect and grow in Kupffer cells (macrophages of the liver) and dendritic cells of mice
(Wobus et al., 2004). Wobus et al. (2004) observed that MNV-1 formed plaques on murine cell
line RAW 264.7 monolayers and showed for the first time that a norovirus can be cultivated in
vitro. Hsu et al. (2007) investigated and isolated three novel MNV strains: MNV-2, MNV-3 and
MNV-4. The three novel MNV strains differed from MNV-1 in pathogenicity because they
produced persistent tissue infections in experimentally inoculated immunocompetent mice,
whereas MNV-1 infection produced a transient infection which was typically cleared within the
first week after inoculation (Hsu et al., 2007).
Because MNV-1 can replicate in murine macrophages and dendritic cells, human norovirus had
been investigated to determine if it can also replicate in human macrophages and dendritic cells
(Lay et al., 2010). Macrophage and dendritic cells isolated from peripheral blood mononuclear
cells of individuals were exposed to norovirus, and analysed using immunofluorescence and
RT-qPCR (Lay et al., 2010). The results had demonstrated that human norovirus does not
replicate in human CD11c+ dendritic cells or monocyte-derived dendritic cells and macrophages
(Lay et al., 2010).

31
Detection of MNV-1 and FCV can be accomplished through RT-PCR directed to the
ORF1/ORF2 junction region or more commonly through the plaque assay (Baert et al., 2008;
Bidawid et al., 2003). The plaque assay is commonly used because this method enables
quantification of virus titers through enumeration of viral plaques when infected RAW 264.7
monolayers of cells are maintained under agarose (Wobus et al., 2004; Bidawid et al., 2003).
The RAW 264.7 macrophage mouse cell line was established from murine tumours induced by
Abelson leukemia virus which was capable of expressing properties of macrophages (Raschke et
al., 1978). In addition, the RAW 264.7 macrophage cell line was able to pinocytose neutral red
dye at 1 % (Raschke et al., 1978). New methods have been developed to detect MNV-1 although
it is unknown if these methods will be favoured over the conventional plaque assay. Molecular
beacons have been used for real-time monitoring of virus replication in living cells (Ganguli et
al., 2011). The TAT peptide-delivered molecular beacon method for detecting and enumerating
infective MNV-1 in RAW 264.7 cells was faster (by 12-fold) than the plaque assay (Ganguli et
al., 2011). Baert et al. (2008) investigated both real-time RT-PCR and plaque assay method, and
found that the quantification of genomic copies by real-time RT-PCR detected 100 times more
virus than PFU by plaque assay. This may have been because the plaque assay only detects
infectious virus while the RT-PCR detects viral RNA which may not be in an infectious virus
particle (Baert et al., 2008).
MNV-1 is an effective enteric pathogen that is virulent in immunocompromised mice and infects
wild-type mice (Wobus et al., 2004). Mice have been shown to shed infectious MNV-1 and
transmit the virus from mouse to mouse in a cage or from contaminated bedding to uninfected
mice (Wobus et al., 2004). Mice infected with the virus develop antibodies to MNV-1 within 3

32
to 4 weeks of exposure (Wobus et al., 2004). MNV-1 strains can be isolated from laboratory
mice feces or diarrhea (Wobus et al., 2004). The mouse virus, like the human norovirus strain,
can be transmitted through the fecal-oral route, although at this time, it is uncertain if it can
spread via the respiratory route, especially since the animals are not reported to experience
vomiting (Wobus et al., 2004). MNV-1 can be inactivated at temperatures higher than 60 °C
(Baert et al., 2008).
MNV-1 is classified under genogroup V, and shares biological and molecular properties with
other noroviruses and caliciviruses in general (Hsu et al., 2007; Wobus et al., 2004). In
particular, MNV-1 shares biochemical and genetic features with human noroviruses, more
specifically, its size, shape and buoyant density characteristics (Hsu et al., 2007; Karst, 2010).
Compared to human norovirus (genogroup I), the nucleotide identities of the full length genome,
after removing the gaps among humans and animal noroviruses, was at 52.4 %, demonstrating
that although MNV-1 and human norovirus are related, they are distinct (Hsu et al., 2007).
When MNV-1 was compared to MNV-2, MNV-3 and MNV-4, the related yet distinct strains of
murine noroviruses ranged from 87.4 % to 91.5 % in identity (Hsu et al., 2007). Comparing full-
length nucleotide sequences for human norovirus strains and bovine norovirus of genogroup III,
the MNV nucleotide sequences showed nucleotide identities ranging from 52.1 % to 54.4 %
(Hsu et al., 2007).
The genome contains 7382 nucleotides (Hsu et al., 2007). The RNA genome begins with a 5’
GU and ends with a poly-A tail (Hsu et al., 2007). Nucleotide position 33 of MNV-1 contains a
C nucleotide instead of a U nucleotide as identified in other MNV strains (Hsu et al., 2007).

33
MNV-1 genome has an ORF3 characteristic of noroviruses and vesiviruses, and two genera
within the Caliciviridae family (Wobus et al., 2004). ORF1 of MNV-1 encodes a 187.5-kDa
polyprotein containing 2C helicase, 3C protease and 3D polymerase motifs that are also found in
other caliciviruses and picornaviruses; ORF2 encodes a 58.9-kDa capsid protein capable of self-
assembling into virus-like particles when it is expressed in a baculovirus expression system,
similar to caliciviruses; and ORF3 encodes a 22.1-kDA protein (Hsu et al., 2007; Wobus et al.,
2004). ORF1 covers nucleotide positions 6 to 5069, ORF2 covers from 5056 to 6681, and ORF3
covers from 6681 to 7307. For ORF1, the first AUG start codon begins at nucleotide position 6
with the second AUG beginning at nucleotide position 12, and the stop codon terminates ORF1
at nucleotide position 5069. Between ORF1 and ORF2, there is a 14-nucleotide overlap,
creating a -2 frame shift of ORF2, and at the termination codon of ORF2 and the start codon of
ORF3, there is a single nucleotide overlap which places ORF3 back to the same reading frame as
ORF1. There is a 75 nucleotide 3’ untranslated region before the polyadenylated tail at the end
of ORF3 which contains a high A-U nucleotide content ranging from 66.7 to 69.7 % (Hsu et al.,
2007). Hsu et al. (2007) analysed the amino acid sequences of MNV-1 and found the
polyprotein encoded by ORF1 contained 1,687 amino acids, the capsid protein encoded by ORF2
contained 541 amino acids, and the small structural protein encoded by ORF3 contained 208
amino acids. When MNV strains were compared to each other, amino acid identities coded for
the polymerase gene ranged from 98.1 to 99.3%, and the capsid gene ranged from 94.4 to
98.3 %. When compared to human and bovine noroviruses, the amino acid identities coded for
the polymerase gene ranged from 51.3 to 54.7 %, and the capsid genes ranged from 37.8 to
41.3 %. When the four MNV strains were compared to each other, the amino acid identities for
the S domain ranged from 99.1 to 100 %, whereas the P domain ranged from 90.8 to 97.5 %.

34
When the MNV strains were compared to both human and bovine noroviruses, the amino acid
identities for the S domain ranged from 53.6 to 58.2 %, whereas the P domain was less
conserved and ranged from 25.4 to 32.8 %. Although the three novel murine noroviruses
(MNV-2, MNV-3 and MNV-4) are related to MNV-1, they demonstrated a different
pathogenicity from MNV-1, and are genetically distinct from MNV-1 and from one another, to
justify their classification as unique MNV strains (Hsu et al., 2007).
It has been confirmed that a subgenomic RNA is expressed during virus replication and analysis
via Northern blot from MNV-1-infected cells showed increasing amounts of subgenomic RNA
over time (Wobus et al., 2004). Nucleotide sequences are conserved at the 5’ end of the genome
to the region just upstream of ORF2 which suggests that structural proteins of ORF2 and ORF3
are expressed from subgenomic RNA (Hsu et al., 2007; Wobus et al., 2004). Analysis of
MNV-1-infected cells via electron microscopy showed changes in morphology including
extensive reorganization of the intracellular membrane and the loss of the intact Golgi apparatus
(Wobus et al., 2004). Observations show that norovirus replication may be associated with
intracellular membranes although more research is needed to confirm this observation (Wobus et
al., 2004).
1.4.2 Feline Calicivirus (FCV)
FCV was first isolated in tissue culture by Fastier (1957) and is present among cat populations
worldwide (Ormerod & Jarrett, 1978). The infection causes respiratory or systemic symptoms in
cats, as opposed to gastrointestinal disease observed in infections with the human norovirus
(Vashist et al., 2009). Infected cats can exhibit oral ulceration and/or mild upper respiratory

35
disease, in addition to the less commonly occurring symptoms such as limping, abortion and
severe pneumonia (Ossiboff et al., 2007; Pesavento et al., 2004). Infection in cats is not usually
fatal; however, virulent, systemic strains of FCV can cause alopecia, cutaneous ulcers,
subcutaneous edema and high mortality (Pesavento et al., 2004). Spontaneous virulent systemic
FCV (VS-FCV) infection may produce lesions in cats through infection resulting in extensive
facial and limb edema, ulcers on the skin, footpads, mouth, nares, tongue and pinnae, visceral
and internal organ systems including lungs, liver, pancreas, spleen, and lymph nodes (Pesavento
et al., 2004). Mature VS-FCV virus particles, which can be found within the cytoplasm of cell
cultures, were unexpectedly discovered within the nuclei of epithelial cells (Pesavento et al.,
2004). Although it is unclear at the moment, there is a possibility that physiologic breakdown of
the nuclear envelope could be happening or that viral replication could be taking place within the
nucleus; however, cells with virus present within their nucleus had no detectable cytoplasmic
virus (Pesavento et al., 2004).
The rapid spread of FCV may be attributed to transmission through fomites and in small cat
populations (Hurley et al., 2004; Ossiboff et al., 2007; Radford et al., 2006). Genetic diversity of
FCV strains may be attributed to molecular substitution of immune-mediated positive selection
and through endemically infected groups of cats which may allow new strains to evolve (Coyne
et al., 2006; Radford et al., 2006). Shedding of FCV within cat colonies falls under three
characteristics: persistent shedders, intermittent shedders and those resistant to infection
(Radford et al., 2006). Shedding of the virus may occur as a result of persistent infection or by
reinfection (Radford et al., 2006).

36
Several vaccines are currently being used to vaccinate and protect cats against FCV, with
vaccines being modified live, inactivated adjuvanted or inactivated non-adjuvanted. Intranasal
vaccines are also available for cats in the United States. FCV vaccines are safe to use and have
been shown to effectively reduce clinical disease in the cat population. Several different types of
FCV strains have been selected for use in vaccines because of their broad cross-reactivity;
however, most vaccines used are based on one strain, in particular, the FCV F9 or FCV 255
strain. One important limitation with FCV vaccines is that it does not protect against infection
and it is possible that vaccinated cats may become infected with field strains without exhibiting
any clinical signs or symptoms (Radford et al., 2006).
A comparison of amino acid sequences between FCV field isolates from Japan and global
isolates revealed that FCV strains generally fall into two distinct groups: genogroup I and II
(Sato et al., 2002). Genogroup I included 33 % of Japanese strains and most of the global
isolates, and may be considered genetically identical; however, genogroup II was comprised of
67 % of Japanese isolates and no global isolates, indicating that the Japanese lineage is only
confined to Japan (Ossiboff et al., 2007; Sato et al., 2002). Recombination of FCV is possible in
cats infected with more than one strain of virus at the same time, with the recombinant virus
containing elements of both strains circulating in the infected cats (Coyne et al., 2006).
The in vitro growth properties of various FCV isolates such as FCV F9 (vaccine strain), VS-FCV
and non-VS-FCV clinical isolates were investigated, and the results showed that the growth
kinetics of the FCV isolates differing in virulence share common properties such as rapid growth
during a single round of virus replication, but may differ in virus production. Virulent FCV

37
isolates tend to produce larger plaques and grow faster than less virulent isolates. VS-FCV
isolates produced earlier morphological changes at 14 hours post-infection including rounding up
and detaching partially or fully from the plate surface, whereas morphological alterations were
not present in cell cultures with most non-VS isolates, suggesting that cytopathic effects may be
correlated with virulence. Thermal resistance varied among all FCV isolates tested, with all
FCV isolates losing substantial infectivity following 30 minutes incubation at 46.2 °C; however,
the FCV F9 vaccine strain was most sensitive to thermal inactivation, losing all infectivity
following a 30 minute incubation period at 52.2 °C. Other isolates were completely inactivated
at 56.9 °C except for the FCV-5 strain which was inactivated only at 62 °C. Environmental
stability at room temperature after 3 days varied among all FCV isolates, with most isolates
losing 2-5 log10 infectivity, two VS-FCV isolates (Deuce and FCV-5) losing 2-3 log10 infectivity,
and FCV F9 strain losing infectivity by 4-5 log10. None of the FCV isolates lost infectivity after
8 weeks at -80 °C. There was no correlation between virulence and temperature inactivation for
the isolates tested (Ossiboff et al., 2007). Even though the F9 vaccine strain has been used
extensively to investigate the sensitivities and environmental inactivation of caliciviruses, FCV
field strains may be more resistant to temperature inactivation than the F9 strain (Duizer et al.,
2004; Ossiboff et al., 2007).
Because FCV has shown good growth in vitro, it has been used as a surrogate virus for human
norovirus studies (Vashist et al., 2009). The plaque assay method using feline embryo-derived
cells has been used for FCV studies because virus plaque formation in agarose does not show
inhibition and can produce clear, cytopathic effects (Bidawid et al., 2003; Ormerod & Jarrett,
1978). The tissue culture infectious dose (TCID50) method has also been used to quantify the

38
infectivity of FCV using Crandell Reese feline kidney cells (CRFK) as the established cell line
(Doultree et al., 1999; Bidawid et al., 2003).
FCV isolates may vary in terms of serum cross-neutralization and amino acid sequence in the
capsid protein, in addition to plaque morphology (Ormerod & Jarrett, 1978; Seal et al., 1993).
Seal et al. (1993) analysed three FCV isolates, NADC, KCD and CFI/68, and found the capsid
protein amino acid sequences to have 89 to 91 % similarity, while nucleotide sequence data
showed genetic variability among the three isolates (Seal et al., 1993). The amino acid
sequences showed two regions of sequence divergence with variation as much as 55 %, which
suggests that polyvalent vaccines may offer more protection than monovalent vaccines (Seal et
al., 1993). The mechanism behind FCV infection of CRFK cells is unclear; however, it involves
a low pH-dependent step (Kreutz & Seal, 1995). Chloroquine, a lysosomotropic agent involved
in the prevention of replication of non-enveloped viruses through acidification of intracellular
vesicles, inhibited the production of FCV in the initial stages of viral adsorption and replication
but had no effect when the agent was added 3-4 hours post-infection, suggesting that FCV enters
cells through receptor-mediated endocytosis and requires a low pH-dependent viral uncoating
step (Kreutz & Seal, 1995).
The FCV genome contains four single-stranded RNAs of 8.2, 4.8, 4.2 and 2.4 kb (Neill &
Mengeling, 1988). The genome of FCV strain F9 is 7690 bases long and contains two large
ORFs (Carter et al., 1992). FCV encodes non-structural proteins at ORF1 from the 5’ end of the
RNA and capsid proteins from ORF2 at the 3’ end (Carter et al., 1992). ORF1 extends from
positions 2 and 5308, and has the first ATG codon occurring at position 20 (Carter et al., 1992).

39
ORF2 extends from positions 5314 and 7326, and specifies a 671 amino acid protein (Carter et
al., 1992). A short ORF3 of 318 bases at the 3’ end of the virus RNA extends from positions
7326 and 7643, and specifies a 106 amino acid protein (Carter et al., 1992). Analysis via
Northern blotting indicates that viral RNAs are nested, co-terminal transcripts with common 3’
ends, with the transcript beginning at specific points and continuing to the 3’ end of the FCV
genome (Neill & Mengeling, 1988). The 2.4 kb subgenomic RNA encodes the single capsid
protein and contains 2 ORFs (Neill et al., 1991). The larger ORF from the 5’ end of the
subgenomic mRNA consists of 2004 bases and encodes a polypeptide with a mass of 73,467 Da
(Neill et al., 1991). The smaller ORF located in the 3’ end of the mRNA is made up of 318 bases
and encodes a polypeptide with a mass of 12,185 Da (Neill et al., 1991). The UGA termination
codon of the larger ORF overlaps with the AUG initiation codon of the smaller ORF and
resembles the -1 frameshift sequences such as that seen in retroviruses or coronaviruses (Neill et
al., 1991). Western immunoblot analysis using feline anti-FCV antiserum revealed that
translation of the capsid protein was detectable at 3 to 8 hours post-infection (Neill et al., 1991).
Some strains of low virulence FCV produced large amounts of defective low density virus
particles known as defective interfering particles, while more virulent strains produced few to no
defective virus particles. RNA of 2.4 kb isolated from low density virus particles encodes the
capsid protein. The 5’ end, mapped via primer extension, had the same genomic location as that
of intracellular 2.4 kb RNA. Lower density viral particles had a density of 1.35 g/cm3 whereas
the infectious wild-type virus particle had a density of 1.39 g/cm3, suggesting that lower density
particles contain FCV subgenomic RNA instead of a genomic RNA containing rearrangements
or deletions. It is not understood how or why lower density particles interfere with viral
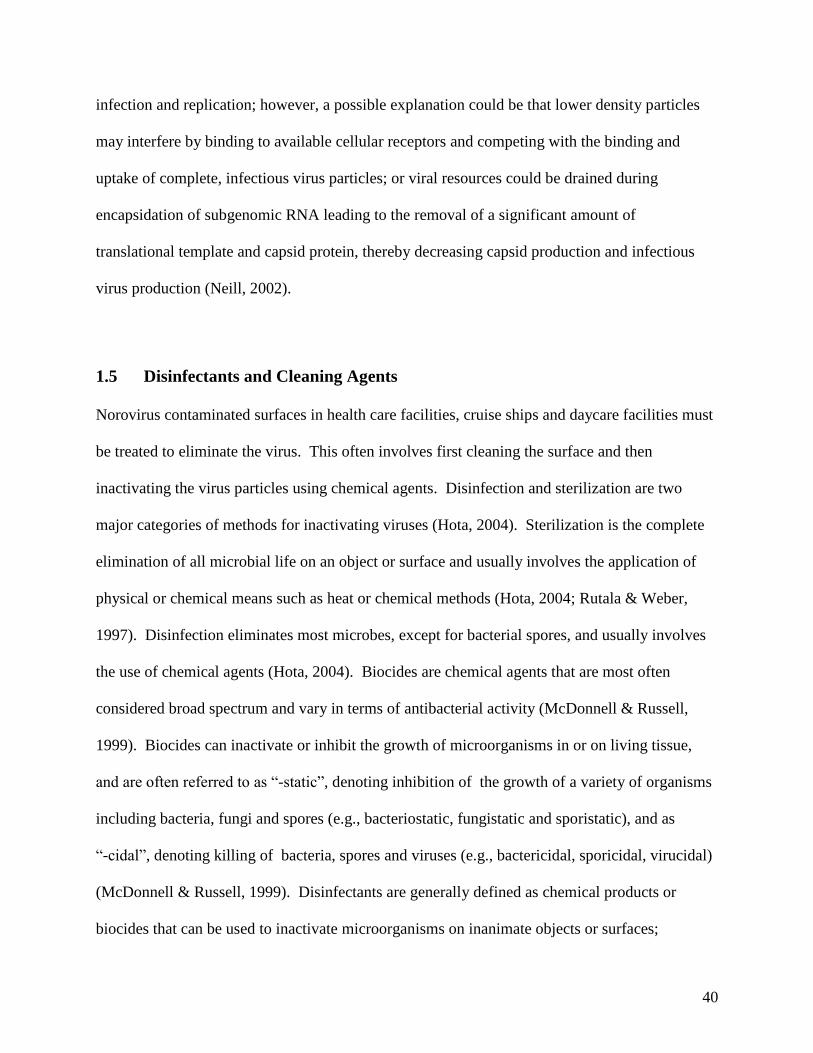
40
infection and replication; however, a possible explanation could be that lower density particles
may interfere by binding to available cellular receptors and competing with the binding and
uptake of complete, infectious virus particles; or viral resources could be drained during
encapsidation of subgenomic RNA leading to the removal of a significant amount of
translational template and capsid protein, thereby decreasing capsid production and infectious
virus production (Neill, 2002).
1.5 Disinfectants and Cleaning Agents
Norovirus contaminated surfaces in health care facilities, cruise ships and daycare facilities must
be treated to eliminate the virus. This often involves first cleaning the surface and then
inactivating the virus particles using chemical agents. Disinfection and sterilization are two
major categories of methods for inactivating viruses (Hota, 2004). Sterilization is the complete
elimination of all microbial life on an object or surface and usually involves the application of
physical or chemical means such as heat or chemical methods (Hota, 2004; Rutala & Weber,
1997). Disinfection eliminates most microbes, except for bacterial spores, and usually involves
the use of chemical agents (Hota, 2004). Biocides are chemical agents that are most often
considered broad spectrum and vary in terms of antibacterial activity (McDonnell & Russell,
1999). Biocides can inactivate or inhibit the growth of microorganisms in or on living tissue,
and are often referred to as “-static”, denoting inhibition of the growth of a variety of organisms
including bacteria, fungi and spores (e.g., bacteriostatic, fungistatic and sporistatic), and as
“-cidal”, denoting killing of bacteria, spores and viruses (e.g., bactericidal, sporicidal, virucidal)
(McDonnell & Russell, 1999). Disinfectants are generally defined as chemical products or
biocides that can be used to inactivate microorganisms on inanimate objects or surfaces;

41
however, they can be sporostatic but not necessarily sporicidal (McDonnell & Russell, 1999).
Sanitizers, on the other hand, are substances which reduce but do not necessarily eliminate all
microorganisms and contaminants, especially vegetative cells, on surfaces to levels are that
considered safe to the public (Marriott & Gravani, 2006). Cleaning is the process of removing
foreign material from surfaces or objects and often involves both mechanical processes and the
use of detergents with water (Hota, 2004). Detergents will remove organic material and suspend
grease or oil from surfaces (Hota, 2004).
Three different approaches can be used for cleaning contaminated surfaces: detergents,
disinfectants and detergent-disinfectants (Hota, 2004). Disinfectants are agents which rapidly
kill or inactivate many or all infectious particles with the exception of bacterial endospores
(Hota, 2004; Rutala & Weber, 1997). Detergent-disinfectants have the ability of achieving the
aims of both detergents and disinfectants (Hota, 2004). Despite a lack of conclusive evidence to
show that routine disinfection of hospital surfaces is better than the use of detergents alone, the
routine use of detergent-disinfectants is common and is based on consensus and logistic
considerations (Hota, 2004). The effectiveness of the disinfectants may be dependent on a
number of factors including prior cleaning of the surface, presence of organic material, the type
and level of contamination, concentration of the biocide, exposure time, type or nature of the
surface or object, temperature, and pH of the biocide (Rutala & Weber, 1997).
Disinfectants may be divided according to their efficacy. Chemical sterilants are known to kill
endospores after long exposure times of between 6 to 10 hours. High-level disinfectants can kill
and inactivate all microorganisms with the exception of endospores at exposure times of less

42
than 45 minutes. Intermediate-level disinfectants may kill vegetative bacteria, most viruses and
fungi, with the exception of endospores. Low-level disinfectants can kill most vegetative
bacteria, and some fungi and viruses at short exposure times of less than 10 minutes, but are
unable to kill endospores. Antiseptics, on the other hand, can prevent or arrest the growth of
microorganisms and are often used to disinfect preparations involved in the application on living
tissue such as skin (Rutala & Weber, 1997).
In hospitals, patient rooms should be cleaned daily and subjected to terminal cleaning after a
patient has been discharged from the hospital (Hota, 2004). Terminal cleaning involves
thorough cleaning of non-critical, inanimate surfaces in the environment with a disinfectant,
typically a quaternary ammonium compound or phenolics, and is more effective in de-germing
the environment due to its greater thoroughness (Hota, 2004).
1.5.1 Chlorine Compounds
Halogen-releasing agents such as chlorine dioxide, chloramines-T and sodium hypochlorite are
commonly used as high-level disinfectants in hospitals to disinfect certain types of equipment,
and as a low-level disinfectant to disinfect non-critical environmental surfaces (McDonnell &
Russell, 1999; Rutala & Weber, 1997). They are highly active oxidizing agents and can destroy
cellular activity of proteins (McDonnell & Russell, 1999). Hypochlorite agents are used as broad
spectrum antimicrobial disinfectants and contain properties such as rapid bactericidal action,
persistence, especially in treating potable water, solubility in water, stability at its concentrated
and diluted form, relatively non-toxic at recommended concentrations, and ease of use (Rutala &
Weber, 1997).

43
Hypochlorite is also a deodorizer, is colourless, non-flammable, non-staining, and is relatively
cheap to purchase (Rutala & Weber, 1997). In water, sodium hypochlorite ionizes to produce
sodium ion (Na+) and hypochlorite ion (OCl
-), resulting in an equilibrium with hypochlorous
acid (HOCl) (McDonnell & Russell, 1999). Chlorine is predominantly present as HOCl at pH 4
to 7 and as OCl- at pH 9 and above (McDonnell & Russell, 1999). HOCl is the antimicrobial
component of hypochlorites (McDonnell & Russell, 1999). Chlorine-based compounds at higher
concentrations are sporicidal, causing the spore coat to separate from the cortex, resulting in
lysis; however, this is dependent on the concentration of the disinfectant and pH (McDonnell &
Russell, 1999). Hypochlorites are also virucidal and can inactivate viruses by degrading RNA
(McDonnell & Russell, 1999). Disadvantages of using hypochlorite disinfectants include
irritation to mucous membranes, formation of toxic chlorine gas when coming into contact with
certain chemicals, noticeable odour when used at high concentrations, decreased efficacy in the
presence of a soil or organic load, and corrosive effects on certain metals and irritation of human
skin (Rutala & Weber, 1997). Another disadvantage is the formation of organohalides which are
formed by the reaction of chlorine and organic compounds present in water and wastewater
(Rutala & Weber, 1997). These halogenated organic compounds known as trihalomethanes
(e.g., chloroform) have been detected in chlorinated water and are a potential health concern
(Rutala & Weber, 1997).
1.5.2 Quaternary Ammonium Compounds
Quaternary ammonium compounds (QUATs) are membrane-active agents and amphoteric
surfactants that are frequently used on clinical and industrial environments such as floors, walls,
furnishings and equipment (Marriott & Gravani, 2006; McBain et al., 2004; McDonnell &

44
Russell, 1999). They include alkyldimethylbenzylammonium chloride and
alkyldimethylethylbenzylammonium chloride which are effective in water at 500 to 1000 ppm
hardness without the presence of sequestering agents (Marriott & Gravani, 2006). Other QUATs
include diisobutylphenoxyethoxyethyl dimethyl benzyl ammonium chloride and
methyldodecylbenzyltrimethyl ammonium chloride which require high dilution for germicidal or
bacteriostatic action (Marriott & Gravani, 2006). Benzalkonium chloride is another QUAT that
has been increasingly used in domestic cleaning products (McBain et al., 2004). QUATs are
surface-active agents because they are wetting agents with built-in detergent properties and can
penetrate porous surfaces (Marriott & Gravani, 2006). The molecular structure of a surfactant
consists of one hydrocarbon, hydrophobic group, and a hydrophilic polar group (McDonnell &
Russell, 1999). Surfactants can be cationic, anionic, non-ionic or ampholytic (amphoteric)
compounds, depending on the charge or absence of ionization of the hydrophilic group
(McDonnell & Russell, 1999). QUATs are known to reduce mould growth and Listeria
monocytogenes but are sporostatic, inhibiting the growth of spores but not the germination
process (Marriott & Gravani, 2006; McDonnell & Russell, 1999). They are known to inhibit the
growth of bacterial spores but not kill spores (Marriott & Gravani, 2006). They also have an
effect on enveloped viruses such as human immunodeficiency virus (HIV) but not on non-
enveloped viruses (McDonnell & Russell, 1999). QUATs contain surfactant properties which
cause them to foam, and when formulated with a specific detergent, they can be used as a
cleaner-sanitizer, making them appropriate for use in bathrooms, toilets, locker rooms and other
non-food contact surfaces, as long as a rinsing step is involved (Marriott & Gravani, 2006).
They are effective in the alkaline pH range, are non-corrosive and non-irritating to the skin, non-
toxic, colourless and odourless, stable in the presence of organic matter, and have a long shelf

45
life (Marriott & Gravani, 2006). Gram-negative bacteria are more susceptible to QUATs in the
acid pH range and Gram-positive bacteria are more susceptible to QUATs in the alkaline range
(Marriott & Gravani, 2006). QUATs can damage the outer membrane of Gram-negative
bacteria, allowing for their uptake (McDonnell & Russell, 1999). The quaternary ammonium
compound consists of four organic groups that are linked to a nitrogen atom that produces a
positively charged ion called a cation whereas chloride is usually the anion (Marriott & Gravani,
2006). It is speculated that the mechanism of germicidal action involves surface-active
properties of the QUAT, in particular, electrostatic ionic interactions with phospholipids, by
surrounding and damaging the cytoplasmic membrane lipid bilayers of the cell through the
positively charged quaternary nitrogen, causing the wall to fail, resulting in leakage of the
cytoplasmic materials, and inhibition of enzymes (Denyer & Stewart, 1998; Marriott & Gravani,
2006; McBain et al., 2004; McDonnell & Russell, 1999). When QUATs are applied to surfaces
for disinfection, they form a residual antimicrobial film that is bacteriostatic (Marriott &
Gravani, 2006). QUATs are stable in the presence of organic matter but their effectiveness
decreases in their presence; however, the effectiveness of QUATs is not affected by hard water
(Marriott & Gravani, 2006).
1.5.3 Alcohols
Alcohols are rapid broad-spectrum disinfectants which can be used against vegetative bacteria,
mycobacteria, viruses and fungi but not spores (McDonnell & Russell, 1999). Alcohols such as
ethanol and propanol work by targeting membrane integrity resulting in cell leakage, with the
mechanism of interaction involving phospholipids (Denyer & Stewart, 1998). Alcohols such as
ethyl alcohol (e.g., ethanol, alcohol), isopropyl alcohol (e.g., isopropanol, propan-2-ol) and

46
n-propanol are the most widely used disinfectants, with n-propanol being more commonly used
in Europe (McDonnell & Russell, 1999). They are known to inhibit sporulation and germination
of spores (McDonnell & Russell, 1999). Alcohols are not often used for sterilization because of
the inability to kill spores, hence they are not considered sporicidal (McDonnell & Russell,
1999). Isopropyl alcohol is slightly more effective against bacteria and ethyl alcohol is more
effective against viruses but the efficacy of the alcohols is dependent on their concentration and
the organism (McDonnell & Russell, 1999). The antimicrobial activity is optimal between 60
and 90 % and slightly lower at concentrations below 50 % (McDonnell & Russell, 1999).
1.5.4 Hydrogen Peroxide
Hydrogen peroxide is a disinfectant, antibacterial agent and oxidizing agent that is widely used
for disinfection, sterilization and antisepsis (Denyer & Stewart, 1998; McDonnell & Russell,
1999). The biocide targets protein thiol groups, resulting in DNA strand breakage, and has been
known to be effective against biofilms (Denyer & Stewart, 1998; Marriott & Gravani, 2006;
McDonnell & Russell, 1999). This disinfectant can be used on all types of surfaces, equipment,
floors, drains, walls and other contaminated areas (Marriott & Gravani, 2006). The mechanism
involves free-radical oxidation leading to the formation of free hydroxyl radicals, which attack
cell components such as lipids, proteins and DNA (Denyer & Stewart, 1998; McDonnell &
Russell, 1999). Hydrogen peroxide oxidizes and disrupts thiol groups in enzymes and proteins
(McDonnell & Russell, 1999). Hydrogen peroxide is effective against viruses, bacteria, yeasts
and bacterial spores (McDonnell & Russell, 1999). In the food industry, hydrogen peroxide has
been used for the sterilization of food packaging materials (Marriott & Gravani, 2006). It is
environmentally friendly because it degrades into water and oxygen (McDonnell & Russell,

47
1999). Hydrogen peroxide differs from accelerated hydrogen peroxide (AHP). AHP is a
patented disinfectant containing a synergistic blend of ingredients that, when combined with low
levels of hydrogen peroxide, increases its germicidal potency and cleaning performance (Virox
Technologies Inc., 2011). AHP is made up of a number of ingredients including hydrogen
peroxide, acids, surfactants, wetting agents and chelating agents (Virox Technologies Inc.,
2011).
1.5.5 Chlorhexidine
Chlorhexidines are broad-spectrum disinfectants most commonly used in antiseptic products, in
particular hand washing and oral products, which target the cytoplasmic membrane of cells;
however, they are not sporicidal (McDonnell & Russell, 1999). Low concentrations of
chlorhexidine can affect membrane integrity, whereas at high concentrations, this can cause
congealing of the cytoplasm through coagulation of intracellular constituents (McDonnell &
Russell, 1999). It is pH dependent and its efficacy can be greatly reduced in the presence of
organic matter (McDonnell & Russell, 1999). Chlorhexidine can cross the cell wall or outer
membrane through passive diffusion and target bacterial cytoplasmic or inner membrane, leading
to leakage of intracellular constituents and cell death (McDonnell & Russell, 1999).
1.5.6 Phenolic Compounds
Phenolic-type compounds are disinfectants and antimicrobial agents which target the
cytoplasmic inner membrane of cells causing leakage and occasionally uncoupling (McDonnell
& Russell, 1999). This leakage results in the release of intracellular constituents including
potassium ions (K+) (McDonnell & Russell, 1999). Phenolic compounds possess antifungal and

48
antiviral properties by damaging the plasma membrane of fungi and causing leakage (McDonnell
& Russell, 1999). Hydroxytyrosol, a phenolic compound, has been shown to inactivate
enveloped viruses such as influenza but not non-enveloped viruses such as bovine rotavirus and
fowl adenovirus (Yamada et al., 2009). The findings suggest that the mechanism behind the
antiviral effect of phenolic compounds may require the presence of a viral envelope (Yamada et
al., 2009).
1.6 Disinfectant Studies on Surrogate Viruses: MNV-1 and FCV
A number of studies done on surrogates of norovirus focused on the efficacy of disinfectants
(Table 3). FCV, in particular, has been commonly used as a surrogate to investigate the survival,
persistence and inactivation of human norovirus.
A number of studies focused on the efficacy of disinfectants on a number of surfaces including
stainless steel. Frank & Chmielewski (1997) demonstrated that surface materials have inherently
different properties when being sanitized, and that the efficacy of the sanitizer was not a function
of roughness or porosity. The efficacy of disinfectants on a number of different surface
materials, which included mechanically polished or electropolished stainless steel, polycarbonate
and mineral resin, was investigated. The surface materials were inoculated with Staphylococcus
aureus at 104 to 10
5 CFU/cm
2, immersed into sanitizer solution and then wiped with a sanitizer-
saturated cloth. Stainless steel and smooth polycarbonate surfaces were more readily sanitized
by QUATs than mineral resin and abraded polycarbonate surfaces (Frank & Chmielewski, 1997).

49
Chlorine was most effective on mechanically polished and un-abraded electropolished stainless
steel, and polycarbonate surfaces, but was less effective on abraded electropolished stainless
steel and mineral resin surfaces. It is not known why abraded electropolished stainless steel
surfaces maintained higher residual levels of viable cells than mechanically polished stainless
steel surfaces after QUAT and chlorine treatment; however, abrasion of mechanically polished
stainless steel had no effect on the efficacy of the sanitizer. More research on the relationship
between surface roughness and stainless steel cleaning and sanitizing is needed (Frank &
Chmielewski, 1997).
Urakami et al. (2007) tested the sensitivity of FCV to chlorine by using a suspension of FCV and
treating it with sodium hypochlorite containing 10 μg/mL of free chlorine. The study showed
that more than 4.6 log of partially purified FCV could be inactivated with 300 ng free
chlorine/mL when cells were monitored for cytopathic effects in 96-well multiplates containing
CRFK cells using the TCID50 method (Urakami et al., 2007). Jimenez & Chiang (2006) studied
the virucidal activity of R-82, a QUAT disinfectant, on hard surface carriers containing dried
FCV suspension with an organic soil load of 5 % fetal bovine serum (FBS). After a 10 minute
contact time at 1:256 dilution (850 ppm), the formulation caused a 6.6 and 6.4 log10 reduction
and the virus was completely inactivated (Jimenez & Chiang, 2006).
Omidbakhsh & Sattar (2006) investigated the effectiveness of a new accelerated hydrogen
peroxide-based surface disinfectant product, Accel TB, which contained 0.5 % AHP, on selected
microorganisms and non-enveloped viruses such as FCV strain F9 (VR-782) under dry load
conditions containing a 5 % FBS soil load. When AHP was used at 20 ºC at full strength
50
concentration, it was bactericidal and virucidal in 1 minute, and mycobactericidal and fungicidal
in 5 minutes. There was >6.25 log10 reduction of FCV after 1 minute contact time (Omidbakhsh
& Sattar, 2006).
Hand disinfection studies have also been done on surrogate viruses. Gehrke et al. (2004)
examined ethanol, 1-propanol and 2-propanol on FCV inactivation with artificially contaminated
fingertips using quantitative end-point titration method (50 % TCID50 method), and found that
1-propanol was more effective than ethanol and 2-propanol in inactivating FCV. Results from
suspension tests without the use of contaminated fingertips showed a 4.13 and 4.06 log10
reduction in virus with 1-propanol after a 30 second contact time at 50 % and 70 %
concentrations, respectively, as opposed to the other 2 alcohols which were effective with >4
log10 reduction after a 3 minute contact time at 50 and 70 % concentration (Gehrke et al., 2004).
Results from tests using contaminated fingertips showed significantly higher reductions at 70 %
concentration for 1-propanol, ethanol and 2-propanol, with 3.58, 3.78 and 2.15 log10 reduction
after 30 seconds, compared to results at 90 % concentration, which produced log10 reductions of
1.38, 2.84 and 0.76, respectively (Gehrke et al., 2004). Gehrke et al. (2004) concluded that
ethanol and 1-propanol-based solutions with an alcohol concentration of 70 % were most
effective, and 80 % solution of 2-propanol was least effective with 2.38 log10 reduction after 5
minutes. Alcohols such as 50 % 2-propanol, 50 % ethanol and 35 % methyl alcohol were
ineffective against FCV, whereas phenolics, Clorox, aldehydes and creolin inactivated the
surrogate virus (Steinmann, 2004).

51
Lages et al. (2008) investigated the virucidal efficacy of nine sanitizers, four of which were
alcohol-based (99.5 % ethanol, 62 % ethanol, 91 % isopropanol, 70 % isopropanol), three were
non-alcohol-based (3 % hydrogen peroxide, 0.13 % benzalkonium chloride, 10 % povidone-
iodine) and two were triclosan-based antimicrobial liquid soaps (0.60 % triclosan, 0.115 %
triclosan), against FCV on artificially contaminated fingertips for 30 seconds and 2 minute
contact times. The virus was serially diluted and titrated in 96-well microtiter plates containing
CRFK monolayers of cells, and observed for cytopathic effects using 50 % TCID50 method. The
99.5 % ethanol-based sanitizer was most effective compared to those containing 62 % ethanol,
70 % isopropanol or 91 % isopropanol, with the ethanol-based disinfectants more effective than
propanol. After the 30 second contact time, the log10 virus reduction factors for the 99.5 %
ethanol, 62 % ethanol-based instant hand sanitizer, 91 % isopropanol and 70 % isopropanol
disinfectants were 1.0, 0.50, 0 and 0.67, respectively, whereas for the 2 minute contact time, the
log10 virus reduction factors were 1.3, 0.55, 0.43 and 0.55, respectively. The virucidal efficacy
of the non-alcohol-based antiseptic, povidone-iodine at 10 % (equivalent to 1 % available
iodine), was much higher than alcohol-based hand sanitizers; hence the iodine-based compounds
were considered to be more effective against FCV. The log10 virus reductions for the three non-
alcohol-based sanitizers, 10 % povidone-iodine, 3 % hydrogen peroxide and 0.13 %
benzalkonium chloride, after 30 second contact time were 2.67, 0.09 and 0, respectively, whereas
for the 2 minute contact time, they were 2.39, 0.47 and 0.22, respectively. The virucidal efficacy
of the two triclosan-based hand soaps was poor; when compared to that of rinsing hands with tap
water without soap, both results were similar. The two triclosan-based hand soaps at
concentrations of 0.60 and 0.115 % had log10 virus reduction factors of 0.25 and 0.42 after 30
seconds, and 0.50 and 0.17 after 2 minute contact times, respectively, whereas simple hand

52
washing without soap produced log10 virus reduction factors of 0.33 and 0.42 after 30 second and
2 minute contact times, respectively. Virus reduction by antimicrobial soaps may be due to
mechanical removal during hand washing and not necessarily because of antimicrobial activity
from the soap (Lages et al., 2008).
Whitehead & McCue (2010) exposed disinfectants including an alcohol, acid, QUAT and phenol
on an inanimate surface containing dried FCV suspension for 1 minute contact time. Sodium
hypochlorite (1000 ppm), both organic acid (citric acid at 2.5 %) and inorganic acid
(hydrochloric acid at 0.38 %) at pH 2.0, and alkali (monoethanolamine) at pH 12.0 produced a
>3 log10 reduction and were effective in inactivating FCV. However, alcohol (ethanol and
isopropanol at 60 % concentration) produced 1.3 and <0.5 log10 reductions, respectively, while
the QUAT alkyl dimethyl benzyl ammonium chloride (3000 ppm) produced 1.17 log10 reduction,
and phenol (550 ppm) produced a 2.0 log10 reduction, and were not effective in inactivating the
virus (Whitehead & McCue, 2010). Whitehead & McCue (2010) suggested that the pH of the
disinfectant may have a significant role in the inactivation of FCV, with disinfectants at pH 12.0
and <3.0 showing inactivation of the virus.
Hudson et al. (2007) studied norovirus inactivation by ozone gas exposure. Ozone gas levels of
25 ppm at a high relative humidity of more than 70 % resulted in a 99.9 % inactivation of
viruses. Ozone gas concentrations between 20 to 25 ppm, maintained for 20 minutes, decreased
the concentration of norovirus (from 3 different stool samples) and FCV by a factor of more than
103 and in some cases, beyond detection after less than an hour of exposure. Samples with virus
which were dried onto hard surfaces such as plastic, steel and glass in addition to soft surfaces

53
such as fabric, cotton and carpet all showed the virus to be vulnerable to ozone gas when
measured by quantitative RT-PCR assay. Norovirus can be inactivated by exposure to ozone gas
using a portable commercial generator in hotel room settings, cruise ship cabins and healthcare
facilities (Hudson et al, 2007).
Malik et al. (2006) investigated the virucidal efficacy of different concentrations (10 to 100 %)
of ethanol and isopropanol against FCV that had been dried on stainless steel surfaces for 1, 3
and 10 minutes, and the virus titer was calculated using TCID50 assay. Ethanol (90 %) produced
the highest reduction of FCV with 99.49 % killed in 10 minutes and 99.35 % killed in 1 minute,
while 70 % ethanol killed 99.19 % of FCV in 1 minute, whereas 100 % ethanol was less
effective with 98 % of the virus killed after 10 minutes. Isopropanol at 40 to 60 % concentration
killed 99 % of FCV after 1 minute, and isopropanol at 70 to 90 % concentration killed >99 % in
3 to 10 minutes, whereas 100 % isopropanol was less effective with <98 % of the virus killed.
Viral inactivation was most effective at 60 % isopropanol after 1 minute with 99.84 % virus
killed, and 90 % ethanol after 10 minutes with 99.49 % killed (Malik et al., 2006).
Poschetto et al. (2007) studied the abilities of four disinfectants (an organic acid, aldehyde,
sodium hypochlorite and hydrogen peroxide) to inactivate FCV under field conditions using
human fecal material as the protein load. The presence of the organic load reduced the efficacy
of the disinfectants; however, the organic acid, sodium hypochlorite and peroxide were effective
against FCV when measured using 50 % TCID50 and RT-PCR, and resulted in ≥99.9 % of virus
inactivated. The organic acid containing 5 % formic acid, 1 % hydrogen peroxide and at least
2 % glutaraldehyde at a 1 hour contact time, and 1 % sodium hypochlorite (6000 ppm free

54
chlorine) at a 15 minute contact time, inactivated the virus with ≥3 log10, and may be used for
disinfection during norovirus outbreaks (Poschetto et al., 2007).
MNV-1 was more stable than FCV at room temperature, pH extremes and more persistent on
surfaces in wet and dry conditions. The MNV-1 capsid structure, genomic organization and
replication cycle are similar to human norovirus. Because MNV-1 is more acid tolerant at
surviving gastric pH levels, Cannon et al. (2006) stated that it is a more suitable surrogate virus
for human norovirus studies than FCV. Norovirus stability and inactivation in the environment
was compared using MNV-1 and FCV as surrogate viruses for human norovirus by evaluating
the stability of both viruses after exposure to pH extremes, exposure to organic solvents, thermal
inactivation and surface persistence under wet and dry conditions. MNV-1 was stable across the
entire pH range of 2 to 10, with less than 1 log reduction in infectivity at pH 2, whereas FCV was
inactivated at pH values less than 3 and above 9. FCV was more stable than MNV-1 at 56 °C (a
1-log reduction was reached at 3.5 and 6.7 minutes, respectively) but both viruses were
inactivated by 1-log at 63 °C in about 25 seconds, and in less than 10 seconds at 72 °C. In
addition, long-term persistence of both viruses was tested by suspending them into a fecal
matrix, inoculating it onto stainless steel coupons, and holding them for up to 7 days in a
controlled environment. Exposure to organic solvents such as chloroform, Freon and Vertrel
showed that both surrogate viruses, MNV-1 and FCV, are relatively resistant to all three organic
solvents however the recovery of MNV-1 was better than FCV. Stability of both viruses was
similar at 4 °C but at room temperature in suspension, MNV-1 was more stable than FCV
(Cannon et al., 2006).

55
Seo et al. (2012) studied the resistance of MNV-1 to temperature, salt and pH using a plaque
assay. MNV-1 was rapidly inactivated at temperatures above 60 °C with a 4 log10 reduction after
10 minutes, >3 log10 reduction after 2 minutes at 70 °C and was entirely inactivated after 1
minute at 85 °C. MNV-1 also survived low salt conditions (0.3 % NaCl) better than high salt
conditions at (3.3-6.3 % NaCl) at 24 °C, and was relatively resistant to strong acidic conditions
at pH 2 but tolerated conditions between pH 4 and 7. Temperature has a greater effect on
MNV-1 infectivity than salt or low pH. RT-PCR and long-template RT-PCR assay was used
alongside the plaque assay, with long-template RT-PCR requiring a larger fragment of the viral
genome to be intact for amplification than RT-PCR. Both RT-PCR and long-template RT-PCR
assay did not reflect the inactivation of MNV-1, and significantly underestimated the inactivation
of the virus by temperature, salt and pH. A few minutes’ exposure to temperatures above 70 °C
proved to be most effective in inactivating MNV-1 and may be important in the prevention of
norovirus outbreaks (Seo et al., 2012).
Studies have shown that sodium hypochlorite at 1000 ppm available chlorine completely
inactivated FCV with a log10 reduction of 4.17 at 1 minute under dry condition, whereas MNV-1
was inactivated at 2600 ppm with >4 log reduction after 0.5, 1 and 3 minute contact times
(Belliot et al., 2008; Whitehead & McCue, 2010). Another study compared human norovirus
and MNV-1 using RT-PCR and plaque assay, and showed MNV-1 to be more sensitive than
human norovirus to disinfectants by 1-2 log units. Quaternary ammonium-based disinfectants
were ineffective with <1 log reduction after 10 minutes (Girard et al., 2010). In exposing
MNV-1 to chemical biocides such as alcohol on stainless steel surfaces without mechanical

56
action, 1-propanol was most effective in reducing MNV-1 in 5 minutes at 30 % concentration
with ≥4 log reduction (Magulski et al., 2009).
Belliot et al. (2008) evaluated various disinfectants including alcohol, alcohol hand sanitizers,
QUAT, sodium hypochlorite and povidone iodine-based disinfectant on MNV-1 for 0.5, 1 and 3
minute contact times, and determined the resistance of the MNV RNA genome using RT-PCR
method. Ethanol and isopropanol at 60 % concentration produced >4 log10 reduction in viral titer
after a 1 minute contact time. The loss of infectivity and the continued presence of genomic
RNA suggested that protein alteration was the mechanism behind the inactivation of MNV-1.
Sodium hypochlorite (at 2600 ppm available chlorine) and 1 % povidone iodone produced >4
log10 reduction in infectious viral titer after 0.5 minutes of exposure; however, viral RNA was
detected after povidone iodine treatment but not after chlorine treatment. The 0.25 % QUAT
was ineffective and produced a 1 log10 reduction after a 1 minute contact time. Alcohol-based
hand sanitizers were able to produce at least a 4 log10 reduction in MNV titer after 1 minute
exposure, and real-time RT-PCR results suggested that the alteration of the viral capsid was the
mechanism which led to the inactivation of MNV-1 and that the genomic RNA was still present
after the assay. Belliot et al. (2008) suggested that the MNV capsid may have been denatured by
exposure to chlorine. Detection of viral RNA from real-time RT-PCR could not be related to the
presence of infectious virus during plaque assay (Belliot et al., 2008).
Girard et al. (2010) studied the impact of pH, humidity and the efficacy of household
disinfectants on the attachment of norovirus and MNV-1 to fomites using plaque assay and RT-
PCR. Human norovirus and MNV-1 attached to stainless steel after 10 minutes at 25 % relative

57
humidity, and although human norovirus attachment was not affected by pH, MNV-1 attached to
stainless steel to a lesser extent at pH 9. Girard et al. (2010) suggested that non-enveloped
viruses such as norovirus appear to survive better at high relative humidity (of >80 %). Sodium
hypochlorite at 3 % concentration (30000 ppm chlorine) inactivated MNV-1 after a 5 and 10
minutes with >4 log10 reduction using plaque assay as opposed to a 4 log10 reduction after 10
minutes with RT-PCR, whereas QUATs (N-alkyl dimethyl benzyl ammonium chloride at 0.02
and 0.08 % concentration) showed a 1 log10 reduction after 10 minutes and <0.5 log10 reduction
after 5 minutes with either plaque assay or TaqMan RT-PCR assay. Human norovirus was
inactivated with 3 % sodium hypochlorite after 10 minutes with >3 log10 reduction but a 2 log10
reduction occurred after 5 minutes; however, no log reduction was observed with ethoxylated
alcohols or QUATS using RT-PCR assay (Girard et al., 2010).
Magulski et al. (2009) tested the efficacy of different concentrations of alcohol, peracetic acid
and glutaraldehyde on MNV-1 vacuum-dried on stainless steel discs for 5 minutes, and
determined viral titer post-exposure by endpoint titration method using RAW 264.7 macrophage
mouse cells. The results showed that 50 % ethanol, 30 % 1-propanol, peracetic acid at 1000 ppm
and glutaraldehyde at 2500 ppm inactivated MNV-1 on stainless steel surfaces with ≥4 log10
reduction after a 5 minute contact time. In particular, 40 % 1-propanol was most effective and
inactivated the virus by an average of 6.04 log10 reduction, whereas 2-propanol was not able to
adequately inactivate MNV-1 since there was only 3.02 log10 reduction after 5 minutes
(Magulski et al., 2009).

58
1.7 Research Question and Hypothesis
This study focused on determining the efficacy of common types of disinfectants used in health
care facilities in the province of British Columbia, Canada. The central research question was to
determine what disinfectant (at what concentration and contact time) worked optimally to
inactivate norovirus on surfaces under wet and dry conditions, with and without a soil load. A
soil load mixture was used to simulate an organic matrix because viruses are often present in an
organic soil load. Wet conditions simulated fresh vomitus or liquid stool where viral particles
were in suspension and dry conditions simulated viral particles (in vomitus or liquid stool) which
underwent environmental desiccation on a surface. The latter dry condition was predicted to be
more inherently challenging for the disinfectants to inactivate viral particles as this represented a
two dimensional surface. In solution (wet condition), the disinfectant and viral particles were in
a three dimensional status and should allow the disinfectant to perform optimally by more easily
reaching the virus. Wet and dry load conditions with a soil load were also predicted to be more
challenging than without a soil load because protein from the soil load may reduce disinfectant
effectiveness. Five disinfectants were tested to determine the efficacy against human norovirus
surrogates such as murine norovirus and feline calicivirus. The disinfectants were chosen to
represent a chemical category and included bleach (sodium hypochlorite), quaternary ammonium
compounds, and accelerated hydrogen peroxides. This study also compared the differences
between two surrogate viruses (MNV-1 and FCV) when the selected disinfectants/cleaning
agents were used.

59
The hypotheses:
1. There will be no difference between wet (0 hour) and dry (60-90 minutes) load conditions
for test carriers contaminated with the respective surrogate virus and exposed to different
disinfectants/cleaning agents and concentrations, and control carriers at the 1, 5 and 10
minute contact times from the Quantitative Carrier Test-2 (QCT-2) method for MNV-1.
2. There will be no difference between wet (0 hour) and dry (60-90 minutes) load conditions
for test carriers contaminated with the respective surrogate virus and exposed to different
disinfectants/cleaning agents and concentrations, and control carriers at the 1, 5 and 10
minute contact times from the QCT-2 method for FCV.
3. There will be no difference between wet (0 hour) and dry (60-90 minutes) load conditions
with soil load for test carriers contaminated with the respective surrogate virus and
exposed to different disinfectants/cleaning agents and concentrations, and control carriers
at the 1, 5 and 10 minute contact times from the QCT-2 method for MNV-1.
4. There will be no difference between wet (0 hour) and dry (60-90 minutes) load conditions
with soil load for test carriers contaminated with the respective surrogate virus and
exposed to different disinfectants/cleaning agents and concentrations, and control carriers
at the 1, 5 and 10 minute contact times from the QCT-2 method for FCV.
5. There will be no difference between wet (0 hour) and dry (60-90 minutes) load
conditions, with and without soil load, for test carriers contaminated with the respective
surrogate virus and exposed to different disinfectants/cleaning agents and concentrations,
and control carriers at the 1, 5 and 10 minute contact times from the QCT-2 method for
MNV-1.

60
6. There will be no difference between wet (0 hour) and dry (60-90 minutes) load
conditions, with and without soil load, for test carriers contaminated with the respective
surrogate virus and exposed to different disinfectants/cleaning agents and concentrations,
and control carriers at the 1, 5 and 10 minute contact times from the QCT-2 method for
FCV.
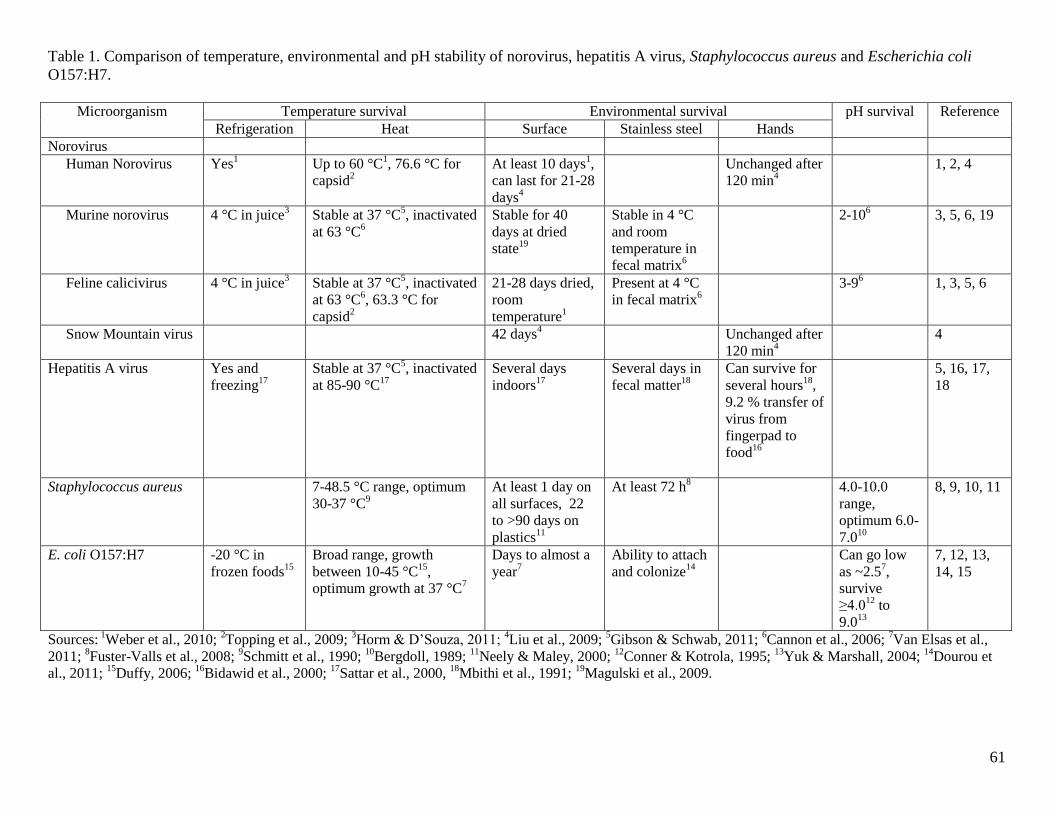
61
Table 1. Comparison of temperature, environmental and pH stability of norovirus, hepatitis A virus, Staphylococcus aureus and Escherichia coli
O157:H7.
Microorganism Temperature survival Environmental survival pH survival Reference
Refrigeration Heat Surface Stainless steel Hands
Norovirus
Human Norovirus Yes1
Up to 60 °C1, 76.6 °C for
capsid2
At least 10 days1,
can last for 21-28
days4
Unchanged after
120 min4
1, 2, 4
Murine norovirus 4 °C in juice3
Stable at 37 °C5, inactivated
at 63 °C6
Stable for 40
days at dried
state19
Stable in 4 °C
and room
temperature in
fecal matrix6
2-106 3, 5, 6, 19
Feline calicivirus
4 °C in juice3
Stable at 37 °C5, inactivated
at 63 °C6, 63.3 °C for
capsid2
21-28 days dried,
room
temperature1
Present at 4 °C
in fecal matrix6
3-96 1, 3, 5, 6
Snow Mountain virus
42 days4 Unchanged after
120 min4
4
Hepatitis A virus Yes and
freezing17
Stable at 37 °C5, inactivated
at 85-90 °C17
Several days
indoors17
Several days in
fecal matter18
Can survive for
several hours18
,
9.2 % transfer of
virus from
fingerpad to
food16
5, 16, 17,
18
Staphylococcus aureus
7-48.5 °C range, optimum
30-37 °C9
At least 1 day on
all surfaces, 22
to >90 days on
plastics11
At least 72 h8 4.0-10.0
range,
optimum 6.0-
7.010
8, 9, 10, 11
E. coli O157:H7 -20 °C in
frozen foods15
Broad range, growth
between 10-45 °C15
,
optimum growth at 37 °C7
Days to almost a
year7
Ability to attach
and colonize14
Can go low
as ~2.57,
survive
≥4.012
to
9.013
7, 12, 13,
14, 15
Sources: 1Weber et al., 2010;
2Topping et al., 2009;
3Horm & D’Souza, 2011;
4Liu et al., 2009;
5Gibson & Schwab, 2011;
6Cannon et al., 2006;
7Van Elsas et al.,
2011; 8Fuster-Valls et al., 2008;
9Schmitt et al., 1990;
10Bergdoll, 1989;
11Neely & Maley, 2000;
12Conner & Kotrola, 1995;
13Yuk & Marshall, 2004;
14Dourou et
al., 2011; 15
Duffy, 2006; 16
Bidawid et al., 2000; 17
Sattar et al., 2000, 18
Mbithi et al., 1991; 19
Magulski et al., 2009.

62
Table 2. Primers and probes used in real-time quantitative RT-PCR for detecting norovirus genogroups I and II.
Genogroup Primer or probe Sequence (5’ 3’)
I Primer COG1F
Primer COG1R
Probe RING1(a)-TP
Probe RING1(b)-TP
Primer 431
Primer 432
Primer 433
Primer 434
CGYTGGATGCGNTTYCATGA
CTTAGACGCCATCATCATTYAC
FAM-AGATYGCGATCYCCTGTCCA-TAMRAa
FAM-AGATCGCGGTCTCCTGTCCA-TAMRAa
TGGACIAGRGGICCYAAYCA
TGGACICGYGGICCYAAYCA
GAAYCTCATCCAYCTGAACAT
GAASCGCATCCARCGGAACAT
II Primer COG2F
Primer COG2R
Probe RING2-TP
Primer 431
Primer 432
Primer 433
Primer 434
CARGARBCNATGTTYAGRTGGATGAG
TCGACGCCATCTTCATTCACA
FAM-TGGGAGGGCGATCGCAATCT-TAMRAa
TGGACIAGRGGICCYAAYCA
TGGACICGYGGICCYAAYCA
GAAYCTCATCCAYCTGAACAT
GAASCGCATCCARCGGAACAT a6-Carboxyfluorescein (FAM) is reporter dye coupled in 5’ end of oligonucleotide, and 6-carboxy-tetramethylrhodamine (TAMRA) is quencher dye
coupled in 3’ end of oligonucleotide.
Sources: Health Canada, 2010; Kageyama et al., 2003.

63
Table 3. Summary of effectiveness of commonly used disinfectants, pH and temperature on MNV-1 and FCV surrogates of human norovirus.
Disinfectants and other conditions Inactivation of surrogate virus
MNV-1 FCV
Disinfectants
Sodium hypochlorite 12600 ppm, 0.5 minutes, >4 log10 reduction
c
111000 ppm, 1 minute, >3 log10 reduction
a
Accelerated hydrogen peroxide NA 85000 ppm, 1 minute, >6.25 log10 reduction
Hydrogen peroxide NA 53 %, 2 minutes, 0.47 log10 reduction
a
91 %, 60 minutes, ≥3 log10 reduction
c
Alcohol hand sanitizer
Ethanol
NA 562 %, 2 minutes, 0.55 log10 reduction
a
Alcohol
Ethanol 160 %, 1 minute, >4 log10 reduction
c
790 %, 10 minutes, 4 log10 reduction
a
370 %, 3 minutes, >4 log10 reduction
a
370 %, 30 seconds, 3.78 log10 reduction
a,e
1-propanol 630 %, 5 minutes, ≥4 log10 reduction
a
640 %, 5 minutes, 6.04 log10 reduction
a
370 %, 30 seconds, >4 log10 reduction
a
370 %, 30 seconds, 3.58 log10 reduction
a,e
2-propanol 160 %, 1 minute, >4 log10 reduction
c
370 %, 3 minutes, >4 log10 reduction
a
370 %, 30 seconds, 2.15 log10 reduction
a,e
Quaternary ammonium compound 10.25 %, 1 minute, 1 log10 reduction
c
113000 ppm, 1 minute, 1.17 log10 reduction
a,f
Phenol NA 11
550 ppm, 1 minute, 2 log10 reductiona
Iodine 11 %, 0.5 minutes, >4 log10 reduction
c
51 %, 30 seconds, 2.67 log10 reduction
a
Ozone NA 420-25 ppm (gas), 20 minutes, >3 log10 reduction
c
Antibacterial liquid soapd NA
50.60 %, 2 minutes, 0.50 log10 reduction
a
pH 2Resistant between 2-10
b
2Inactivated <3 and >9
b
Temperature 263 °C, 25 seconds
b
272 °C, <10 seconds
b
10>60 °C, 10 minutes, 4 log10 reduction
b
1070 °C, 2 minutes, >3 log10 reduction
b
1085 °C, 1 minute
b
263 °C, 25 seconds
b
272 °C, <10 seconds
b
Bolded values indicate inactivation of the surrogate virus. NA refers to not applicable. aCytopathic effects observed using end-point titration method (50 % tissue culture infectious dose (TCID50)).
bPlaque assay.
cReverse transcription polymerase
chain reaction (RT-PCR). dTriclosan-based antimicrobial liquid soap.
eResults based on contaminated fingertips.
fAlkyl dimethyl benzyl ammonium chloride.
Sources: 1Belliot et al., 2008;
2Cannon et al., 2006;
3Gehrke et al., 2004;
4Hudson et al., 2007;
5Lages et al., 2008;
6Magulski et al., 2009;
7Malik et al., 2006;
8Omidbakhsh & Sattar, 2006;
9Poschetto et al., 2007;
10Seo et al., 2012;
11Whitehead & McCue, 2010.

64
Family Genus Genogroup Genotype
Figure 1. Diagram of Calicivirus family, genus, genogroup and genotype.
RHDV refers to rabbit haemorrhagic disease virus. TV refers to Tulane virus. MNV-1 refers to
murine norovirus. FCV refers to feline calicivirus.
Sources: Karst, 2010; Patel et al., 2009. Adapted from Karst, 2010.
Calicivirus
Lagovirus RHDV (rabbit)
Recovirus TV
(primate)
Norovirus
GI (human)
GI.1 Norwalk
GI.2 Southampton
GII (human and
swine)
GII.1 Hawaii
GII.2 Melksham
GII.3 Toronto
GII.4 Bristol
GII.4 Minerva
GIII (bovine)
GIII.1 Jena
GIII.1 CH126
GIV (human and
canine)
GIV.1 Alphatron
GIV.2 Lion
GV (murine)
GV MNV-1
Vesivirus FCV
(feline)
Sapovirus
Nebovirus

65
Genomic RNA
ORF1 ORF2 ORF3
VPg – p48 NTPase p22 VPg Pro RdRp VP1 VP2 –(A)n
Region A B C D
VPg – VP1 VP2 –(A)n
Subgenomic RNA
Figure 2. Norovirus genome with protein products and positions of regions A-D used for
detection and genotyping.
The genome consists of three open reading frames (ORF). ORF1 encodes a polyprotein of 7 non-
structural protein products, ORF2 encodes a major structural capsid protein (VP1), and ORF3
encodes a minor structural protein (VP2). The VPg-linked subgenomic RNA which encodes VP1
and VP2 is located below the ORFs. The subgenomic RNA is covalently linked to the VPg at the
5’ end and polyadenylated at the 3’ end.
Sources: Hardy, 2005; Karst, 2010; Vinjé et al., 2004. Adapted from Karst, 2010.

66
CHAPTER 2 Materials and Methodology
This study tested the efficacy of five common types of disinfectants to determine which
environmental conditions (wet or dry load conditions), disinfectant concentrations and contact
times resulted in the inactivation of MNV-1 and FCV, in the presence and absence of a soil load
(Figure 3).
The quantitative carrier test-2 (QCT-2) method to assess the efficacy of disinfectants and/or
cleaning agents on surrogate viruses followed the set of procedures reported by Sattar et al.
(2003). Methods for virus stock preparation, tissue cell culture propagation and plaque assay
followed the set of procedures reported by Wobus et al. (2004) and T. Lynn (personal
communication, October 15, 2007), with a few minor changes such as the viral plaque incubation
period.
The thawing, passaging, freezing, harvesting and virus propagation procedures for frozen cell
cultures and viruses were followed using the protocols set by the American Type Culture
Collection (2012a; 2012b; 2012c), Bidawid et al. (2003), Grist et al. (1979), Schmidt & Emmons
(1989), and Wobus et al. (2004).
2.1 Surrogate Viruses and Cell Cultures
MNV-1 was obtained as a gift from Dr. Herbert W. (Skip) Virgin IV of the Washington
University School of Medicine, Department of Pathology and Immunology (St. Louis, MO).
FCV strain F9 (ATCC VR-782) was purchased from the American Type Culture Collection
(ATCC) (Manassas, VA). The viruses were stored in a -80 ºC freezer until use. The

67
macrophage mouse RAW 264.7 cell cultures (ATCC TIB-71) and Crandell Reese feline kidney
(CRFK) cell cultures (ATCC CCL-94) were purchased from ATCC (Manassas, VA) and stored
in a liquid nitrogen storage tank until use.
2.2 Thawing Frozen Cell Cultures
Cryovials of CRFK and RAW 264.7 cells were taken out of the liquid nitrogen tank,
immediately wrapped with a wet paper towel and partially submerged (three-quarters way) in a
flask of lukewarm water at 37 ºC to thaw the cells (Grist et al., 1979; Schmidt & Emmons,
1989). The cryovial was decontaminated by spraying and wiping with 70 % isopropyl alcohol in
the laminar flow hood prior to opening (Schmidt & Emmons, 1989). Thawed cells were
transferred into a sterile tube containing 10 mL of alpha-Minimum Essential Medium (alpha-
MEM) (Gibco, catalog #12000-063) and centrifuged at 432 × g or 2000 rpm (Heraeus Clinifuge
75003539 rotor Sepatech 3760, 9.652 cm radius) for 10 minutes at room temperature (Grist et
al., 1979). The supernatant was discarded and the cell pellet gently resuspended in fresh alpha-
MEM before being transferred into a sterile T-25 (25 cm2) tissue-culture treated polystyrene cell
culture flask (Corning, catalog #430639) containing 10 mL of alpha-MEM and 20 % FBS
(Gibco, #12483-020) (e.g., 8 mL of alpha-MEM and 2 mL of FBS), or a sterile T-75 (75 cm2)
tissue-culture treated polystyrene cell culture flask (Corning, catalog #430720) containing 25 mL
of alpha-MEM and 20 % FBS for propagation (Grist et al., 1979; Schmidt & Emmons, 1989).
Flasks were gently rocked to allow the suspended cells to disperse prior to incubation at 37 ºC in
a CO2 incubator overnight (Grist et al., 1979; Schmidt & Emmons, 1989). After 24 hours, the
T-25 cell culture flask containing the growth medium was removed and replaced with new
growth medium (10 mL of alpha-MEM and 10 % FBS) (Schmidt & Emmons, 1989). The T-25

68
cell culture flask was kept at 37 ºC in the CO2 incubator and refreshed with new growth medium
once every 2-3 days until a cell monolayer of 80-90 % confluence formed (Grist et al., 1979;
Schmidt & Emmons, 1989).
2.3 Passaging Cell Cultures
Cells were passaged into T-150 (150 cm2) tissue-culture treated polystyrene cell culture flasks
(BD Falcon, catalog #355000) each containing 50 mL of alpha-MEM and 10 % FBS. To
passage RAW 264.7 cell culture into new flasks once it was at 80-90 % confluence, the growth
medium was discarded and cell scrapers (BD Falcon, catalog #353089) were used to dislodge
cells adhering to the flask surface (ATCC, 2012b; Wobus et al., 2004).
CRFK cell monolayers were disrupted with a trypsin-versene solution containing 0.3 % trypsin
(Difco, ref 215240) and 0.02 % ethylenediaminetetraacetic acid disodium salt (EDTA) (AnalaR,
B10093) (Bidawid et al., 2003; Schmidt & Emmons, 1989). After 2 minutes, the trypsin solution
was removed and the flask was allowed to rest at room temperature in the laminar flow hood for
5 minutes to allow for cell detachment (Bidawid et al., 2003; Schmidt & Emmons, 1989). The
flask was tapped on the palm of the hand to promote detachment of the cells and an appropriate
volume of fresh growth medium was added to the flask (ATCC, 2012a; Schmidt & Emmons,
1989).
A different procedure was used for passaging RAW 264.7 cell cultures. After discarding the
growth medium, alpha-MEM was added and the cell monolayer was disrupted by scraping the
cell monolayer with a cell scraper (ATCC, 2012b). For RAW 264.7 cells, the subcultivation

69
ratio was between 1:3 and 1:6 (ATCC, 2012b). For example, if a 1:4 subcultivation ratio was
used for RAW 264.7 cells, one T-75 flask would be passaged into four new T-75 flasks (or two
T-150 flasks). The 4 mL of cells were suspended and mixed before 1 mL would be dispensed to
each T-75 flask (or 2 mL of cells into each T-150 flask) containing new growth medium. Flasks
were incubated at 37 ºC in a CO2 incubator and refreshed with new growth medium once every
2-3 days until the cell culture reached 80-90 % confluence (ATCC, 2012b; Grist et al., 1979;
Schmidt & Emmons, 1989).
For CRFK cells, the subcultivation ratio was between 1:3 and 1:8 and a trypsin-versene solution
was used to dislodge the cell monolayer for passaging (ATCC, 2012a; Bidawid et al., 2003; Grist
et al., 1979; Schmidt & Emmons, 1989).
2.4 Harvesting and Preservation of Cells for Frozen Stock
Once the cell culture reached 80-90 % confluence, they could be harvested for cell culture
stocks. The contents of one flask (T-75 or T-150) are required for one cryovial of frozen stock.
The freezing medium included alpha-MEM growth medium with 10 % FBS and 10 % dimethyl
sulfoxide (DMSO) (Sigma-Aldrich, catalog #D8418-250ML) (Schmidt & Emmons, 1989). Cells
from each tissue culture flask were dislodged and transferred to a sterile falcon tube, then
centrifuged at 432 × g or 2000 rpm (Heraeus Clinifuge 75003539 rotor Sepatech 3760, 9.652 cm
radius) for 10 minutes at room temperature (Grist et al., 1979). After centrifugation, old media
was discarded and the cell pellet resuspended in new alpha-MEM before being transferred to a
new sterile falcon tube containing FBS and DMSO (Grist et al., 1979). The suspension was
gently vortexed and 1 mL transferred to each cryovial which was labelled prior to being placed

70
in a biocell and held in a -80 ºC freezer overnight (Grist et al., 1979; Schmidt & Emmons, 1989).
The cryovials were taken out of the biocell and transferred the next day to a liquid nitrogen tank
for long-term storage (ATCC, 2012a; ATCC, 2012b; Grist et al., 1979; Schmidt & Emmons,
1989).
2.5 Virus Propagation for Frozen Stock
The virus stock stored at -80 ºC was quickly thawed and 300 µL of the virus was inoculated onto
a confluent cell monolayer in a T-75 flask (Bidawid et al., 2003; Grist et al., 1979; Schmidt &
Emmons, 1989). The flask was incubated for 1 hour at room temperature while being rocked
every 5 minutes to allow for virus adsorption (Bidawid et al., 2003). Subsequently, 25 mL of
alpha-MEM containing 2 % FBS were added to the flask (Bidawid et al., 2003). The infected
monolayer was kept in a CO2 incubator at 37 ºC for between 1 and 3 days (for MNV-1), or
between 16 and 24 h (for FCV) (Bidawid et al., 2003).
Flasks were monitored each day for virus-induced cytopathic effects consisting of cell
detachment and the presence of floating or clumped cells (Bidawid et al., 2003). Once viral
infection of 90 % of the monolayer was manifesting a cytopathic effect, the flask was frozen and
thawed (freeze-thawed) three times at -80 ºC (Bidawid et al., 2003). Contents of the flask were
transferred to a sterile falcon tube and centrifuged at 3000 rpm (1892 × g) (Hettich Zentrifugen
Rotanta 460 centrifuge, 18.8 cm radius) for 20 minutes to clarify the supernatant and remove cell
debris. Aliquots of 1 mL were placed in each cryovial and labelled prior to storage in a -80 ºC
freezer for storage until use (Bidawid et al., 2003). The concentration of virus in the stock

71
preparation was determined by plaque assay. When necessary, the virus was passaged to obtain
a higher titer or new working stock.
2.6 Virus Inactivation Tests: Quantitative Carrier Test 2 (QCT-2) Method
The stainless steel disc-based QCT-2 method was followed using the protocol set by Sattar et al.
(2003) (Figure 4). MNV-1 and FCV were both tested in triplicate under wet and dry load
conditions, with and without soil load.
Flat-bottomed glass vials (#5260-GV) and black autoclavable caps (#5299-G) were purchased
from Galaxy Glass (P.O. Box 238, 7 Greenwood Ave., Newfield, NJ 08344;
[email protected]). The 1 cm diameter stainless steel discs were purchased from Muzeen &
Blythe Ltd. (187 Sutherland Ave., Winnipeg, Manitoba, Canada, R2W 3E6; 204-943-9519,
[email protected]). Stainless steel discs were custom made from sheets of AISI brushed
stainless steel type 430. The glass vials, black caps and stainless steel discs were washed, soaked
and scrubbed with a labware brush in a 1 % solution of 7X Cleaning Solution (ICN Biomedicals
Inc., Costa Mesa, CA, catalog #76-670-94). The items were first rinsed under tap water, then
with distilled, deionized water before being allowed to air-dry for 1 to 2 days. Items were
inspected for any chips, cracks or damage; items with any damage were discarded. The black
caps were partially screwed shut on the lids of the glass vials and put in brown paper bags,
whereas the stainless steel discs were placed on a 150 mm diameter Whatman No. 1 filter paper
(Schleicher & Schuell, Whatman International Ltd., England, catalog #1001150), and put in and
covered with a 15 cm glass petri dish (both bottom and lid) (Pyrex® USA). The stainless steel
72
discs, glass vials and black caps were sterilized by autoclave at 121 ºC for 30 minutes prior to
use.
The cryovial containing the selected virus was taken out of a -80 ºC freezer, allowed to thaw, and
was vortexed for 60 seconds before 10 μL of the virus was added onto the centre of each sterile
stainless steel disc carrier (Sattar et al., 2003). The virus containing the soil load contained a soil
load mixture consisting of bovine mucin, tryptone and bovine serum albumin (BSA) (Sattar et
al., 2003). The stainless steel discs were placed into glass vials, inoculum side up (Sattar et al.,
2003). The virus titer in the suspension was determined by serial dilution through plaque assay.
The inoculum was exposed to wet and dry load conditions, with the wet load not exposed to any
drying, whereas the dry load was allowed to dry for between 60-90 minutes in a biosafety lab
cabinet at room temperature. The test biocide at 50 µL (at 1/2, 1/4, 1/10, 1/20, 1/40, 1/80, 1/160,
1/320, 1/640 and 1/1280 concentrations) was added to each stainless steel disc carrier containing
the virus and held for 1, 5 and 10 minute contact time before 950 μL of neutralizer with Earle’s
Balanced Salt Solution (EBSS) (Gibco, #14155-063) was added to arrest the activity of the
disinfectant or cleaning agent (Sattar et al., 2003). Control carriers had 50 μL of EBSS added
instead of test biocide (Sattar et al., 2003). EBSS was selected due to its suitability as a diluent
for virus recovery and for making tissue extracts or dilutions of viruses (Grist et al., 1979). The
contents of each vial were vortexed for 60 seconds before the eluates were transferred into a
sterile 2 mL vial and serial dilutions were done using alpha-MEM as a diluent (Sattar et al.,
2003).

73
2.7 Plaque Assay
The plaque assay method was followed using the protocol reported by Bidawid et al. (2003),
Wobus et al. (2004) and T. Lynn (personal communication, October 15, 2007) with a few minor
changes to the procedure such as the viral plaque incubation period (Figure 4).
To prepare for plaque assay, RAW 264.7 or CRFK cells were transferred to tissue culture 6-well
multi-well plates (BD Falcon, catalog #353846) (Wobus et al., 2004). Cells were detached from
the flasks, transferred into sterile falcon tubes and centrifuged at 432 × g (2000 rpm) (Heraeus
Clinifuge 75003539 rotor Sepatech 3760, 9.652 cm radius) for 10 minutes. The medium was
discarded and the cell pellet resuspended in fresh growth medium. The cell concentration was
determined by a hemocytometer after staining with a 0.1 % (w/v) crystal violet solution (Fisher
Scientific, #C-581) to determine the cell count (cells/mL) (Grist et al., 1979; Schmidt &
Emmons, 1989). The cell density was adjusted to 1 × 10⁶ viable cells per 1 mL of alpha-MEM
with 10 % FBS, and 2.5 mL of the preparation was added to each well of a 6-well plate and
incubated at 37 ºC in a CO2 incubator until the cell monolayer reached ~90 % confluence
(Wobus et al., 2004). RAW 264.7 cells were incubated for 1 day whereas CRFK cells were
incubated for 2 days to achieve this state (Bidawid et al., 2003; Wobus et al., 2004).
Serial ten-fold dilutions of the virus preparation were prepared and 500 µL aliquots of each
dilution were added to each of the three wells (e.g., in triplicate) and incubated at room
temperature for 1 hour while rocking the 6-well plates gently (to disperse the virus suspension)
every 10-15 minutes (Bidawid et al., 2003; Wobus et al., 2004). After incubation, the aliquots
were removed from each well and 2 mL of agarose overlay mixture (tempered to 47 °C)

74
containing equal volumes of 1.25 % low melting point SeaPlaque agarose and 2X alpha-MEM
with 10 % FBS was slowly added to each well (Bidawid et al., 2003; Wobus et al., 2004). The
agarose overlay mixture was carefully added down the side of each well at a rate of one drop per
second. The agarose overlay had to be applied with care to avoid causing the cell monolayer to
detach, tear apart, roll over or peel off the plastic polystyrene surface of the well (Figure C5)
(Bidawid et al., 2003). The plates were allowed to sit at room temperature for 10 minutes to
allow the agarose to solidify and were then incubated at 37 ºC in a CO2 incubator for 36-40 hours
(MNV-1) or 40-45 hours (FCV). After incubation, a 2 mL second agarose overlay mixture
(tempered to 56 °C) containing equal volumes of 1.25 % SeaKem LE agarose, 2X alpha-MEM
with 10 % FBS and 0.1 % neutral red solution (Sigma, catalog #57993-100ML-F) was added to
each well so viable cells would be stained by the neutral red dye (Bidawid et al., 2003; Wobus et
al., 2004). The plates were held at room temperature for 10 minutes to allow the agarose to
solidify and incubated again at 37 ºC in a CO2 incubator for up to 24 hours before plaques were
counted (Bidawid et al., 2003; Wobus et al., 2004). For MNV-1, the plaques were viewed and
counted during the 5-8 hour and 24 hour mark (Figure C3), whereas FCV plaques were viewed
at the 24 hour mark (Figure C4) (Wobus et al., 2004). Plaques from test and control carriers
were visualized and counted to determine the virus concentration as plaque forming units (PFU)
per mL (Figure C2) (Bidawid et al., 2003; Wobus et al., 2004).
2.8 Disinfectants and Cleaning Agents
Five disinfectant and/or cleaning agents used in this study included one sodium hypochlorite
product, two quaternary ammonium compound products (both in ready-to-use (RTU)
concentrations) and two accelerated hydrogen peroxide products (one in concentrate, the other in

75
RTU concentration) (Table 4). The disinfectant products were selected because they are
currently being used in health care facilities in British Columbia, Canada. All disinfectant
products were tested within the manufacturer’s expiry date. The products were stored at room
temperature.
The following products were selected for this study:
1. Sodium hypochlorite: Domestic Miraclean Bleach (Clear Tech Industries Inc.,
Richmond, BC, Canada) – 5.4 % available chlorine
2. Quaternary ammonium compound (RTU): CaviCide (Metrex Research Corporation,
order no. 11-1000, DIN 02161656) – 0.28 % diisobutylphenoxyethoxyethyl dimethyl
benzyl ammonium chloride, 17.20 % isopropanol
3. Quaternary ammonium compound (RTU): T36 Disinfectant (Alda Pharmaceuticals
Corp., DIN 02231344) – 0.28 % o-phenylphenol, 0.20 % benzalkonium chloride, 0.01 %
chlorhexidine gluconate, 70 % ethanol
4. Accelerated hydrogen peroxide (RTU): Virox 5 (Virox Technologies Inc., DIN
02239775) – 0.5 % accelerated hydrogen peroxide
5. Accelerated hydrogen peroxide (concentrate): Accel (Virox Technologies Inc., DIN
02245061) – 7.0 % accelerated hydrogen peroxide
The disinfectant products were ordered directly from the company to avoid any possible
tampering or chemical degradation. Disinfectant solutions were diluted at room temperature
using distilled, deionized water, and vortexed for 60 seconds prior to use. For experiments
which involved concentrated disinfectants, dilutions of the disinfectants were always prepared

76
fresh on the day of the experiment and used within 2 hours of the start of each experiment. RTU
disinfectants were used, undiluted, during experiments. Manufacturer recommendations listed
on the product labelling such as pre-cleaning and/or pre-rinsing were not followed (Table 5).
2.9 Neutralizer
A neutralizer was used to arrest the activity of the disinfectant and to avoid cytotoxicity to the
cell culture (Aidaros & Gaudin, 1983; Sattar et al., 2003). Disinfectants that have not been
diluted or neutralized may well affect the cell viability, preventing the development of cytopathic
effects and allowing the virus to appear as though it were inactivated (Aidaros & Gaudin, 1983).
Another possible option was to use the gel filtration method to remove the disinfectant from the
virus after contact in order to reduce chemical cytotoxicity of the cell culture; however, this
method may not necessarily eliminate disinfectant cytotoxicity and may actually expose the host
cell to the disinfectant for a longer period of time (Aidaros & Gaudin, 1983; ASTM
International, 1998; Sattar et al., 2003). Based on these observations, it was decided that a
neutralizer would be selected and used to arrest the virucidal activity of the disinfectant and/or
cleaning agent immediately at the end of the defined contact time. Neutralization was
accomplished through a combination of chemical neutralization and serial dilutions.
2.9.1 Sodium Thiosulphate Neutralizer
Sodium thiosulphate pentahydrate (Na2S2O3·5H2O) (BDH Chemicals, Toronto, Canada) was
prepared (2.5 % concentration) and used as a neutralizer for sodium hypochlorite “Domestic
Miraclean” bleach concentrations selected for this study (Table A1) (Association of Official
Analytical Chemists, 1975). The neutralizer was prepared by dissolving 12.5 g of sodium

77
thiosulphate pentahydrate in 500 mL of distilled, deionized water and filtering the preparation
through a MF75 membrane filtration unit (75 mm diameter, 0.2 µm pore size) (Nalgene, catalog
#28199-155) to sterilize the solution. An antibiotic and antimycotic solution consisting of
Fungizone® amphotericin B, gentamicin reagent solution and penicillin G potassium salt was
incorporated into the neutralizer solution (per 500 mL of neutralizer) which was then stored at
4 °C.
2.9.2 Letheen Broth Neutralizer
Letheen broth (HiMedia Laboratories Pvt. Ltd. India, ref MU165-500G, catalog #95039-384) at
10.3 % concentration with 2.0 % sodium thiosulphate was used as a neutralizer to arrest the
activity of QUAT and AHP (Table A1). The neutralizer was prepared by dissolving 51.4 g
letheen broth powder and 10 g of sodium thiosulphate pentahydrate to 500 mL of distilled,
deionized water and passed through a MF75 membrane filtration unit (75 mm diameter, 0.2 µm
pore size) to sterilize the solution. An antibiotic and antimycotic solution consisting of
Fungizone® amphotericin B, gentamicin reagent solution and penicillin G potassium salt was
incorporated into the solution (per 500 mL of neutralizer) which was then stored at 4 °C.
2.10 Additional Control Tests for Virucidal Activity
Additional control tests were conducted at the beginning of the study because there was a
possibility that either the test substance/formulation (disinfectant and/or cleaning agent) or the
neutralizer, or a combination of both mixtures, affected the susceptibility of the host cells to the
virus during plaque assay experiments. Testing of the test substance/formulation, neutralizer and
the combination of both mixtures was conducted in accordance with the protocols reported by

78
Sattar et al. (2003). The control tests were run once prior to the start of each selected
disinfectant, surrogate virus and cell line, and were not repeated as long as the same conditions
(cell line, virus, disinfectant concentration, neutralizer) and methods were used during testing.
The standard procedures used in the study were the same as the procedures used to carry out
control tests. Two types of control tests were conducted in triplicate: cytotoxicity control test
and virus infectivity/interference control test (Sattar et al., 2003).
2.10.1 Cytotoxicity Control Test
The cytotoxicity control test (Figure 5) was used for the following reasons: (a) to determine at
which test formulation concentration and/or dilution produced no cytotoxicity in the cell line, (b)
to assess if the neutralizer reduces or enhances cytotoxicity of the cell line, and (c) to assess if
the presence of the soil load mixture reduces or enhances cytotoxicity of the cell line (Sattar et
al., 2003). Cytotoxicity was determined by the plaque assay method.
Each selected test formulation (disinfectant) concentration and reagent to be tested in the study
was first diluted in a 1/20 dilution (50 µL test formulation and 950 µL EBSS/neutralizer) in a
sterile plastic test tube followed by one 10-fold serial dilution (and if necessary, more serial
dilutions were conducted as needed) in alpha-MEM (167 µL of test dilution in 1.5 mL alpha-
MEM) (Sattar et al., 2003).
The following combinations (for the 1/20 dilution) were selected to determine cytotoxicity:
1. Test cytotoxicity of disinfectant without neutralizer – 50 µL test formulation and 950 µL
EBSS;

79
2. Test cytotoxicity of disinfectant with neutralizer and assess neutralizer strength – 50 µL
test formulation and 950 µL neutralizer;
3. Test cytotoxicity of neutralizer alone – 1000 µL neutralizer;
4. Test cytotoxicity of soil load mixture – 50 µL of soil load mixture and 950 µL EBSS;
5. Control – 1000 µL EBSS.
After removal of growth medium, 500 µL of the test dilution (from the 10-1
dilution) was
transferred to each well (in triplicate) containing a confluent monolayer of the cell line and
incubated at room temperature for 1 hour (Sattar et al., 2003). After 1 hour incubation, the test
dilution was removed and an agarose overlay mixture (at 47 °C) consisting of equal volumes of
1.25 % SeaPlaque agarose and 2X alpha-MEM with 10 % FBS was added to each well plate
(2 mL) and incubated at 37 ºC in a CO2 incubator for 36-40 hours prior to the addition of a
second agarose overlay mixture (at 56 °C) containing equal volumes of 1.25 % SeaKem agarose,
0.1 % neutral red and 2X alpha-MEM with 10 % FBS (Wobus et al., 2004). The 6-well plates
were incubated for a further 24 hours prior to being examined with a microscope for any visible
cytotoxicity (Sattar et al., 2003).
2.10.2 Interference with Virus Infectivity Control Test
The interference with virus infectivity control test (Figure 6) was conducted to determine if the
test formulation, neutralizer, a combination of test formulation and neutralizer, or the soil load
mixture could reduce or enhance the ability of the surrogate virus to infect and replicate in host
cells (Sattar et al., 2003). The ability of the virus to infect or replicate in the cell culture may be
affected and therefore may interfere with the estimation of the virucidal activity of the

80
disinfectant (Sattar et al., 2003). The interference with virus infectivity control test was similar
to the cytotoxicity condition test with the addition of a selected challenge virus. Interference
with virus infectivity was determined by plaque assay.
A test run with the selected surrogate virus in the absence of the test formulation was first done
to determine a countable range of infective units (Sattar et al., 2003). The countable range of
between 20 and 30 infective units (virus plaques) for both MNV-1 and FCV was selected after
serial dilution of the virus inoculum followed by plaque assay. This countable range of infective
units was used for all control tests for interference with virus infectivity.
Each selected test formulation (disinfectant) concentration and reagent was first diluted to a 1/20
dilution (50 µL test formulation and 950 µL EBSS/neutralizer) in a sterile 5 mL polypropylene
round-bottom test tube (BD Falcon, catalog #352063, 12 × 75 mm style) followed by one 10-fold
dilution (and if necessary, more serial dilutions were conducted as needed) in alpha-MEM
(167 µL of test dilution in 1.5 mL alpha-MEM) (Sattar et al., 2003).
The following combinations (for the 1/20 dilution) were selected to determine possible
interference from the test formulation (disinfectant), neutralizer, or a combination of both:
1. Test interference with virus infectivity by the disinfectant without neutralizer – 50 µL test
formulation and 950 µL EBSS;
2. Test interference with virus infectivity by the disinfectant with neutralizer – 50 µL test
formulation and 950 µL neutralizer;
3. Test interference with virus infectivity by the neutralizer alone – 1000 µL neutralizer;

81
4. Test interference with virus infectivity by the soil load mixture – 50 µL of soil load
mixture and 1000 µL EBSS
5. Control – 1000 µL EBSS.
Growth medium (alpha-MEM) in 6-well plates was removed before 500 µL of the test dilution
(from the 10-1
dilution) containing 20-30 infective units of challenge virus was transferred to
each of three wells in the plate containing a confluent monolayer of the cell line. The total
volume of challenge virus and test dilution should be 500 µL for each well plate (e.g., 450 µL of
test dilution and 50 µL of challenge virus containing between 20 and 30 infective units). The
inoculated well plates were incubated at room temperature for 1 hour (Sattar et al., 2003). After
one hour incubation, the test dilution was removed and a 47 °C agarose overlay mixture
consisting of equal volumes of 1.25 % SeaPlaque agarose and 2X alpha-MEM with 10 % FBS
was added to each well plate (2 mL) and incubated at 37 ºC in a CO2 incubator for 36-40 hours
(for MNV-1) or 40-45 hours (for FCV) prior to the addition of a 56 °C second agarose overlay
mixture containing equal volumes of 1.25 % SeaKem agarose, 0.1 % neutral red and 2X alpha-
MEM with 10 % FBS (Wobus et al., 2004). The well plates were incubated overnight for up to
24 hours before virus plaques were counted as PFU (per mL) (Sattar et al., 2003).
2.11 Reagent and Media Solution Preparation
All reagents and growth medium batches that were prepared were monitored for bacterial
contamination using thioglycolate broth. One millilitre of reagent or growth medium was added
to each thioglycolate broth tube in duplicate and incubated at 37 °C (Garcia, 2010). The
thioglycolate broth tubes were observed for contamination (e.g., turbidity) every 48 hours for 6

82
days (Garcia, 2010). The thioglycolate broth tubes were discarded after 6 days (Garcia, 2010).
Thioglycolate broth was prepared in-house by quality control laboratory technologists in the
British Columbia Public Health & Microbiology Reference Laboratories (BCPHMRL).
2.11.1 HEPES Buffer Solution
HEPES buffer solution (1 M) (4-(2-Hydroxyethyl)piperazine-1-ethanesulfonic acid N-(2-
Hydroxyethyl)piperazine-N′-(2-ethanesulfonic acid)) was prepared by adding 47.06 g of HEPES
powder (Sigma, catalog #H3375-500G) to 200 mL of deionized water in a 500 mL bottle. The
HEPES solution was vacuum filtered using a Millipak® 20 membrane filter system (Millipore,
catalog #MPL02GH2) with a 0.22 µm pore size filter to sterilize the solution. The solution was
dispensed in 7 mL aliquots into sterile 15 mL Falcon tubes and stored at 4 ºC until use (Schmidt
& Emmons, 1989).
2.11.2 Crystal Violet Solution
Crystal violet solution at 0.1 % was prepared by adding 2.10 g citric acid (AnalaR, BDH
Chemicals) and 0.10 g of crystal violet (Fisher Scientific, #C-581) into a 100 mL beaker
containing 100 mL deionized water (Garcia, 2010). The reagents were dissolved prior to being
filtered into a sterile container using Whatman No. 1 filter paper in a funnel. The crystal violet
solution was stored at 4 ºC.

83
2.11.3 Penicillin G Potassium Salt Solution
Penicillin G potassium salt (Sigma, catalog #P7794-1MU) at 4×10⁶ units was dissolved in
200 mL of distilled, deionized water for a final concentration of 20,000 units/mL (Schmidt &
Emmons, 1989). The penicillin G solution was dispensed as 5 mL aliquots into sterile 15 mL
Falcon tubes followed by storage at -20 ºC until use.
2.11.4 2X alpha-MEM Solution
2X alpha-MEM was prepared by adding 10.08 g of alpha-MEM powder (Gibco, catalog #12000-
063) and 2.2 g of sodium bicarbonate (Sigma, catalog #S5761-500G) to 500 mL of sterile
distilled, deionized water and stirring the media with a stir bar until the MEM powder was
completely dissolved (Table A2). A MF75 filtration unit with a 0.20 µm pore size filter was
used to sterilize the growth medium (Schmidt & Emmons, 1989). The 2X alpha-MEM solution
was stored at 4 ºC until use. An antibiotic and antimycotic solution consisting of Fungizone®
amphotericin B, gentamicin reagent solution, penicillin G potassium salt and HEPES buffer
solution was incorporated into the solution (per 500 mL of 2X alpha-MEM) prior to use and
stored at 4 °C.
2.11.5 Trypsin-Versene Solution
Trypsin-versene solution was prepared by adding 0.2 g of dextrose (Fisher Scientific, # D-16),
0.2 g of EDTA and 3.0 g of trypsin 250 (Difco, ref 215240) to 1000 mL of phosphate-buffered
saline (PBS) (Sigma, #P-3813), and stirred for 30 minutes at room temperature. The solution
was sterilized in a MF75 filtration unit with a 0.20 µm pore size, dispensed in 25 mL aliquots in
sterile 30 mL Falcon tubes and stored at -20 °C (Schmidt & Emmons, 1989).

84
2.11.6 Alpha-MEM Solution
Alpha-MEM was prepared by adding 100.8 g of alpha-MEM powder (Gibco, catalog #12000-
063) and 22.0 g of sodium bicarbonate (Sigma, catalog #S5761-500G) to 10 L of sterile distilled,
deionized water and stirring the media with a stir bar at room temperature until the ingredients
were completely dissolved (Table A2). A Millipak® 20 membrane filter system with a 0.22 µm
pore size filter was used to sterilize the growth medium (Schmidt & Emmons, 1989). Alpha-
MEM was dispensed in 500 mL aliquots in 500 mL sterile glass bottles and stored at 4 ºC until
use. An antibiotic and antimycotic solution consisting of Fungizone® amphotericin B,
gentamicin reagent solution, penicillin G potassium salt and HEPES buffer solution was
prepared separately and incorporated into the MEM solution (per 500 mL of alpha-MEM) prior
to use and stored at 4 °C.
2.11.7 Fungizone® Amphotericin B Solution
Fungizone® amphotericin B (Gibco, #15290-018) is an antimycotic solution that is often used
for treating clinical specimens or added to cell culture media (Schmidt & Emmons, 1989).
Fungizone® amphotericin B solution (250 µg/mL) was incorporated into growth medium at
5 mL per 500 mL of alpha-MEM growth medium and at 10 mL per 500 mL of 2X alpha-MEM
growth medium. Fungizone® amphotericin B solution was stored at -20 °C until use and
refrigerated upon opening.

85
2.11.8 Gentamicin Reagent Solution
Gentamicin reagent solution (Gibco, #15710-064) (10 mg/mL) was added to growth medium at
2.5 mL per 500 mL of alpha-MEM growth medium and 5.0 mL per 500 mL of 2X alpha-MEM
growth medium. Gentamicin Reagent Solution was stored at room temperature until use.
2.12 Soil Load Mixture
The soil load mixture (Table A3) was prepared by following the procedure set by Sattar et al.
(2003). The soil load consisted of a mixture of tryptone, BSA and bovine mucin. The soil load
mixture contained 2 g of total protein/L (Sattar et al., 2003). All soil load stock solutions were
prepared separately. The soil load mixture was used instead of a food or lipid-based soil load to
allow for more consistency in the methodology.
To prepare a 500 µL virus inoculum containing soil load, 25 µL of BSA, 100 µL of bovine
mucin and 35 µL of tryptone were added to 340 µL of virus suspension and vortexed together
prior to use. The virus suspension with soil load mixture was prepared at the start of each
experiment.
2.12.1 Tryptone
Tryptone was prepared by adding 0.5 g of BD Bacto™ tryptone (BD, catalog #211705, Difco
Laboratories, Sparks, MD, 21152, USA) into 10 mL of pH 7.2 PBS (Gibco, catalog #20012-027)
(Sattar et al., 2003). The tryptone solution was sterilized through a MF75 filtration unit with a
0.20 µm pore size, followed by addition to the cryovials and stored at -20 ºC for long-term
storage (Sattar et al., 2003).
86
2.12.2 Bovine Mucin
Bovine mucin was prepared by adding 0.04 g of bovine mucin (type 1 bovine submaxillary
glands) (Sigma, catalog #M-4503-100MG) to 10 mL of pH 7.2 PBS. The bovine mucin solution
was sterilized through a MF75 filtration unit with a 0.20 µm pore size, into 2 mL cryovials and
stored at -20 ºC for long-term storage (Sattar et al., 2003).
2.12.3 Bovine Serum Albumin
BSA was prepared by adding 0.5 g of BSA (Sigma, catalog #B-4287-5G) to 10 mL of pH 7.2
PBS. The BSA solution was sterilized through a MF75 filtration unit with a 0.20 µm pore size,
followed by transfer of aliquots to 2 mL cryovials and subsequent storage at -20 ºC (Sattar et al.,
2003).
2.12.4 SeaPlaque and SeaKem Agarose Overlay
A 1.25 % SeaPlaque agarose (Lonza, catalog #50101) overlay mixture was prepared by mixing
equal volumes of 2.5 % SeaPlaque agarose with 2X alpha-MEM supplemented with 10 % FBS
(e.g., 50 mL solution of 2.5 % SeaPlaque agarose mixed with 45 mL of 2X alpha-MEM and
5 mL of FBS) (Bidawid et al., 2003; Wobus et al., 2004). SeaPlaque agarose powder was added
to distilled, deionized water at 0.25 g/10 mL in a 100 mL (4 oz.) sterile, plastic specimen
container (Kendall, Precision™ specimen container, code #2200SA), sealed in the container, and
carefully microwaved (at 5-15 second increments, for up to 60 seconds total) to melt the
SeaPlaque, making sure the agarose did not boil over. Once microwaved, the clear, liquid
agarose was immediately put in a 47 °C water bath along with the solution of 2X alpha-MEM

87
with 10 % FBS to equilibrate. Both solutions were taken out of the water bath and mixed into
one bottle immediately before overlaying the well plates with agarose (Wobus et al., 2004).
A 1.25 % SeaKem agarose (Lonza, catalog #50001) overlay mixture was prepared by mixing
equal volumes of 2.5 % SeaKem agarose with 2X alpha-MEM supplemented with 10 % FBS and
0.1 % neutral red solution (Sigma, catalog #57993-100ML-F) that is 1/10 of the total volume of
overlay mixture (e.g., a 100 mL total volume of 1.25 % SeaKem agarose overlay should contain
50 mL solution of 2.5 % SeaKem agarose mixed with 36 mL of 2X alpha-MEM, 4 mL of FBS
and 10 mL of a 0.1 % neutral red solution) (Bidawid et al., 2003; Wobus et al., 2004). SeaKem
agarose powder was added to distilled, deionized water at 0.25 g/10 mL in a sterile, plastic
specimen container and carefully microwaved to melt the SeaKem (at 5-15 second increments,
for up to 60 seconds total). Once microwaved, the clear, liquid agarose was immediately put in a
56 °C water bath along with the solution of 2X alpha-MEM supplemented with 10 % FBS and
neutral red for temperature equilibration. Both solutions were taken out of the water bath and
mixed into one bottle immediately before overlaying the well plates with agarose (Wobus et al.,
2004).
2.13 Statistical Analysis
Tests were done in triplicate, and data (number of plaques counted) was calculated as mean log10
reduction (PFU/mL) and plotted on graphs as mean log10 reduction against disinfectant
concentration (ppm) or contact time (min). Disinfectants and/or cleaning agents were classified
using a log10 reduction criterion to determine their efficacy in inactivating MNV-1 and FCV, or
both. Results were expressed in the form of descriptive analysis. Results of the cytotoxicity and
interference with virus infectivity control tests (plaque forming units or PFU) were analysed for

88
statistically significant differences (p < 0.05) by single factor Analysis of Variance (ANOVA)
and for treatments that were significantly different, Tukey’s Honestly Significant Difference
(HSD) Test was used to determine which treatments were significantly different. The PFU
results were compared to the control. The effect of drying on the viral titer was analysed using a
two-sample t-test (assuming unequal variances). All statistics were performed using Microsoft
Office Excel 2007.

89
Table 4. List of disinfectants tested, manufacturers, active ingredients, concentrations tested and
classification.
Disinfectant
name
Manufacturer Active
ingredient(s)
Dilution(s)
tested
Concentration(s)
tested (ppm)
Classification
and type
Domestic
Miraclean
Bleach
ClearTech
Industries Inc.,
Richmond, BC,
Canada
5.4 % chlorine 1/10
1/20
1/40
1/80
1/160
1/320
1/640
1/1280
5400
2700
1350
675
338
169
84
42
Disinfectant,
halogen or
chlorine
Accel Virox
Technologies Inc.,
Oakville, ON,
Canada
7.0 % AHPa 1/2
1/4
1/10
1/20
1/40
35000
17500
7000
3500
1750
Disinfectant,
AHP
Virox 5 Virox
Technologies,
Inc., Oakville,
ON, Canada
0.5 % AHPa Undiluted,
RTUb
5000 Disinfectant,
AHP
CaviCide Metrex Research
Corp., Orange,
CA, USA
17.2 %
isopropanol,
0.28 % QUATc
Undiluted,
RTUb
2800 Disinfectant,
QUAT
T36 ALDA
Pharmaceuticals
Corp., New
Westminster, BC,
Canada
70 % ethanol,
0.28 %
o-phenylphenol,
0.01 %
chlorhexidine
gluconate,
0.20 % QUATd
Undiluted,
RTUb
2000 Disinfectant,
QUAT-alcohol
aAHP refers to accelerated hydrogen peroxide.
bRTU refers to “ready-to-use”.
c0.28 % QUAT refers to quaternary ammonium compound containing
diisobutylphenoxyethoxyethyl dimethyl benzyl ammonium chloride. d0.20 % QUAT
refers to quaternary ammonium compound containing benzalkonium chloride.
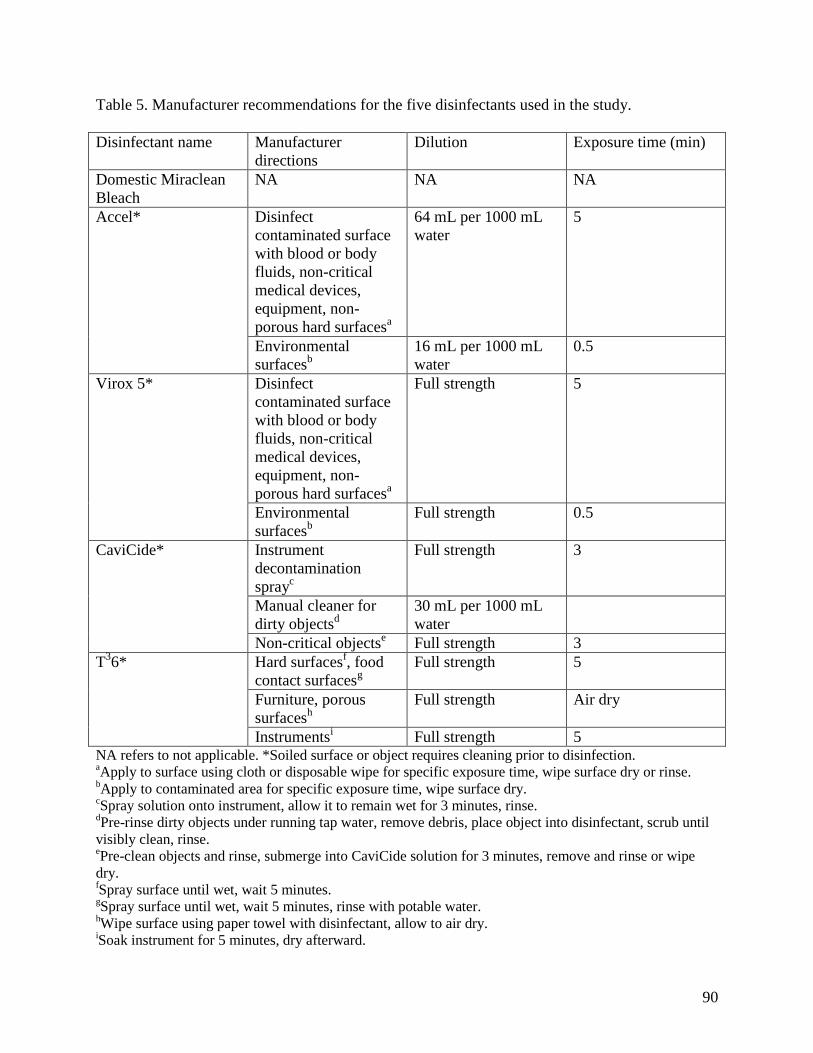
90
Table 5. Manufacturer recommendations for the five disinfectants used in the study.
Disinfectant name Manufacturer
directions
Dilution Exposure time (min)
Domestic Miraclean
Bleach
NA NA NA
Accel* Disinfect
contaminated surface
with blood or body
fluids, non-critical
medical devices,
equipment, non-
porous hard surfacesa
64 mL per 1000 mL
water
5
Environmental
surfacesb
16 mL per 1000 mL
water
0.5
Virox 5* Disinfect
contaminated surface
with blood or body
fluids, non-critical
medical devices,
equipment, non-
porous hard surfacesa
Full strength 5
Environmental
surfacesb
Full strength 0.5
CaviCide* Instrument
decontamination
sprayc
Full strength 3
Manual cleaner for
dirty objectsd
30 mL per 1000 mL
water
Non-critical objectse Full strength 3
T36* Hard surfaces
f, food
contact surfacesg
Full strength 5
Furniture, porous
surfacesh
Full strength Air dry
Instrumentsi Full strength 5
NA refers to not applicable. *Soiled surface or object requires cleaning prior to disinfection. aApply to surface using cloth or disposable wipe for specific exposure time, wipe surface dry or rinse.
bApply to contaminated area for specific exposure time, wipe surface dry.
cSpray solution onto instrument, allow it to remain wet for 3 minutes, rinse.
dPre-rinse dirty objects under running tap water, remove debris, place object into disinfectant, scrub until
visibly clean, rinse. ePre-clean objects and rinse, submerge into CaviCide solution for 3 minutes, remove and rinse or wipe
dry. fSpray surface until wet, wait 5 minutes.
gSpray surface until wet, wait 5 minutes, rinse with potable water.
hWipe surface using paper towel with disinfectant, allow to air dry.
iSoak instrument for 5 minutes, dry afterward.

91
MNV-1
no soil load
wet
1 min
5 min
10 min
dry
1 min
5 min
10 min
soil load
wet
1 min
5 min
10 min
dry
1 min
5 min
10 min
FCV
no soil load
wet
1 min
5 min
10 min
dry
1 min
5 min
10 min
soil load
wet
1 min
5 min
10 min
dry
1 min
5 min
10 min
Figure 3. Experimental design flowchart of the study including surrogate viruses MNV-1 and FCV, soil load versus no soil load, wet
versus dry load conditions, and contact time.

92
(1) Inoculate stainless steel disc carrier with 10 µL virus suspension
Virus suspension
(with or without soil load)
167 µL
Serial dilutions
10-1
10-2
10-3
10-4
10-5
500 µL to 6-well plates
Incubate for 1 hour at room temperature
(1) Add first agarose overlay – incubate 36-40 hours (MNV-1) or 40-45 hours (FCV)
at 37 °C
(2) Add second agarose overlay (with neutral red) – incubate 24 hours at 37 °C
Count virus plaques as plaque forming units (PFU/mL)*
(2) Wet (0 min) or dry load
(60-90 min) conditions
(3) Add 50 µL disinfectant
(4) Hold for 1, 5 or 10 min
(5) Apply 950 µL
neutralizer
Figure 4. QCT-2 method for virus inactivation and plaque assay method.
*Plaques were visualized at 5-8 and 24 hours for MNV-1, and at 24 hours for FCV.

93
(1)
Disinfectant
50 µL
disinfectant
+
950 µL EBSS
(2)
Disinfectant +
Neutralizer
50 µL
disinfectant
+
950 µL
neutralizer
(3)
Neutralizer
1000 µL
neutralizer
(4)
Soil Load
50 µL soil load
+
950 µL EBSS
(5)
Control
1000 µL
EBSS
167 µL
1.5 mL MEM test tube
10-1
dilution
500 µL to 6-well plates
Incubate 1 hour at room temperature
(1) Add first agarose overlay – incubate 36-40 hours at 37 °C
(2) Add second agarose overlay (with neutral red) – incubate 24 hours at 37 °C
View for visible cytotoxicity
Figure 5. Cytotoxicity control test.
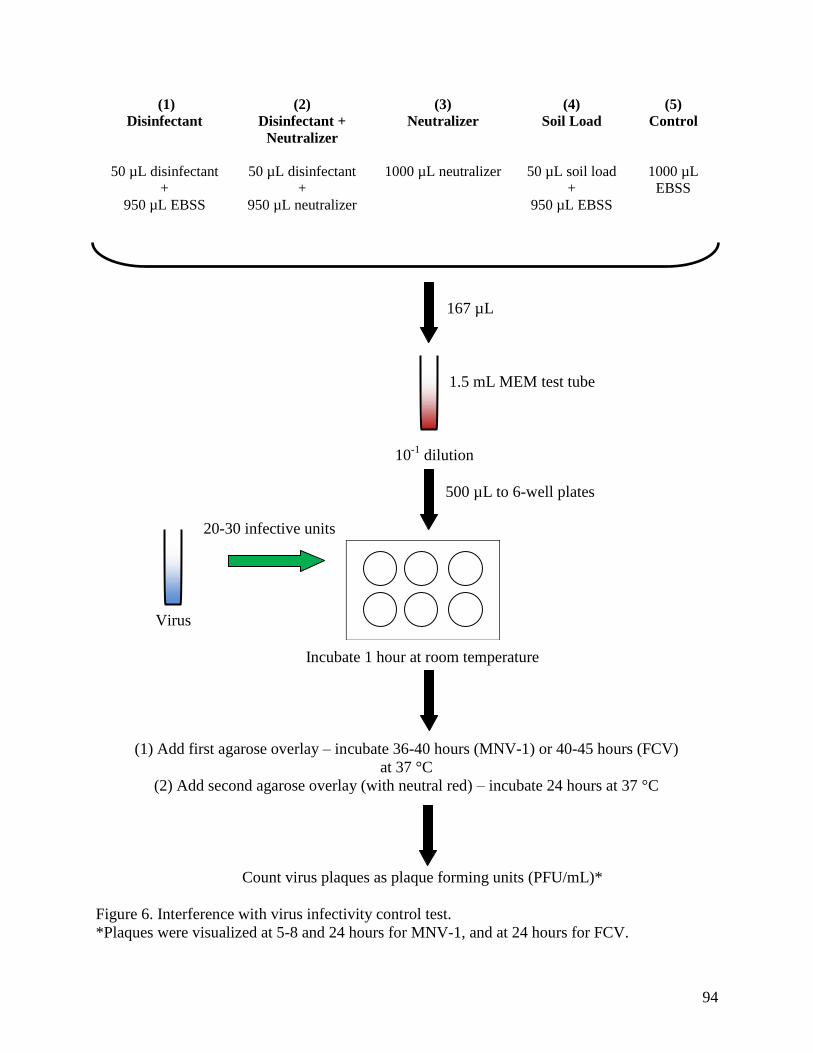
94
(1)
Disinfectant
50 µL disinfectant
+
950 µL EBSS
(2)
Disinfectant +
Neutralizer
50 µL disinfectant
+
950 µL neutralizer
(3)
Neutralizer
1000 µL neutralizer
(4)
Soil Load
50 µL soil load
+
950 µL EBSS
(5)
Control
1000 µL
EBSS
167 µL
1.5 mL MEM test tube
10-1
dilution
500 µL to 6-well plates
20-30 infective units
Virus
Incubate 1 hour at room temperature
(1) Add first agarose overlay – incubate 36-40 hours (MNV-1) or 40-45 hours (FCV)
at 37 °C
(2) Add second agarose overlay (with neutral red) – incubate 24 hours at 37 °C
Count virus plaques as plaque forming units (PFU/mL)*
Figure 6. Interference with virus infectivity control test.
*Plaques were visualized at 5-8 and 24 hours for MNV-1, and at 24 hours for FCV.

95
CHAPTER 3 Results and Discussion
Human norovirus is a highly infectious virus capable of producing symptoms such as nausea,
abdominal cramps, vomiting and watery diarrhea (Hutson et al., 2004; Nuermberger, 2005;
Radford et al., 2004). It is estimated that in a single incident of vomiting, up to 3×10⁷ virus
particles can be shed in the form of an aerosol (Barker et al., 2004). Norovirus has a low
infectious dose, hence individuals ingesting as little as 10 to 100 virus particles may become
infected (Caul, 1994; Hutson et al., 2004). There is evidence of viral shedding as monitored by
RT-PCR for several weeks despite the resolution of symptoms (Moe, 2009). Norovirus has been
known to survive on human hands, environmental surfaces and inanimate objects for long
periods of time and may remain infectious for up to 28 days, and has been demonstrated to
survive in stool samples for ≤14 days (Hota, 2004; Lamhoujeb et al., 2009; Liu et al., 2009;
Marshall & Bruggink, 2011). The virus is stable under a wide range of temperatures from
freezing to 60 °C (Nuermberger, 2005; Weber et al., 2010). With its low infectious dose and
ability to be transmitted through a number of routes including the fecal-oral route, contamination
of environmental surfaces plays an important role in prolonging norovirus outbreaks, especially
in long-term care facilities (Lopman et al., 2003; Wu et al., 2005). Based on epidemiological
investigations of norovirus outbreaks which occurred in hotels, cruise ships, hospitals, long-term
care facilities and daycares, norovirus has been shown to be environmentally stable (Calderon-
Margalit et al., 2005; Hota, 2004; Isakbaeva et al., 2005; Wu et al., 2005). Norovirus originating
from food service workers and food handlers who are ill and practice inadequate hand hygiene
can also be transmitted directly on to food or environmental surfaces of restaurants, and an
estimated ~50 % of all outbreaks of norovirus infection were associated with infected food
service workers and handlers (Boxman et al., 2009; Moe, 2009; Widdowson et al., 2005). A
96
finger pad study had demonstrated liquid soap to be more effective against norovirus than
alcohol-based hand sanitizers containing 62 % ethyl alcohol (Liu et al., 2010). At this time,
proper hand hygiene should be practiced through hand washing with soap and water prior to
contact, preparation or consumption of foods and beverages (Centers for Disease Control and
Prevention, 2011b; Lages et al., 2008). However, it is unknown at the time if alcohol-based hand
sanitizers are also effective against human norovirus (Centers for Disease Control and
Prevention, 2011c). The CDC recommends sodium hypochlorite (chlorine bleach) or other
disinfectant products approved by the United States Environmental Protection Agency (USEPA)
for use in reducing the spread of human norovirus from contaminated environmental surfaces,
whereas in British Columbia, Canada, the BCCDC recommends sodium hypochlorite (chlorine
bleach), AHP or alternative disinfectants that have been pre-approved by the Environmental
Health Officer (EHO) (British Columbia Centre for Disease Control, 2011; Centers for Disease
Control and Prevention, 2011c; United States Environmental Protection Agency, 2009).
Because human norovirus cannot be cultivated in cell culture, a number of human norovirus
studies have relied on real-time RT-PCR to determine the viral titer; however, one of the
drawbacks of this method is its inability to distinguish between infectious and non-infectious
virus (Baert et al., 2008). Cultivable surrogate viruses of human norovirus such as MNV-1 and
FCV have been selected to study the persistence, inactivation and transmission of human
norovirus; however, these limitations (e.g., the use of surrogate viruses and the inability of
human norovirus to grow in cell culture) may not accurately reflect how human noroviruses
behave in terms of environmental survival and susceptibility to disinfectants (Cannon et al.,
2006; Weber et al., 2010). As a result, the only established method which can accurately

97
quantitate (infectious) virus titers is through plaque assay (Bidawid et al., 2003; Wobus et al.,
2004). Both surrogate viruses, although they share the same Calicivirus family as human
norovirus, belong to different genera; human norovirus and MNV-1 belong in the Norovirus
genus whereas FCV belongs in the Vesivirus genus (Karst, 2010). In addition, human norovirus
can be found in genogroups I, II and IV, whereas MNV-1 is categorized in genogroup V (Karst,
2010). Despite sharing biochemical and genetic features such as size, shape and buoyant density
characteristics, MNV-1 and human noroviruses are distinct strains (Hsu et al., 2007). MNV-1
and FCV are also distinct viruses in terms of their stability upon exposure to pH, organic
solvents, temperature and environmental surface conditions (Cannon et al., 2006). MNV-1 was
claimed to be a more suitable surrogate virus than FCV based on its ability to survive in room
temperature and at pH 2 to 10 (Cannon et al., 2006). Sodium hypochlorite and alcohols (ethanol,
1-propanol and 2-propanol) are effective against MNV-1 and FCV (Belliot et al., 2008; Gehrke
et al., 2004; Magulski et al., 2009; Malik et al., 2006; Whitehead & McCue, 2010). However,
QUATs were not effective against either surrogate virus (Belliot et al., 2008; Whitehead &
McCue, 2010). Iodine was able to inactivate MNV-1 but was ineffective against FCV (Belliot et
al., 2008; Lages et al., 2008). AHP, a less harmful and more environmentally favourable
alternative to bleach, has shown promise in its effectiveness against FCV; however, it is
unknown if AHP would also be effective against MNV-1 (Omidbakhsh & Sattar, 2006).
The disinfectants that were selected for this study are commonly used in British Columbia health
care facilities; however, because of the limited data on the effectiveness of AHP against
noroviruses, it was determined that all three types of disinfectants (sodium hypochlorite, AHP
and QUATs) would be tested against both surrogates of norovirus, MNV-1 and FCV. The

98
purpose of this study was to determine the efficacy of commonly used disinfectants in British
Columbia, such as sodium hypochlorite, AHP and QUATs, against both MNV-1 and FCV under
the same conditions and methodology. Previous studies have evaluated the effectiveness of
different types of disinfectants using either MNV-1 or FCV, but generally not both, in addition to
different methodologies (real-time RT-PCR or plaque assay), environmental conditions and
contact times, making it difficult to assess the efficacy of the disinfectant product. It was
necessary to evaluate the effectiveness of commonly used disinfectants on both surrogate viruses
under the same environmental conditions and contact times, and using plaque assay to accurately
quantitate infectious virus titer.
The focus was to determine which disinfectants, and at which concentrations and contact times,
were most effective in inactivating MNV-1 and FCV, and to determine if there were any
differences in terms of disinfectant efficacy towards either surrogate virus. Unlike previous
studies which focused on the efficacy of disinfectants on the virus with soil load which had been
dried on surfaces, this study evaluated the stability of the virus under both wet and dry load
conditions.
The goal was to investigate the effectiveness of the disinfectants on viruses subjected to two
environments under wet and dry load conditions. This study was taken one step further to also
include two additional conditions by comparing the efficacy of the disinfectant against viruses
with soil load versus viruses without a soil load (under wet and dry load conditions). The
presence of a soil load can interfere with the biocide, by either interacting with, reducing its
effectiveness, or by preventing access to the virus by physically protecting the target virus (Sattar

99
et al., 2003). For example, virus under wet load conditions simulated fresh vomitus or liquid
stool, whereas virus under dry load conditions simulated vomitus or liquid stool that underwent
environmental desiccation on surfaces. The soil load mixture in this study, which consisted of
tryptone, BSA and bovine mucin, contained approximately 2 g of total protein/L which is
equivalent to the protein content of a 5 % solution of FBS (Sattar et al., 2003).
Three contact times (1, 5 and 10 minutes), from short to long, were selected to determine
whether the length of the exposure times had an effect on the efficacy of the disinfectant. The
short contact time of 1 minute was selected for this study because the contact time is generally
between 1 and 3 minutes in the field, and 1 minute is the normal drying time when a disinfectant
is applied to non-critical environmental surfaces with a wet cloth (Rutala et al., 2006; Sattar et
al., 2003). The performance criteria for the disinfectants generally differ from one jurisdiction to
another and it is often difficult to determine the relationship between the efficacy of the
disinfectant product and its ability to prevent the transmission of infection; however, the criteria
range is usually a 2 to 4 log10 reduction in the titer of virus infectivity on hard surfaces (Sattar et
al., 2003). Although it is currently not known what level of viral reduction would be needed to
prevent the spread of norovirus, in this study, the performance criteria for the selected
disinfectants was a 4 log10 reduction in the virus titer, regardless of the medium the virus was in
(e.g., with or without soil load). The virus, with or without soil load, was exposed to the test
disinfectant for a selected period of time, followed by the addition of a neutralizer to arrest the
activity of the disinfectant. The log10 reduction was determined using plaque assay.

100
3.1 Efficacy of Sodium Hypochlorite (Domestic Miraclean Bleach) against
MNV-1 and FCV, with and without Soil Load, under Wet and Dry Load Conditions
The CDC recommends sodium hypochlorite (chlorine bleach) at a concentration of 1000 to 5000
ppm for disinfecting hard, non-porous, environmental surfaces that had been contaminated with
norovirus in a health care environment (Centers for Disease Control and Prevention, 2011c).
In this study, Domestic Miraclean Bleach (or sodium hypochlorite) was tested at different
concentrations, ranging from 42 to 5400 ppm (or two-fold serial dilutions starting from 1/10 to
1/1280 dilution) (Figure 7), and the results were within ranges noted in previous studies, where
sodium hypochlorite at higher concentrations of 1000 ppm was effective against FCV and
2600 ppm for 30 seconds was effective against MNV-1 with >4 log10 reduction (Belliot et al.,
2008; Doultree et al., 1999; Whitehead & McCue, 2010).
At 2700 ppm, MNV-1 without soil load (Figure 7A) was inactivated after a short contact time of
1 minute with 6.8 and 5.9 log10 reduction under wet and dry load conditions, respectively,
whereas in the presence of a soil load (Figure 7B), the virus was only inactivated at 5400 ppm
with 6.4 and 6.7 log10 reduction under wet and dry load conditions, respectively. The presence
of the soil load interfered with the effectiveness of the sodium hypochlorite solution and in order
to fully inactivate MNV-1, doubling the concentration was required to inactivate the virus with
the soil load. However, at longer contact times of 5 minutes, the concentration of sodium
hypochlorite did not matter, and 1350 ppm was enough to inactivate MNV-1, with or without
soil load, at wet and dry load conditions with virus inactivation of >6.0 and ~5.5 log10 reduction,
respectively (Figure 7). At 10 minute contact time, MNV-1 without soil load (Figure 7A) was

101
inactivated at 675 ppm with 6.4 and 5.6 log10 reduction under wet and dry load conditions,
respectively, suggesting that exposure time may be a factor in assessing the efficacy of sodium
hypochlorite. Based on these results, it is recommended that the concentration of sodium
hypochlorite be at least 5400 ppm (or 1/10 dilution of bleach containing 5.4 % available
chlorine). This is particularly important when dealing with norovirus outbreaks involving dried
vomitus or stool on environmental surfaces based on the observation that at these concentrations,
sodium hypochlorite can readily inactivate norovirus surrogates. Sodium hypochlorite at high
concentrations was able to inactivate MNV-1 at all contact times (1, 5 and 10 minutes) under wet
and dry conditions, with or without soil load, with >5.5 log10 reduction (Table 10).
Sodium hypochlorite was also effective against FCV, showing inactivation at all contact times
(1, 5 and 10 minutes) without soil load, and inactivation at 5 and 10 minute contact times in the
presence of a soil load (Figure 8). At 5400 ppm, FCV without soil load (Figure 8A) was
inactivated after a short contact time of 1 minute with 5.7 and 5.4 log10 reduction under wet and
dry load conditions, respectively; however in the presence of a soil load (Figure 8B), the
disinfectant was only able to inactivate the virus under wet load with 5.5 log10 reduction but not
under dry load, with only a 3.7 log10 reduction. At the 5 and 10 minute contact times, the
concentration of sodium hypochlorite did not need to be as high as 5400 ppm in order to
inactivate the virus without soil load. Inactivation occurred at 1350 ppm after exposure to the
sodium hypochlorite solution for 5 minutes which resulted in a 4.6 and 4.9 log10 reduction under
wet and dry load, respectively. Regardless of the presence or absence of a soil load, FCV was
inactivated at 2700 ppm with ~5.0 log10 reduction if an exposure time of at least 5 minutes was
used (Table 11).

102
Different chlorine concentrations are required to inactivate either MNV-1 or FCV, and that using
the same concentrations and contact times for both viruses may not be effective to inactivate
both surrogate viruses under the same conditions (particularly with shorter contact times) (Table
9). It was also observed that higher concentrations of sodium hypochlorite, sometimes as much
as a two-fold difference, were needed to inactivate FCV (with or without soil load) than MNV-1.
This suggests that FCV is more resistant to chlorine than MNV-1, and to inactivate both
surrogate viruses, with or without soil load, under the same conditions such as chlorine
concentration, longer exposure times of 10 minutes at 1350 ppm or shorter contact times of 5
minutes at higher chlorine concentrations of 2700 ppm were required.
Although 1000 ppm was not tested in this study, these findings are relatively consistent and
within range with the CDC recommendations for interrupting the spread of norovirus which
require between 1000 and 5000 ppm of chlorine bleach for disinfection of environmental
surfaces (Centers for Disease Control and Prevention, 2011c).
3.2 Efficacy of Accelerated Hydrogen Peroxide (Accel and Virox 5) against
MNV-1 and FCV, with and without Soil Load, under Wet and Dry Load Conditions
No research to date has been conducted on the effectiveness of AHP (Accel and Virox 5) against
MNV-1; however, one study tested the virucidal effects of a 0.5 % ready-to-use strength AHP
product, Accel TB, on FCV, and found that after a 1 minute contact time, there was a >6.25 log10
reduction (Omidbakhsh & Sattar, 2006).

103
In this study, Accel, a concentrated AHP product, was tested at concentrations ranging from
1750 to 35000 ppm AHP; and Virox 5, a ready-to-use strength AHP product, was tested at 0.5 %
or 5000 ppm AHP against MNV-1 and FCV (Table 9). Accel at the highest concentration of
35000 pm was unable to inactivate MNV-1, with or without soil load under wet and dry load
conditions, after 1 minute contact time. At 17500 ppm, there was <1.0 log10 reduction for the
virus without soil load under wet and dry load conditions after 1 minute contact time.
At 5 minute contact time, Accel inactivated MNV-1 at 35000 ppm, demonstrating a 6.8 log10
reduction under wet load, but was unable to inactivate the virus under dry load conditions, with
only a 3.8 log10 reduction; with a soil load, the disinfectant was also unable to inactivate the
virus. At 17500 ppm, there was a 3.4 and 2.5 log10 reduction under wet and dry load conditions,
respectively. After 10 minutes at 35000 ppm, MNV-1 without soil load was inactivated with 6.5
and 5.6 log10 reductions under wet and dry load, respectively, and 6.3 and 5.6 log10 reductions
with soil load under wet and dry load, respectively (Figure 9). In the presence of a soil load,
MNV-1 was inactivated after 10 minutes at 35000 ppm AHP under wet and dry load conditions
with 6.3 and 5.6 log10 reductions, respectively (Table 10).
Accel was tested at concentrations ranging from 219 to 35000 ppm AHP against FCV (Figure
10). In the absence of a soil load, at specific concentrations, FCV was inactivated at all contact
times under wet load and at 5 and 10 minute contact time under dry load. Under wet load, Accel
at 7000, 1750 and 875 ppm was effective at 1, 5 and 10 minute contact times, respectively,
against FCV without soil load, with >5.4 log10 reduction; and under dry load, 1750 ppm was
enough to inactivate FCV after 5 minutes with >5.2 log10 reduction (Figure 10A).

104
In the presence of a soil load, Accel at 7000 ppm was effective against FCV after 5 minutes with
5.1 and 4.8 log10 reductions under wet and dry load, respectively, whereas if exposure times were
extended to 10 minutes, only 3500 ppm would be needed to inactivate the virus under wet and
dry load conditions (Figure 10B). In the absence of a soil load, it was easier to inactivate the
virus at lower disinfectant concentrations. In addition, FCV under wet load conditions,
especially without soil load, was easier to inactivate than with a soil load. The soil load
impacted on the effectiveness of AHP and this is evident when comparing results from wet load
conditions, with or without soil load, at 1 minute contact time, which demonstrated that FCV
with soil load required five times the concentration (35000 ppm) to inactivate FCV compared to
results without soil load which only required 7000 ppm. At 5 minute contact time, FCV with
soil load required four times the AHP concentration at 7000 ppm as opposed to without soil load
which required only 1750 ppm to inactivate the virus under wet load conditions; however, at a
long contact time of 10 minutes, the AHP concentration gap was smaller, and the difference in
concentration was only a two-fold dilution, from 1750 to 875 ppm. Under dry load conditions,
the presence of a soil load influenced the effectiveness of Accel even more and made it more
difficult to inactivate FCV, requiring 3500 pm and long exposure times (10 minutes) to
inactivate the virus with 4.8 log10 reduction (Table 11).
Virox 5, by contrast, was unable to inactivate MNV-1, with or without soil load, at all contact
times, with <1.0 log10 reduction after 10 minutes with soil load (Figure 11 and Figure 12).
Virox 5 was much more effective under wet load than dry load conditions, as demonstrated at the
5 and 10 minute contact times. Virox 5 was only able to inactivate FCV, with or without soil

105
load, requiring an exposure time of 10 minutes to achieve a >5.0 log10 reduction (Figure 13 and
Figure 14). AHP at a concentration of at least 3500 ppm would be needed to inactivate FCV,
with or without soil load, after 10 minutes; however, at shorter contact times of 5 minutes, a two-
fold higher concentration of 7000 ppm or higher would be required to produce a ~5.0 log10
reduction and inactivate the virus.
Accel was unable to inactivate FCV with soil load after 1 minute under dry load conditions and
this finding was not consistent with Omidbakhsh & Sattar (2006); however it was noted that they
had used Accel TB, a ready-to-use 0.5 % AHP product, whereas in this study, a concentrated
Accel product at 7.0 % AHP was used alongside a ready-to-use Virox 5 product containing
0.5 % AHP. It is possible that the three products contained different ingredients aside from
AHP; however, the ingredients were not listed on either product and it would be difficult to
assess whether each AHP product was actually different. The methodology of Omidbakhsh &
Sattar (2006) and this study also differed; glass Petri dishes were used instead of stainless steel
discs in the current study, viral desiccation duration was 20 minutes as opposed to 60-90 minutes
in the current study and a Sephadex gel column was used instead of a neutralizer to remove
cytotoxicity in the current study.
Overall, MNV-1 was more resistant towards AHP than FCV. Accel and Virox 5 were able to
inactivate FCV but were generally ineffective against MNV-1. MNV-1 with soil load under dry
load conditions required 35000 ppm of AHP for inactivation at the longest exposure time of 10
minutes to achieve >5.6 log10 reduction, whereas FCV only required a concentration that was ten
times as less concentrated under the same conditions (Table 11). It would be unrealistic and

106
expensive to use AHP at such a high concentration of 35000 ppm during norovirus outbreaks and
during regular disinfection practices. Based on these results, AHP products (both concentrate
and ready-to-use) may not be effective against human noroviruses.
3.3 Efficacy of QUAT (CaviCide) and QUAT-Alcohol (T36) against MNV-1 and
FCV, with and without Soil Load, under Wet and Dry Load Conditions
QUATs have generally been shown to be ineffective against both MNV-1 and FCV (Belliot et
al., 2008; Whitehead & McCue, 2010) and results from this study are consistent with previous
findings.
CaviCide, a ready-to-use QUAT containing 0.28 % or 2800 ppm of
diisobutylphenoxyethoxyethyl dimethyl benzyl ammonium chloride and 17.2 % isopropanol,
was ineffective against MNV-1, even in the absence of a soil load at all contact times (Figure
11). At 10 minutes, there was a 2.0 and 3.2 log10 reduction under wet and dry load, respectively;
however, this was not enough to inactivate the virus load to the desired level. CaviCide was not
tested against MNV-1 with soil load due to its ineffectiveness against the virus in the absence of
a soil load. Cytotoxicity was observed at the 10-1
dilution of the test carrier mixture, suggesting
that the RAW 264.7 cells may be sensitive to alcohols such as isopropanol; however, CRFK cells
did not exhibit any cytotoxic effects. Like MNV-1, CaviCide was also ineffective against FCV
without soil load at all contact times (Figure 13). The highest log10 reduction was observed after
10 minutes with 3.6 and 3.3 log10 reduction under wet and dry load, respectively; however, this
was not enough to inactivate the virus. FCV with soil load was not tested because the selected
QUAT product was already ineffective against the virus in the absence of a soil load. CaviCide

107
was ineffective against both surrogate noroviruses and should not be used during norovirus
outbreaks (Table 10 and Table 11).
A ready-to-use QUAT-alcohol product, T36, containing 0.20 % or 2000 ppm of benzalkonium
chloride (QUAT), was also tested against both surrogate viruses (Figure 11 and Figure 13). This
QUAT product differs from CaviCide in that it contains additional ingredients such as 0.28 %
o-phenylphenol and 0.01 % chlorhexidine gluconate, but more importantly, 70 % ethanol.
QUATs in general have been reported to be ineffective against noroviruses but when other
ingredients such as alcohol have been incorporated into the product, this study showed a
different outcome. T36 was effective against MNV-1 without soil load after a 5 and 10 minute
contact time with 6.9 and 6.2 log10 reductions under wet and dry load conditions, respectively
(Figure 11). Despite its effectiveness against MNV-1, the disinfectant was not effective against
FCV in the absence of a soil load at all contact times at 10 minutes, with the highest log10
reductions at 2.4 and 2.9 under wet and dry load, respectively (Figure 13). Considering that
QUATs are ineffective against non-enveloped viruses such as MNV-1 and FCV (Table 3), it is
very likely that the high concentration of alcohol and not the QUAT compound was involved
with the inactivation of MNV-1. However, it is possible that the other active ingredients such as
o-phenylphenol and chlorhexidine gluconate may have played a role in the inactivation of
MNV-1.
3.4 Effect of Drying on Viral Titer
The viral titers of MNV-1 and FCV (control group) were measured under the wet load condition
and again after drying (dry load condition) after each experiment to observe the effects of

108
desiccation at room temperature on the viral titer, with and without a soil load, when placed on
stainless steel surfaces (Table 8). To preclude the possibility that some virus, especially in its
dried state, may have continued to adhere to the stainless steel surface, vortexing was performed
to dislodge as much inoculum from the disc as possible and to achieve elution. Viral titer loss
was calculated by measuring the PFU/mL of the virus under wet load and dry load conditions
and dividing the dry load titer by the wet load titer. This value expressed as a percentage
established the fraction of virus remaining after drying. The differences in titer were also used to
measure the log difference between wet and dry load conditions, and were calculated by
subtracting the titer of virus under dry load conditions from those under wet load conditions. To
determine if there were any significant differences between MNV-1 and FCV, with and without
soil load, a two-sample t-test (assuming unequal variances) was used (Table B11 and Table
B12). A t-test was also used to determine if there were any significant differences between each
surrogate virus, with and without soil load (Table B13 and Table B14).
Comparing the percentage values of viral titer remaining, the t-test results showed that there
were no significant differences between MNV-1, with and without soil load (p = 0.47) (Table
B13), and FCV, with and without soil load (p = 0.44) (Table B14). The results showed that the
presence of soil does not affect the viral titer remaining after it has undergone drying. There
were significant differences when the percentage values of viral titer remaining of MNV-1 were
compared to the values of FCV, both without soil load (p = 0.00058) (Table B11). There were
also significant differences when the percentage values of viral titer remaining of MNV-1 were
compared to the values of FCV, both with soil load (p = 0.0043) (Table B12). The results show

109
that there are clear differences between the two surrogate viruses, with or without soil load, when
they have undergone drying.
It was also observed that the PFU/mL and log10 reduction differed between the wet and dry load
conditions for the controls (Table 8). Having the virus, with or without soil load, undergo drying
on an environmental surface such as stainless steel for 60 to 90 minutes may have reduced the
viral titer by as much as ~0.5 to 1 log10 reduction. Drying MNV-1 resulted in a mean log10
reduction difference of 0.72 without soil load, and 0.77 with soil load, whereas drying of the
FCV inoculum resulted in a mean log10 reduction difference of 0.39 without soil load and 0.44
with soil load.
Across both surrogate viruses, having the virus dried in the presence of a soil load resulted in a
slightly higher mean log10 reduction, by as much as 0.06 for MNV-1 and 0.05 for FCV. Between
14 and 31 % of the virus originating from the wet load viral titer remained after environmental
desiccation for MNV-1 without soil load and between 10 to 25 % remained with soil load,
whereas 18 to 76 % of the virus remained for FCV without soil load, and 17 to 55 % remained
with soil load. On average, 20 % of the wet load viral titer remained for MNV-1 without soil
load after drying and 18 % with soil load, whereas 43 % remained for FCV without soil load and
38 % remained with soil load, suggesting that drying the virus in the presence of the soil load,
had reduced the virus titer by as much as 2 % for MNV-1 and 5 % for FCV.
The effect of drying on the viral titer differed between each surrogate virus, with MNV-1
showing more viral inactivation than FCV. In the absence of a soil load, the difference between

110
the mean viral titer remaining of MNV-1 and FCV was 23 %, indicating that drying had a more
negative effect on MNV-1 than FCV. With a soil load, the difference in mean viral titer
remaining between both surrogate viruses was at 20 %. This suggests that FCV was more
tolerant of drying conditions than MNV-1, and that more FCV survived after drying. It has been
reported that in its dried state, FCV can survive at 4 °C for between 21 to 28 days (Doultree et
al., 1999). At room temperature and in a fecal matrix, MNV-1 under wet load conditions was
more stable than FCV on stainless steel surfaces over a 7 day period; however, dried MNV-1
was less stable compared to FCV (Cannon et al., 2006). Lamhoujeb et al. (2009) had found that
the recovery of human norovirus in fecal matter on stainless steel after 30 minutes was 14.2 %,
and up to 80 % of human norovirus surface dried in a laminar flow hood were undetectable after
30 minutes of drying. The results from this study are in agreement with results from previous
studies which suggest that MNV-1 is less resistant to environmental desiccation than FCV and
that recovery of the virus after desiccation may be significantly less.
Despite the reduction in viral titer after drying, especially in the presence of a soil load, these
findings do not necessarily indicate that the presence of any soil load hinders the overall survival
of noroviruses. In fact, the presence of organic matter or a protein soil load has been shown to
reduce the efficacy of disinfectants (McDonnell & Russell, 1999). For a disinfectant or biocide
to be effective, the concentration must be maintained, but its efficacy can be hindered by organic
matter (Maillard, 2001). Organic matter, such as blood, serum, soil, feces and other organic
materials, can reduce the effective concentration of the disinfectant or can protect viral particles
from the virucidal effects of the biocide (Gélinas & Goulet, 1983; Maillard, 2001). Gélinas &
Goulet (1983) reported that glutaraldehyde was most resistant to neutralization by organic matter

111
because the neutralization sites of the organic matter become rapidly saturated by absorbing the
disinfectant molecules. Chlorhexidine acetate and amphoteric surfactants are moderately
affected by organic matter whereas QUATs have a low tolerance to organic matter (consisting of
protein) due to the adsorption pattern of QUAT compounds and the constant absorbing of the
disinfectant molecules by organic matter (Gélinas & Goulet, 1983). Disinfectants with a very
low tolerance to the presence of organic matter include anionic acids, sodium hypochlorite and
iodophor (Gélinas & Goulet, 1983). The type and chemical composition of organic matter
present may have a greater effect on its interfering behaviour towards disinfectants (Gélinas &
Goulet, 1983). As the protein content increases, interference towards disinfectants also increases
(Gélinas & Goulet, 1983).
The findings of this study show that the presence of soil consisting of tryptone, BSA and bovine
mucin equivalent to a 5 % solution of FBS (or 2 g of total protein/L) interfered with the efficacy
of the disinfectants, namely, sodium hypochlorite, Accel and Virox 5, for both MNV-1 and FCV.
The differences between the log10 reduction of wet load conditions with soil load versus without
soil load, and dry load conditions with soil load versus without soil load, varied between each
disinfectant. For sodium hypochlorite, MNV-1 in the presence of a soil load under wet load
conditions was not affected as much as compared to the log10 reduction of MNV-1 without soil
load (Table 10). A surprising finding was that the results showed an opposite effect, where the
presence of soil under wet conditions showed a higher log10 reduction for some values,
especially at lower chlorine concentrations (between 338 and 1350 ppm) where virus was not
entirely inactivated at all contact times, than without soil load. For example, at 675 ppm of
available chlorine at the 1 and 5 minute contact times under wet load conditions, the log10

112
reduction for MNV-1 without soil load was 1.91 and 4.13, respectively, whereas with the soil
load, it was 4.03 and 5.62 log10 reduction, indicating that the presence of a soil load may have
allowed more virus to become inactivated, thus leading to a higher log10 reduction. This may
mean that the presence of a soil load with MNV-1 was easier to inactivate than MNV-1 without a
soil load. It is possible that the concentration of total protein in the soil load was low enough to
not have a noticeable effect on the effectiveness of the disinfectant, and that higher protein loads
may be required to see a significant difference. Under dry load conditions, MNV-1 with the
presence of a soil load appeared to reduce the efficacy of sodium hypochlorite, especially at
lower chlorine concentrations of 675 ppm and longer contact times; however, like the results
from the wet load conditions, the absence of a soil load appeared to reduce the efficacy of
sodium hypochlorite and lower log10 reductions are observed than with soil load. It is not
understood why the presence of the soil load involving MNV-1 does not appear to reduce the
efficacy of sodium hypochlorite but rather, increase viral inactivation as shown by its higher
log10 reduction. AHP-based disinfectants on the other hand showed a different outcome. The
presence of a soil load decreased the efficacy of both Accel and Virox 5 when inactivating
MNV-1. Higher log10 reductions were observed consistently under wet and dry load conditions
for MNV-1 without soil load versus with a soil load.
For FCV, the presence of a soil load appeared to hinder the efficacy of sodium hypochlorite
under wet load conditions at all contact times between 1350 to 5400 ppm hypochlorite; however,
for concentrations of 338 to 675 ppm, an opposite effect was observed, where there was a higher
log10 reduction for FCV with soil load at the 5 minute contact time compared to without soil load
(Table 11). Under dry conditions, the presence of a soil load resulted in much lower log10

113
reductions than without soil load, suggesting that having the virus on a soil load dried on a
surface is much more difficult to inactivate, especially at high chlorine concentrations and short
contact times. The efficacy of Accel and Virox 5 against FCV were also consistently reduced
under wet and dry load conditions throughout all contact times when a soil load was present.
Overall, the results suggest that the presence of a soil load can adversely affect the effectiveness
of the disinfectant, in particular AHP-based disinfectants and sodium hypochlorite, but can also
be dependent on the type of virus present, as observed by results involving MNV-1 and sodium
hypochlorite.
3.5 Cytotoxicity and Virus Infectivity Control Test
Disinfectants and their neutralizers may be highly toxic for cell lines so a cytotoxicity test and an
interference/virus infectivity test was conducted at the beginning of the study to make sure the
disinfectant and neutralizer did not affect the cell line or virus, or both. Another possible option
was to use the gel filtration method to remove the disinfectant from the virus after contact in
order to reduce chemical cytotoxicity of the cell culture; however, this method may not
necessarily eliminate disinfectant cytotoxicity (Aidaros & Gaudin, 1983; ASTM International,
1998; Sattar et al., 2003).
The following test formulations and reagents were selected for the cytotoxicity control test:
Accel (35000 ppm), Accel (17500 ppm), CaviCide, T36, sodium hypochlorite (5400 ppm),
Virox 5, sodium thiosulphate neutralizer, letheen broth neutralizer, soil load mixture and EBSS
(the control). Results (PFU) in triplicate were analysed using single factor ANOVA, with
p < 0.05 being statistically significant. For treatments that were significantly different, Tukey’s

114
Honestly Significant Difference (HSD) Test was used to determine which treatments were
significantly different.
3.5.1 Cytotoxicity Observations for RAW 264.7 and CRFK Cells
Cytotoxicity, documented by microscopy, was not observed when monolayers of RAW 264.7
macrophage mouse cells were exposed to a 10-1
serial dilution of test solution containing Accel
at 17500 ppm, sodium hypochlorite at 5400 ppm and Virox 5 at 5000 ppm, both with and
without neutralizer, to arrest the activity of the disinfectant (Table 6). Cytotoxicity was also not
observed from solutions such as sodium thiosulphate neutralizer, letheen broth neutralizer, soil
load mixture and EBSS. The neutralizers did not have any cytotoxic effects on the macrophage
mouse cell culture. Some cytotoxicity (<10 %) was observed for the Accel at 35000 ppm
without the addition of neutralizer, however, this was not substantial, as over 90 % of the
monolayer was able to absorb the neutral red dye. There was no visible cytotoxicity for Accel at
35000 ppm with neutralizer, which indicates that the neutralizer was able to arrest the activity of
the disinfectant. Cytotoxicity was observed for CaviCide (with and without neutralizer) at the
10-1
dilution when the cell culture was examined with the microscope but no cytotoxic effects
were observed at the 10-2
dilution. At the 10-1
dilution for CaviCide, the entire monolayer of
RAW 264.7 cells was unable to absorb the neutral red dye, indicating that all of the cells were
dead which may have been due to sensitivity to the isopropanol in the CaviCide. Cytotoxicity
was observed, with and without neutralizer, during exposure to the T36 disinfectant at the 10
-1
and 102
dilutions; however, cytotoxicity was not observed at the 10-3
dilution. When T36 was
tested (at 20 µL of T36 with 980 µL of letheen broth/EBSS), cytotoxicity was observed at the
10-1
dilution, however cytotoxicity was not visible at the 10-2
dilution.
115
Because cytotoxicity was observed when RAW 264.7 host cells were exposed to CaviCide and
T36 at 10
-1 dilution, experiments had to be conducted and plaques only documented at the 10
-2
dilution. If no viral plaques were observed at 10-2
dilution, it is still possible that ≤100 viable
PFU may have been present. Both QUAT disinfectants contain alcohol, with CaviCide
containing 17.2 % isopropanol and T36 containing 70 % ethanol. It is possible that the alcohol
present in the QUAT disinfectants may have caused cytotoxicity in the host cells.
Cytotoxicity was not observed when monolayers of CRFK cells were exposed to a 10-1
serial
dilution containing sodium hypochlorite (5400 ppm), CaviCide and Virox 5, with and without
neutralizer, to arrest the activity of the disinfectant (Table 6). Cytotoxicity was not observed,
with and without neutralizer, during exposure to the T36 disinfectant at the 10
-1 and 10
-2 dilution.
When T36 was tested, with and without neutralizer, cytotoxicity was not observed at the 10
-1
dilution (originating from the test solution consisting of 20 µL of T36 and 980 µL of letheen
broth/EBSS). Cytotoxicity was also not observed from selected reagents such as sodium
thiosulphate neutralizer, letheen broth neutralizer, soil load mixture and EBSS. Cytotoxicity was
observed when the cell culture was exposed to Accel (35000 ppm), with and without neutralizer.
Between 80 to 90 % of the monolayer of cells showed visible cytotoxic effects when exposed to
Accel (35000 ppm) without neutralizer and were not able to take in the neutral red dye from the
agarose overlay mixture. Exposure to Accel (35000 ppm) with neutralizer caused minimal
visible cytotoxicity of less than 10 % and the majority of cells were able to absorb the neutral red
dye from the agarose overlay mixture, suggesting that the presence of letheen broth neutralizer
substantially decreased cytotoxicity in the cell culture caused by the AHP disinfectant. Exposure
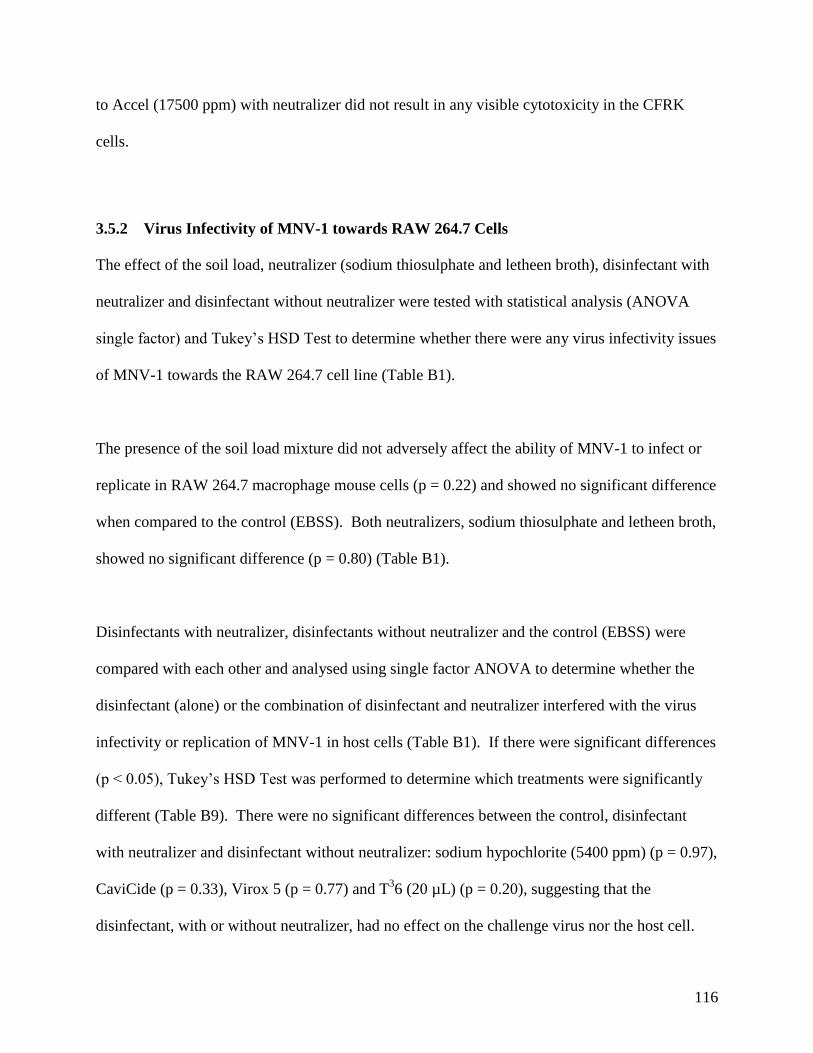
116
to Accel (17500 ppm) with neutralizer did not result in any visible cytotoxicity in the CFRK
cells.
3.5.2 Virus Infectivity of MNV-1 towards RAW 264.7 Cells
The effect of the soil load, neutralizer (sodium thiosulphate and letheen broth), disinfectant with
neutralizer and disinfectant without neutralizer were tested with statistical analysis (ANOVA
single factor) and Tukey’s HSD Test to determine whether there were any virus infectivity issues
of MNV-1 towards the RAW 264.7 cell line (Table B1).
The presence of the soil load mixture did not adversely affect the ability of MNV-1 to infect or
replicate in RAW 264.7 macrophage mouse cells (p = 0.22) and showed no significant difference
when compared to the control (EBSS). Both neutralizers, sodium thiosulphate and letheen broth,
showed no significant difference (p = 0.80) (Table B1).
Disinfectants with neutralizer, disinfectants without neutralizer and the control (EBSS) were
compared with each other and analysed using single factor ANOVA to determine whether the
disinfectant (alone) or the combination of disinfectant and neutralizer interfered with the virus
infectivity or replication of MNV-1 in host cells (Table B1). If there were significant differences
(p < 0.05), Tukey’s HSD Test was performed to determine which treatments were significantly
different (Table B9). There were no significant differences between the control, disinfectant
with neutralizer and disinfectant without neutralizer: sodium hypochlorite (5400 ppm) (p = 0.97),
CaviCide (p = 0.33), Virox 5 (p = 0.77) and T36 (20 µL) (p = 0.20), suggesting that the
disinfectant, with or without neutralizer, had no effect on the challenge virus nor the host cell.

117
However, there was a significant difference for Accel (35000 ppm) (p = 0.00048) and Accel
(17500 ppm) (p = 0.00041) at the 10-1
dilution. Because cytotoxicity was observed for Accel
(35000 ppm) without neutralizer, a comparison between the disinfectant with neutralizer,
disinfectant without neutralizer and the control could not be calculated and the Tukey’s HSD
Test could not be used.
Although cytotoxicity of RAW 264.7 cells was not observed for Accel at 35000 and 17500 ppm
with neutralizer at 10-1
dilution (Table 6), there were interference/virus infectivity issues, most
notably a reduction in the viral plaque average at 35000 ppm AHP with a mean PFU value of
22.3 for the control compared to 4.7 PFU for the disinfectant and neutralizer combination, a
difference of 17.7 PFU; and for 17500 ppm AHP, a mean PFU value of 13.7 for the disinfectant
with neutralizer, a difference of 8.7 PFU when compared to the control mean PFU, suggesting
that the ability of MNV-1 to infect and replicate in RAW 264.7 cells was affected (Table 7 and
Table B1). An increase in the neutralizer strength to arrest the activity of highly concentrated
AHP would have led to cytotoxicity in the RAW 264.7 host cells so it would have been
impossible to increase its strength. Because of the reduction in MNV-1 infectivity of RAW
264.7 macrophage mouse cells, the PFU average could be higher than previously observed,
possibly by as much as 17.7 PFU for 35000 ppm AHP or 8.7 PFU for 17500 ppm AHP. The
presence of Accel at extremely high concentrations (e.g., 35000 ppm) with neutralizer may have
reduced the ability of MNV-1 to infect RAW 264.7 host cells or it may have compromised the
ability of the host cells to be infected by the virus, thereby interfering with the estimation of the
virucidal activity of the disinfectant. Another explanation may be the strength of the neutralizer.
It is possible that the neutralizer may not have been concentrated enough to fully arrest the

118
activity of the disinfectant and there may have been some AHP residue present to interfere with
the host cell, virus, or both; however, the strength of the neutralizer was adequate for FCV,
suggesting that the neutralizer may have been strong enough to arrest the activity of the Accel
product. Lower concentrations of AHP were not effective against the virus and did not have any
impact on the cell culture.
3.5.3 Virus Infectivity of FCV towards CRFK Cells
The effect of the soil load, neutralizer (sodium thiosulphate and letheen broth), disinfectant with
neutralizer and disinfectant without neutralizer were tested with statistical analysis (ANOVA
single factor) and Tukey’s HSD Test to determine whether there were any virus infectivity issues
of FCV towards the CRFK cell line (Table B2).
The presence of the soil load mixture did not adversely affect the ability of FCV to infect or
replicate in CRFK cells (p = 0.52) (Table B2). Both neutralizers, sodium thiosulphate and
letheen broth, were compared to the control using single factor ANOVA and showed no
significant difference (p = 0.67).
Disinfectants with neutralizer, disinfectants without neutralizer and the control (EBSS) were
compared with each other and analysed using single factor ANOVA to determine whether the
disinfectant (alone) or the combination of disinfectant and neutralizer interfered with the virus
infectivity or replication of FCV in CRFK cells (Table B2). If there were significant differences
(p < 0.05), Tukey’s HSD Test was performed to determine which treatments were significantly
different (Table B10). There were no significant differences between the control, disinfectant

119
with neutralizer and disinfectant without neutralizer for CaviCide (p = 0.20). However, there
were significant differences between the following: sodium hypochlorite (5400 ppm) (p = 0.018),
Virox 5 (p = 0.0021), T36 (20 µL volume) (p = 0.021) and T
36 (50 µL volume) (p = 0.00071) at
the 10-1
dilution. Lower mean PFU values were observed for sodium hypochlorite (5400 ppm)
with neutralizer at 15.0 PFU compared to the control which had a mean PFU of 19.7. Higher
mean PFU values were observed for Virox 5, T36 (20 µL) and T
36 (50 µL), with 31.0, 29.7 and
38.0 PFU, respectively, compared to the control which had a mean PFU of 19.7, resulting in a
difference of 11.3 PFU for Virox 5 and 10.0 PFU for T36 (Table B2). Although the cause for the
factors involved with the increase in PFU could not be determined, the results had suggested that
the presence of the disinfectant with neutralizer may have enhanced the ability of FCV to infect
or replicate in CRFK cells.
Because cytotoxicity was observed for Accel (35000 ppm) without neutralizer, a comparison
between the disinfectant with neutralizer, disinfectant without neutralizer and the control could
not be calculated and the Tukey’s HSD Test could not be used. There was no significant
difference between Accel (35000 ppm) (p = 0.35) with neutralizer and the control suggesting that
presence of the disinfectant and neutralizer mixture did not interfere with the ability of FCV to
infect or replicate in the host cells.
3.6 Challenges
One unanticipated finding of this study was that MNV-1 was more sensitive, susceptible and
more easily inactivated by disinfectants containing alcohol than FCV. FCV was not inactivated
by disinfectants containing alcohol, in particular T36. One major challenge is the inability to

120
neutralize and arrest the cytotoxicity of alcohol. Instead, the alcohol from the T36 needed to be
diluted during experimental trials to minimize the activity of the alcohol against the surrogate
viruses. Another issue was the sensitivity of RAW 264.7 macrophage mouse cells during
alcohol exposure. This sensitivity led to cytotoxic effects being observed at the 10-1
serial
dilution range and difficulty in observing viral plaques at that dilution. The 10-2
serial dilution
originating from the test solution (50 µL of T36 that was applied to 10 µL of virus on stainless
steel discs) was too cytotoxic for the RAW 264.7 macrophage mouse cells and as a result, the
amount of disinfectant that was applied to the surrogate virus had to be lowered to 20 µL to
minimize the cytotoxic effects. Letheen broth neutralizer was applied at 980 µL instead of
950 µL. Even with the slight modification in the methodology, the 10-1
serial dilution still
contained enough alcohol to kill the monolayer of cells attached to the surface of 6-well plates,
thus preventing neutral red from being absorbed and making it difficult for viral infection to
occur. As a result, MNV-1 plaques had to be counted at the 10-2
serial dilution to neutralize the
alcohol. Because of this limitation, inactivation of MNV-1 observed at the 10-2
dilution may not
be an accurate reflection of the effectiveness of T36 against MNV-1, and may still contain
infectious virus at lower dilutions (e.g., 10-1
or 100 dilution) of up to ≤100 PFU.
Another challenge of this study was the inability to determine an accurate number of MNV-1
survivors when exposed to Accel at 35000 and 17500 ppm. Due to the reduction in virus
infectivity for MNV-1, it was not possible to determine exactly how much virus had survived
after a 10 minute exposure. As such, the log10 reduction values should be viewed as an estimate.
Another challenge was the alcohol sensitivities exhibited by MNV-1 towards CaviCide and T36.
Due to the cytotoxicity displayed by RAW 264.7 macrophage mouse cells, it was not possible to

121
determine how much virus had survived at the 10-1
dilution range. Because of this limitation,
there could be up to ≤100 PFU present after exposure to the following disinfectants and the log10
reduction values should be viewed as an estimate. Cytotoxicity was also observed by Park et al.
(2010) in RAW 264.7 and CRFK cells when exposed to alcohol-based hand sanitizers (such as
ethanol and isopropanol), where an additional 10-fold dilution was needed to eliminate
cytotoxicity completely.
Cytotoxic effects were not observed at the 10-1
serial dilution range for CRFK cells (when 50 µL
of T36 was used) and it does not appear FCV is sensitive or susceptible to alcohol exposure at all;
however, for consistency, a volume of 20 µL of T36 was also used on FCV. It is possible that
RAW 264.7 macrophage mouse cells and MNV-1 may be more sensitive towards alcohols than
FCV and CRFK cells. Observations from isopropanol exposure (from the CaviCide disinfectant)
towards RAW 264.7 macrophage mouse cells appear to support this. These findings are
consistent with a comparative study involving surrogate viruses, MNV-1 and FCV, and ethanol-
based handrubs, which found MNV-1 to be more readily inactivated by alcohol handrubs in short
contact times than FCV (Park et al., 2010; Sattar et al., 2011). Park et al. (2010) suggested that
the inactivation pattern of MNV-1 is similar to hydrophilic non-enveloped viruses such as
poliovirus and Coxsackie B1 virus, which are susceptible to ethanol and isopropanol at 70 %
concentration or higher. Viruses which are related and are in the same family can show some
differences in sensitivities towards disinfectants (Maillard, 2001). One important limitation to
disclose is that viral plaques were counted (as PFU/mL) at the 10-1
serial dilution range (with the
exception of MNV-1 with T36 where plaques were counted at 10
-2 dilution) meaning if there

122
were zero plaques observed at the 10-1
dilution, it may be possible to have up to ≤10 PFU
survivors at the 100 dilution.
One of the reasons why the log10 reduction of FCV was on average lower than MNV-1 could be
attributed to the viral titer of the stock at the start of the experiment trials. When MNV-1 was
inactivated by sodium hypochlorite, the results were on average >6 log10 reduction compared to
FCV results which showed a ~5 to 5.5 log10 reduction. Had the viral titer of the FCV stock been
at least 1 log higher, it may have been possible to see more viral inactivation of >6 log10
reduction at the same chlorine concentrations and contact times already achieved with MNV-1.
Because all three contact times could not be performed in the same experiment and at the same
time (with the exception of RTU disinfectants), a new and different virus titer stock was used for
each experiment. As such, the virus titer, with or without soil load, would be slightly different
for each experiment; however, the virus inoculum range was similar. There were slight
variations in the virus titer stock for each experiment and contact time, and it may be difficult to
compare each result with each other because the results are not absolute values.
The pH of the disinfectant can play a significant role on the stability of MNV-1 and FCV
(Cannon et al., 2006; Whitehead & McCue, 2010). FCV was inactivated when exposed to
disinfectants at pH <3 and >9, whereas MNV-1 was inactivated at pH <2 and >10 (Cannon et al.,
2006; Whitehead & McCue, 2010). Human noroviruses can survive in gastric pH levels
(Cannon et al., 2006). pH may play an important role in the replication of non-enveloped
viruses. Kreutz & Seal (1995) reported that FCV infection of CRFK cells involved a low pH-
dependent viral uncoating step, although it was unclear how this mechanism worked. The

123
efficacy of chlorine-based disinfectants is dependent on the concentration and pH but their
efficacy may be reduced in the presence of organic matter (McDonnell & Russell, 1999).
QUATs on the other hand are generally more effective in alkaline pH ranges (Marriott &
Gravani, 2006). MNV-1, which has a capsid structure, genomic organization and replication
cycle similar to human norovirus, was shown to be sensitive towards alcohol; however, it is
unknown at the time if human norovirus is also sensitive and less tolerant towards alcohol-based
disinfectants.
It was more difficult to inactivate either surrogate virus when the virus underwent more extreme
conditions such as environmental desiccation (dry load conditions) in the presence of a soil load
because the efficacy of disinfectants may be reduced in the presence of organic matter such as a
protein soil load. When selecting which disinfectants, concentrations and contact times that
produced the best inactivation of MNV-1 and FCV, it is advisable to select one that can
inactivate either surrogate virus under more realistic settings (e.g., dried virus containing a soil
load on an environmental hard surface) and shorter contact times of 1 or 5 minutes, as longer
contact times of 10 minutes may be too long and unrealistic.
3.7 Mechanism of Virucidal Activity and Overall Assessment of Most Suitable
Surrogate Virus for Human Norovirus
The virucidal activity of the selected disinfectants may vary, depending on the presence or
absence of a lipid envelope and the size of the virus (Maillard, 2001). Enveloped viruses which
possess a lipid envelope tend to be more susceptible to lipophilic-type disinfectants such as
2-phenylphenol, QUATs, chlorhexidine, isopropanol, ether and chloroform (McDonnell &

124
Russell, 1999). Non-enveloped viruses on the other hand are considered more resistant to
biocides than enveloped viruses (Maillard, 2001). The concentration, contact time, pH, organic
load and temperature also play an important role in the activity of biocides (Maillard, 2001).
Virucides may have multiple target sites on the viral particles leading to damage and loss of viral
infectivity, and an increase in the concentration of the disinfectant or biocide may increase the
structural damage of the viral particle (Maillard, 2001). The mechanisms behind the virucidal
activity of biocides are generally less documented, and studies on microorganisms including
bacteria, spores and yeast are often used to help explain the virucidal activity of biocides
(Maillard, 2001). The major differences between viruses and other microorganisms are that
viruses are smaller, have a simple structure and do not show any metabolic activity, restricting
target sites for virucides (Maillard, 2001). It is speculated that the mechanisms mostly involve
altering the viral capsid structure but may not always damage viral nucleic acid (Maillard, 2001).
Biocides such as glutaraldehyde, hypochlorite, ethylene oxide and hydrogen peroxide are known
to react strongly with amino or sulfhydryl groups and may have virucidal activity (McDonnell &
Russell, 1999). Biocides can react strongly with proteins although their activity may be limited
to capsid proteins and not to the viral nucleic acid (Maillard, 2001). Even so, viral markers, such
as antigenic structure and DNA polymerase, which get altered, and structural damage to the viral
capsid does not always result in the loss of viral infectivity (Maillard, 2001). Of the few
mechanisms identified, the formation of viral aggregates may be attributed to viral resistance to
disinfectants (Maillard, 2001). Certain disinfectants such as iodine, QUATs, alcohols and
phenolic compounds may have their virucidal activities limited to only the capsid and not the
viral genome, whereas acids may lead to a change in the capsid conformation and result in a loss
of capsid integrity (Maillard, 2001). For viral inactivation to occur, its nucleic acid must be

125
rendered non-infectious. This can occur by either permanently immobilizing the viral particle on
surfaces, or by blocking or destroying the host cell receptors; however, damaging the viral capsid
and nucleic acid using chlorine-releasing agents, oxidizing agents and ozone may also work
(Maillard, 2001; McDonnell & Russell, 1999). Overall, there are a number of possible virus-
biocide interactions taking place during disinfection leading to damage of viral markers,
envelope (for enveloped viruses), capsid structure, nucleic acid or genome (Maillard, 2001).
Sodium hypochlorite, AHP, QUAT disinfectant products were examined. Certain products were
more effective against one surrogate virus than the other surrogate virus, with the exception of
sodium hypochlorite which was effective against both surrogate viruses. Although AHP was
effective against both surrogate viruses, this was only possible by raising the concentration of
AHP up to 35000 ppm in order to inactivate MNV-1 after a 10 minute contact time, as opposed
to FCV which did not require such a high concentration in order to be inactivated. MNV-1 was
resistant towards certain disinfectants compared to FCV, and vice versa. It is unknown why
MNV-1 and FCV responded differently to each disinfectant.
Using the performance criteria of a 4 log10 reduction in viral titer, Domestic Miraclean Bleach
(sodium hypochlorite), Accel and T36 were effective against MNV-1, while Domestic Miraclean
Bleach, Accel and Virox 5 were effective against FCV. In the absence of a pre-rinsing and/or
pre-cleaning step prior to disinfection as listed on the manufacturer’s recommendations on the
product’s labels, sodium hypochlorite at a concentration of at least 2700 ppm after a 5 minute
contact time proved to be most effective against both surrogate viruses with ~5 log10 reduction
for FCV and >5.5 log10 reduction for MNV-1. Accel at 35000 ppm inactivated both viruses;

126
however, the very high concentration does not appear to be suitable or practical for use in
disinfecting environmental hard surfaces. In addition, there are virus infectivity issues
surrounding RAW 264.7 macrophage mouse cells from exposure to the disinfectant (with
neutralizer) such as a reduction in the PFU and it would be difficult to determine how much virus
had survived.
Based on these findings, there is no clear answer to determine whether MNV-1 or FCV is the
most suitable surrogate virus to study the stability and tolerance of human norovirus. MNV-1
showed greater resistance to QUATs and AHP-based disinfectants than FCV even though FCV
showed slightly greater resistance to sodium hypochlorite than MNV-1. Human norovirus and
MNV-1 both share features such as size, shape and buoyant density characteristics, and belong in
the same Norovirus genus (Hsu et al., 2007; Karst, 2010). Although MNV-1 and human
noroviruses are very distinct strains, MNV-1 remains the closest surrogate virus to human
norovirus than FCV (Hsu et al., 2007).
In this study, MNV-1 was more sensitive towards disinfectants containing alcohol than FCV. If
human noroviruses were more resistant towards alcohol-based disinfectants and handrubs
containing a minimal concentration of 70 % alcohol, it might be possible to see similar results
which demonstrated a 2.42 to 2.90 log10 reduction in FCV titer after 10 minutes (without soil
load) using the T36 disinfectant. Despite this possibility, human norovirus, like MNV-1, may be
just as sensitive and less tolerant towards alcohol-based disinfectants.

127
Because both surrogate viruses demonstrated differences in susceptibility towards alcohols, it
may be important to continue using both surrogate viruses for in vitro testing such as plaque
assay, to provide a more reliable estimate of the effectiveness of disinfectants against human
norovirus.

128
A
B
Figure 7. Effectiveness of sodium hypochlorite against MNV-1, (A) without soil load and (B)
with soil load, at 1, 5 and 10 minute contact times, under wet and dry load conditions.
WET refers to wet load conditions and DRY refers to dry load conditions.
0
1
2
3
4
5
6
7
42 84 169 338 675 1350 2700 5400
Log
10 R
edu
ctio
n
Concentration of Chlorine (ppm)
WET 1 min
DRY 1 min
WET 5 min
DRY 5 min
WET 10 min
DRY 10 min
0
1
2
3
4
5
6
7
84 169 338 675 1350 2700 5400
Log
10 R
edu
ctio
n
Concentration of Chlorine (ppm)
WET 1 min
DRY 1 min
WET 5 min
DRY 5 min
WET 10 min
DRY 10 min
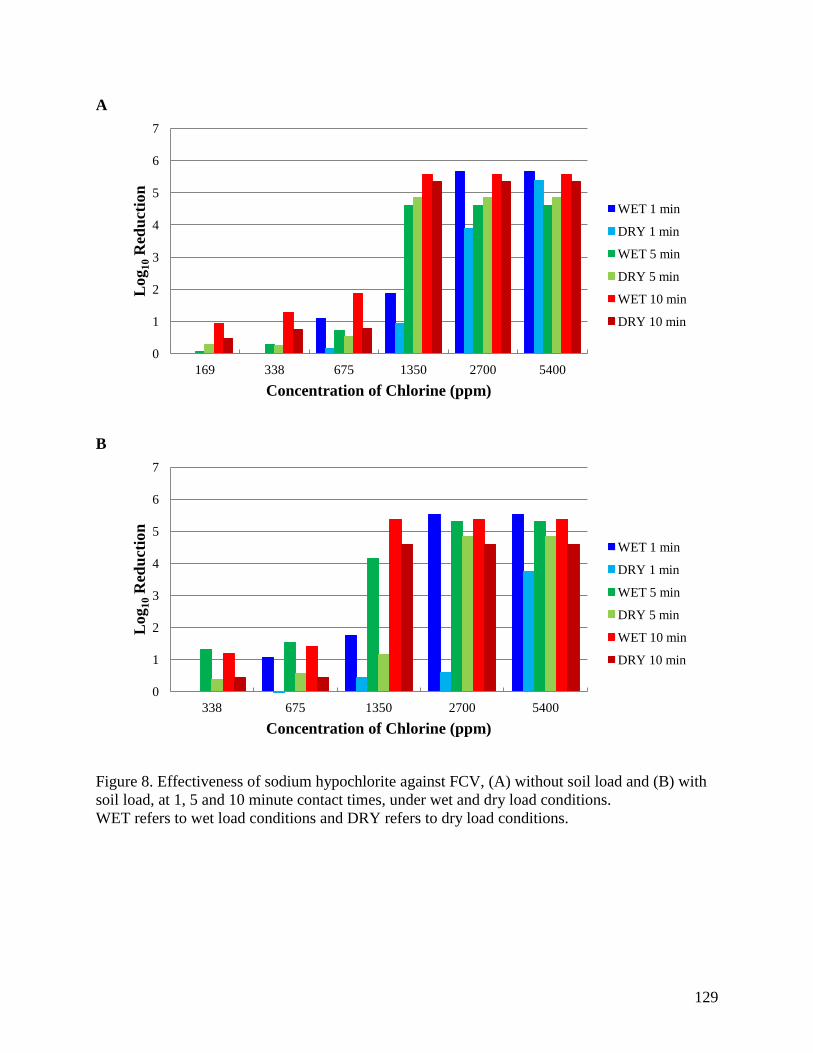
129
A
B
Figure 8. Effectiveness of sodium hypochlorite against FCV, (A) without soil load and (B) with
soil load, at 1, 5 and 10 minute contact times, under wet and dry load conditions.
WET refers to wet load conditions and DRY refers to dry load conditions.
0
1
2
3
4
5
6
7
169 338 675 1350 2700 5400
Log
10 R
edu
ctio
n
Concentration of Chlorine (ppm)
WET 1 min
DRY 1 min
WET 5 min
DRY 5 min
WET 10 min
DRY 10 min
0
1
2
3
4
5
6
7
338 675 1350 2700 5400
Log
10 R
edu
ctio
n
Concentration of Chlorine (ppm)
WET 1 min
DRY 1 min
WET 5 min
DRY 5 min
WET 10 min
DRY 10 min

130
A
B
Figure 9. Effectiveness of Accel (AHP) against MNV-1, (A) without soil load and (B) with soil
load, at 1, 5 and 10 minute contact times, under wet and dry load conditions.
WET refers to wet load conditions and DRY refers to dry load conditions.
0
1
2
3
4
5
6
7
1750 3500 7000 17500 35000
Log
10 R
edu
ctio
n
Concentration of AHP (ppm)
WET 1 min
DRY 1 min
WET 5 min
DRY 5 min
WET 10 min
DRY 10 min
0
1
2
3
4
5
6
7
1750 3500 7000 17500 35000
Log
10 R
edu
ctio
n
Concentration of AHP (ppm)
WET 1 min
DRY 1 min
WET 5 min
DRY 5 min
WET 10 min
DRY 10 min

131
A
B
Figure 10. Effectiveness of Accel (AHP) against FCV, (A) without soil load and (B) with soil
load, at 1, 5 and 10 minute contact times, under wet and dry load conditions.
WET refers to wet load conditions and DRY refers to dry load conditions.
0
1
2
3
4
5
6
7
438 875 1750 3500 7000 17500 35000
Log
10 R
edu
ctio
n
Concentration of AHP (ppm)
WET 1 min
DRY 1 min
WET 5 min
DRY 5 min
WET 10 min
DRY 10 min
0
1
2
3
4
5
6
7
219 438 875 1750 3500 7000 17500 35000
Log
10 R
edu
ctio
n
Concentration of AHP (ppm)
WET 1 min
DRY 1 min
WET 5 min
DRY 5 min
WET 10 min
DRY 10 min

132
Figure 11. Effectiveness of CaviCide (QUAT), Virox 5 (AHP) and T36 (QUAT-alcohol) against
MNV-1 (without soil load) at 1, 5 and 10 minute contact times, under wet and dry load
conditions.
CAV refers to CaviCide, VIR refers to Virox 5 and T36 refers to T36. WET refers to wet load
conditions and DRY refers to dry load conditions.
Figure 12. Effectiveness of Virox 5 (AHP) against MNV-1 (with soil load) at 1, 5 and 10 minute
contact times, under wet and dry load conditions.
WET refers to wet load conditions and DRY refers to dry load conditions.
0
1
2
3
4
5
6
7
0 2 4 6 8 10 12
Log
10 R
edu
ctio
n
Time (min)
T36 - WET
T36 - DRY
CAV - WET
CAV - DRY
VIR - WET
VIR - DRY
0
1
2
3
4
5
6
7
0 2 4 6 8 10 12
Log
10 R
edu
ctio
n
Time (min)
WET
DRY

133
Figure 13. Effectiveness of CaviCide (QUAT), Virox 5 (AHP) and T36 (QUAT-alcohol) against
FCV (without soil load) at 1, 5 and 10 minute contact times, under wet and dry load conditions.
CAV refers to CaviCide, VIR refers to Virox 5 and T36 refers to T36. WET refers to wet load
conditions and DRY refers to dry load conditions.
Figure 14. Effectiveness of Virox 5 (AHP) against FCV (with soil load) at 1, 5 and 10 minute
contact times, under wet and dry load conditions.
WET refers to wet load conditions and DRY refers to dry load conditions.
0
1
2
3
4
5
6
7
0 2 4 6 8 10 12
Log
10 R
edu
ctio
n
Time (min)
CAV-WET
CAV-DRY
VIR-WET
VIR-DRY
T36-WET
T36-DRY
0
1
2
3
4
5
6
7
0 2 4 6 8 10 12
Log
10 R
edu
ctio
n
Time (min)
WET
DRY

134
Table 6. Cytotoxicity control test of RAW 264.7 macrophage mouse and CRFK cells from
exposure to selected disinfectants and reagents.
Test Test formulation or reagent selected Dilution Cytotoxicity observed*
50 µL 950 µL RAW 264.7
cells
CRFK cells
Disinfectant
(without
neutralizer)
Accel (1/2 dilution)a
Accel (1/4 dilution)b
Bleach (1/10 dilution)c
CaviCide
Virox 5
T36
T36
d
EBSS
EBSS
EBSS
EBSS
EBSS
EBSS
EBSSd
10-1
10-1
10-1
10-1
10-2
10-1
10-1
10-2
10-3
10-1
10-2
<10 %
No
No
100 %
No
No
NT
100 %
No
100 %
No
80-90 %
NT
No
No
NT
No
No
No
NT
No
NT
Disinfectant
+ neutralizer
Accel (1/2 dilution)a
Accel (1/4 dilution)b
Bleach (1/10 dilution)c
CaviCide
Virox 5
T36
T36
d
LBf
LBf
STe
LBf
LBf
LBf
LBd,f
10-1
10-1
10-1
10-1
10-2
10-1
10-1
10-2
10-3
10-1
10-2
No
No
No
100 %
No
No
NT
100 %
No
100 %
No
<10 %
No
No
No
NT
No
No
No
NT
No
NT
Neutralizer STe
LBf
EBSS
EBSS
10-1
10-1
No
No
No
No
Soil load Soil load mixture EBSS 10-1
No No
Control EBSS EBSS 10-1
No No
*All trials were performed in triplicate. NT refers to not tested. aAccel (1/2 dilution) was at 35000 ppm.
bAccel (1/4 dilution) was at 17500 ppm.
cBleach refers to Domestic Miraclean sodium hypochlorite at 1/10 dilution or 5400 ppm.
dT
36 was tested at 20 µL instead of 50 µL, and EBSS and LB was tested at 980 µL instead of
950 µL. eST refers to sodium thiosulphate neutralizer.
fLB refers to letheen broth neutralizer.

135
Table 7. Interference with virus infectivity control test of MNV-1 and FCV to infect host cells
RAW 264.7 macrophage mouse and CRFK cells from exposure to selected disinfectants and
reagents.
Test Test formulation or reagent selected Dilution Interference observed*
50 µL 950 µL MNV-1 FCV
Disinfectant
(without
neutralizer)
Accel (1/2 dilution)a
Accel (1/4 dilution)b
Bleach (1/10 dilution)c
CaviCide
Virox 5
T36
T36
d
EBSS
EBSS
EBSS
EBSS
EBSS
EBSS
EBSSd
10-1
10-1
10-1
10-1
10-2
10-1
10-1
10-1
10-2
CTE
Yesg
No
NT
No
No
NT
NT
No
CTE
NT
Yesg
No
NT
No
No
No
NT
Disinfectant
+ neutralizer
Accel (1/2 dilution)a
Accel (1/4 dilution)b
Bleach (1/10 dilution)c
CaviCide
Virox 5
T36
T36
d
LBf
LBf
STe
LBf
LBf
LBf
LBd,f
10-1
10-1
10-1
10-1
10-2
10-1
10-1
10-1
10-2
Yesg
Yesg
No
NT
No
No
NT
NT
No
No
NT
No
No
NT
Yesg
Yesg
No
NT
Neutralizer STe
LBf
EBSS
EBSS
10-1
10-1
No
No
No
No
Soil load Soil load mixture EBSS 10-1
No No
Control EBSS EBSS 10-1
NA NA
*All trials were performed in triplicate. NT refers to not tested. NA refers to not applicable. Host
cell for MNV-1 was RAW 264.7 macrophage mouse cells and host cell for FCV was CRFK
cells. CTE refers to cytotoxic effects. aAccel (1/2 dilution) was at 35000 ppm.
bAccel (1/4 dilution) was at 17500 ppm.
cBleach refers to Domestic Miraclean sodium hypochlorite at 1/10 dilution or 5400 ppm.
dT
36 was tested at 20 µL instead of 50 µL, and EBSS and LB was tested at 980 µL instead of
950 µL. eST refers to sodium thiosulphate neutralizer.
fLB refers to letheen broth neutralizer.
gInterference observed that was positive was statistically significant (p < 0.05).
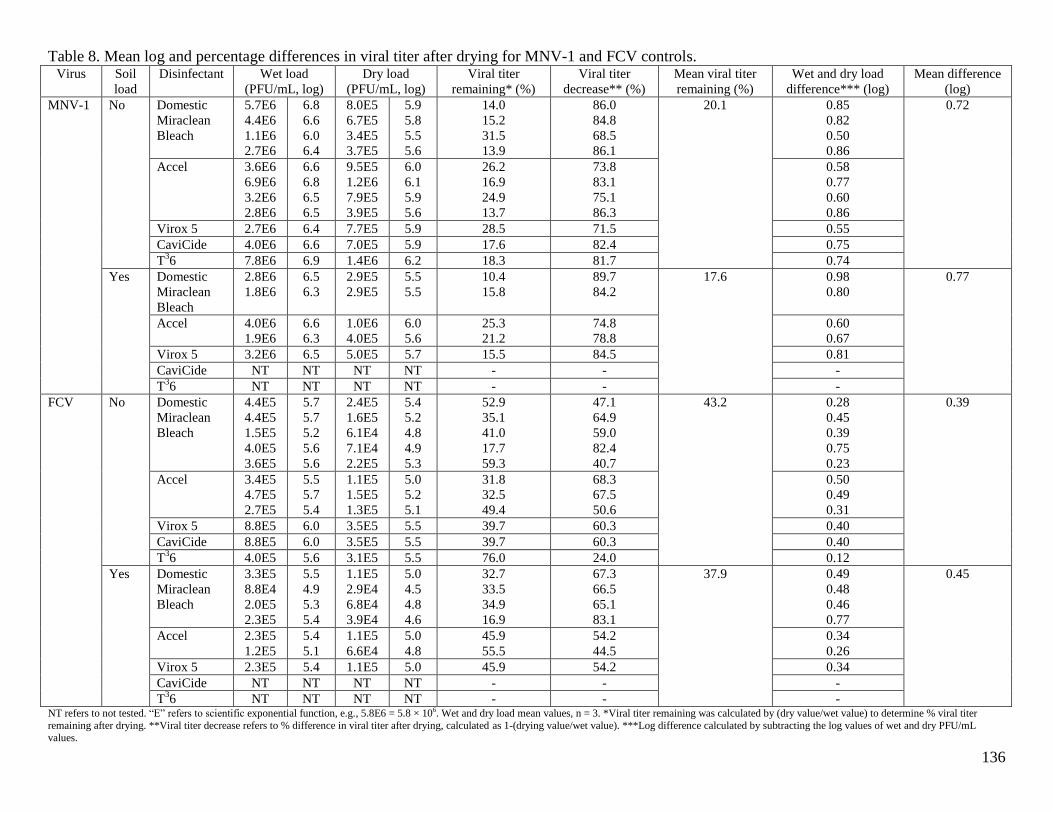
136
Table 8. Mean log and percentage differences in viral titer after drying for MNV-1 and FCV controls. Virus Soil
load
Disinfectant Wet load
(PFU/mL, log)
Dry load
(PFU/mL, log)
Viral titer
remaining* (%)
Viral titer
decrease** (%)
Mean viral titer
remaining (%)
Wet and dry load
difference*** (log)
Mean difference
(log)
MNV-1 No Domestic
Miraclean
Bleach
5.7E6
4.4E6
1.1E6
2.7E6
6.8
6.6
6.0
6.4
8.0E5
6.7E5
3.4E5
3.7E5
5.9
5.8
5.5
5.6
14.0
15.2
31.5
13.9
86.0
84.8
68.5
86.1
20.1 0.85
0.82
0.50
0.86
0.72
Accel 3.6E6
6.9E6
3.2E6
2.8E6
6.6
6.8
6.5
6.5
9.5E5
1.2E6
7.9E5
3.9E5
6.0
6.1
5.9
5.6
26.2
16.9
24.9
13.7
73.8
83.1
75.1
86.3
0.58
0.77
0.60
0.86
Virox 5 2.7E6 6.4 7.7E5 5.9 28.5 71.5 0.55
CaviCide 4.0E6 6.6 7.0E5 5.9 17.6 82.4 0.75
T36 7.8E6 6.9 1.4E6 6.2 18.3 81.7 0.74
Yes Domestic
Miraclean
Bleach
2.8E6
1.8E6
6.5
6.3
2.9E5
2.9E5
5.5
5.5
10.4
15.8
89.7
84.2
17.6 0.98
0.80
0.77
Accel 4.0E6
1.9E6
6.6
6.3
1.0E6
4.0E5
6.0
5.6
25.3
21.2
74.8
78.8
0.60
0.67
Virox 5 3.2E6 6.5 5.0E5 5.7 15.5 84.5 0.81
CaviCide NT NT NT NT - - -
T36 NT NT NT NT - - -
FCV No Domestic
Miraclean
Bleach
4.4E5
4.4E5
1.5E5
4.0E5
3.6E5
5.7
5.7
5.2
5.6
5.6
2.4E5
1.6E5
6.1E4
7.1E4
2.2E5
5.4
5.2
4.8
4.9
5.3
52.9
35.1
41.0
17.7
59.3
47.1
64.9
59.0
82.4
40.7
43.2 0.28
0.45
0.39
0.75
0.23
0.39
Accel 3.4E5
4.7E5
2.7E5
5.5
5.7
5.4
1.1E5
1.5E5
1.3E5
5.0
5.2
5.1
31.8
32.5
49.4
68.3
67.5
50.6
0.50
0.49
0.31
Virox 5 8.8E5 6.0 3.5E5 5.5 39.7 60.3 0.40
CaviCide 8.8E5 6.0 3.5E5 5.5 39.7 60.3 0.40
T36 4.0E5 5.6 3.1E5 5.5 76.0 24.0 0.12
Yes Domestic
Miraclean
Bleach
3.3E5
8.8E4
2.0E5
2.3E5
5.5
4.9
5.3
5.4
1.1E5
2.9E4
6.8E4
3.9E4
5.0
4.5
4.8
4.6
32.7
33.5
34.9
16.9
67.3
66.5
65.1
83.1
37.9 0.49
0.48
0.46
0.77
0.45
Accel 2.3E5
1.2E5
5.4
5.1
1.1E5
6.6E4
5.0
4.8
45.9
55.5
54.2
44.5
0.34
0.26
Virox 5 2.3E5 5.4 1.1E5 5.0 45.9 54.2 0.34
CaviCide NT NT NT NT - - -
T36 NT NT NT NT - - -
NT refers to not tested. “E” refers to scientific exponential function, e.g., 5.8E6 = 5.8 × 10⁶. Wet and dry load mean values, n = 3. *Viral titer remaining was calculated by (dry value/wet value) to determine % viral titer
remaining after drying. **Viral titer decrease refers to % difference in viral titer after drying, calculated as 1-(drying value/wet value). ***Log difference calculated by subtracting the log values of wet and dry PFU/mL
values.

137
Table 9. Summary of the most effective concentrations and contact times of commonly used disinfectants against MNV-1 and FCV, surrogates of
human norovirus, with and without soil load.
Disinfectant
Wet and dry load range (log10 reduction)a, concentration (ppm) and contact time (min)
MNV-1 FCV
Without soil load With soil load Without soil load With soil load
Domestic Miraclean
Bleach 6.76, 5.90
2700 ppm, 1 min 6.44, 6.68
5400 ppm, 1 min 5.65, 5.37
5400 ppm, 1 min 5.29, 4.83 2700 ppm, 5 min
6.03, 5.53
1350 ppm, 5 min 6.45, 5.47
1350 ppm, 5 min
4.61, 4.85
1350 ppm, 5 min
6.43, 5.57
675 ppm, 10 min 5.56, 5.33
1350 ppm, 10 min 5.36, 4.59
1350 ppm, 10 min
Accel 6.45, 5.59 (est)
35000 ppm, 10 min
6.28, 5.60 (est)
35000 ppm, 10 min
5.67, 5.18
1750 ppm, 5 min
5.08, 4.82
7000 ppm, 5 min
5.08, 4.82
3500 ppm, 10 min
Virox 5 2.64, 0.96
5000 ppm, 10 min
0.82, 0.87
5000 ppm, 10 min 5.94, 5.54
5000 ppm, 10 min 5.36, 5.02
5000 ppm, 10 min
CaviCide 1.96, 3.24
2800 ppm, 10 min
NT 3.62, 3.29
2800 ppm, 10 min
NT
T36 6.89, 6.16 (est)
2000 ppm, 70 % ethanol, 5 min
NT 2.42, 2.90
2000 ppm, 70 % ethanol, 10 min
NT
Bold mean values refer to inactivation with no virus plaques observed. Experimental trials performed in triplicate. aLog10 reduction refers to “wet load, dry load” conditions.
NT refers to not tested. Est refers to estimated value.

138
Table 10. Virucidal efficacy of commonly used disinfectants against MNV-1, a surrogate of human norovirus, under wet and dry load conditions,
with and without soil load, at 1, 5 and 10 minute contact times.
Disinfectant Dilution Concentration
(ppm)
Log10 reduction
Wet load conditions Dry load conditions
Without soil load With soil load Without soil load With soil load
Contact time (min) Contact time (min)
1 5 10 1 5 10 1 5 10 1 5 10
Domestic
Miraclean
Bleach
1/10 5400 6.76 6.03 6.43 6.44 6.45 6.26 5.90 5.53 5.57 6.68 5.47 5.46
1/20 2700 6.76 6.03 6.43 6.44 6.45 6.26 5.90 5.53 5.57 5.86 5.47 5.46
1/40 1350 4.75 6.03 6.43 4.83 6.45 6.26 2.14 5.53 5.57 3.43 5.47 5.46
1/80 675 1.91 4.13 6.43 4.03 5.62 6.26 1.40 4.41 5.57 1.80 4.34 4.63
1/160 338 1.02 2.03 4.17 1.53 2.72 4.05 0.47 2.50 3.47 1.49 2.69 4.33
1/320 169 0.60 0.90 1.70 0.54 1.37 2.23 0.36 0.57 1.97 1.18 0.75 2.27
1/640 84 0.58 0.57 0.53 NT 0.41 0.61 0.11 -0.12 0.17 NT 0.03 0.96
1/1280 42 NT NT 0.30 NT NT NT NT NT 0.12 NT NT NT
Accel 1/2 35000 1.78 6.84* 6.45* 1.22 6.61* 6.28* 1.52 3.83 5.59 0.72 4.18 5.60
1/4 17500 0.88 3.37 5.31 0.55 2.21 3.49 0.49 2.47 4.34 0.08 1.75 3.55
1/10 7000 0.57 1.84 3.39 NT 1.29 1.35 0.10 0.98 1.39 NT 0.62 1.01
1/20 3500 0.49 0.93 1.80 NT 0.56 0.69 0.10 0.54 0.86 NT 0.22 0.52
1/40 1750 0.28 0.42 0.58 NT NT 0.52 0.10 0.19 0.42 NT NT 0.17
Virox 5 Undiluted 5000 0.49 1.37 2.65 0.43 0.78 0.82 0.12 0.76 0.96 -0.10 0.27 0.87
CaviCide Undiluted 2800 0.68 1.65 1.96 NT NT NT 0.95 1.66 3.24 NT NT NT
T36 Undiluted 2000 6.89* 6.89* 6.89* NT NT NT 2.97 6.16 6.16 NT NT NT
Bold mean values refer to inactivation of the surrogate virus. Experimental trials were performed in triplicate.
NT refers to not tested. *Refers to estimated value.
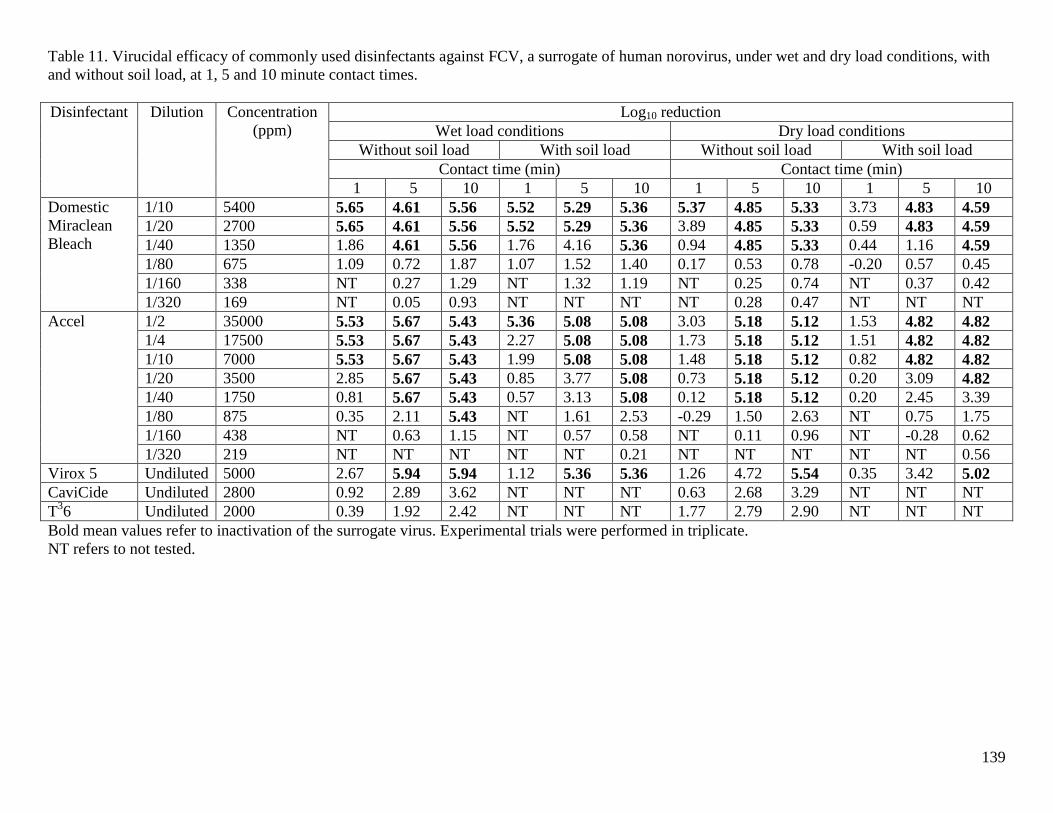
139
Table 11. Virucidal efficacy of commonly used disinfectants against FCV, a surrogate of human norovirus, under wet and dry load conditions, with
and without soil load, at 1, 5 and 10 minute contact times.
Disinfectant Dilution Concentration
(ppm)
Log10 reduction
Wet load conditions Dry load conditions
Without soil load With soil load Without soil load With soil load
Contact time (min) Contact time (min)
1 5 10 1 5 10 1 5 10 1 5 10
Domestic
Miraclean
Bleach
1/10 5400 5.65 4.61 5.56 5.52 5.29 5.36 5.37 4.85 5.33 3.73 4.83 4.59
1/20 2700 5.65 4.61 5.56 5.52 5.29 5.36 3.89 4.85 5.33 0.59 4.83 4.59
1/40 1350 1.86 4.61 5.56 1.76 4.16 5.36 0.94 4.85 5.33 0.44 1.16 4.59
1/80 675 1.09 0.72 1.87 1.07 1.52 1.40 0.17 0.53 0.78 -0.20 0.57 0.45
1/160 338 NT 0.27 1.29 NT 1.32 1.19 NT 0.25 0.74 NT 0.37 0.42
1/320 169 NT 0.05 0.93 NT NT NT NT 0.28 0.47 NT NT NT
Accel 1/2 35000 5.53 5.67 5.43 5.36 5.08 5.08 3.03 5.18 5.12 1.53 4.82 4.82
1/4 17500 5.53 5.67 5.43 2.27 5.08 5.08 1.73 5.18 5.12 1.51 4.82 4.82
1/10 7000 5.53 5.67 5.43 1.99 5.08 5.08 1.48 5.18 5.12 0.82 4.82 4.82
1/20 3500 2.85 5.67 5.43 0.85 3.77 5.08 0.73 5.18 5.12 0.20 3.09 4.82
1/40 1750 0.81 5.67 5.43 0.57 3.13 5.08 0.12 5.18 5.12 0.20 2.45 3.39
1/80 875 0.35 2.11 5.43 NT 1.61 2.53 -0.29 1.50 2.63 NT 0.75 1.75
1/160 438 NT 0.63 1.15 NT 0.57 0.58 NT 0.11 0.96 NT -0.28 0.62
1/320 219 NT NT NT NT NT 0.21 NT NT NT NT NT 0.56
Virox 5 Undiluted 5000 2.67 5.94 5.94 1.12 5.36 5.36 1.26 4.72 5.54 0.35 3.42 5.02
CaviCide Undiluted 2800 0.92 2.89 3.62 NT NT NT 0.63 2.68 3.29 NT NT NT
T36 Undiluted 2000 0.39 1.92 2.42 NT NT NT 1.77 2.79 2.90 NT NT NT
Bold mean values refer to inactivation of the surrogate virus. Experimental trials were performed in triplicate.
NT refers to not tested.

140
CHAPTER 4 Conclusion and Recommendations for Future Work
In summary, several disinfectants including Domestic Miraclean Bleach (sodium hypochlorite)
at 5400 ppm after 1 minute (with soil load) or 1350 ppm after 5 minutes (with or without soil
load), Accel at 35000 ppm after 10 minutes (with or without soil load), and T36 at 2000 ppm
after 10 minutes (without soil load) inactivated the virus and produced a ~5.5 to 6.8 log10
reduction in MNV-1 titer. For FCV, disinfectants including Domestic Miraclean Bleach at
2700 ppm after 5 minutes (with soil load) or 1350 ppm after 10 minutes (with or without soil
load), Accel at 7000 ppm after 5 minutes (with soil load), 1750 ppm after 5 minutes (without soil
load) or 3500 ppm after 10 minutes (with soil load), and Virox 5 at 5000 ppm after 10 minutes
(with or without soil load) inactivated the virus, producing a ~4.6 to 5.9 log10 reduction in FCV
titer. An unexpected finding was the resistance of MNV-1 towards AHP-based disinfectants and
the sensitivity of MNV-1 towards disinfectants containing 70 % ethanol, compared to FCV
which showed a completely opposite outcome when exposed to both disinfectants, where FCV
was sensitive towards AHP-based products but not products containing 70 % ethanol. Due to the
sensitivities of MNV-1 and RAW 264.7 macrophage mouse cells towards alcohol and the lack of
a neutralizer, it was difficult to accurately determine MNV-1 survivors after exposure to alcohol.
The results presented in this study relating to disinfectants containing alcohol (CaviCide and
T36) and Accel at 35000 ppm only offer an estimate of the MNV-1 viral titer remaining after
exposure to the disinfectants. It is important to note that these differences in susceptibility of
both surrogate viruses, especially alcohol sensitivity, may lead to different interpretations as to
which disinfectants are most effective in killing human norovirus, and because of these
differences, it may be important to continue using both surrogate viruses for in vitro testing to
provide a more reliable estimate of the effectiveness of disinfectants against human norovirus.
141
In particular, the most resistant norovirus surrogate viruses should be used for selected
disinfectant products. For example, it may be wise to use MNV-1 as the surrogate virus for
disinfectant studies involving AHP-based disinfectants, and FCV for alcohol-based disinfectant
studies. Based on these findings, the most effective disinfectant capable of inactivating both
surrogates of norovirus on stainless steel surfaces in the absence of a pre-rinsing and/or pre-
cleaning step is sodium hypochlorite at concentrations of between 1350 and 5400 ppm and at
recommended contact times of between 5 and 10 minutes, depending on the contact time allowed
and the amount of soil load present on the environmental surface. As MNV-1 was observed to
be more sensitive to disinfectants containing an ethanol content of 70 % than FCV, more studies
are needed to provide a better understanding of the efficacy and significance of alcohol-based
disinfectants and handrubs against MNV-1, FCV and human norovirus.

142
BIBLIOGRAPHY
Aidaros, H., & Gaudin, O. G. (1983). A gel filtration method to test the efficiency of virucidal
disinfectants. Comparative Immunology, Microbiology and Infectious Diseases, 6, 221-226.
American Type Culture Collection. (2012a). ATCC number CCL-94. Retrieved from
http://www.atcc.org/ATCCAdvancedCatalogSearch/ProductDetails/tabid/452/Default.aspx?ATC
CNum=CCL-94&Template=cellBiology on December 8, 2008.
American Type Culture Collection. (2012b). ATCC number TIB-71. Retrieved from
http://www.atcc.org/ATCCAdvancedCatalogSearch/ProductDetails/tabid/452/Default.aspx?ATC
CNum=TIB-71&Template=cellBiology on December 8, 2008.
American Type Culture Collection. (2012c). ATCC number VR-782. Retrieved from
http://www.atcc.org/ATCCAdvancedCatalogSearch/ProductDetails/tabid/452/Default.aspx?ATC
CNum=VR-782&Template=animalVirology on December 8, 2008.
Association of Official Analytical Chemists. (1975). Official Methods of Analysis of the
Association of Official Analytical Chemists (12th ed.). Washington, DC: Association of Official
Analytical Chemists.
ASTM International. (1998). ASTM E1482 – 04 standard test method for neutralization of
virucidal agents in virucidal efficacy evaluations. West Conshohocken, PA.
Atmar, R. L., Bernstein, D. I., Harro, C. D., Al-Ibrahim, M. S., Chen, W. H., Ferreira, J., Estes,
M. K., Graham, D. Y., Opekun, A. R., Richardson, C., & Mendelman, P. M. (2011). Norovirus
vaccine against experimental human Norwalk virus illness. The New England Journal of
Medicine, 365, 2178-2187.
Bae, J., & Schwab, K. J. (2008). Evaluation of murine norovirus, feline calicivirus, poliovirus,
and MS2 as surrogates for human norovirus in a model of viral persistence in surface water and
groundwater. Applied and Environmental Microbiology, 74, 477-484.
Baert, L., Wobus, C. E., Coillie, E. V., Thackray, L. B., Debevere, J., & Uyttendaele, M. (2008).
Detection of murine norovirus 1 by using plaque assay, transfection assay, and real-time reverse
transcription-PCR before and after heat exposure. Applied and Environmental Microbiology, 74,
543-546.
Ball, J. M., Graham, D. Y., Opekun, A. R., Gilger, M. A., Guerrero, R. A., & Estes, M. K.
(1999). Recombinant Norwalk virus-like particles given orally to volunteers: Phase I study.
Gastroenterology, 117, 40-48.
Barker, J., Vipond, I. B., & Bloomfield, S. F. (2004). Effects of cleaning and disinfection in
reducing the spread of norovirus contamination via environmental surfaces. Journal of Hospital
Infection, 58, 42-49.

143
Belliot, G., Lavaux, A., Souihel, D., Agnello, D., & Pothier, P. (2008). Use of murine norovirus
as a surrogate to evaluate resistance of human norovirus to disinfectants. Applied and
Environmental Microbiology, 74, 3315-3318.
Bergdoll, M. S. (1989). Staphylococcus aureus. In M. P. Doyle (Ed.), Foodborne Bacterial
Pathogens (pp. 463-523). New York, NY: Marcel Dekker, Inc.
Bidawid, S., Farber, J. M., & Sattar, S. A. (2000). Contamination of foods by food handlers:
experiments on hepatitis A virus transfer to food and its interruption. Applied and Environmental
Microbiology, 66, 2759-2763.
Bidawid, S., Malik, N., Adegbunrin, O., Sattar, S. A., & Farber, J. M. (2003). A feline kidney
cell line-based plaque assay for feline calicivirus, a surrogate for Norwalk virus. Journal of
Virological Methods, 107, 163-167.
Boxman, I., Dijkman, R., Verhoef, L., Maat, A., van Dijk, G., Vennema, H., & Koopmans, M.
(2009). Norovirus on swabs taken from hands illustrate route of transmission: a case study.
Journal of Food Protection, 72, 1753-1755.
British Columbia Centre for Disease Control. (2011). Communicable disease control:
management of gastrointestinal illness outbreaks in child care facilities, January 2011. Retrieved
from http://www.bccdc.ca/NR/rdonlyres/E6320AA6-FEC7-42AC-840B-
3721A106FE80/0/CCFOutbreakguidelines.pdf on July 12, 2012.
Calderon-Margalit, R., Sheffer, R., Halperin, T., Orr, N., Cohen, D., & Shohat, T. (2005). A
large-scale gastroenteritis outbreak associated with norovirus in nursing homes. Epidemiology
and Infection, 133, 35-40.
Cannon, J. L., Papafragkou, E., Park, G. W., Osborne, J., Jaykus, L.-A., & Vinjé, J. (2006).
Surrogates for the study of norovirus stability and inactivation in the environment: a comparison
of murine norovirus and feline calicivirus. Journal of Food Protection, 69, 2761-2765.
Carter, M. J., Milton, I. D., Meanger, J., Bennett, M., Gaskell, R. M., & Turner, P. C. (1992).
The complete nucleotide sequence of a feline calicivirus. Virology, 190, 443-448.
Caul, E. O. (1994). Small round structured viruses: airborne transmission and hospital control.
The Lancet, 343, 1240-1242.
Centers for Disease Control and Prevention. (2010). Surveillance for foodborne disease
outbreaks - United States, 2007. Morbidity and Mortality Weekly Report, 59, 973-979. Retrieved
from http://www.cdc.gov/mmwr/pdf/wk/mm5931.pdf on December 30, 2012.
Centers for Disease Control and Prevention. (2011a). CDC estimates of foodborne illness in the
United States. Retrieved from http://www.cdc.gov/foodborneburden/2011-foodborne-
estimates.html on August 5, 2012.

144
Centers for Disease Control and Prevention. (2011b). Guideline for the prevention and control of
norovirus gastroenteritis outbreaks in healthcare settings. Retrieved from
http://www.cdc.gov/hicpac/pdf/norovirus/Norovirus-Guideline-2011.pdf on February 23, 2012.
Centers for Disease Control and Prevention. (2011c). Updated norovirus outbreak management
and disease prevention guidelines. Morbidity and Mortality Weekly Report, 60, 1-15. Retrieved
from http://www.cdc.gov/mmwr/pdf/rr/rr6003.pdf on February 23, 2012.
Chadwick, P. R., Beards, G., Brown, D., Caul, E. O., Cheesbrough, J., Clarke, I., Curry, A.,
O’Brien, S., Quigley, K., Sellwood, J., & Westmoreland, D. (2000). Management of hospital
outbreaks of gastro-enteritis due to small round structured viruses. Journal of Hospital Infection,
45, 1-10.
Cheesbrough, J. S., Green, J., Gallimore, C. I., Wright, P. A., & Brown, D. W. G. (2000).
Widespread environmental contamination with Norwalk-like viruses (NLV) detected in a
prolonged hotel outbreak of gastroenteritis. Epidemiology and Infection, 125, 93-98.
Cheng, P. K. C., Wong, D. K. K., Chung, T. W. H., & Lim, W. W. L. (2005). Norovirus
contamination found in oysters worldwide. Journal of Medical Virology, 76, 593-597.
Clay, S., Maherchandani, S., Malik, Y. S., & Goyal, S. M. (2006). Survival on uncommon
fomites of feline calicivirus, a surrogate of noroviruses. American Journal of Infection Control,
34, 41-43.
Conner, D. E., & Kotrola, J. S. (1995). Growth and survival of Escherichia coli O157:H7 under
acidic conditions. Applied and Environmental Microbiology, 61, 382-385.
Coyne, K. P., Reed, F. C., Porter, C. J., Dawson, S., Gaskell, R. M., & Radford, A. D. (2006).
Recombination of feline calicivirus within an endemically infected cat colony. Journal of
General Virology, 87, 921-926.
Denyer, S. P., & Stewart, G. S. A. B. (1998). Mechanisms of action of disinfectants.
International Biodeterioration and Biodegradation, 41, 261-268.
Donaldson, E. F., Lindesmith, L. C., LoBue, A. D., & Baric, R. S. (2010). Viral shape-shifting:
norovirus evasion of the human immune system. Nature Reviews Microbiology, 8, 231-241.
Doultree, J. C., Druce, J. D., Birch, C. J., Bowden, D. S., & Marshall, J. A. (1999). Inactivation
of feline calicivirus, a Norwalk virus surrogate. Journal of Hospital Infection, 41, 51-57.
Dourou, D., Beauchamp, C. S., Yoon, Y., Geornaras, I., Belk, K. E., Smith, G. C., Nychas, G.-J.
E., & Sofos, J. N. (2011). Attachment and biofilm formation by Escherichia coli O157:H7 at
different temperatures, on various food-contact surfaces encountered in beef processing.
International Journal of Food Microbiology, 149, 262-268.

145
Duffy, G. (2006). Emerging pathogenic E. coli. In Motarjemi, Y., & Adams, M. (Ed.), Emerging
foodborne pathogens (pp. 253-281). Cambridge, England: Woodhead Publishing Limited.
Duizer, E., Schwab, K. J., Neill, F. H., Atmar, R. L., Koopmans, M. P. G., & Estes, M. K.
(2004). Laboratory efforts to cultivate noroviruses. Journal of General Virology, 85, 79-87.
Estes, M. K., Ball, J. M., Guerrero, R. A., Opekun, A. R., Gilger, M. A., Pacheco, S. S., &
Graham, D. Y. (2000). Norwalk virus vaccines: challenges and progress. The Journal of
Infectious Diseases, 181, S367-S373.
Estes, M. K., Prasad, B. V. V., & Atmar, R. L. (2006). Noroviruses everywhere: has something
changed? Current Opinion in Infectious Diseases, 19, 467-474.
Fastier, L. B. (1957). A new feline virus isolated in tissue culture. American Journal of
Veterinary Research, 67, 382-389.
Frank, J. F., & Chmielewski, R. A. N. (1997). Effectiveness of sanitation with quaternary
ammonium compound or chlorine on stainless steel and other domestic food-preparation
surfaces. Journal of Food Protection, 60, 43-47.
Fretz, R., Svoboda, P., Lüthi, T. M., Tanner, M., & Baumgartner, A. (2005). Outbreaks of
gastroenteritis due to infections with norovirus in Switzerland, 2001-2003. Epidemiology &
Infection, 133, 429-437.
Fuster-Valls, N., Hernández-Herrero, M., Marín-de-Mateo, M., & Rodríguez-Jerez, J. J. (2008).
Effect of different environmental conditions on the bacteria survival on stainless steel surfaces.
Food Control, 19, 308-314.
Ganguli, P. S., Chen, W., & Yates, M. V. (2011). Detection of murine norovirus-1 by using TAT
peptide-delivered molecular beacons. Applied and Environmental Microbiology, 77, 5517-5520.
Garcia, L. S. (Eds.). (2010). Clinical Microbiology Procedures Handbook (3rd ed.). Washington,
DC: American Society for Microbiology.
Gehrke, C., Steinmann, J., & Goroncy-Bermes, P. (2004). Inactivation of feline calicivirus, a
surrogate of norovirus (formerly Norwalk-like viruses), by different types of alcohol in vitro and
in vivo. Journal of Hospital Infection, 56, 49-55.
Gélinas, P., & Goulet, J. (1983). Neutralization of the activity of eight disinfectants by organic
matter. Journal of Applied Bacteriology, 54, 243-247.
Gibson, K. E., & Schwab, K. J. (2011). Thermal inactivation of human norovirus surrogates.
Food and Environmental Virology, 3, 74-77.
Gibson, K. E., Crandall, P. G., & Ricke, S. C. (2012). Removal and transfer of viruses on food
contact surfaces by cleaning cloths. Applied and Environmental Microbiology, 78, 3037-3044.
146
Girard, M., Ngazoa, S., Mattison, K., & Jean, J. (2010). Attachment of noroviruses to stainless
steel and their inactivation, using household disinfectants. Journal of Food Protection, 73, 400-
404.
Gonin, P., Couillard, M., & d’Halewyn, M.-A. (2000). Genetic diversity and molecular
epidemiology of Norwalk-like viruses. The Journal of Infectious Diseases, 182, 691-697.
Goodridge, L., Goodridge, C., Wu, J., Griffiths, M., & Pawliszyn, J. (2004). Isoelectric point
determination of norovirus virus-like particles by capillary isoelectric focusing with whole
column imaging detection. Analytical Chemistry, 76, 48-52.
Green, K. Y., Ando, T., Balayan, M. S., Berke, T., Clarke, I. N., Estes, M. K., Matson, D. O.,
Nakata, S., Neill, J. D., Studdert, M. J., & Thiel, H.-J. (2000). Taxonomy of the caliciviruses.
The Journal of Infectious Diseases, 181, S322-S330.
Grist, N. R., Bell, E. J., Follett, E. A. C., & Urquhart, G. E. D. (1979). Diagnostic Methods in
Clinical Virology (3rd ed.). Oxford, England: Blackwell Scientific Publications.
Hardy, M. E. (2005). Norovirus protein structure and function. FEMS Microbiology Letters, 253,
1-8.
Harris, J. P., Edmunds, W. J., Pebody, R., Brown, D. W., & Lopman, B. A. (2008). Deaths from
norovirus among the elderly, England and Wales. Emerging Infectious Diseases, 14, 1546-1552.
Health Canada. (2010). Concentration of Norovirus Genogroups I and II from Contaminated
Oysters and their Detection using the Reverse-Transcriptase Polymerase Chain Reaction
(Laboratory Procedure OPFLP-01). Retrieved from http://www.hc-sc.gc.ca/fn-an/res-rech/analy-
meth/microbio/volume5/opflp_01-eng.php on February 6, 2011.
Horm, K. M., & D’Souza, D. H. (2011). Survival of human norovirus surrogates in milk, orange,
and pomegranate juice, and juice blends at refrigeration (4 °C). Food Microbiology, 28, 1054-
1061.
Hota, B. (2004). Contamination, disinfection, and cross-colonization: are hospital surfaces
reservoirs for nosocomial infection? Clinical Infectious Diseases, 39, 1182-1189.
Hsu, C. C., Riley, L. K., & Livingston, R. S. (2007). Molecular characterization of three novel
murine noroviruses. Virus Genes, 34, 147-155.
Hudson, J. B., Sharma, M., & Petric, M. (2007). Inactivation of norovirus by ozone gas in
conditions relevant to healthcare. Journal of Hospital Infection, 66, 40-45.
Hurley, K. E., Pesavento, P. A., Pedersen, N. C., Poland, A. M., Wilson, E., & Foley, J. E.
(2004). An outbreak of virulent systemic feline calicivirus disease. Journal of the American
Veterinary Medical Association, 224, 241-249.

147
Hutson, A. M., Atmar, R. L., Graham, D. Y., & Estes, M. K. (2002). Norwalk virus infection and
disease is associated with ABO histo-blood group type. The Journal of Infectious Diseases, 185,
1335-1337.
Hutson, A. M., Atmar, R. L., & Estes, M. K. (2004). Norovirus disease: changing epidemiology
and host susceptibility factors. Trends in Microbiology, 12, 279-287.
Isakbaeva, E. T., Bulens, S. N., Beard, R. S., Adams, S., Monroe, S. S., Chaves, S. S.,
Widdowson, M.-A., & Glass, R. I. (2005). Norovirus and child care: challenges in outbreak
control. The Pediatric Infectious Disease Journal, 24, 561-563.
Jimenez, L., & Chiang, M. (2006). Virucidal activity of a quaternary ammonium compound
disinfectant against feline calicivirus: a surrogate for norovirus. American Journal of Infection
Control, 34, 269-273.
Kageyama, T., Kojima, S., Shinohara, M., Uchida, K., Fukushi, S., Hoshino, F. B., Takeda, N.,
& Katayama, K. (2003). Broadly reactive and highly sensitive assay for Norwalk-like viruses
based on real-time quantitative reverse transcription-PCR. Journal of Clinical Microbiology, 41,
1548-1557.
Kapikian, A. Z., Wyatt, R. G., Dolin, R., Thornhill, T. S., Kalica, A. R., & Chanock, R. M.
(1972). Visualization by immune election microscopy of a 27-nm particle associated with acute
infectious nonbacterial gastroenteritis. Journal of Virology, 10, 1075-1081.
Karst, S. M. (2010). Pathogenesis of noroviruses, emerging RNA viruses. Viruses, 2, 748-781.
Katayama, K., Shirato-Horikoshi, H., Kojima, S., Kageyama, T., Oka, T., Hoshino, F. B.,
Fukushi, S., Shinohara, M., Uchida, K., Suzuki, Y., Gojobori, T., & Takeda, N. (2002).
Phylogenetic analysis of the complete genome of 18 Norwalk-like viruses. Virology, 299, 225-
239.
Kojima, S., Kageyama, T., Fukushi, S., Hoshino, F. B., Shinohara, M., Uchida, K., Natori, K.,
Takeda, N., & Katayama, K. (2002). Genogroup-specific PCR primers for detection of Norwalk-
like viruses. Journal of Virological Methods, 100, 107-114.
Kreutz, L. C., & Seal, B. S. (1995). The pathway of feline calicivirus entry. Virus Research, 35,
63-70.
Kroneman, A., Harris, J., Vennema, H., Duizer, E., van Duynhoven, Y., Gray, J., Iturriza, M.,
Böttiger, B., Falkenhorst, G., Johnsen, C., von Bonsdorff, C.-H., Maunula, L., Kuusi, M.,
Pothier, P., Gallay, A., Schreier, E., Koch, J., Szücs, G., Reuter, G., Krisztalovics, K., Lynch, M.,
McKeown, P., Foley, B., Coughlan, S., Ruggeri, F. M., Di Bartolo, I., Vainio, K., Isakbaeva, E.,
Poljsak-Prijatelj, M., Hocevar Grom, A., Bosch, A., Buesa, J., Sanchez Fauquier, A., Hernandéz-
Pezzi, G., Hedlund, K.-O., & Koopmans, M. (2007). Data quality of 5 years of central norovirus
outbreak reporting in the European Network for food-borne viruses. Journal of Public Health,
30, 82-90.

148
Lages, S. L. S., Ramakrishnan, M. A., & Goyal, S. M. (2008). In-vivo efficacy of hand sanitizers
against feline calicivirus: a surrogate for norovirus. Journal of Hospital Infection, 68, 159-163.
Lamhoujeb, S., Fliss, I., Ngazoa, S. E., Jean, J. (2009). Molecular study of the persistence of
infectious human norovirus on food-contact surfaces. Food and Environmental Virology, 1, 51-
56.
Lay, M. K., Atmar, R. L., Guix, S., Bharadwaj, U., He, H., Neill, F. H., Sastry, K. J., Yao, Q., &
Estes, M. K. (2010). Norwalk virus does not replicate in human macrophages or dendritic cells
derived from the peripheral blood of susceptible humans. Virology, 406, 1-11.
Lees, D. (2000). Viruses and bivalve shellfish. International Journal of Food Microbiology, 59,
81-116.
Lindesmith, L., Moe, C., LePendu, J., Frelinger, J. A., Treanor, J., & Baric, R. S. (2005). Cellular
and humoral immunity following Snow Mountain Virus challenge. Journal of Virology, 79,
2900-2909.
Liu, P., Chien, Y.-W., Papafragkou, E., Hsiao, H.-M., Jaykus, L.-A., & Moe, C. (2009).
Persistence of human noroviruses on food preparation surfaces and human hands. Food and
Environmental Virology, 1, 141-147.
Liu, P., Yuen, Y., Hsiao, H.-M., Jaykus, L.-A., & Moe, C. (2010). Effectiveness of liquid soap
and hand sanitizer against Norwalk virus on contaminated hands. Applied and Environmental
Microbiology, 76, 394-399.
Lopman, B. A., Reacher, M. H., van Duijnhoven, Y., Hanon, F.-X., Brown, D., & Koopmans, M.
(2003). Viral gastroenteritis outbreaks in Europe, 1995-2000. Emerging Infectious Diseases, 9,
90-96.
Lopman, B. A., Reacher, M. H., Vipond, I. B., Sarangi, J., & Brown, D. W. G. (2004). Clinical
manifestation of norovirus gastroenteritis in health care settings. Clinical Infectious Diseases, 39,
318-324.
MacCannell, T., Umscheid, C. A., Agarwal, R. K., Lee, I., Kuntz, G., & Stevenson, K. B. (2011).
Guideline for the prevention and control of norovirus gastroenteritis outbreaks in healthcare
settings. Infection Control and Hospital Epidemiology, 32, 939-969.
Magulski, T., Paulmann, D., Bischoff, B., Becker, B., Steinmann, E., Steinmann, J., Goroncy-
Bermes, P., & Steinmann, J. (2009). Inactivation of murine norovirus by chemical biocides on
stainless steel. BMC Infectious Diseases, 9, 107.
Maillard, J.-Y. (2001). Virus susceptibility to biocides: an understanding. Reviews in Medical
Microbiology, 12, 63-74.

149
Malek, M., Barzilay, E., Kramer, A., Camp, B., Jaykus, L.-A., Escudero-Abarca, B., Derrick, G.,
White, P., Gerba, C., Higgins, C., Vinje, J., Glass, R., Lynch, M., & Widdowson, M.-A. (2009).
Outbreak of norovirus infection among river rafters associated with packaged delicatessen meat,
Grand Canyon, 2005. Clinical Infectious Diseases, 48, 31-37.
Malik, Y. S., Maherchandani, S., & Goyal, S. M. (2006). Comparative efficacy of ethanol and
isopropanol against feline calicivirus, a norovirus surrogate. American Journal of Infection
Control, 34, 31-35.
Marionneau, S., Ruvoën, N., Le Moullac-Vaidye, B., Clement, M., Cailleau-Thomas, A., Ruiz-
Palacois, G., Huang, P., Jiang, X., & Le Pendu, J. (2002). Norwalk virus binds to histo-blood
group antigens present on gastroduodenal epithelial cells of secretor individuals.
Gastroenterology, 122, 1967-1977.
Marriott, N. G., & Gravani, R. B. (2006). Principles of Food Sanitation (5th ed.). New York,
New York: Springer.
Marshall, J. A., & Bruggink, L. D. (2011). The dynamics of norovirus outbreak epidemics:
recent insights. International Journal of Environmental Research and Public Health, 8, 1141-
1149.
Matsui, S. M., & Greenberg, H. B. (2000). Immunity to calicivirus infection. The Journal of
Infectious Diseases, 181, S331-S335.
Mattison, K., Karthikeyan, K., Abebe, M., Malik, N., Sattar, S. A., Farber, J. M., & Bidawid, S.
(2007). Survival of calicivirus in foods and on surfaces: experiments with feline calicivirus as a
surrogate for norovirus. Journal of Food Protection, 70, 500-503.
Mattison, K., Grudeski, E., Auk, B., Charest, H., Drews, S. J., Fritzinger, A., Gregoricus, N.,
Hayward, S., Houde, A., Lee, B. E., Pang, X. L., Wong, J., Booth, T. F., & Vinjé, J. (2009).
Multicenter comparison of two norovirus ORF2-based genotyping protocols. Journal of Clinical
Microbiology, 47, 3927-3932.
Mattner, F., Sohr, D., Heim, A., Gastmeier, P., Vennema, H., & Koopmans, M. (2006). Risk
groups for clinical complications of norovirus infections: an outbreak investigation. Clinical
Microbiology and Infection, 12, 69-74.
Mbithi, J. N., Springthorpe, S., & Sattar, S. A. (1991). Effect of relative humidity and air
temperature on survival of hepatitis A virus on environmental surfaces. Applied and
Environmental Microbiology, 57, 1394-1399.
McBain, A. J., Ledder, R. G., Moore, L. E., Catrenich, C. E., & Gilbert, P. (2004). Effects of
quaternary-ammonium-based formulations on bacterial community dynamics and antimicrobial
susceptibility. Applied and Environmental Microbiology, 70, 3449-3456.

150
McDonnell, G., & Russell, A. D. (1999). Antiseptics and disinfectants: activity, action, and
resistance. Clinical Microbiology Reviews, 12, 147-179.
Moe, C. L. (2009). Preventing norovirus transmission: how should we handle food handlers?
Clinical Infectious Diseases, 48, 38-40.
Mounts, A. W., Ando, T., Koopmans, M., Bresee, J. S., Noel, J., & Glass, R. I. (2000). Cold
weather seasonality of gastroenteritis associated with Norwalk-like viruses. The Journal of
Infectious Diseases, 181, S284-287.
Neely, A. N., & Maley, M. P. (2000). Survival of enterococci and staphylococci on hospital
fabrics and plastic. Journal of Clinical Microbiology, 38, 724-726.
Neill, J. D., & Mengeling, W. L. (1988). Further characterization of the virus-specific RNAs in
feline calicivirus infected cells. Virus Research, 11, 59-72.
Neill, J. D., Reardon, I. M., & Heinrikson, R. L. (1991). Nucleotide sequence and expression of
the capsid protein gene of feline calicivirus. Journal of Virology, 65, 5440-5447.
Neill, J. D. (2002). The subgenomic RNA of feline calicivirus is packaged into viral particles
during infection. Virus Research, 87, 89-93.
Nuanualsuwan, S., & Cliver, D. O. (2002). Pretreatment to avoid positive RT-PCR results with
inactivated viruses. Journal of Virological Methods, 104, 217-225.
Nuermberger, E. (2005). Current issues in the diagnosis, evaluation, and management of
gastrointestinal infections. Advanced Studies in Medicine, 5, 90-97.
Omidbakhsh, N., & Sattar, S. A. (2006). Broad-spectrum microbicidal activity, toxicologic
assessment, and materials compatibility of a new generation of accelerated hydrogen peroxide-
based environmental surface disinfectant. American Journal of Infection Control, 34, 251-257.
Ormerod, E., & Jarrett, O. (1978). A classification of feline calicivirus isolates based on plaque
morphology. Journal of General Virology, 39, 537-540.
Ossiboff, R. J., Sheh, A., Shotton, J., Pesavento, P. A., & Parker, J. S. L. (2007). Feline
caliciviruses (FCVs) isolated from cats with virulent systemic disease possess in vitro
phenotypes distinct from those of other FCV isolates. Journal of General Virology, 88, 506-517.
Pang, X. L., Preiksaitis, J. K., & Lee, B. (2005). Multiplex real-time RT-PCR for the detection
and quantitation of norovirus genogroups I and II in patients with acute gastroenteritis. Journal
of Clinical Virology, 33, 168-171.
Park, G. W., Barclay, L., Macinga, D., Charbonneau, D., Pettigrew, C. A., & Vinjé, J. (2010).
Comparative efficacy of seven hand sanitizers against murine norovirus, feline calicivirus, and
GII.4 norovirus. Journal of Food Protection, 73, 2232-2238.

151
Parrino, T. A., Schreiber, D. S., Trier, J. S., Kapikian, A. Z., & Blacklow, N. R. (1977). Clinical
immunity in acute gastroenteritis caused by Norwalk agent. The New England Journal of
Medicine, 297, 86-89.
Patel, M. M., Hall, A. J., Vinjé, J., & Parashar, U. D. (2009). Noroviruses: a comprehensive
review. Journal of Clinical Virology, 44, 1-8.
Pesavento, P. A., MacLachlan, N. J., Dillard-Telm, L., Grant, C. K., & Hurley, K. F. (2004).
Pathologic, immunohistochemical, and electron microscopic findings in naturally occurring
virulent systemic feline calicivirus infection in cats. Veterinary Pathology, 41, 257-263.
Poschetto, L. F., Ike, A., Papp, T., Mohn, U., Böhm, R., & Marschang, R. E. (2007). Comparison
of the sensitivities of noroviruses and feline calicivirus to chemical disinfection under field-like
conditions. Applied and Environmental Microbiology, 73, 5494-5500.
Prasad, B. V. V., Hardy, M. E., Dokland, T., Bella, J., Rossmann, M. G., & Estes, M. K. (1999).
X-ray crystallographic structure of the Norwalk virus capsid. Science, 286, 287-290.
Public Health Agency of Canada (2005). Noroviruses – fact sheet. Retrieved from
http://www.phac-aspc.gc.ca/id-mi/norovirus-eng.php on December 1, 2010.
Public Health Agency of Canada (2010). 2010 annual summary of laboratory surveillance data.
Retrieved from http://www.nml-lnm.gc.ca/NESP-PNSME/assets/pdf/NESP_2010_Annual_
Report_ENG.pdf on April 9, 2012.
Radford, A. D., Gaskell, R. M., & Hart, C. A. (2004). Human norovirus infection and the lessons
from animal caliciviruses. Current Opinion in Infectious Diseases, 17, 471-478.
Radford, A. D., Dawson, S., Coyne, K. P., Porter, C. J., & Gaskell, R. M. (2006). The challenge
for the next generation of feline calicivirus vaccines. Veterinary Microbiology, 117, 14-18.
Raschke, W. C., Baird, S., Ralph, P., & Nakoinz, I. (1978). Functional macrophage cell lines
transformed by Abelson leukemia virus. Cell, 15, 261-267.
Richards, G. P. (1999). Limitations of molecular biological techniques for assessing the
virological safety of foods. Journal of Food Protection, 62, 691-697.
Rutala, W. A., & Weber, D. J. (1997). Uses of inorganic hypochlorite (bleach) in health-care
facilities. Clinical Microbiology Reviews, 10, 597-610.
Rutala, W. A., Peacock, J. E., Gergen, M. F., Sobsey, M. D., & Weber, D. J. (2006). Efficacy of
hospital germicides against adenovirus 8, a common cause of epidemic keratoconjunctivitis in
health care facilities. Antimicrobial Agents and Chemotherapy, 50, 1419-1424.

152
Sato, Y., Ohe, K., Murakami, M., Fukuyama, M., Furuhata, K., Kishikawa, S., Suzuki, Y.,
Kiuchi, A., Hara, M., Ishikawa, Y., & Taneno, A. (2002). Phylogenetic analysis of field isolates
of feline calicivirus (FCV) in Japan by sequencing part of its capsid gene. Veterinary Research
Communications, 26, 205-219.
Sattar, S. A., Tetro, J., Bidawid, S., & Farber, J. (2000). Foodborne spread of hepatitis A: recent
studies on virus survival, transfer and inactivation. Canadian Journal of Infectious Diseases, 11,
159-163.
Sattar, S. A., Springthorpe, V. S., Adegbunrin, O., Zafer, A. A., & Busa, M. (2003). A disc-based
quantitative carrier test to assess the virucidal activity of chemical germicides. Journal of
Virological Methods, 112, 3-12.
Sattar, S. A., Ali, M., & Tetro, J. A. (2011). In vivo comparison of two human norovirus
surrogates for testing ethanol-based handrubs: the mouse chasing the cat! PLoS ONE, 6, e17340.
Scallan, E., Hoekstra, R. M., Angulo, F. J., Tauxe, R. V., Widdowson, M.-A., Roy, S. L., Jones,
J. L., & Griffin, P. M. (2011). Food illness acquired in the United States – major pathogens.
Emerging Infectious Diseases, 17, 7-15.
Schmidt, N. J., & Emmons, R. W. (Eds.). (1989). Diagnostic procedures for viral, rickettsial and
chlamydial infections (6th ed.). Washington, DC: American Public Health Association, Inc.
Schmitt, M., Schuler-Schmid, U., & Schmidt-Lorenz, W. (1990). Temperature limits of growth,
TNase and enterotoxin production of Staphylococcus aureus strains isolated from foods.
International Journal of Food Microbiology, 11, 1-20.
Schreiber, D. S., Blacklow, N. R., & Trier, J. S. (1974). The small intestinal lesion induced by
Hawaii agent acute infectious nonbacterial gastroenteritis. The Journal of Infectious Diseases,
129, 705-708.
Seal, B. S., Ridpath, J. F., & Mengeling, W. L. (1993). Analysis of feline calicivirus capsid
protein genes: identification of variable antigenic determinant regions of the protein. Journal of
General Virology, 74, 2519-2524.
Seo, K., Lee, J. E., Lim, M. Y., & Ko, G. (2012). Effect of temperature, pH, and NaCl on the
inactivation kinetics of murine norovirus. Journal of Food Protection, 75, 533-540.
Steinmann, J. (2004). Surrogate viruses for testing virucidal efficacy of chemical disinfectants.
Journal of Hospital Infection, 56, S49-S54.
Straub, T. M., Bartholomew, R. A., Valdez, C. O., Valentine, N. B., Dohnalkova, A., Ozanich,
R. M., Bruckner-Lea, C. J., & Call, D. R. (2011). Human norovirus infection of caco-2 cells
grown as a 3-dimensional tissue structure. Journal of Water and Health, 9, 225-240.

153
Takahashi, H., Ohuchi, A., Miya, S., Izawa, Y., & Kimura, B. (2011). Effect of food residues on
norovirus survival on stainless steel surfaces. PLoS ONE, 6, e21951.
Thorven, M., Grahn, A., Hedlund, K.-O., Johansson, H., Wahlfrid, C., Larson, G., & Svensson,
L. (2005). A homozygous nonsense mutation (428GA) in the human secretor (FUT2) gene
provides resistance to symptomatic norovirus (GGII) infections. Journal of Virology, 79, 15351-
15355.
Tian, P., Engelbrektson, A. L., Jiang, X., Zhong, W., & Mandrell, R. E. (2007). Norovirus
recognizes histo-blood group antigens on gastrointestinal cells of clams, mussels, and oysters: a
possible mechanism of bioaccumulation. Journal of Food Protection, 70, 2140-2147.
Topping, J. R., Schnerr, H., Haines, J., Scott, M., Carter, M. J., Willcocks, M. M., Bellamy, K.,
Brown, D. W., Gray, J. J., Gallimore, C. I., & Knight, A. I. (2009). Temperature inactivation of
feline calicivirus vaccine strain FCV F-9 in comparison with human noroviruses using an RNA
exposure assay and reverse transcribed quantitative real-time polymerase chain reaction – a
novel method for predicting virus infectivity. Journal of Virological Methods, 156, 89-95.
Trujillo, A. A., McCaustland, K. A., Zheng, D.-P., Hadley, L. A., Vaughn, G., Adams, S. M.,
Ando, T., Glass, R. I., & Monroe, S. S. (2006). Use of TaqMan real-time reverse transcription-
PCR for rapid detection, quantification, and typing of norovirus. Journal of Clinical
Microbiology, 44, 1405-1412.
United States Environmental Protection Agency. (2009). List G: EPA’s registered antimicrobial
products effective against norovirus (Norwalk-like virus). Retrieved from
http://www.epa.gov/oppad001/list_g_norovirus.pdf on July 12, 2012.
United States Food and Drug Administration. (2012). Guidance for industry and Food and Drug
Administration staff – class II special controls guidance document: norovirus serological
reagents. Retrieved from
http://www.fda.gov/downloads/MedicalDevices/DeviceRegulationandGuidance/
GuidanceDocuments/UCM295090.pdf on February 24, 2013.
Urakami, H., Ikarashi, K., Okamoto, K., Abe, Y., Ikarashi, T., Kono, T., Konagaya, Y., &
Tanaka, N. (2007). Chlorine sensitivity of feline calicivirus, a norovirus surrogate. Applied and
Environmental Microbiology, 73, 5679-5682.
Van Elsas, J. D., Semenov, A. V., Costa, R., & Trevors, J. T. (2011). Survival of Escherichia
coli in the environment: fundamental and public health aspects. The ISME Journal, 5, 173-183.
Vashist, S., Bailey, D., Putics, A., & Goodfellow, I. (2009). Model systems for the study of
human norovirus biology. Future Virology, 4, 353-367.
Verhoef, L., Vennema, H., van Pelt, W., Lees, D., Boshuizen, H., Henshilwood, K., &
Koopmans, M. (2010). Use of norovirus genotype profiles to differentiate origins of foodborne
outbreaks. Emerging Infectious Diseases, 16, 617-624.

154
Vinjé, J., Vennema, H., Maunula, L., von Bonsdorff, C.-H., Hoehne, M., Schreier, E., Richards,
A., Green, J., Brown, D., Beard, S. S., Monroe, S. S., de Bruin, E., Svensson, L., & Koopmans,
M. P. G. (2003). International collaborative study to compare reverse transcriptase PCR assays
for detection and genotyping of noroviruses. Journal of Clinical Microbiology, 41, 1423-1433.
Vinjé, J., Hamidjaja, R. A., & Sobsey, M. D. (2004). Development and application of a capsid
VP1 (region D) based reverse transcription PCR assay for genotyping of genogroup I and II
noroviruses. Journal of Virological Methods, 116, 109-117.
Virox Technologies Inc. (2011). Accelerated Hydrogen Peroxide (AHP) Frequently Asked
Questions. Retrieved from http://www.virox.com/ahp/faq/default.aspx on April 8, 2012.
Weber, D. J., Rutala, W. A., Miller, M. B., Huslage, K., & Sickbert-Bennett, E. (2010). Role of
hospital surfaces in the transmission of emerging health care-associated pathogens: norovirus,
Clostridium difficile, and Acinetobacter species. American Journal of Infection Control, 38, S25-
S33.
Whitehead, K., & McCue, K. A. (2010). Virucidal efficacy of disinfectant actives against feline
calicivirus, a surrogate for norovirus, in a short contact time. American Journal of Infection
Control, 38, 26-30.
Widdowson, M.-A., Cramer, E. H., Hadley, L., Bresee, J. S., Beard, S., Bulens, S. N., Charles,
M., Chege, W., Isakbaeva, E., Wright, J. G., Mintz, E., Forney, D., Massey, J., Glass, R. I., &
Monroe, S. S. (2004). Outbreaks of acute gastroenteritis on cruise ships and on land:
identification of a predominant circulating strain of noroviruses – United States, 2002. The
Journal of Infectious Diseases, 190, 27-36.
Widdowson, M.-A., Sulka, A., Bulens, S. N., Beard, S., Chaves, S. S., Hammond, R., Salehi, E.
D. P., Swanson, E., Totaro, J., Woron, R., Mead, P. S., Bresee, J. S., Monroe, S. S., & Glass, R.
I. (2005). Norovirus and foodborne disease, United States, 1991-2000. Emerging Infectious
Diseases, 11, 95-102.
Wikswo, M. E., Cortes, J., Hall, A. J., Vaughan, G., Howard, C., Gregoricus, N., & Cramer, E.
H. (2011). Disease transmission and passenger behaviors during a high morbidity norovirus
outbreak on a cruise ship, January 2009. Clinical Infectious Diseases, 52, 1116-1122.
Wobus, C. E., Karst, S. M., Thackray, L. B., Chang, K.-O., Sosnovtsev, S. V., Belliot, G., Krug,
A., Mackenzie, J. M., Green, K. Y., & Virgin, H. W. (2004). Replication of norovirus in cell
culture reveals a tropism for dendritic cells and macrophages. PLoS Biology, 2, 2076-2084.
Wu, H. M., Fornek, M., Schwab, K. J., Chapin, A. R., Gibson, K., Schwab, E., Spencer, C., &
Henning, K. (2005). A norovirus outbreak at a long-term care facility: the role of environmental
surface contamination. Infection Control and Hospital Epidemiology, 26, 802-810.

155
Wyatt, R. G., Dolin, R., Blacklow, N. R., DuPont, H. L., Buscho, R. F., Thornhill, T. S.,
Kapikian, A. Z., & Chanock, R. M. (1974). Comparison of three agents of acute infectious
nonbacterial gastroenteritis by cross-challenge in volunteers. Journal of Infectious Diseases, 129,
709-714.
Yamada, K., Ogawa, H., Hara, A., Yoshida, Y., Yonezawa, Y., Karibe, K., Nghia, V. B.,
Yoshimura, H., Yamamoto, Y., Yamada, M., Nakamura, K., & Imai, K. (2009). Mechanism of
the antiviral effect of hydroxytyrosol on influenza virus appears to involve morphological change
of the virus. Antiviral Research, 83, 35-44.
Yuk, H.-G., & Marshall, D. L. (2004). Adaption of Escherichia coli O157:H7 to pH alters
membrane lipid composition, verotoxin secretion and resistance to simulated gastric fluid acid.
Applied and Environmental Microbiology, 70, 3500-3505.
Zheng, D.-P., Widdowson, M.-A., Glass, R. I., & Vinjé, J. (2010). Molecular epidemiology of
genogroup II-genotype 4 noroviruses in the United States between 1994 and 2006. Journal of
Clinical Microbiology, 48, 168-177.
Zingg, W., Colombo, C., Jucker, T., Bossart, W., & Ruef, C. (2005). Impact of an outbreak of
norovirus infection on hospital resources. Infection Control and Hospital Epidemiology, 26, 263-
267.
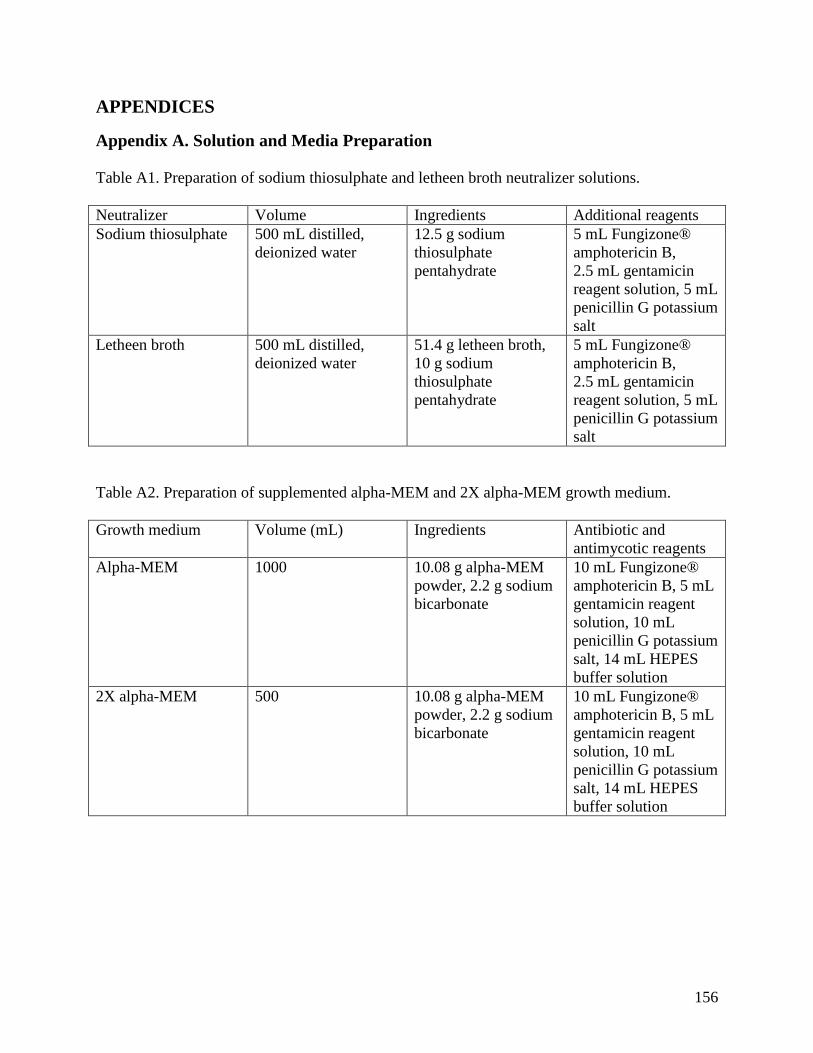
156
APPENDICES
Appendix A. Solution and Media Preparation
Table A1. Preparation of sodium thiosulphate and letheen broth neutralizer solutions.
Neutralizer Volume Ingredients Additional reagents
Sodium thiosulphate 500 mL distilled,
deionized water
12.5 g sodium
thiosulphate
pentahydrate
5 mL Fungizone®
amphotericin B,
2.5 mL gentamicin
reagent solution, 5 mL
penicillin G potassium
salt
Letheen broth 500 mL distilled,
deionized water
51.4 g letheen broth,
10 g sodium
thiosulphate
pentahydrate
5 mL Fungizone®
amphotericin B,
2.5 mL gentamicin
reagent solution, 5 mL
penicillin G potassium
salt
Table A2. Preparation of supplemented alpha-MEM and 2X alpha-MEM growth medium.
Growth medium Volume (mL) Ingredients Antibiotic and
antimycotic reagents
Alpha-MEM 1000 10.08 g alpha-MEM
powder, 2.2 g sodium
bicarbonate
10 mL Fungizone®
amphotericin B, 5 mL
gentamicin reagent
solution, 10 mL
penicillin G potassium
salt, 14 mL HEPES
buffer solution
2X alpha-MEM 500 10.08 g alpha-MEM
powder, 2.2 g sodium
bicarbonate
10 mL Fungizone®
amphotericin B, 5 mL
gentamicin reagent
solution, 10 mL
penicillin G potassium
salt, 14 mL HEPES
buffer solution

157
Table A3. Preparation of soil load mixture.
Ingredient Concentrationa Volume
b
Tryptone 0.05 g/mL 35 µL
Bovine mucin 0.004 g/mL 100 µL
BSA 0.05 g/mL 25 µL aConcentration prepared in PBS.
bVolume of soil load mixture to be added to 340 µL of virus inoculum.

158
Appendix B. Statistical Analysis of Virus Infectivity Control Tests and Viral Drying
Table B1. Effect of soil load, neutralizer and disinfectant on the virus infectivity of MNV-1.
Test* Disinfectant or
solution
Mean PFU
(test solution)
Mean PFU
(control)
p-value** Significant
difference***
Soil load against
control
Soil load 21.0 25.7 0.22 Noa
Neutralizer against
control
Letheen broth 27.3 25.7 0.80 Noa
Sodium
thiosulphate
28.0
Disinfectant with
neutralizer,
disinfectant
without neutralizer
and control
Bleach
(5400 ppm)
25.3b, 24.7
c 25.7 0.97 No
a
CaviCide 25.7b, 20.7
c 25.7 0.33 No
a
Virox 5 26.3b, 23.7
c 25.7 0.77 No
a
T36 (20 µL) 19.3
b, 23.3
c 25.7 0.20 No
a
Accel
(35000 ppm)
4.7b; NA, CTE
observedc
22.3 0.00048 Yesa
Accel
(17500 ppm)
13.7b, 10.0
c 22.3 0.00041 Yes
d,e
*All tests were done in triplicate (n = 3). **ANOVA single factor. ***Tukey’s Test. No significant
difference at p > 0.05. aTukey’s Test not used.
bRefers to disinfectant with neutralizer.
cRefers to
disinfectant without neutralizer. dDisinfectant without neutralizer and control were significantly different.
eDisinfectant with neutralizer and control were significantly different. NA refers to not applicable. CTE
refers to cytotoxicity effects. The control consists of EBSS.

159
Table B2. Effect of soil load, neutralizer and disinfectant on the virus infectivity of FCV.
Test* Disinfectant or
solution
Mean PFU
(test solution)
Mean PFU
(control)
p-value** Significant
difference***
Soil load against
control
Soil load 21.7 19.7 0.52 Noa
Neutralizer against
control
Letheen broth 20.7 19.7 0.67 Noa
Sodium
thiosulphate
18.7
Disinfectant with
neutralizer,
disinfectant
without neutralizer
and control
Bleach
(5400 ppm)
15.0b, 11.3
c 19.7 0.018 Yes
f
CaviCide 26.7b, 18.7
c 19.7 0.20 No
a
Virox 5 31.0b, 11.7
c 19.7 0.0021 Yes
d,e
T36 (20 µL) 29.7
b, 17.3
c 19.7 0.021 Yes
e
T36 (50 µL) 38.0
b, 23.3
c 19.7 0.00071 Yes
d,e
Accel
(35000 ppm)
25.0b; NA,
CTE observedc
19.7 0.35 Noa
*All tests were done in triplicate (n = 3). **ANOVA single factor. ***Tukey’s Test. No significant
difference at p > 0.05. aTukey’s Test not used.
bRefers to disinfectant with neutralizer.
cRefers to
disinfectant without neutralizer. dDisinfectant with neutralizer and control were significantly different.
eDisinfectant without neutralizer and disinfectant with neutralizer were significantly different.
fDisinfectant without neutralizer and control were significantly different. NA refers to not applicable.
CTE refers to cytotoxicity effects. The control consists of EBSS.

160
Table B3. Effect of soil load on the virus infectivity of MNV-1.
ANOVA: Single Factor
SUMMARY
Groups Count Sum Average Variance
Control (EBSS) 3 77 25.7 30.3
EBSS + Soil Load 3 63 21 1
ANOVA
Source of Variation SS df MS F P-value F crit
Between Groups 32.7 1 32.7 2.09 0.22 7.71
Within Groups 62.7 4 15.7
Total 95.3 5
Table B4. Effect of soil load on the virus infectivity of FCV.
ANOVA: Single Factor
SUMMARY
Groups Count Sum Average Variance
Control (EBSS) 3 59 19.7 10.3
EBSS + Soil Load 3 65 21.7 14.3
ANOVA
Source of Variation SS df MS F P-value F crit
Between Groups 6 1 6 0.49 0.52 7.71
Within Groups 49.3 4 12.3
Total 55.3 5

161
Table B5. Effect of sodium thiosulphate and letheen broth neutralizer on the virus infectivity of
MNV-1.
ANOVA: Single Factor
SUMMARY
Groups Count Sum Average Variance
Letheen Broth 3 82 27.3 16.3
Sodium Thiosulphate 3 84 28 9
Control (EBSS) 3 77 25.7 30.3
ANOVA
Source of Variation SS df MS F P-value F crit
Between Groups 8.7 2 4.3 0.23 0.80 5.14
Within Groups 111.3 6 18.6
Total 120 8
Table B6. Effect of sodium thiosulphate and letheen broth neutralizer on the virus infectivity of
FCV.
ANOVA: Single Factor
SUMMARY
Groups Count Sum Average Variance
Letheen Broth 3 62 20.7 6.3
Sodium Thiosulphate 3 56 18.7 4.3
Control (EBSS) 3 59 19.7 10.3
ANOVA
Source of Variation SS df MS F P-value F crit
Between Groups 6 2 3 0.43 0.67 5.14
Within Groups 42 6 7
Total 48 8

162
Table B7. Effect of disinfectant with neutralizer and disinfectant without neutralizer on the virus
infectivity of MNV-1.
A
Bleach – 5400 ppm ANOVA: Single Factor
SUMMARY
Groups Count Sum Average Variance
No Neutralizer 3 74 24.7 26.3
Neutralizer 3 76 25.3 21.3
Control (EBSS) 3 77 25.7 30.3
ANOVA
Source of Variation SS df MS F P-value F crit
Between Groups 1.56 2 0.78 0.030 0.97 5.14
Within Groups 156 6 26
Total 157.6 8
B
Virox 5 ANOVA: Single Factor
SUMMARY
Groups Count Sum Average Variance
No Neutralizer 3 71 23.7 26.3
Neutralizer 3 79 26.3 8.3
Control (EBSS) 3 77 25.7 30.3
ANOVA
Source of Variation SS df MS F P-value F crit
Between Groups 11.6 2 5.8 0.27 0.77 5.14
Within Groups 130 6 21.7
Total 141.6 8

163
C
CaviCide ANOVA: Single Factor
SUMMARY
Groups Count Sum Average Variance
No Neutralizer 3 62 20.7 4.3
Neutralizer 3 77 25.7 21.3
Control (EBSS) 3 77 25.7 30.3
ANOVA
Source of Variation SS df MS F P-value F crit
Between Groups 50 2 25 1.34 0.33 5.14
Within Groups 112 6 18.7
Total 162 8
D
Accel – 35000 ppm ANOVA: Single Factor
SUMMARY
Groups Count Sum Average Variance
Neutralizer 3 14 4.7 4.3
Control (EBSS) 3 67 22.3 4.3
ANOVA
Source of Variation SS df MS F P-value F crit
Between Groups 468.2 1 468.2 108.04 0.00048 7.71
Within Groups 17.3 4 4.3
Total 485.5 5

164
E
Accel – 17500 ppm ANOVA: Single Factor
SUMMARY
Groups Count Sum Average Variance
No Neutralizer 3 30 10 1
Neutralizer 3 41 13.7 4.3
Control (EBSS) 3 67 22.3 4.3
ANOVA
Source of Variation SS df MS F P-value F crit
Between Groups 240.7 2 120.3 37.34 0.00041 5.14
Within Groups 19.3 6 3.2
Total 260 8
F
T36 (20 µL)
ANOVA: Single Factor
SUMMARY
Groups Count Sum Average Variance
No Neutralizer 3 70 23.3 12.3
Neutralizer 3 58 19.3 1.3
Control (EBSS) 3 77 25.7 30.3
ANOVA
Source of Variation SS df MS F P-value F crit
Between Groups 61.6 2 30.8 2.10 0.20 5.14
Within Groups 88 6 14.7
Total 149.6 8

165
Table B8. Effect of disinfectant with neutralizer and disinfectant without neutralizer on the virus
infectivity of FCV.
A
Bleach – 5400 ppm ANOVA: Single Factor
SUMMARY
Groups Count Sum Average Variance
No Neutralizer 3 34 11.3 4.3
Neutralizer 3 45 15 4
Control (EBSS) 3 59 19.7 10.3
ANOVA
Source of Variation SS df MS F P-value F crit
Between Groups 104.7 2 52.3 8.41 0.018 5.14
Within Groups 37.3 6 6.2
Total 142 8
B
CaviCide ANOVA: Single Factor
SUMMARY
Groups Count Sum Average Variance
No Neutralizer 3 56 18.7 26.3
Neutralizer 3 80 26.7 42.3
Control (EBSS) 3 59 19.7 10.3
ANOVA
Source of Variation SS df MS F P-value F crit
Between Groups 114 2 57 2.16 0.20 5.14
Within Groups 158 6 26.3
Total 272 8

166
C
Virox 5 ANOVA: Single Factor
SUMMARY
Groups Count Sum Average Variance
No Neutralizer 3 35 11.7 4.3
Neutralizer 3 93 31 27
Control (EBSS) 3 59 19.7 10.3
ANOVA
Source of Variation SS df MS F P-value F crit
Between Groups 566.2 2 283.1 20.38 0.0021 5.14
Within Groups 83.3 6 13.9
Total 649.6 8
D
T36 (20 µL)
ANOVA: Single Factor
SUMMARY
Groups Count Sum Average Variance
No Neutralizer 3 52 17.3 22.3
Neutralizer 3 89 29.7 16.3
Control (EBSS) 3 59 19.7 10.3
ANOVA
Source of Variation SS df MS F P-value F crit
Between Groups 257.6 2 128.8 7.88 0.021 5.14
Within Groups 98 6 16.3
Total 355.6 8

167
E
T36 (50 µL)
ANOVA: Single Factor
SUMMARY
Groups Count Sum Average Variance
No Neutralizer 3 70 23.3 10.3
Neutralizer 3 114 38 7
Control (EBSS) 3 59 19.7 10.3
ANOVA
Source of
Variation SS df MS F P-value F crit
Between Groups 564.7 2 282.3 30.61 0.00071 5.14
Within Groups 55.3 6 9.2
Total 620 8
F
Accel – 35000 ppm ANOVA: Single Factor
SUMMARY
Groups Count Sum Average Variance
Neutralizer 3 75 25 67
Control (EBSS) 3 59 19.7 10.3
ANOVA
Source of
Variation SS df MS F P-value F crit
Between Groups 42.7 1 42.7 1.10 0.35 7.71
Within Groups 154.7 4 38.7
Total 197.3 5
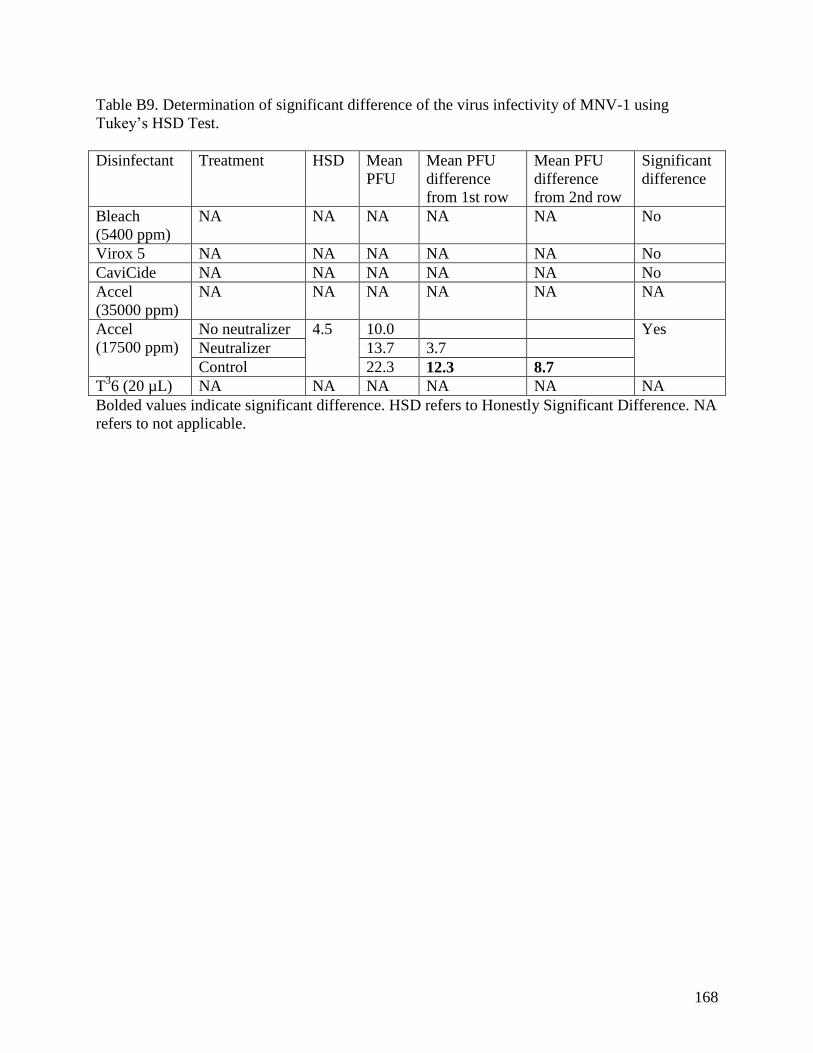
168
Table B9. Determination of significant difference of the virus infectivity of MNV-1 using
Tukey’s HSD Test.
Disinfectant Treatment HSD Mean
PFU
Mean PFU
difference
from 1st row
Mean PFU
difference
from 2nd row
Significant
difference
Bleach
(5400 ppm)
NA NA NA NA NA No
Virox 5 NA NA NA NA NA No
CaviCide NA NA NA NA NA No
Accel
(35000 ppm)
NA NA NA NA NA NA
Accel
(17500 ppm)
No neutralizer 4.5 10.0 Yes
Neutralizer 13.7 3.7
Control 22.3 12.3 8.7
T36 (20 µL) NA NA NA NA NA NA
Bolded values indicate significant difference. HSD refers to Honestly Significant Difference. NA
refers to not applicable.
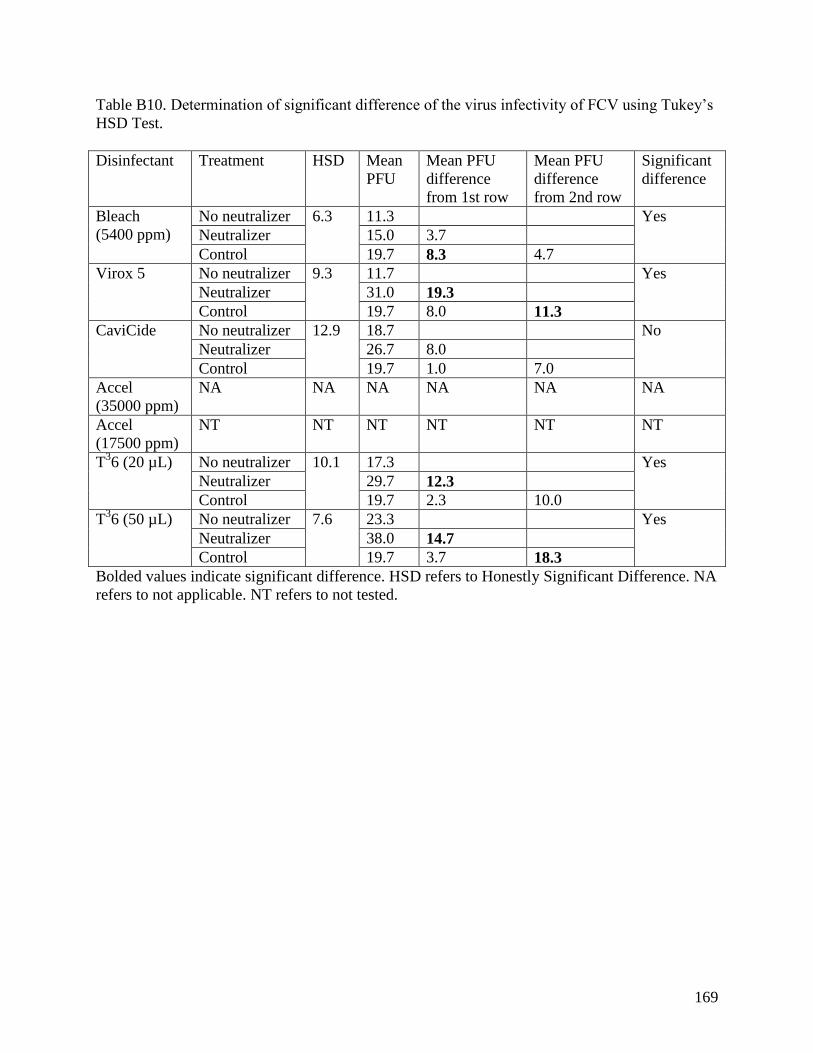
169
Table B10. Determination of significant difference of the virus infectivity of FCV using Tukey’s
HSD Test.
Disinfectant Treatment HSD Mean
PFU
Mean PFU
difference
from 1st row
Mean PFU
difference
from 2nd row
Significant
difference
Bleach
(5400 ppm)
No neutralizer 6.3 11.3 Yes
Neutralizer 15.0 3.7
Control 19.7 8.3 4.7
Virox 5 No neutralizer 9.3 11.7 Yes
Neutralizer 31.0 19.3
Control 19.7 8.0 11.3
CaviCide No neutralizer 12.9 18.7 No
Neutralizer 26.7 8.0
Control 19.7 1.0 7.0
Accel
(35000 ppm)
NA NA NA NA NA NA
Accel
(17500 ppm)
NT NT NT NT NT NT
T36 (20 µL) No neutralizer 10.1 17.3 Yes
Neutralizer 29.7 12.3
Control 19.7 2.3 10.0
T36 (50 µL) No neutralizer 7.6 23.3 Yes
Neutralizer 38.0 14.7
Control 19.7 3.7 18.3
Bolded values indicate significant difference. HSD refers to Honestly Significant Difference. NA
refers to not applicable. NT refers to not tested.

170
Table B11. Comparison of viral titer remaining (%) of MNV-1 and FCV without soil load.
t-Test: Two-Sample Assuming Unequal Variances
MNV-1 without Soil Load FCV without Soil Load
Mean 0.20 0.43
Variance 0.0042 0.025
Observations 11 11
Hypothesized Mean Difference 0
df 13
t Stat -4.52
P(T<=t) two-tail 0.00058
t Critical two-tail 2.16
Table B12. Comparison of viral titer remaining (%) of MNV-1 and FCV with soil load.
t-Test: Two-Sample Assuming Unequal Variances
MNV-1 with Soil Load FCV with Soil Load
Mean 0.18 0.38
Variance 0.0033 0.016
Observations 5 7
Hypothesized Mean Difference 0
df 9
t Stat -3.78
P(T<=t) two-tail 0.0043
t Critical two-tail 2.26
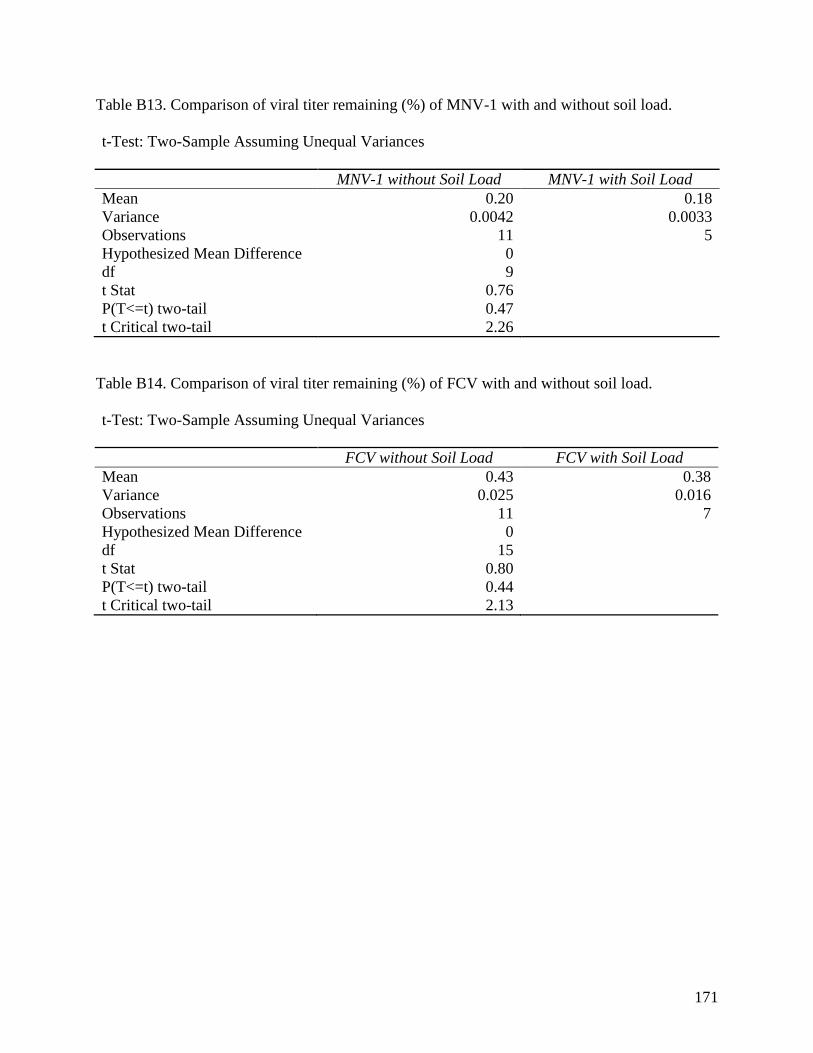
171
Table B13. Comparison of viral titer remaining (%) of MNV-1 with and without soil load.
t-Test: Two-Sample Assuming Unequal Variances
MNV-1 without Soil Load MNV-1 with Soil Load
Mean 0.20 0.18
Variance 0.0042 0.0033
Observations 11 5
Hypothesized Mean Difference 0
df 9
t Stat 0.76
P(T<=t) two-tail 0.47
t Critical two-tail 2.26
Table B14. Comparison of viral titer remaining (%) of FCV with and without soil load.
t-Test: Two-Sample Assuming Unequal Variances
FCV without Soil Load FCV with Soil Load
Mean 0.43 0.38
Variance 0.025 0.016
Observations 11 7
Hypothesized Mean Difference 0
df 15
t Stat 0.80
P(T<=t) two-tail 0.44
t Critical two-tail 2.13

172
Appendix C. Photo Images of Experimental Design and Virus Plaques
A
B
C
Figure C1. Stainless steel disc inoculated with 10 µL of virus under (A) wet load condition,
(B) dry load condition, and (C) with addition of 50 µL of disinfectant.

173
A
B
Figure C2. Virus plaques visible on 6-well plates, with (A) MNV-1 virus plaques and (B) FCV
virus plaques.
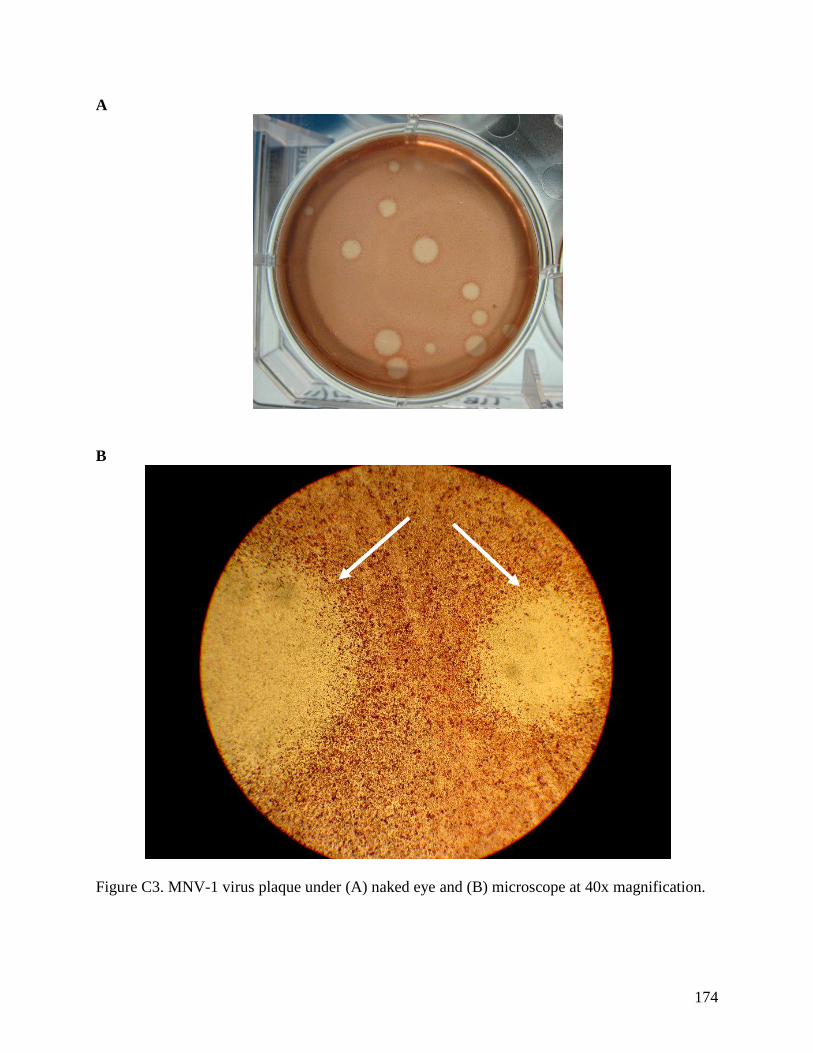
174
A
B
Figure C3. MNV-1 virus plaque under (A) naked eye and (B) microscope at 40x magnification.

175
A
B
Figure C4. FCV virus plaque under (A) naked eye and (B) microscope at 40x magnification.

176
A
B
Figure C5. Monolayer detachment of (A) RAW 264.7 cells and (B) CRFK cells, on 6-well plate
due to improper and quick application of agarose overlay on to well plate.

177
Appendix D. Conversion of Revolutions Per Minute (rpm) to Centrifugal Force (× g)
Equation:
Centrifugal force (× g) = 1.118 × 10⁻⁵
× R × N2
R = maximum effective rotating radius of centrifuge head measured in cm from centre of drive
shaft to far end of contents of centrifuge tube in its extended position
N = revolutions per minute (rpm)
Source: Grist et al., 1979.
Calculations of conversions:
Table D1. Conversion of Revolutions Per Minute (rpm) to Centrifugal Force (× g)
Equipment Revolutions
per minute
(rpm)
Maximum rotating
radius of centrifuge
head (cm)
Centrifugal force (× g)
Heraeus Clinifuge 75003539
rotor Sepatech 3760
2000 9.65 432
Hettich Zentrifugen Rotanta
460 centrifuge
3000 18.8 1892


![B1 07.pptx [Lecture seule]Disinfectant efficacy Cleaning Validation Complete EM program (including continuous particle monitoring) Solution preparation VBI Solution preparation VBIV](https://static.fdocuments.in/doc/165x107/60f54591f984e451ab6d12a7/b1-07pptx-lecture-seule-disinfectant-efficacy-cleaning-validation-complete-em.jpg)