Efficacy, effectiveness, and behavior change trials in exercise
Efficacy and Effectiveness Evaluation:
A Behavior Research Example
Mary Wagner, Ph.D.W. Carl Sumi, Ph.D.
Michelle Woodbridge, Ph.D. Frances Bergland, B.A. Patrick Thornton, Ph.D.
SRI International
Hill Walker, Ph.D. John Seeley, Ph.D.
Annemieke Golly, Ph.D. Ed Feil, Ph.D.
Herb Severson, Ph.D.Oregon Research Institute
Presentation at the Institute of Education SciencesResearch ConferenceJune 7, 2007 Jacquelyn Buckley, Ph.D.
NCSER Project Officer

2
Today’s agenda
Review the IES goal structure and the role of efficacy and effectiveness researchDescribe the National Behavior Research Coordination Center (NBRCC) and its program of efficacy researchDescribe and provide interim efficacy results from one behavior intervention, First Step to SuccessProvide an overview of the national effectiveness study of First Step to Success

3
IES’s research goal structure
Goal 1: Identify interventions that may have an impact on student outcomes and factors that may mediate or moderate effectsGoal 2: Develop interventions Goal 3: Conduct efficacy or replication trialsGoal 4: Conduct effectiveness trials of interventions at scaleGoal 5: Develop or validate data and measurement systems and tools

4
Efficacy and effectiveness research“Efficacy trials test if an intervention does more good than harm when delivered under optimal conditions.”
“Effectiveness trials test if an intervention does more good than harm when delivered under real-world conditions.”
Source: Flay, B.R. (1986). Efficacy and effectiveness trials (and other phases of research) in the development of health promotion programs. Preventive Medicine, 14:451-474.
National Behavior Research Coordination
Center (NBRCC)
Mary Wagner, Ph.D.SRI International
6
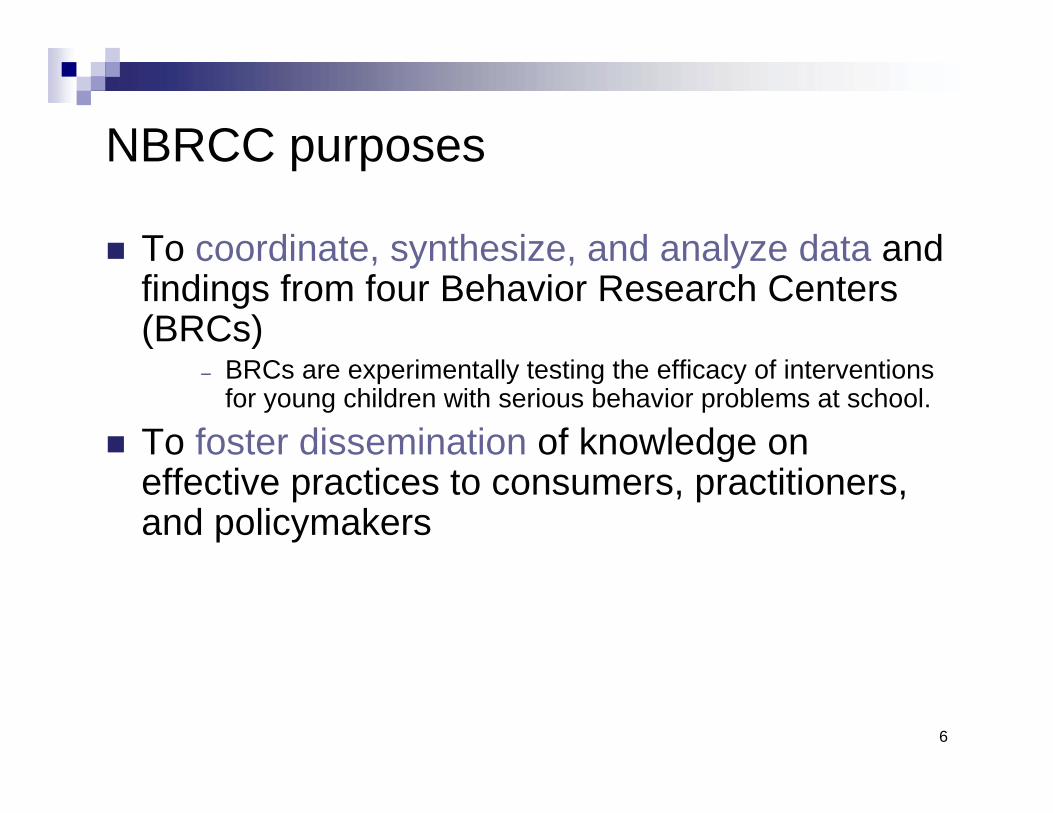
NBRCC purposes
To coordinate, synthesize, and analyze data and findings from four Behavior Research Centers (BRCs)
– BRCs are experimentally testing the efficacy of interventions for young children with serious behavior problems at school.
To foster dissemination of knowledge on effective practices to consumers, practitioners, and policymakers
7
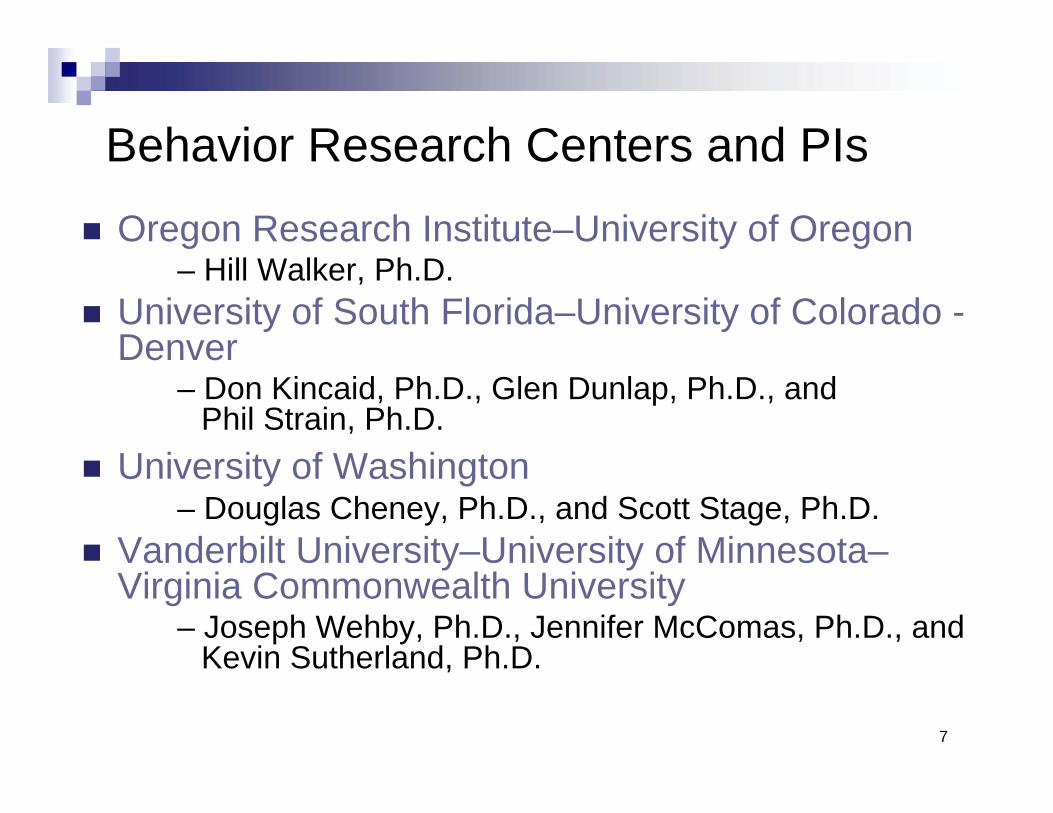
Behavior Research Centers and PIs
Oregon Research Institute–University of Oregon– Hill Walker, Ph.D.
University of South Florida–University of Colorado -Denver
– Don Kincaid, Ph.D., Glen Dunlap, Ph.D., and Phil Strain, Ph.D.
University of Washington– Douglas Cheney, Ph.D., and Scott Stage, Ph.D.
Vanderbilt University–University of Minnesota–Virginia Commonwealth University
– Joseph Wehby, Ph.D., Jennifer McComas, Ph.D., andKevin Sutherland, Ph.D.
8
Coordination center strategy
Common:– Research questions
– Core sample
– Randomized design
– Measures
9
NBRCC research questions
EffectsDo the examined interventions improve the behavior at school of students with severe behavior problems?
Do the examined interventions improve the academic performance and participation of students with severe behavior problems?
Are the effects of the examined interventions sustained for 1 year?
Continued…

10
NBRCC research questions
EffectsHow do these effects vary across the examined interventions?
For whom do the examined interventions work best? Least well? (e.g., student grade level, gender, severity of behavior problems)
In what contexts (e.g., classroom, school) do the examined interventions work best? Least well? (e.g., schools with behavior support systems, more highly qualified teachers)
Continued…

11
NBRCC research questions
ImplementationHow do fidelity (i.e., procedural adherence, quality, and intensity) and social validity from the teacher’s perspective vary across the examined interventions?
How do variations in contextual factors relate to variations in fidelity?

12
Core sample selection
Students begin intervention in grades 1 through 3.
Standardized screening instrument and procedure– Systematic Screening for
Behavior Disorders (SSBD)
– BRCs include students ranked highest with externalizing behavior problems in core sample.

13
Randomization strategiesTailored to specifics of the intervention– USF at the student level
– ORI at the classroom level
– UW and VUExamine data on distribution of students with disabilities across schools (by age and category of disability) Match schools willing to participate on critical variables Then randomly assign pairs of schools to intervention and comparison groups

14
Data sources
Behavior and Academic Outcomes– Office discipline referrals (ODRs)
– Social Skills Rating System (SSRS) Teacher version–Student behavior and academic competence
– Woodcock-Johnson III (WJ III) Tests of Achievement–Letter-Word Identification subtest
– Oral Reading Fluency (ORF) passages
– Academic Engaged Time (AET)–Observations of the amount of time student spends visibly and actively engaged in relevant academic material
Continued…

15
Data sourcesImplementation– Fidelity measured repeatedly throughout intervention by
observational checklists to determine:Adherence–Whether each procedure specified for an intervention is implementedQuality–How competently each procedure is implementedDosage–Amount of treatment provided
– Social validity from teachers’ perspectives:Acceptability–General support for interventionPositive effects–for participating student(s) and classroom
– Alliance–standardized scale measures perceptions of the strength of the relationship between implementer (e.g., coach) and client (e.g., teacher) Continued…

16
Data sourcesContext– Classroom Atmosphere Rating Scale (CARS)– Student Enrollment Survey–basic demographics– School Record Survey (e.g., IEP/504 plan status,
instructional settings)– Classroom / Teacher Survey (e.g., classroom and teacher
characteristics, teacher supports, teacher self-reported skills to work with students with behavior problems)
– School-wide Evaluation Tool (SET)–Interview and observation protocol assesses extent to which school implements critical features of school-wide positive behavior supports
– School Characteristics Survey–Items include student characteristics, school climate, and staff and program resources
– Common Core of Data (CCD) from National Center for Education Statistics

17
First Step to Success: BackgroundSecondary-level interventionThree components– Universal screening– School intervention – Family-based intervention
Over approximately 12 weeks, designed to teachyoung children behaviors and approaches to learning that lead to school successInstructs parents (in 6 home visits) how to teach their children skills for school successEfficacy study implemented in Albuquerque Public Schools, New Mexico
Continued…

18
First Step to Success: Background
Developed from a model development grantfunded by OSEP from 1992-1996
Has been implemented in school districts in more than 25 states, 4 Canadian Provinces, Australia, and New Zealand
Since 1992, FSS has been the subject of dozensof research studies and evaluations

First Step to Success:Evidence of efficacy
Ed Feil, Ph.D.Oregon Research Institute

20
First Step to Success: Intervention principles
Teachers are powerful positive reinforcers.
Identify and reduce problem behavior.– Hitting, kicking, yelling, taking toys.
Identify and increase positive behaviors.– Cooperating, talking with “inside voice,”
playing appropriately with toys.
21
First Step to Success
A program of screening and interventions designed for young children at risk for the development of antisocial behavior.Behavior Coach serves as a bridge, working with the child, parents, and teachers.Screening: SSBD.Interventions: CLASS and homeBase.

22
CLASS program
Positive behavior management programChildren learn how to:– Attend to the teacher– Get along with others– Participate in activities
23
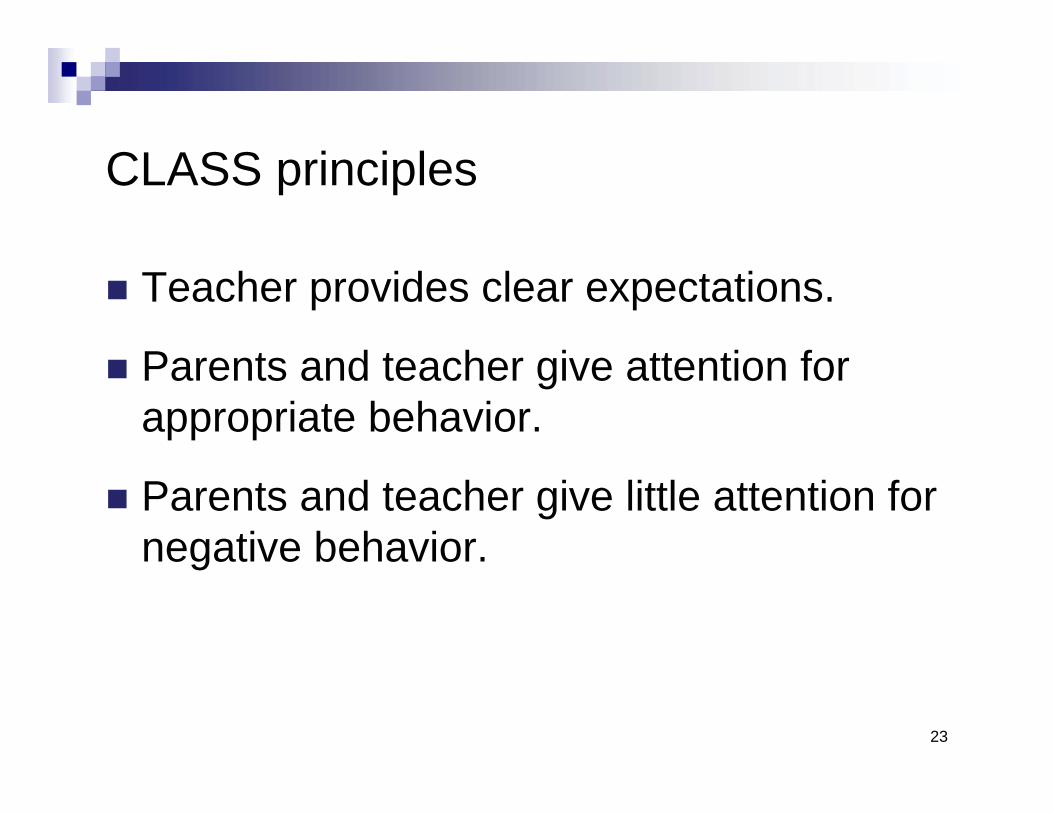
CLASS principles
Teacher provides clear expectations.
Parents and teacher give attention for appropriate behavior.
Parents and teacher give little attention for negative behavior.

24
Procedures
Screening for children at risk for behavior disordersGreen/red card provides feedbackFrequent to intermittent feedback80% green gets class goal
e.g., 5 minutes extra recess, popcorn
Coach starts and teacher continues.

25
Days 1-5:Behavior coach leads program
Coach gives feedback.Teacher gives verbal praise.Student earns class reward for 80% green.Student brings card home.Parent rewards student.Behavior coach contacts home.
26
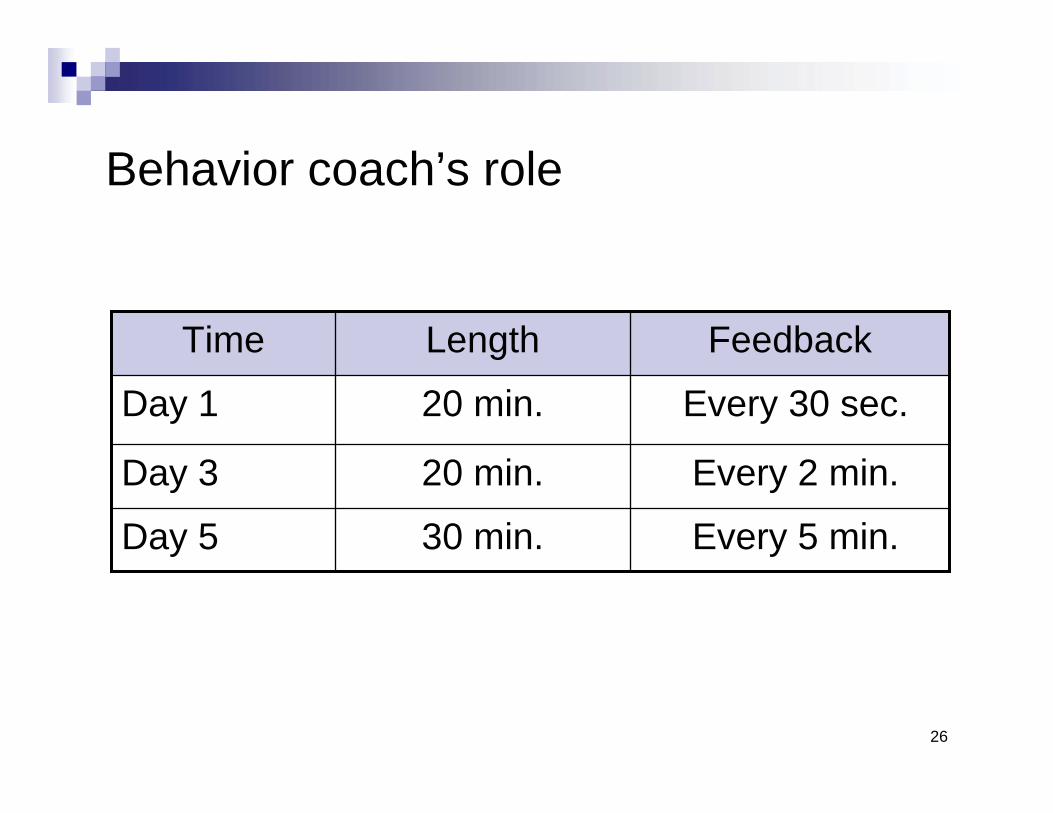
Behavior coach’s role
Every 5 min.30 min.Day 5
Every 2 min.20 min.Day 3
Every 30 sec.20 min.Day 1
FeedbackLengthTime

27
Days 6-15: Teacher leads program
Teacher gives feedback.Teacher gives verbal praise.Student earns class reward for 80% green.Student brings card home.Parent rewards student.Behavior Coach contacts home.

28
Teacher’s role
Every 10 min.All dayDay 30
Every 10 min.All dayDay 10
Every 10 min.1 hourDay 8
Every 5 min.30 min.Day 6FeedbackLengthTime
29
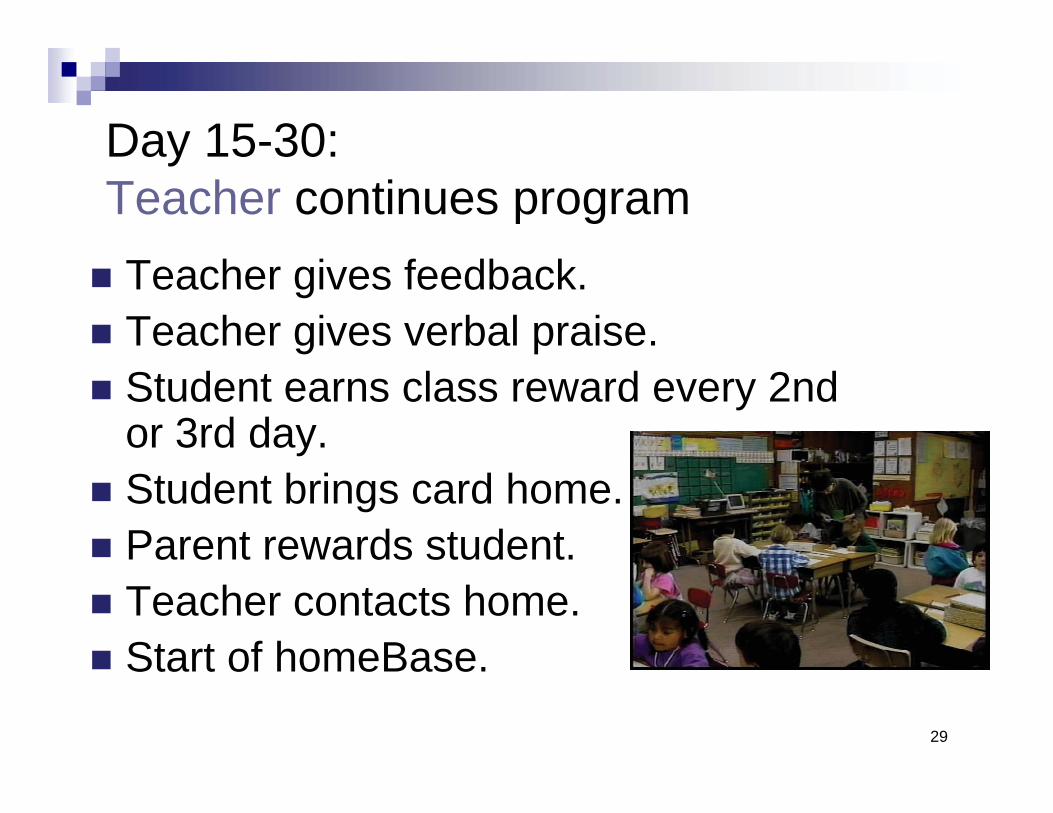
Day 15-30:Teacher continues programTeacher gives feedback.Teacher gives verbal praise.Student earns class reward every 2nd or 3rd day.Student brings card home.Parent rewards student.Teacher contacts home.Start of homeBase.
30
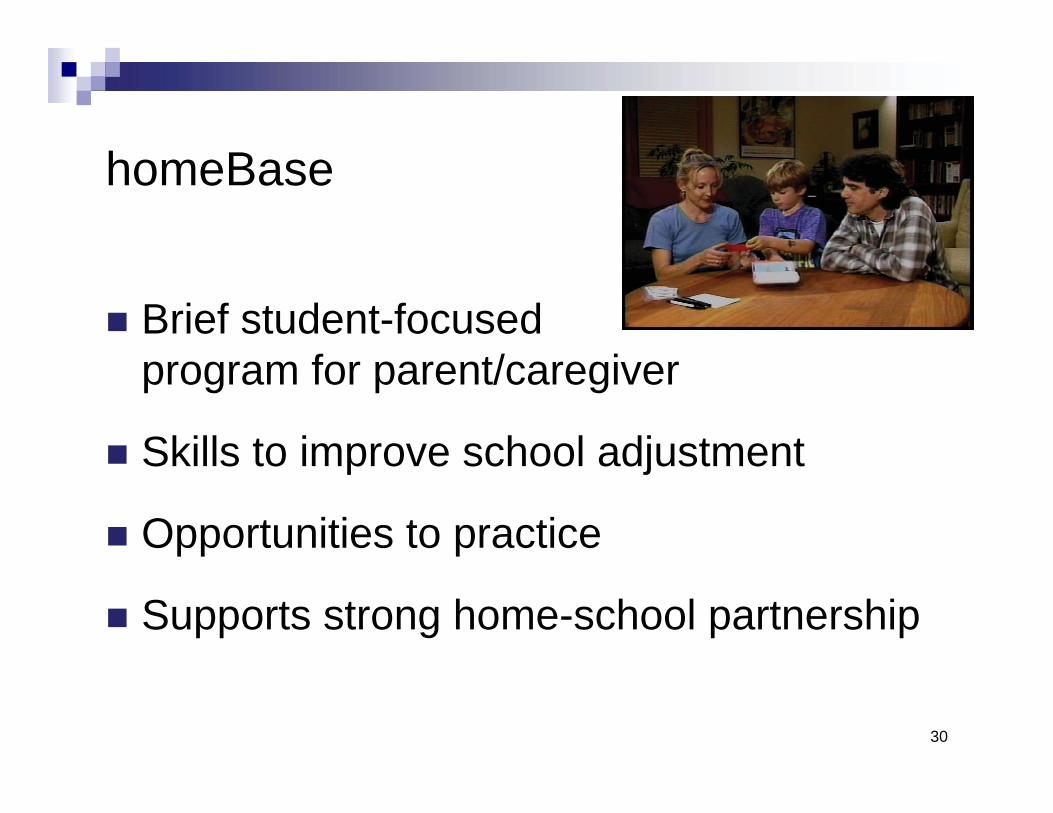
homeBase
Brief student-focused program for parent/caregiver
Skills to improve school adjustment
Opportunities to practice
Supports strong home-school partnership
31
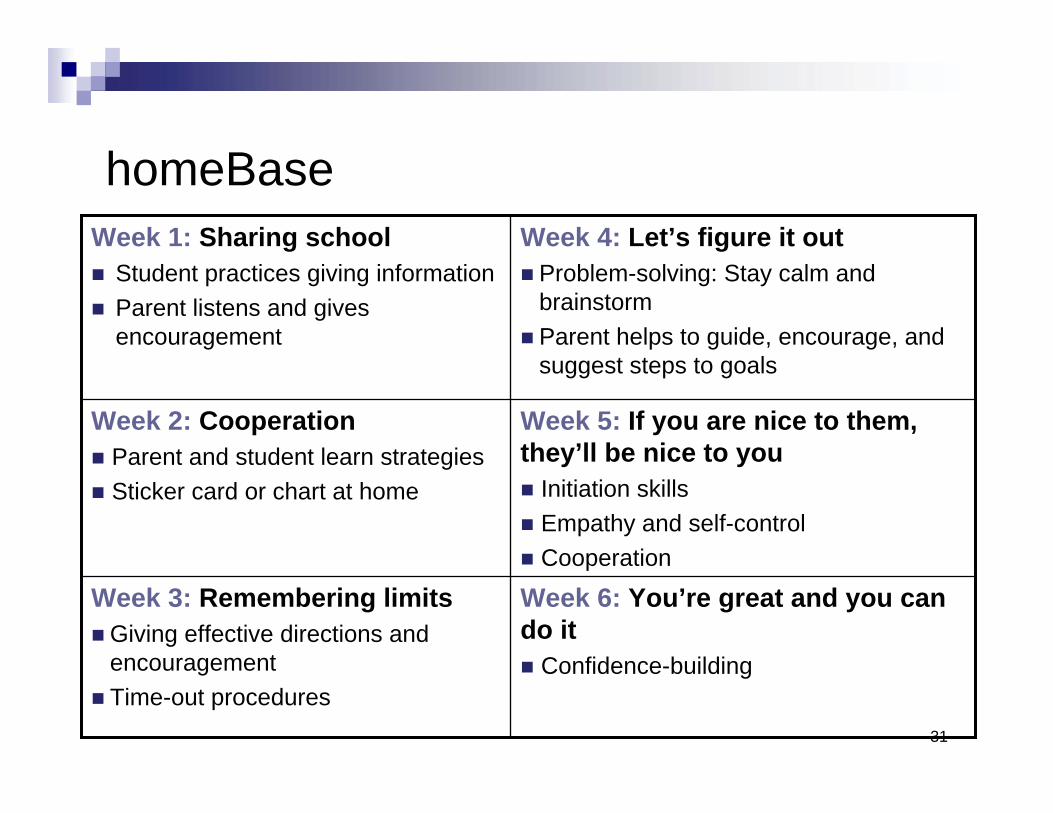
homeBase
Week 6: You’re great and you can do it
Confidence-building
Week 3: Remembering limitsGiving effective directions and encouragementTime-out procedures
Week 5: If you are nice to them, they’ll be nice to you
Initiation skillsEmpathy and self-control Cooperation
Week 2: CooperationParent and student learn strategiesSticker card or chart at home
Week 4: Let’s figure it outProblem-solving: Stay calm and brainstormParent helps to guide, encourage, and suggest steps to goals
Week 1: Sharing schoolStudent practices giving informationParent listens and gives encouragement

32
Testing efficacy
1. Randomized trial in local school district– N = 48 over 2 years with children/teachers randomized to First
Step or wait-list/control (Walker et al., 1998)– Collect data at baseline, post intervention (treatment) or 2nd
baseline (control) and post treatment (control)2. Single subject
– Identical twins across multiple baselines (Golly et al., 2000)3. Oregon Statewide Initiative
– Non experimental replication (Walker et al., 2005)4. Randomized trial in large diverse school district
– N = 250 over 2 years with children/teachers randomized to First Step or control (control teachers received training at end aftertrial is completed)
– Collect data at baseline, post intervention, and next year follow-up

33
Study 1: ANCOVA with experimental and wait-list control groups across five dependent measures
Measures
Adaptive Teacher Rating ScaleExperimental
Wait-List/Control
Maladaptive Teacher Rating ScaleExperimentalWait-List/Control
Teacher Ratings on the CBC Aggression SubscaleExperimentalWait-List/Control
Teacher Ratings on the CBC Withdrawn ScaleExperimentalWait-List/Control
Classroom Observation(s) of Academic Engaged TimeExperimentalWait-List/Control
BaselineM (SD)
22.68 (5.03)20.83 (4.42)
32.40 (6.74)32.17 (7.82)
22.24 (10.92)22.00 (11.05)
5.00 (3.83)6.22 (5.21)
64.00 (10.59)58.78 (18.74)
Post-Intervention (Exp.)or 2nd Baseline (Ctrl.)
M (SD)
28.8 (4.19)22.10 (4.93)
23.52 (8.70)31.63 (7.03)
13.54 (9.33)22.82 (10.04)
3.08 (3.39)4.45 (4.54)
83.36 (21.09)68.18 (20.35)
Significance
F = 22.91 (1,45)***
F = 18.54 (1,45)***
F = 16.85 (1,44)***
F = 0.23 (1,44)
F = 5.65 (1,45)*

34
Raw score profile of cohort 1 across measures pre and post intervention for First Step
0
10
20
30
40
Adaptive Maladaptive CBC-Aggression
CBC-Withdrawal
ClassObservation
PrePost1st Grade2nd Grade
0
30
50
100
20
10
40
80
70
60
90
Teacher
Scores
%
Engaged
for
Classroom
Obs.
Norms are +/- 1 SD

35
First Step to Success twin study 2

36
Study 3: Oregon statewide First Step to Success replication initiative
Oregon state legislature funded a 2-year period to begin making the First Step program available to all schools. Outside evaluatorHuman Services Research Institute of Salem
Evaluation results closely replicated those obtained in the initial trial. Found positive consumer satisfaction levels. These results were obtained despite high variation in fidelity and implementation quality.

37
Study 4: Behavior Research Centerparticipant characteristics
0.7655 (70.5%)44 (63.8%)Free or reduced-price lunch n (%)
0.9213 (13.7%)17 (18.9%)ELL n (%)
4.0250 (52.1%)54 (60.0%)Hispanic n (%)
2.987 ( 7.3%)14 (15.4%)Spanish-speaking n (%)
0.5221 (21.9%)24 (26.4%)Female n (%)
-1.247.22 (1.01)7.04 (0.92)Age M (SD)
Test Statistic
Intervention (n = 96)
Comparison (n =91)

38
Study 4: Behavior Research Centerpreliminary results
Figure 1. Adaptive Behavior
30
35
40
45
50
55
60
Pre Post
Cnt Exp
p<.001
n2=.17 (large/medium)
Externalizer mean
Normative mean

39
Study 4: Behavior Research Centerpreliminary results
Figure 2. Maladaptive Behavior
10
15
20
25
30
35
40
Pre Post
Cnt Exp
p<.001
n2=.09 (large)
Externalizer mean
Normative mean

40
Study 4: Behavior Research Centerpreliminary results
Figure 3. Academic Engaged Time Observation
30%35%40%45%50%55%60%65%70%75%80%
Pre Post
Cnt Exp
Externalizer mean
Normative mean
p<.01
n2=.04 (medium/small)

Going to scale with First Step to Success: An IES goal 4 project
John Seeley, Ph.D.Oregon Research Institute

42
“Where did the field get the idea that evidence of an intervention’s
efficacy from carefully controlled trials could be generalized as the
‘best practice’ for widely varied populations and settings?”
L.W. Green, 2001
43
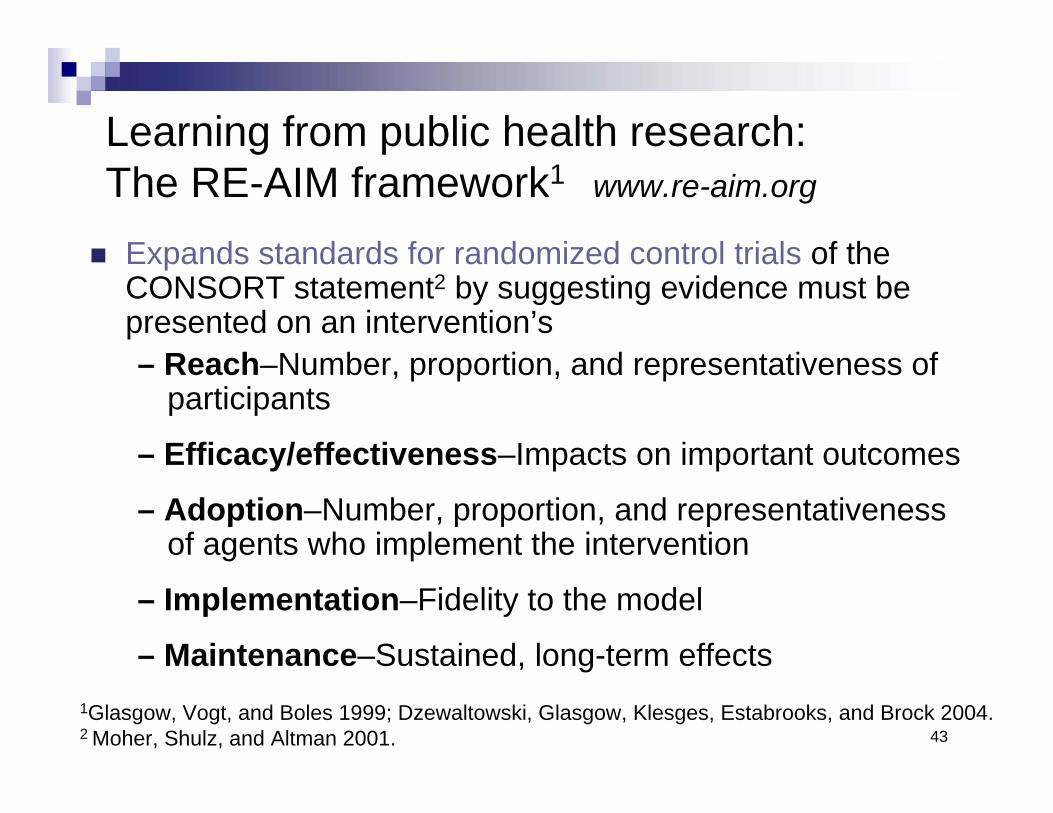
Learning from public health research: The RE-AIM framework1 www.re-aim.org
Expands standards for randomized control trials of the CONSORT statement2 by suggesting evidence must be presented on an intervention’s– Reach–Number, proportion, and representativeness of
participants
– Efficacy/effectiveness–Impacts on important outcomes
– Adoption–Number, proportion, and representativenessof agents who implement the intervention
– Implementation–Fidelity to the model
– Maintenance–Sustained, long-term effects1Glasgow, Vogt, and Boles 1999; Dzewaltowski, Glasgow, Klesges, Estabrooks, and Brock 2004.2 Moher, Shulz, and Altman 2001.
44
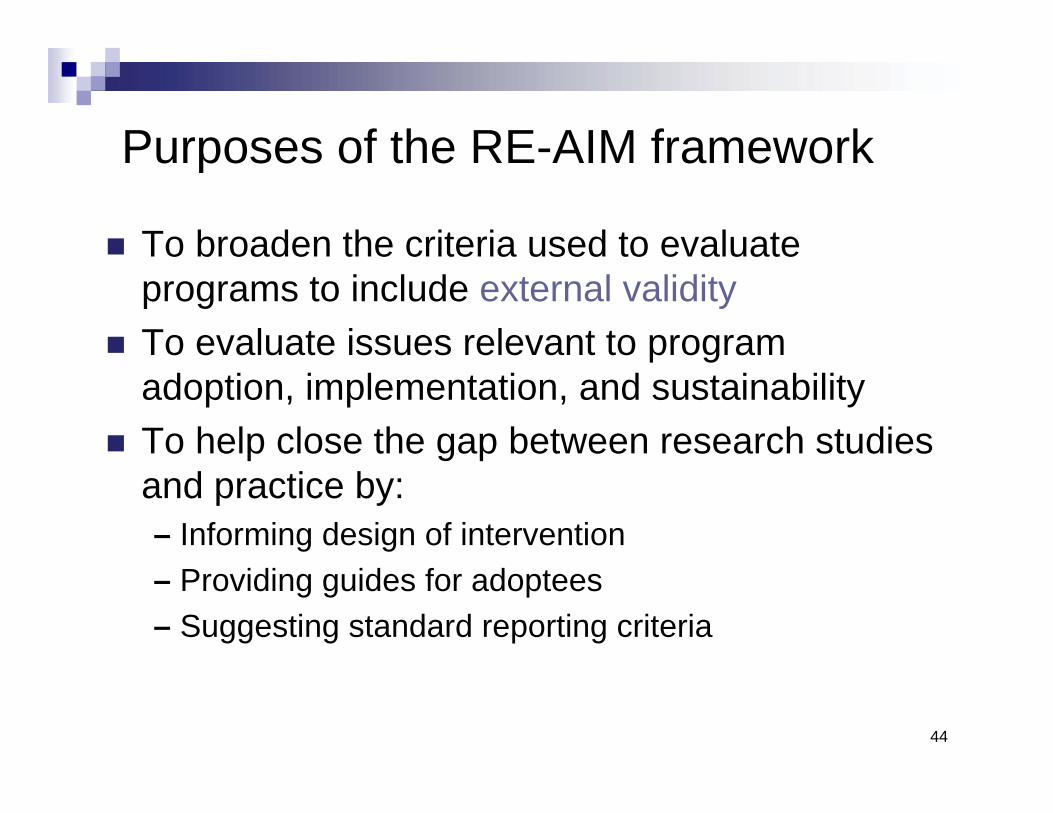
Purposes of the RE-AIM framework
To broaden the criteria used to evaluate programs to include external validityTo evaluate issues relevant to program adoption, implementation, and sustainabilityTo help close the gap between research studies and practice by:– Informing design of intervention– Providing guides for adoptees– Suggesting standard reporting criteria
45
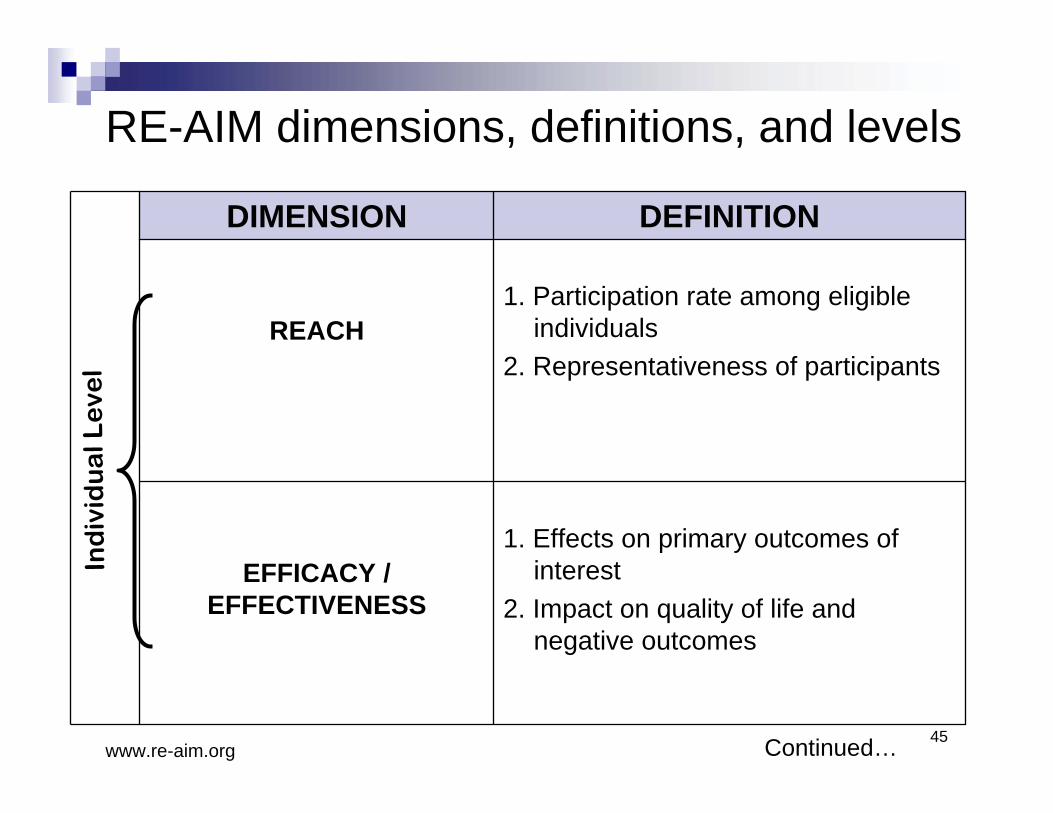
1. Effects on primary outcomes of interest
2. Impact on quality of life and negative outcomes
EFFICACY / EFFECTIVENESS
1. Participation rate among eligible individuals
2. Representativeness of participantsREACH
DEFINITIONDIMENSION
Ind
ivid
ua
l Le
vel
www.re-aim.org
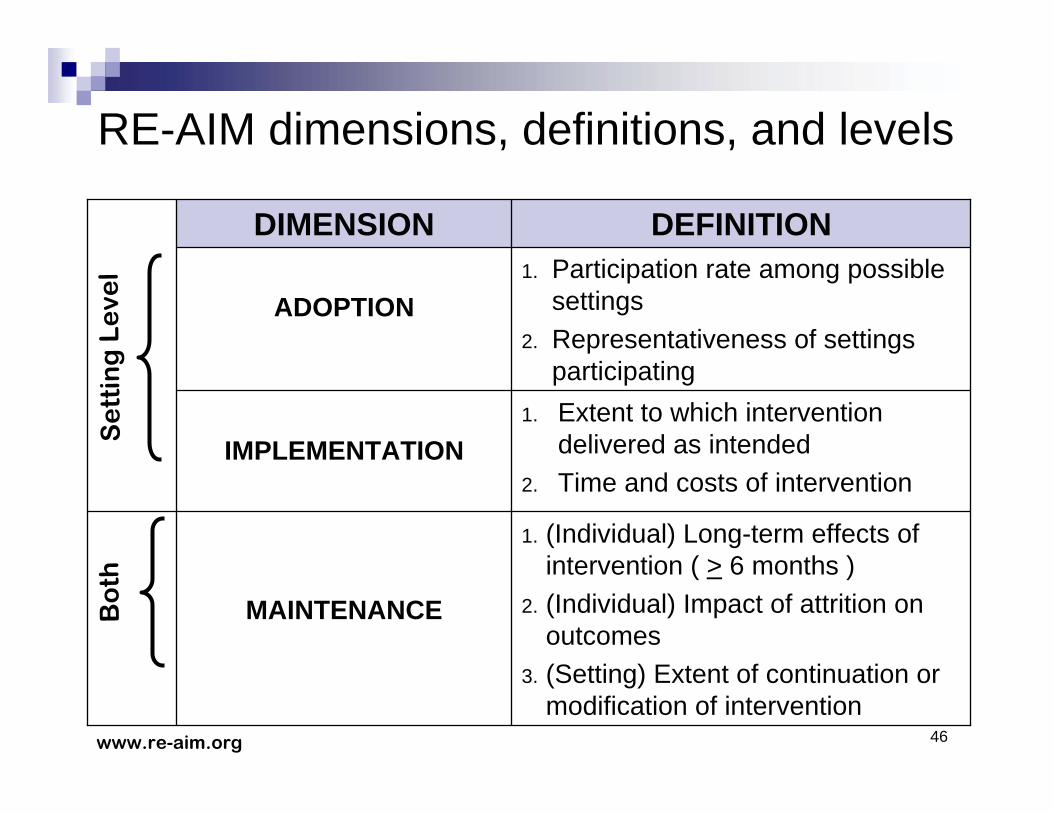
RE-AIM dimensions, definitions, and levels
Continued…
46
1. Extent to which intervention delivered as intended
2. Time and costs of interventionIMPLEMENTATION
1. (Individual) Long-term effects of intervention ( > 6 months )
2. (Individual) Impact of attrition on outcomes
3. (Setting) Extent of continuation or modification of intervention
MAINTENANCE
1. Participation rate among possible settings
2. Representativeness of settings participating
ADOPTION
DEFINITIONDIMENSION
Se
ttin
g L
eve
lB
oth
www.re-aim.org
RE-AIM dimensions, definitions, and levels
47
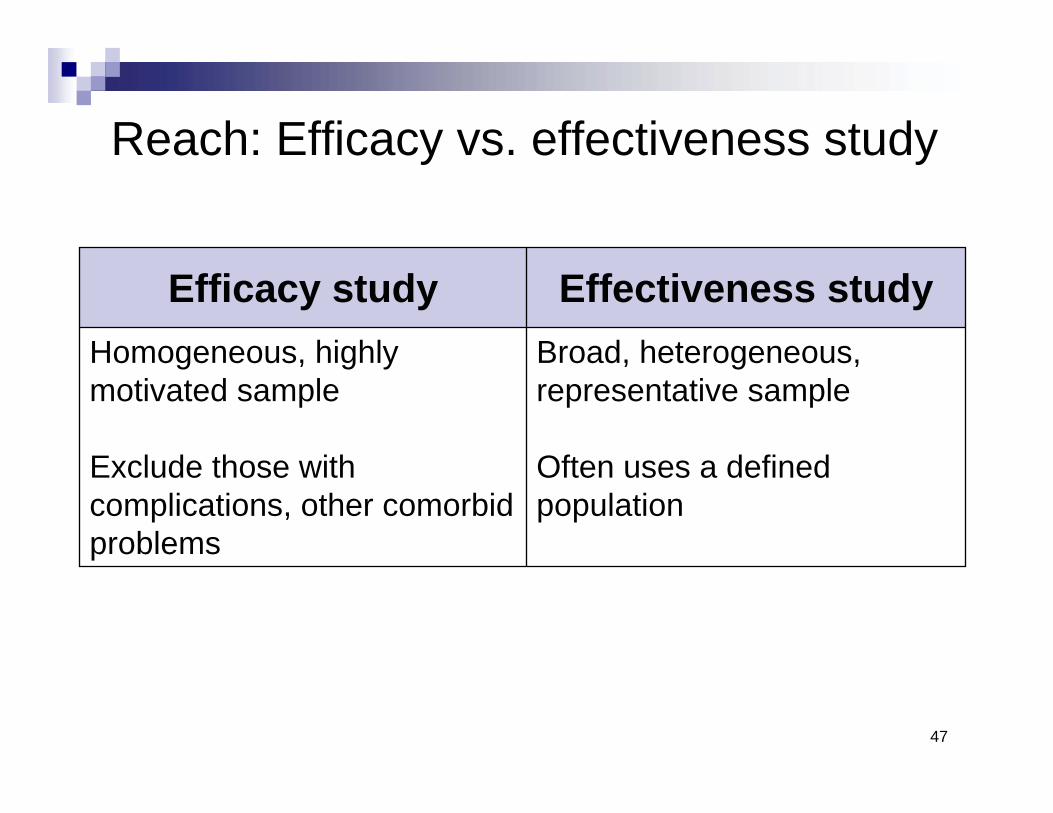
Reach: Efficacy vs. effectiveness study
Broad, heterogeneous, representative sample
Often uses a defined population
Homogeneous, highly motivated sample
Exclude those with complications, other comorbid problems
Effectiveness studyEfficacy study

48
Adoption: Efficacy vs. effectiveness
Appeals to and works in multiple settings
Adaptability to fit setting
Usually one setting to reduce variability
Settings with many resources and expert staff
Effectiveness studyEfficacy study
49
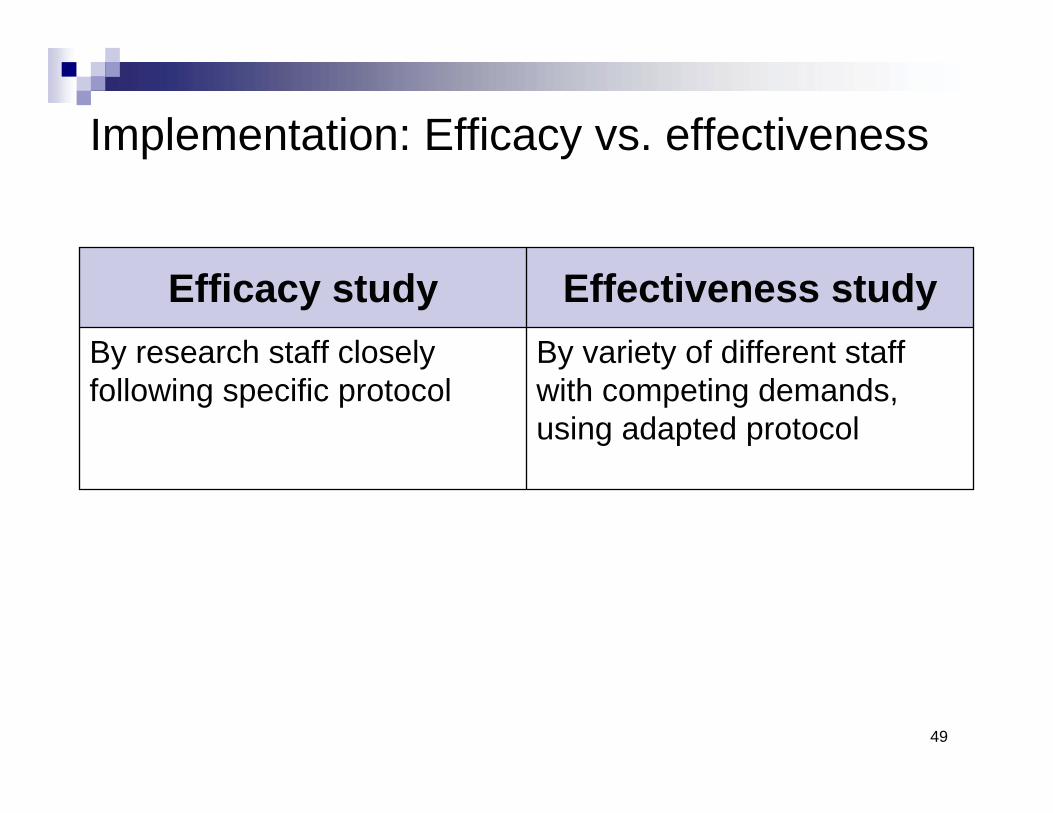
Implementation: Efficacy vs. effectiveness
By variety of different staff with competing demands, using adapted protocol
By research staff closely following specific protocol
Effectiveness studyEfficacy study
50
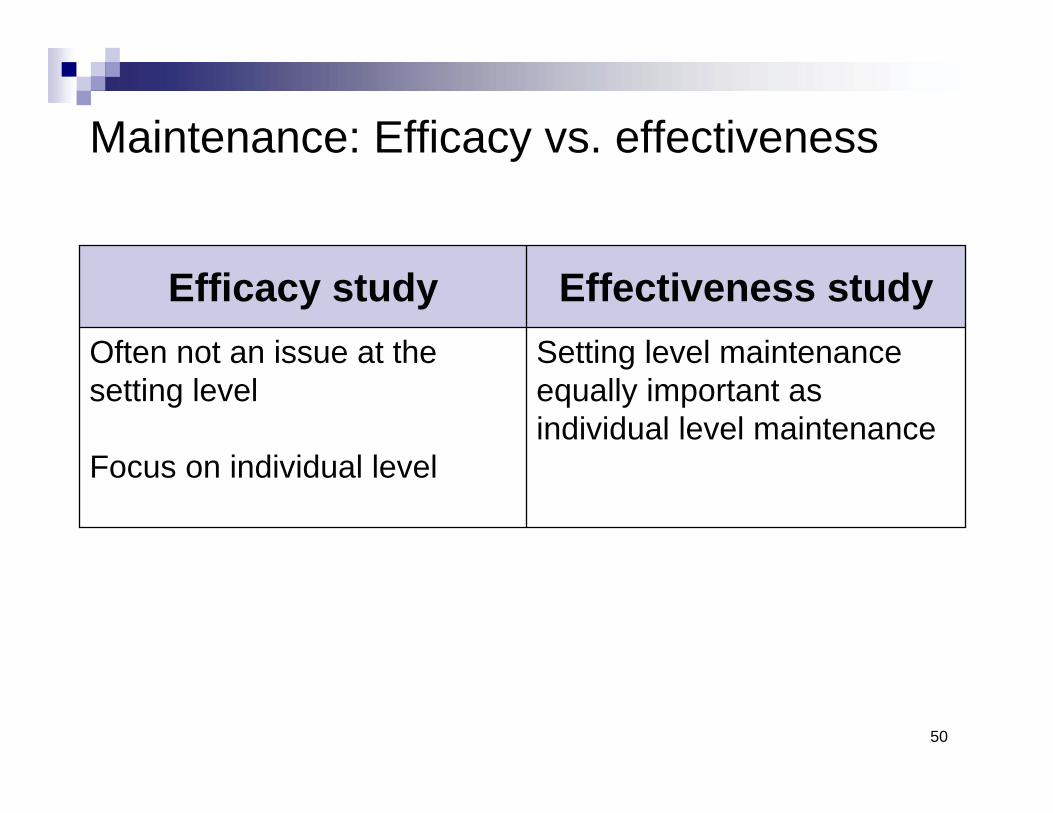
Maintenance: Efficacy vs. effectiveness
Setting level maintenance equally important as individual level maintenance
Often not an issue at the setting level
Focus on individual level
Effectiveness studyEfficacy study
51
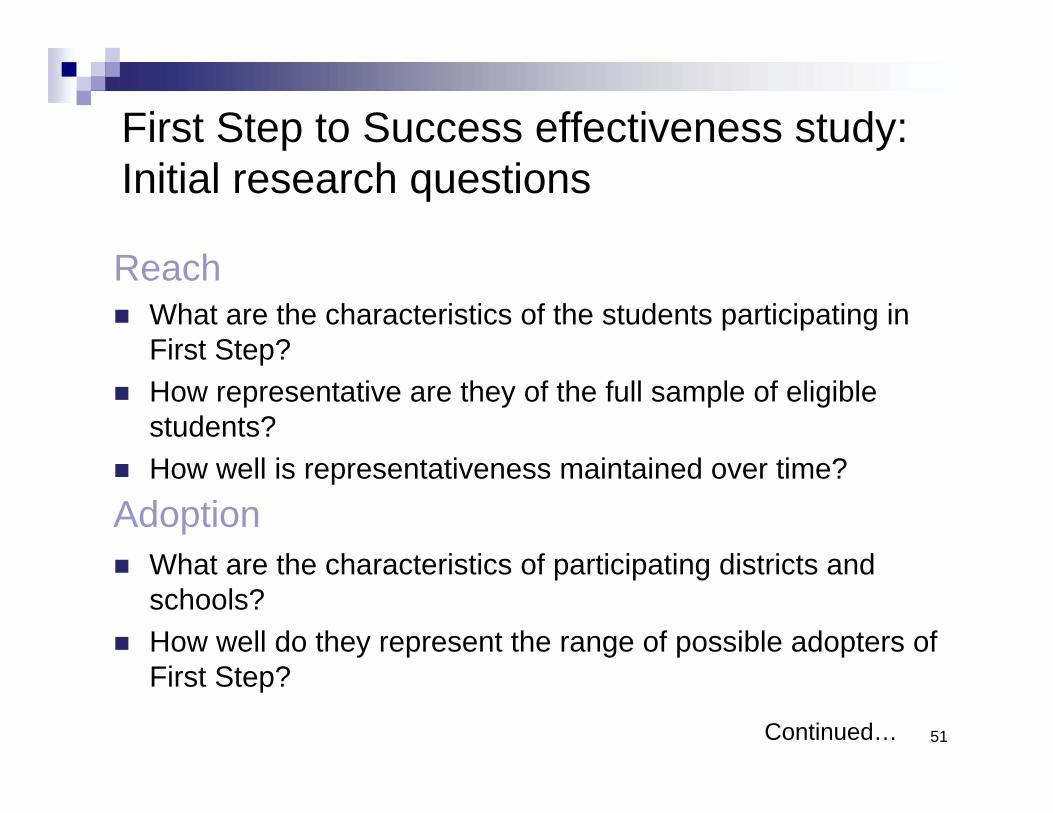
First Step to Success effectiveness study:Initial research questions
Continued…
ReachWhat are the characteristics of the students participating in First Step?How representative are they of the full sample of eligible students?How well is representativeness maintained over time?
AdoptionWhat are the characteristics of participating districts and schools?How well do they represent the range of possible adopters of First Step?

52
First Step to Success effectiveness study:Initial research questions
ImplementationWhat is the level of implementation fidelity (adherence, quality, intensity) of First Step?
How does it differ between teachers and schools?
What are the incremental costs of implementing First Step?
What is the level of social validity ascribed to First Step by participating teachers and parents?
Continued…

53
First Step to Success Effectiveness Study:Core research questions
Continued…
EffectivenessTo what extent does First Step improve the behavior at school and the academic performance and participation of students with severe behavior problems?
For what kinds of students does First Step work best and less well?
In what contexts (classroom and school level) does First Step work best and less well?
How do variations in effectiveness relate to variations in implementation fidelity?
54
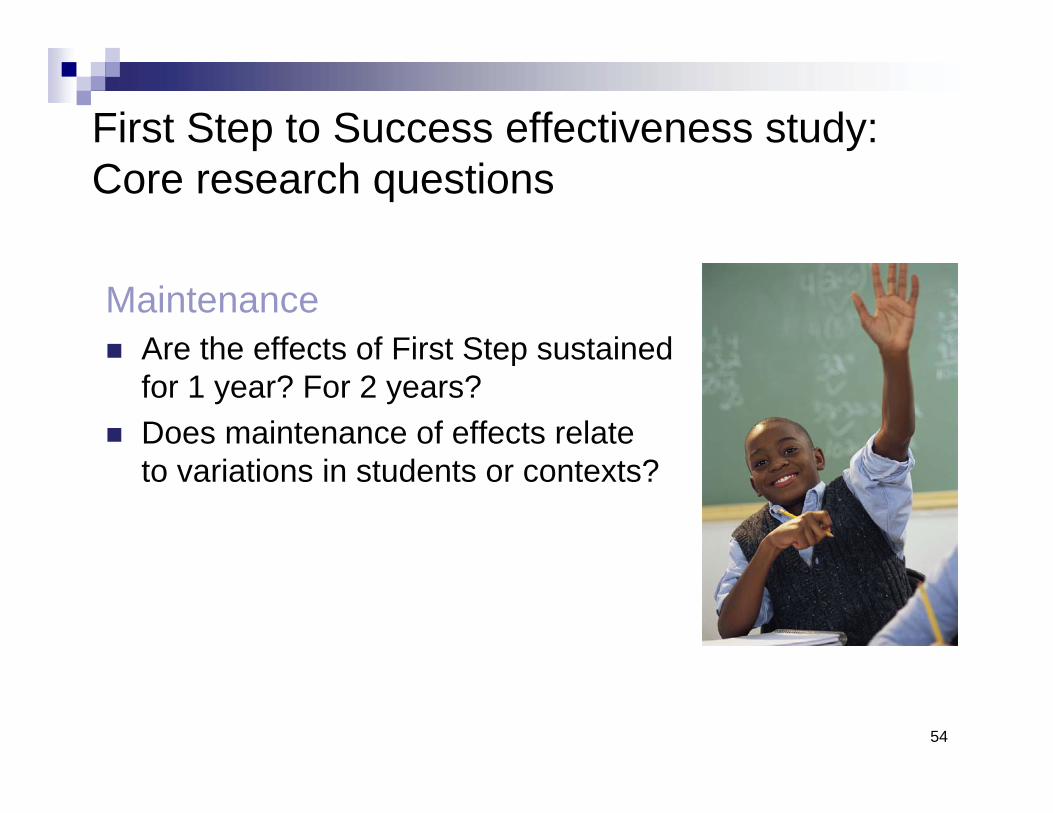
First Step to Success effectiveness study:Core research questions
MaintenanceAre the effects of First Step sustained for 1 year? For 2 years?Does maintenance of effects relate to variations in students or contexts?
National Effectiveness Study of First Step to Success
W. Carl Sumi, Ph.D.SRI International

56
National Effectiveness Study of First Step to Success: IntroductionGoal 4 grant from the U.S. Department of Education, Institute of Education Sciences, National Center for Special Education Research
Well-developed evidence base for the efficacy of First Step
– “Manualized” off-the-shelf intervention
– Solid evaluation framework
Randomized control trial in 48 schools in 5 diverse elementary school districts across the country
Evaluators (SRI) independent of program developers (ORI)
57
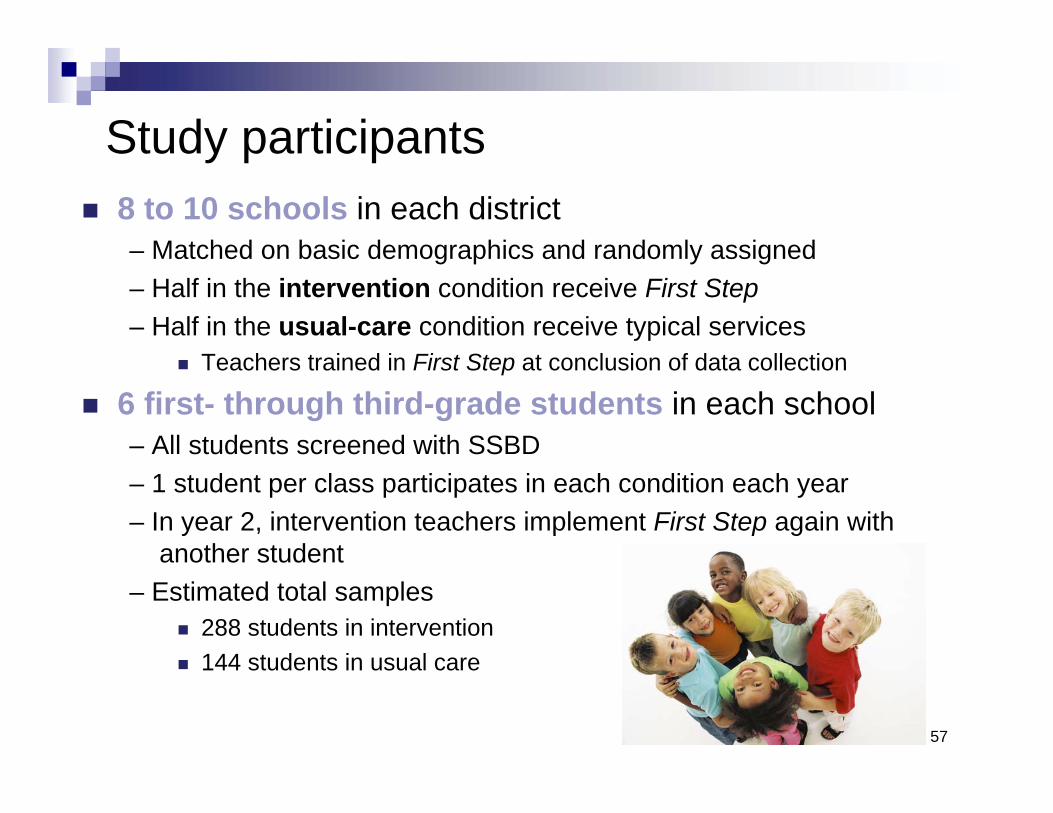
Study participants8 to 10 schools in each district– Matched on basic demographics and randomly assigned– Half in the intervention condition receive First Step– Half in the usual-care condition receive typical services
Teachers trained in First Step at conclusion of data collection
6 first- through third-grade students in each school– All students screened with SSBD– 1 student per class participates in each condition each year– In year 2, intervention teachers implement First Step again with
another student– Estimated total samples
288 students in intervention144 students in usual care

58
Collaborating with schools
Participating schools:Allow teachers to participate in the study– Are reimbursed $200 for substitutes so participants
can attend 1-day trainingInform all parents of children in selected classrooms about class-wide screeningIdentify behavior coaches (intervention schools only)
59
Collaborating with teachers
All participating teachers:Conduct the class-wide screeningHelp evaluators obtain parental consentComplete a questionnaire and a behavior checklist for each participant – Receive $25 stipend for each completed questionnaire
Allow classroom and student observationsAllow administration of a brief reading assessment of each participant
Continued…

60
Collaborating with teachers
Intervention teachers:Attend a 1-day training – Receive $150 stipend
Allow behavior coach to work with student and to provide consultation as neededImplement CLASS component starting on day 6

61
Collaborating with parents
All participating parents:Consent to participate in the studyComplete a behavior rating scale– Receive $10 for each
completed questionnaire
Intervention parents:Meet weekly (for 45 minutes) with behavior coach for 6 weeksImplement First Step at homeComplete a satisfaction survey

62
Collaborating with behavior coachesBehavior coaches:
Attend 2-day training– Receive $600 stipend for each
participating familyWork 1:1 with student – Establish reward program – Teach, model, and role-play appropriate skills
Work with classroom peers– Explain and reinforce program with entire class – Implement and monitor program for the first 5 days
Implement homeBase component with family

63
Sample selection criteria
Students begin intervention in grades 1 through 3.Teachers rate students using a standardized screening instrument and procedure.–Systematic Screening for Behavior Disorders (SSBD).–Teachers complete Gates 1 and 2.–Students with highest SSBD score are asked to
participate.If consent is not obtained for that student, student with next highest ranking is recruited.

64
Student-level informationStudent Enrollment SurveyBasic demographics (gender, ethnicity, primary
language, free or reduced-price lunch status)Student Record SurveySchool records information:
IEP/504 Plan status Instructional settings (i.e., percentage of instructional time in general education classes)AbsencesOffice Discipline Referrals (ODRs)
Continued…
65
Student-level assessmentsSocial Skills Rating System (SSRS) –Teacher and Parent versions– Social skills, problem behaviors, and academic
competenceWoodcock-Johnson III Letter-Word Identification Subtest– Reading skills
Oral Reading Fluency (ORF)– Ability to read aloud expressively
Academic Engaged Time (AET)– Active engagement in relevant academic material over
two 15-minute observations
66
Classroom-level informationClassroom Atmosphere Rating Scale (CARS)– 30-minute observation of intervention classrooms (e.g.,
student compliance, cooperation, problem solving)Classroom / Teacher Survey– Classroom characteristics (e.g., student enrollment)– Teacher characteristics (e.g., years experience,
degrees)– Teacher support (e.g., training, classroom aides)– Teacher self-reported skills to work with students with
behavior problems
67
School-level information
School Characteristics Survey– Student characteristics (e.g., mobility rate)
– School climate (e.g., total number of ODRs)
– Staff and program resources (e.g., number of FTEs)
NCES Common Core of Data (CCD)– Extracted data describing participating schools and
districts (e.g., enrollment, teacher/student ratio)

68
Implementation measures
Fidelity– Integrity of program (monitored three times throughout
intervention for each participant)Social validity (teacher’s perspective)– Acceptability–General support for intervention– Positive effects–for participating student(s) and
classroomAlliance– Strength of the relationship between coach and teacher

69
Study timeline
• Screening: SSBD• Baseline: WJIII, ORF, AET, SSRS, Student Record Survey,
Teacher Survey, CARS, School Survey• Posttest: WJIII, ORF, AET, SSRS, Satisfaction (parent),
Social Validity, Alliance• Follow-up: WJIII, ORF, AET, SSRS, Student Record Survey,
Teacher Survey, CARS, School Survey
Screen/baseline Posttest Follow-up 1 Follow-up 2
~10 weeks 1 year 1 year
Intervention

70
Data collection processes
Each study location has:– Site Coordinator– Research Assistants to collect the data
All procedures and data collection forms are standardized across sites
ORI provides technical assistance on First Step– “Off the shelf” approach–participants receive support
when requested as provided in typical implementation
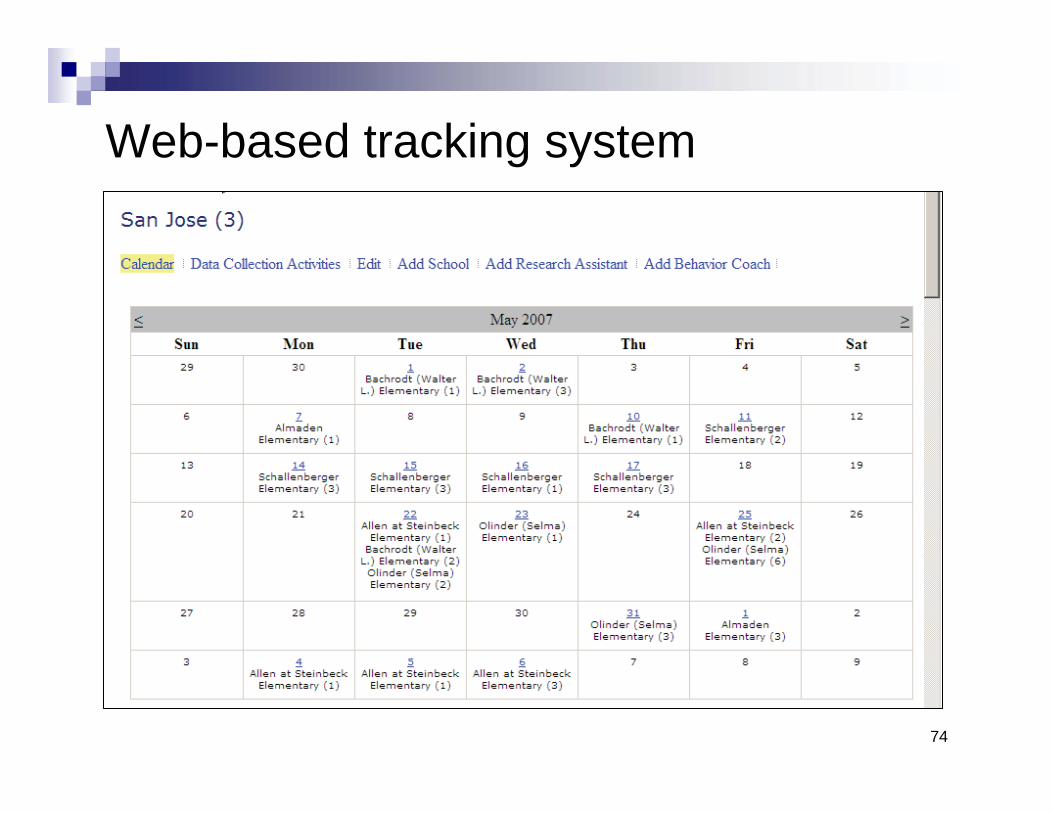
SRI provides a web-based data collection and scheduling system

71
Web-based tracking system
Continued…

72
Web-based tracking system
Continued…

73
Web-based tracking system
Continued…
74
Web-based tracking system

75
ChallengesManaging local research teams at study sites– Hiring, supporting, and supervising Site Coordinators and
Research Assistants remotely– Coordination and communication between multiple sites
Motivation to implement First Step program – Value of “free” program versus district investment
Sustainability– Goal to build capacity to implement
First Step after grant concludes– District/school staff for behavior coaches

76
Next steps
2007-08 school year– Starting year 2 in two sites (20 schools participating)– Starting year 1 in three remaining sites
To date, about 100 children participating– Preliminary baseline data show no differences between
intervention and comparison groups on key baseline data (e.g., WJIII, ORF, AET)
Data collection concludes in 2010-2011 school year